April 1, 2007+ POST-PANEL draft for ECONOMIC POLICY 16,100 words + 5 figures & 8 tables . Assessing China’s Exchange Rate Regime Jeffrey A. Frankel and Shang-Jin Wei Harvard University and National Bureau of Economic Research This paper was prepared for the 44th Panel Meeting of Economic Policy, February 12, 2007. The authors would like to thank Yuanyuan Chen, Ellis Connolly and Chang Hong for outstanding research assistance; and to thank also for comments Jahangir Aziz, Morris Goldstein, Jianxiong He, Yun Jung Kim, , Sunyoung Lee, Katharine Moon, Nouriel Roubini and John Williamson.. Frankel would also like to thank the Mossavar-Rahmani Center for Business and Government for support and to thank a number of officials in the Clinton and (current) Bush Treasury Departments, at all levels, for discussion regarding the biannual reports to Congress. Neither they, nor any institutions with which the authors are associated, bear any responsibility for any views expressed in this paper, which are those of the authors alone. Abstract The IMF Articles of Agreement forbid a country from manipulating its currency for unfair advantage. The US Treasury has been legally required since 1988 to report to Congress biannually regarding whether individual trading partners are guilty of manipulation. One part of this paper tests econometrically two competing sets of hypothesized determinants of the Treasury decisions: (1) legitimate economic variables consistent with the IMF definition of manipulation – the partners’ overall current account/GDP, its reserve changes, and the real overvaluation of its currency, and (2) variables suggestive of domestic American political expediency -- the bilateral trade balance, US unemployment, and an election year dummy. The econometric results suggest that the Treasury verdicts are driven heavily by the US bilateral deficit, though other variables also turn out to be quite important. In 2005 China announced a switch to a new exchange rate regime. The exchange rate would be set with reference to a basket of other currencies, with numerical weights unannounced, allowing a movement of up to+/- .3% within any given day. Although this step was originally accepted at face value in public policy circles, skepticism is in order. The second econometric part of the paper evaluates what exchange rate regime China has actually been following We use the technique introduced by Frankel and Wei (1994): one regresses changes in the value of the local currency, in this case the RMB, against changes in the values of the dollar, euro, yen, and other currencies that may be in the basket. We find that within 2005, the de facto regime remained a peg to a basket that put virtually all weight on the dollar. Subsequently there has been a modest but steady increase in flexibility with some weight shifted to a few non-dollar currencies - but not those one might expect. In any case, the weight on the dollar was still fairly heavy in 2006. The paper tests whether the decline in the implicit weight on the dollar is related to the pressure from US officials. It also considers whether the increase in flexibility that we have seen, small though it is, has been gradually accelerating, at a rate that would suggest the likelihood of some genuine flexibility in the not- so-distant future.
Transcript
April 1, 2007+ POST-PANEL draft for ECONOMIC POLICY
16,100 words + 5 figures & 8 tables .
Assessing China’s Exchange Rate Regime
Jeffrey A. Frankel and Shang-Jin Wei Harvard University and National Bureau of Economic Research
This paper was prepared for the 44th Panel Meeting of Economic Policy, February 12, 2007. The
authors would like to thank Yuanyuan Chen, Ellis Connolly and Chang Hong for outstanding research assistance; and to thank also for comments Jahangir Aziz, Morris Goldstein, Jianxiong He, Yun Jung Kim, , Sunyoung Lee, Katharine Moon, Nouriel Roubini and John Williamson.. Frankel would also like to thank the Mossavar-Rahmani Center for Business and Government for support and to thank a number of officials in the Clinton and (current) Bush Treasury Departments, at all levels, for discussion regarding the biannual reports to Congress. Neither they, nor any institutions with which the authors are associated, bear any responsibility for any views expressed in this paper, which are those of the authors alone.
Abstract
The IMF Articles of Agreement forbid a country from manipulating its currency for unfair advantage. The US Treasury has been legally required since 1988 to report to Congress biannually regarding whether individual trading partners are guilty of manipulation. One part of this paper tests econometrically two competing sets of hypothesized determinants of the Treasury decisions: (1) legitimate economic variables consistent with the IMF definition of manipulation – the partners’ overall current account/GDP, its reserve changes, and the real overvaluation of its currency, and (2) variables suggestive of domestic American political expediency -- the bilateral trade balance, US unemployment, and an election year dummy. The econometric results suggest that the Treasury verdicts are driven heavily by the US bilateral deficit, though other variables also turn out to be quite important. In 2005 China announced a switch to a new exchange rate regime. The exchange rate would be set with reference to a basket of other currencies, with numerical weights unannounced, allowing a movement of up to+/- .3% within any given day. Although this step was originally accepted at face value in public policy circles, skepticism is in order. The second econometric part of the paper evaluates what exchange rate regime China has actually been following We use the technique introduced by Frankel and Wei (1994): one regresses changes in the value of the local currency, in this case the RMB, against changes in the values of the dollar, euro, yen, and other currencies that may be in the basket. We find that within 2005, the de facto regime remained a peg to a basket that put virtually all weight on the dollar. Subsequently there has been a modest but steady increase in flexibility with some weight shifted to a few non-dollar currencies - but not those one might expect. In any case, the weight on the dollar was still fairly heavy in 2006. The paper tests whether the decline in the implicit weight on the dollar is related to the pressure from US officials. It also considers whether the increase in flexibility that we have seen, small though it is, has been gradually accelerating, at a rate that would suggest the likelihood of some genuine flexibility in the not-so-distant future.
2
1. INTRODUCTION
The issue of the regime governing the Chinese exchange rate -- and specifically whether the currency is moving away from the de facto peg that for ten years had tied it to the US dollar -- is much more than just another application, to a particular country, of the long-time question of fixed versus floating exchange rates. It is a key global monetary issue. It bears directly on China’s surpluses in the current account and in the overall balance of payments, which are major counterparts to US deficits. The question even bears more broadly on what may well become one of the key issues of international political economy in the 21st century, perhaps the primary such issue: the rise of China and its likely long-run challenge to the global hegemony of the United States.
Exchange rate regimes in emerging markets have been a primary concern of international economists and policy-makers since the 1990s cycle of record capital flows to these countries followed by widespread crises. Most emerging market countries switched to more flexible exchange rate regimes in that episode. China is by far the largest developing country to continue to cling to a currency peg even after the Argentine and Turkish crises of 2001. That may have something to do with the fact that the peg appears to have served China well. The country was one of the few in Asia not to succumb to the crises of 1997-98. Indeed, it was praised by the United States and others at the time for not letting its currency devalue. The Chinese currency, known both as the yuan and the Renminbi (“People’s currency”), stayed fixed against the dollar into the new phase of global capital inflows to emerging markets that began around 2003.
It is another angle, however, that gives global importance to the issue of the yuan-dollar exchange rate. The attention of policy-makers and researchers in international economics in the current decade has switched to the large and rising deficits that the United States is running in its current account and overall balance of payments. The emerging markets have by now grown so large that they are major players in the world economy. This is particularly true of China, which is on track to surpass Germany around 2008 as the world’s third largest economy, even if GDP is evaluated at current exchange rates. China’s importance in net international financial flows is even greater. The counterparts to those rising US external deficits are surpluses among Asian countries and major oil producers – rather than in Europe, as in the 1960s. Of these surplus countries, China has received by far the most attention.
There is a rapidly growing literature on the positive question of what are the causes of the Chinese surpluses and US deficits, as well as on the normative question of whether China should move to a more flexible exchange rate, either in its own interest, or in the interest of others, or both. The present paper does not deal with these issues. For what it is worth, we, like many others, come down on the side that China should increase its exchange rate flexibility in its own interest, but that the US deficits should not be blamed on China.
The present paper deals, instead, with two questions that, while perhaps appearing narrow and technical, lie at the heart of the debate. First, do the bi-annual US Treasury reports to Congress base their findings with regard to whether China and other trading
3
partners are “manipulating” their currencies on “manipulation” in the sense of the IMF Articles of Agreement? Or, rather, on criteria that come from domestic American politics? Second, is the precise exchange rate regime that China has put into place since 2005 a genuine departure from the earlier dollar peg, in the direction of flexibility? Is it a basket peg with the genuine possibility of cumulatable daily appreciations, as was announced at the time?
The question of US findings regarding manipulation and the question of the nature of the current Chinese regime are directly connected. The connections run in both directions. Going from the first question to the second, the US political pressure has been fairly intense, and may have been an important factor behind the 2005 announcement of a change in policy, notwithstanding attempts by China’s leaders to avoid the appearance of being swayed by the US push. In the paper, we test if there are timing connections between US political rhetoric and Chinese steps toward flexibility. Going in the opposite direction, if China has not in fact changed its de facto pegging policy, as it has its official policy, such a finding might provide ammunition for a renewed US campaign, particularly in the form of threatened Congressional legislation. If, on the other hand, the change in regime was genuine, perhaps the RMB/dollar problem is being solved, with no need for further outside intervention.
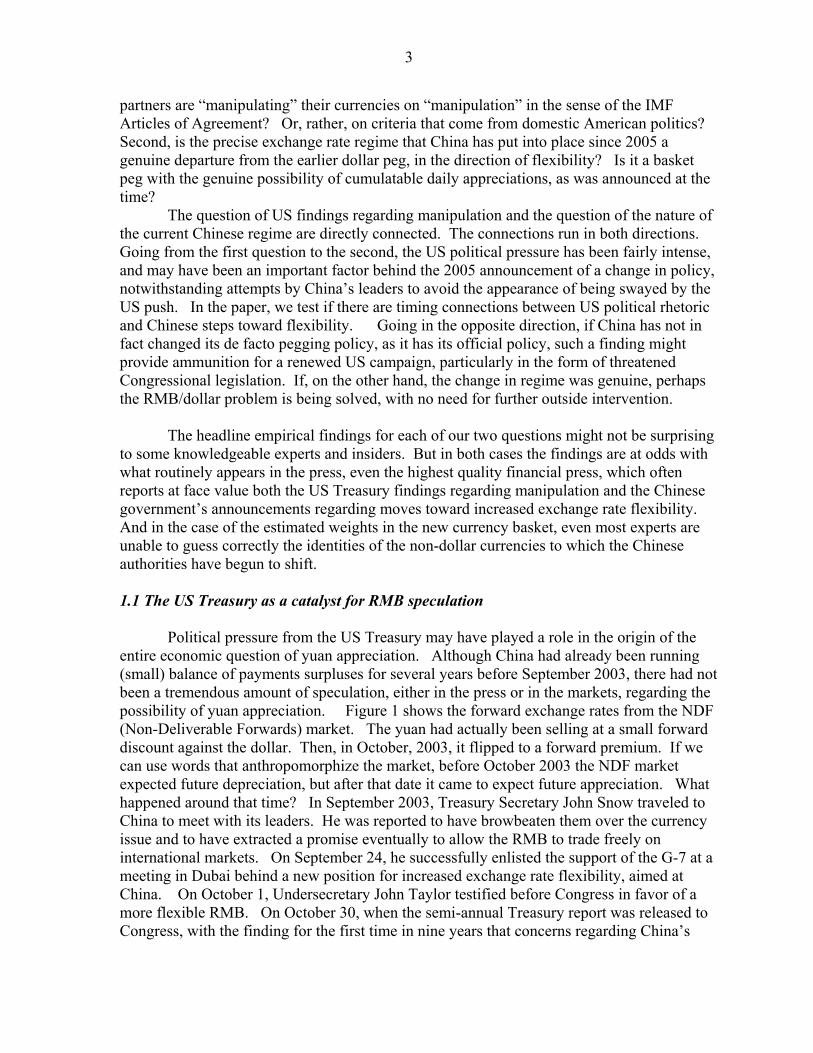
The headline empirical findings for each of our two questions might not be surprising to some knowledgeable experts and insiders. But in both cases the findings are at odds with what routinely appears in the press, even the highest quality financial press, which often reports at face value both the US Treasury findings regarding manipulation and the Chinese government’s announcements regarding moves toward increased exchange rate flexibility. And in the case of the estimated weights in the new currency basket, even most experts are unable to guess correctly the identities of the non-dollar currencies to which the Chinese authorities have begun to shift. 1.1 The US Treasury as a catalyst for RMB speculation Political pressure from the US Treasury may have played a role in the origin of the entire economic question of yuan appreciation. Although China had already been running (small) balance of payments surpluses for several years before September 2003, there had not been a tremendous amount of speculation, either in the press or in the markets, regarding the possibility of yuan appreciation. Figure 1 shows the forward exchange rates from the NDF (Non-Deliverable Forwards) market. The yuan had actually been selling at a small forward discount against the dollar. Then, in October, 2003, it flipped to a forward premium. If we can use words that anthropomorphize the market, before October 2003 the NDF market expected future depreciation, but after that date it came to expect future appreciation. What happened around that time? In September 2003, Treasury Secretary John Snow traveled to China to meet with its leaders. He was reported to have browbeaten them over the currency issue and to have extracted a promise eventually to allow the RMB to trade freely on international markets. On September 24, he successfully enlisted the support of the G-7 at a meeting in Dubai behind a new position for increased exchange rate flexibility, aimed at China. On October 1, Undersecretary John Taylor testified before Congress in favor of a more flexible RMB. On October 30, when the semi-annual Treasury report was released to Congress, with the finding for the first time in nine years that concerns regarding China’s
4
currency merited bilateral negotiations, Secretary John Snow’s accompanying testimony repeated “China now has an opportunity to show leadership on the important global issue of exchange rate flexibility." In short, the timing is right to implicate the US Treasury in the flipped sign that appears in Figure 1. Figure 1: Prices of Non Deliverable Forwards (NDFs)
7.6
7.8
88.
28.
4
04/07/03 10/15/03 12/31/04 07/22/05 01/08/07date
spot 1-month3-month 12-month
Spot and Forward Rates of USD/RMB
The forward premium started out small, but widened substantially in 2004. By July 2005, the one-year forward rate had moved to 8 yuan per dollar – representing a 3 per cent forecasted revaluation that was in fact soon realized. The rate of accumulation of reserves by the People’s Bank of China, i.e., the balance of payments surplus, accelerated thereafter, without a concomitant rise in the trade balance or in foreign direct investment. In other words, much of the increase in the BOP surpluses is explained by inflows of (unmeasured) portfolio capital including a dramatic reversal of Chinese capital flight (Prasad and Wei, 2005). The implication of the timing in Figure 1 was that the Treasury campaign may have been the catalyst for speculation that underlay these portfolio inflows – speculation regarding future appreciation.
This is not to say that the Treasury campaign was necessarily the fundamental underlying cause of the speculative capital inflows. In the first place, the opposition political party, particularly candidates in the US presidential campaign, picked up the theme of an undervalued yuan in 2004. It is reasonable to assume they would have done so even in the absence of Administration initiatives, and that the latter were indeed an attempt to
5
preempt the former. In the second place, the economic fundamentals, particularly current account surpluses in China and deficits in the United States, pointed in the direction of an eventual decline in the yuan/dollar rate and speculators would sooner or later have noticed this. Nevertheless it is interesting to “speculate” that China’s speculative inflows and soaring reserve levels, which became the world’s highest in 2006, might have been substantially more moderate were it not for the US public pressure. 1.2 Origins of the language of manipulation Article IV of the IMF Articles of Agreement deals with Obligations Concerning Exchange Arrangements. After the Members of the Fund ratified the move to floating exchange rates in the Jamaica Communique of January 1976, they agreed a framework for mutual surveillance under what is called the “1977 Decision on Surveillance over Exchange Rate Policies,” and they amended Article IV in 1978. Principle (A) of the 1977 Decision and Clause 3 of Section 1 of Article IV both require that each member shall “avoid manipulating exchange rates or the international monetary system in order to prevent effective balance of payments adjustment or to gain an unfair competitive advantage over other members.” We should realize that these were themselves politically-negotiated documents.2 In theory, the obligation is meant to fall on countries seeking to keep the values of their currencies down so as to preserve a balance of payments surplus, as much as to those seeking to keep the values of their currencies up thereby preserving a balance of payments deficit.3 In practice, however, the economic and political pressure on a surplus country to allow the value of its currency to adjust upward has always been far less than the pressure on a deficit country to allow the value of its currency to adjust downward. Many countries have been pushed into devaluing or floating downward. But since the end of the Bretton Woods system there have been few cases – and no important ones – of countries having been successfully pushed into revaluing or floating upward.
The once-obscure question of Chinese exchange rate policy is today one of the hottest topics in the world of international monetary policy issues. The United States has since 2003 been pressuring China to abandon its peg to the dollar and allow the renminbi (RMB) to appreciate, and some have claimed that China’s refusal to do so constitutes unfair manipulation of the currency for competitive advantage. The motivation evidently stems from concerns over the US trade deficit, where China is following closely in the path of scapegoat that was earlier tread by Japan and Korea. American firms that have trouble competing against China are of course a source of political pressure. The Chinese have
2 Boughton (2001, p. 68). The leitmotif over the decades in negotiations over the world monetary system is that the US has favored free-floating exchange rates and the French have opposed them. The history of the 1970s negotiations is in de Vries (1986). 3 International Monetary Fund (2006b, p. 15): “…the term ‘in order to prevent balance of payments adjustment’ is sufficiently broad to cover situations where a member is manipulating its exchange rate in a manner that makes it either overvalued or undervalued.” 5 Frankel (2006a) presents the arguments, and gives references to other recent writings. In its Article IV consultation of October 2006, the International Monetary Fund took the position that the RMB was undervalued as well.
6
largely resisted the pressure to appreciate, even though many economists think an abandonment of the peg may be in their own interest.5
The meaning of the word “manipulation” is open to dispute, since it plays no role in economic theory. The 1977 Decision refers to the intent behind the actions of the authorities. Some claim that a country that has in the past made the decision to fix its exchange rate cannot now be accused of manipulation. No deliberate action has been taken. Etymologically, the root of the word is the Latin for “hand,” which suggests active steps rather than a passive acceptance of developments. In this view, if a country opts to peg, it cannot be accused of manipulation. This is so even when future developments leave the currency “undervalued,” whether because such factors as the Balassa-Samuelson effect or low inflation have rendered a once-appropriate exchange rate level no longer appropriate, or because the anchor currency, in this case the dollar, has in the meantime depreciated against other relevant currencies. A fixed exchange rate is a legitimate choice for any country under Article IV. It is pointed out that smaller countries with long-time fixed exchange rates, say the Cote d’Ivoire, would never be accused of manipulation.
Some, on the other side, claim that China’s decision to cling to a peg when the currency could as easily be allowed to appreciate is a deliberate choice with the intent to gain competitive advantage on world markets, and that it frustrates balance of payments adjustment, with adverse effects on the rest of the world (e.g., Goldstein, 2003, 2004, 2007; and Goldstein and Lardy, 2003, 2005). They point out that “protracted large-scale intervention in one direction in the exchange market” is one of the criteria the 1977 Decision specifies the Fund shall consider “as among those which might indicate the need for discussion” with a member over its exchange rate policy.
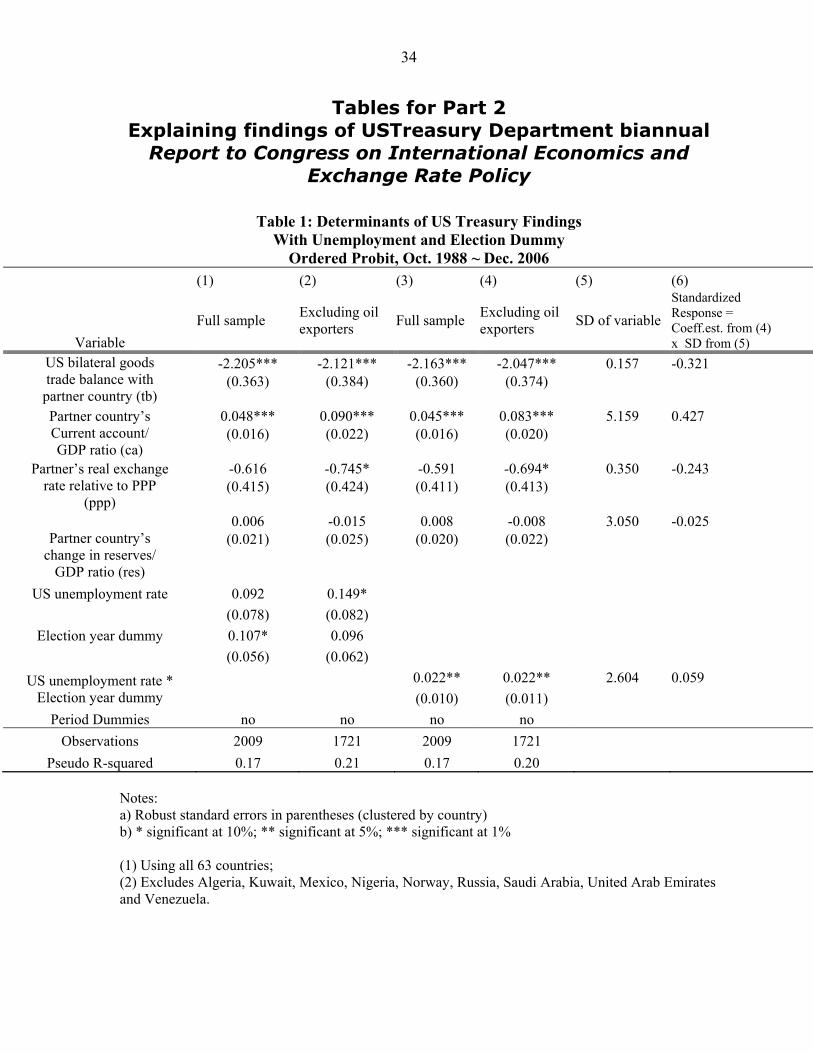
Although the US Treasury must report to Congress biannually regarding whether individual trading partners are manipulating currencies for unfair advantage, it has resisted Congressional pressure to name China as an outright currency manipulator. Part 2 of this paper tests econometrically two competing hypotheses regarding the determinants of the Treasury decisions. The first hypothesis is that the determinants are legitimate economic variables. The second hypothesis is that the determinants are variables suggestive of domestic American political expediency. The econometric results suggest that the Treasury verdicts are driven heavily by the US bilateral deficit with the country in question, though some of the other legitimate variables also turn out to be quite important. Partly as a result, China runs a relatively high danger of being named a manipulator.
An interesting question in international law arises. On the one hand, the US Congress did legally mandate that the bilateral balance should be an important consideration. On the other hand, the bilateral balance does not appear as a criterion in the 1977 Decision or Article IV of the International Monetary Fund, the original source of the “manipulation” language. The Fund, rather, emphasizes instead the factors described as “legitimate economic
7
variables” under (1) above. We shall return at the end to the potential importance of manipulation definitions that diverge between the United States and the Fund. 1.2 The new regime
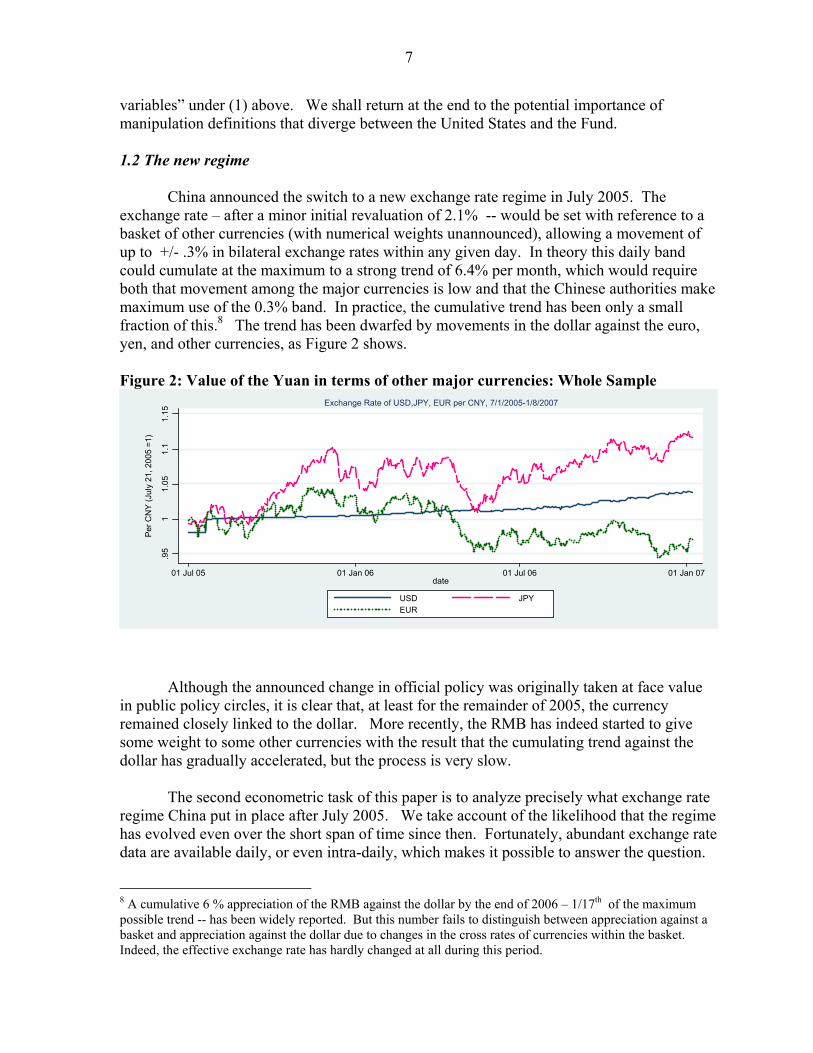
China announced the switch to a new exchange rate regime in July 2005. The exchange rate – after a minor initial revaluation of 2.1% -- would be set with reference to a basket of other currencies (with numerical weights unannounced), allowing a movement of up to +/- .3% in bilateral exchange rates within any given day. In theory this daily band could cumulate at the maximum to a strong trend of 6.4% per month, which would require both that movement among the major currencies is low and that the Chinese authorities make maximum use of the 0.3% band. In practice, the cumulative trend has been only a small fraction of this.8 The trend has been dwarfed by movements in the dollar against the euro, yen, and other currencies, as Figure 2 shows. Figure 2: Value of the Yuan in terms of other major currencies: Whole Sample
.95
11.
051.
11.
15
Per C
NY
(Jul
y 21
, 200
5 =1
)
01 Jul 05 01 Jan 06 01 Jul 06 01 Jan 07date
USD JPYEUR
Exchange Rate of USD,JPY, EUR per CNY, 7/1/2005-1/8/2007
Although the announced change in official policy was originally taken at face value in public policy circles, it is clear that, at least for the remainder of 2005, the currency remained closely linked to the dollar. More recently, the RMB has indeed started to give some weight to some other currencies with the result that the cumulating trend against the dollar has gradually accelerated, but the process is very slow.
The second econometric task of this paper is to analyze precisely what exchange rate
regime China put in place after July 2005. We take account of the likelihood that the regime has evolved even over the short span of time since then. Fortunately, abundant exchange rate data are available daily, or even intra-daily, which makes it possible to answer the question.
8 A cumulative 6 % appreciation of the RMB against the dollar by the end of 2006 – 1/17th of the maximum possible trend -- has been widely reported. But this number fails to distinguish between appreciation against a basket and appreciation against the dollar due to changes in the cross rates of currencies within the basket. Indeed, the effective exchange rate has hardly changed at all during this period.
8
The basic approach uses the technique introduced by Frankel and Wei (1994): one regresses changes in the value of the local currency, in this case the RMB, against changes in the values of the dollar, euro, yen, and other currencies that are candidate constituents of the basket. If China is following a perfect basket peg, it should be easy to recover precise estimates of the weights. The fit should be perfect, an extreme rarity in econometrics: the standard error of the regression should be zero, and R2 = 100%. Far more likely, the basket peg is not perfect, but one can still expect to estimate the weights with fairly tight standard errors. The real questions are how wide the band is, how great is the estimated weight on non-dollar currencies, and how strong is the trend term.
2. DOES THE US TREASURY BASE DETERMINATION OF MANIPULATION ON VALID ECONOMICS OR POLITICAL EXPEDIENCY?
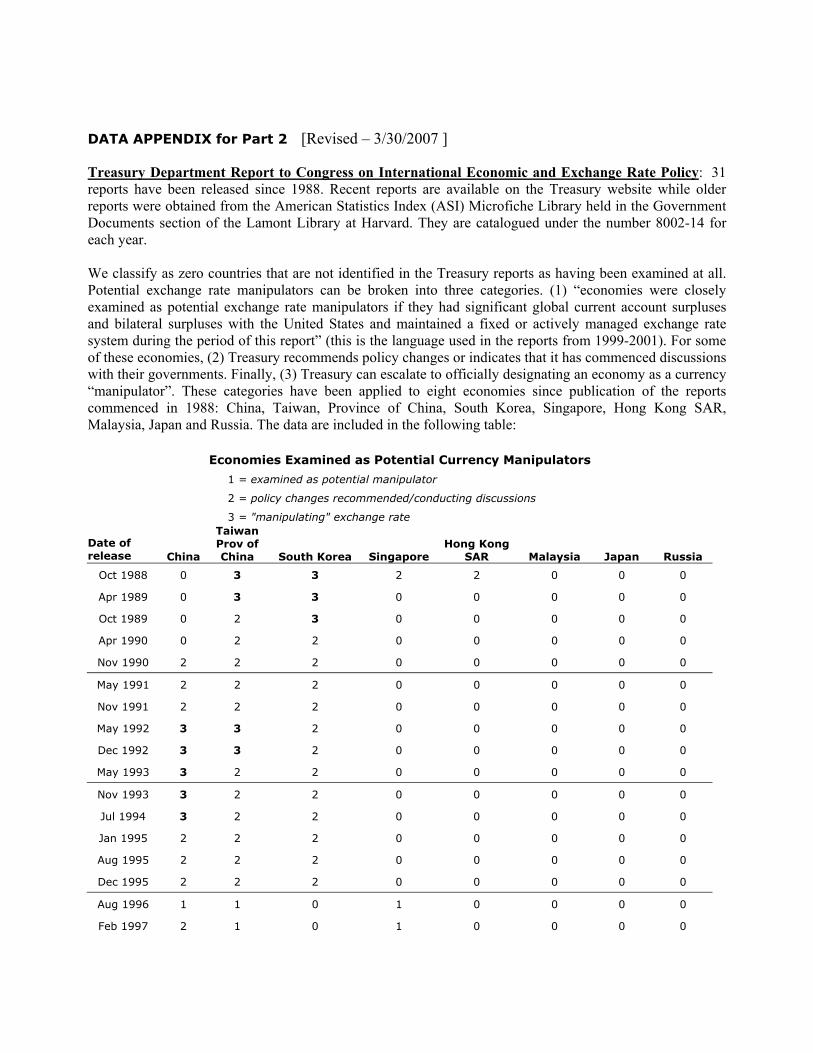
Since they were first mandated in 1988, there have been 33 biannual reports from the
US Treasury regarding whether individual trading partners – particularly those in Asia -- were manipulating currencies for unfair advantage. In recent years, parallel to calls from American politicians to allow the RMB to appreciate against the dollar, the Treasury has recommended policy changes and indicated that it has commenced discussions with the Chinese government. There has been speculation that the Treasury could go to the next step, and name China as an outright currency manipulator, as it did in the early 1990s, and as it did to Korea and Taiwan, Province of China in the late 1980s. This part of the paper seeks to test two competing hypotheses: (1) that the Treasury decisions are determined by legitimate economic variables – the partners’ overall current account/GDP, its reserve changes, and the real overvaluation of its currency, and (2) that the Treasury decisions are determined by variables suggestive of domestic American political expediency -- the bilateral trade balance,9 US unemployment, and an election year dummy. 2.1 Brief History of the Semi-Annual Treasury Reports
The US Congress mandated in its Omnibus Trade and Competitiveness Act of 1988
biannual reports from the US Treasury regarding whether trading partners were manipulating currencies. More specifically, in Section 3004, the Treasury is required to “consider whether countries manipulate the rate of exchange between their currency and the United States dollar for purposes of preventing effective balance of payments adjustments or gaining unfair competitive advantage in international trade.'' The law says the US must hold talks with governments deemed to be breaking the rules. Fred Bergsten had originally instigated in 1986 the idea of pushing the newly industrialized economies of Asia to revalue, at a time when a large depreciation of the dollar against the yen and other traditional major currencies had not yet produced the promised improvement in the US trade balance. The US campaign
9 In an exercise roughly analogous to this one, Noland (1997) found that bilateral trade imbalances explain the judgments of partners’ trade policies that are made in annually mandated reports to Congress by the US Trade Representative
9
was successful in persuading Korea and Taiwan to let their currencies appreciate in the late 1980s.10
In the first of the Reports to Congress on International Economics and Exchange Rate Policy, filed in October 1988, Korea and Taiwan, Province of China, were found to be guilty of manipulation, while Singapore and Hong Kong SAR “got off with a warning” in that policy changes were recommended. In subsequent years, those countries pronounced manipulators, or given warnings, have always been Asian. From May 1992 to July 1994 China was the primary target. Ironically, in January 1994, China engineered a devaluation of its official exchange rate against the US dollar, unifying its dual exchange rate system. In the late 1990s, the mechanism fell somewhat into disuse: none of the countries investigated in 1996 was found to be a problem, and the reports were not filed at all after January 1997, until January 1999. These were the years of the East Asia crises, in which the concern had abruptly shifted to whether countries had been artificially keeping the value of their currencies too high rather than too low. From May 2002 to May 2003, Treasury did not even identify any countries as having been investigated. (A table in the appendix to the working paper lists the findings of all the Treasury reports, according to our classification scheme.) During this period, judged from the black market exchange rates on China’s streets, the RMB was deemed overvalued.
The intense pressure on China from American politicians of both parties to revalue its currency upward began in 2003. There are plenty of good arguments pro and con, whether China should move in the direction of increasing exchange rate flexibility and/or allowing its currency to appreciate. This is true whether the criterion is China’s own economic interest, or facilitating an orderly unwinding of record global current account imbalances. 11 But it is clear that much of the pressure is political, tied to the record US trade deficits and loss of jobs in manufacturing.
Much of the pressure on the Treasury to name China a manipulator comes from Capitol Hill. Congressmen had entered the subject -- usually considered arcane -- of a trading partner’s exchange rate regime. The Schumer-Graham bill, originally proposed in February 2005, has received the most attention. It would impose WTO-illegal tariffs of 27.5 percent against all Chinese goods if China does not substantially revalue its currency. On March 28, 2006, Senators Baucus and Grassley proposed another bill substituting the phrase “currency misalignment” in place of “unfair manipulation.” Schumer and Graham subsequently withdrew their bill and suggested that they might return with a WTO-legal version.13
10 For the Korean case, see Bergsten (1989) and Frankel (1993a, b). There was an earlier precedent in the Yen-dollar talks of 1983-84, in which the US Treasury pressured Japan to open its capital markets, with the motive of allowing appreciation of the yen, and reducing the pattern of capital flowing from surplus Japan to deficit America (Frankel, 1984). 11 Bergsten (2006), Frankel (2005, 2006a), Goldstein (2003, 2004), Goldstein and Lardy (2003, 2005), and Roubini (2007) are among those in favor of increased flexibility and/or revaluation for the yuan. McKinnon (2006), McKinnon,and Schnabl (2003, 2004), Mundell (2004) and Cooper (2005) are among those opposed. 13 By now Schumer and Graham have backed off approximately three times: first after a weeklong visit to China where they became more familiar with the situation; second after China’s July 2005 announcement of a change in regime, and third in 2006 when Henry Paulson was named Treasury Secretary. But they may return.
10
The response of the US Treasury has been measured. But ever since October 2003 -- as the US entered a presidential election year -- the semi-annual reports have again designated two countries as meriting recommendations or discussion: China plus one other (either Japan or Malaysia). As already noted, China announced a change in exchange rate regime in July 2005, an abandonment of its de facto peg against the dollar. But perhaps in recognition that not that much had yet changed in reality, the Treasury gave China the same designation in its reports of November 2005, April 2006 and December 2006.14 Speculation mounted that the Treasury was likely to name China a manipulator outright.
We now examine the statistical pattern of designations in the historical record since 1988. The primary goal is to assess two different interpretations of the driving force behind the Treasury reports. First, one could take the 1988 legislation and the subsequent reports at face value, as an attempt to evaluate the economics of currency undervaluation. The IMF Articles of Agreement prohibit member countries from manipulating their currencies for their own competitive advantage. The IMF has seldom in practice exercised this sort of surveillance. Only twice has the IMF found that a country has deliberately undervalued its currency, while it has found hundreds of cases of countries overvaluing their currencies.18 Thus one could interpret the US Congress and Treasury as stepping in to enforce this principle on their own. The biannual Treasury reports submitted during the period when John Snow was secretary have included Appendices that are thoughtfully written to explain the economics of exchange rates and trade balances, and the way the Department makes its 14The reports are often submitted one or more months later than they are officially due. Perhaps busy Treasury officials do not relish devoting resources to producing a document that, at best, is ignored, and, at worst, becomes the grist for attacks by grandstanding Congressmen. 18 This paper focuses on the US legislation and Treasury reports, more than the wisdom of IMF surveillance. The authors personally incline to the view that this provision in the Articles of Agreement has been used so rarely, and findings of manipulation are so subjective (especially when the country in question is seeking to maintain a peg), that the language of “unfair manipulation” is not appropriate even for a country with massive, persistent, and undesirable surpluses on its current account or overall balance of payments. “Unfairness” should be alleged rarely, and only when on firm ground, such as allegations of violations of international trade agreements.
11
decisions. US Treasury (2005, Appendix) lists six important indicators that factor into its decision. They include trade and current account balances, rapid foreign exchange reserve accumulation, and measures of undervaluation and real effective exchange rate movements. The list explicitly does not include bilateral trade balances among the criteria, and the document explains why they are not economically relevant.
Second, one could interpret the biannual reports as a manifestation of political pressures within the United States. While economists do not believe that bilateral trade deficits are of much economic significance, they clearly do matter politically. Bilateral deficits are blamed for loss of US jobs, especially in manufacturing, and politicians compete to see who can use the tougher rhetoric. (Fortunately the actual policy actions of whoever holds the White House tend to some extent to be tempered by offsetting lobbying from US firms that benefit from cheap imports and by realities of international economics and politics.) The focus was on Japan 20 years ago and Korea 15 years ago. The spotlight is now on China, with India perhaps waiting in the wings, auditioning for the scapegoat role. 2.2 Econometric Investigation of Determinants of Treasury Findings
As already noted, we use three variables to capture the first hypothesis, that the Treasury findings are motivated by genuine international economics: the overall current account surplus of the trading partner (as a percent of its GDP), the change in the partner’s reserve holdings (using its GDP as the scale variable, along with a few alternative denominators), and the value of the partner currency (relative to the IMF’s concept of the PPP exchange rate). We also use three variables to capture the second hypothesis, that the reports are motivated by American politics: the bilateral balance of the United States with the partner in question, the US unemployment rate, and a dummy variable for a presidential election year.
The sample consists of 63 US trading partner countries, observed in each of the 34
reports through November 2006. The variable to be explained is ordinal. Let Y denote the Treasury’s decision, which can take one of the four values: 0 = country not investigated 1 = examined as a potential manipulator 2 = policy changes recommended / conducting discussions 3 = found to be manipulating its exchange rate.
12
Here we apply to the problem the technique of ordered probit. 21 Let us assume that Y depends on the value of a latent variable Y*, which in turns depends on a set of observables:
Y* = X β + ε and Y = 0 if Y* < k1, Y = 1 if k1 ≤ Y* < k2, Y = 2 if k2 ≤ Y* < k3 Y = 3 if k3 ≤ Y* where k1, k2, and k3 are "cutoff points" and k1 < k2<k3 and residual ε is assumed to follow a standard normal distribution. Vector X includes US bilateral trade balance with the country in question, the partner country’s overall current account balance (as a share of GDP), the extent of the partner’s currency overvaluation, the scaled change in the partner’s reserve position, US unemployment, and a dummy for US election year. In some regressions we also include period dummies, to capture a changing economic or political environment generally. In this case, US unemployment and election year dummy are dropped out as they are linear combinations of the period dummies. The cutoff points and β can be estimated by maximum likelihood. 2.2.1 Estimates from Ordered Probit Analysis
The results are presented in Tables 1-3. We report standard errors that are clustered by country.
The first column shows estimation on the complete sample of 63 trading partners. Two variables stand out as consistently stronger than any others: the US bilateral trade balance with the country in question, and the partner’s overall current account as a share of GDP. Both show coefficients that are of the hypothesized sign and highly significant. The only other variable that is significant, even at the 10% level is the US election year dummy. The partner reserves variable22 -- essentially its balance of payments surplus – generally appears statistically insignificant.
The second column reports our preferred estimation. It omits from the sample nine oil-exporting countries, because this is what the Treasury says it does. 23 Now the effect of
21 Less sophisticated estimation techniques were reported in the working paper version in addition to ordered probit: a linear specification, and a probit with a dichotomous dependent variable. They are omitted here to save space. 22 Table 3 in the Working Paper suggests that the best scale variable for the change in reserves is GDP, not the level of imports or the level of reserves itself. Thus we report only that measure of reserves here. 23 Since virtually all the attention has been on Asian countries, we have also tried narrowing the sample further, first to 15 Asian countries, and then to the 8 who are actually named in the reports. (Not reported here.) Reducing the sample size in this way gives similar point estimates on all the variables, but deprives them of much of their statistical significance. That the Treasury reports choose to focus on Asia is itself important
13
the partner’s real exchange rate rises above the 10% significance level, as does the US unemployment rate. The election year dummy loses its significance. There were only five presidential elections during this period, so lack of observations may explain the lack of statistical significance of this variable.
Columns (3) and (4) use the US unemployment rate interacted with the election year dummy, instead of entering them separately. The interactive variable is significant at the 5% level, with either the full sample or the non-oil countries sample. Evidently the domestic politics become more important, not in all election years, but in those election years when the electorate is worried about job loss.24 2.2.2 Assessing the relative importance of different factors How can one assess the relative quantitative importance of the different factors in the Treasury decisions? One way is according to level of statistical significance. Here the bilateral trade balance is the clear leader. But another way to approach the problem – at least for variables that pass the threshold of statistical significance – is to look at the estimated size of the effect of a regressor on the latent variable y*. One does not want to compare the point estimates of the coefficients directly, because their scales are arbitrary. Instead, we re-scale a given point estimate by the relevant regressor's standard deviation in the sample. The last column in each table reports the predicted change in the latent variable in response to a one-standard deviation increase in a regressor. We only report such coefficients corresponding to the regression in Column 4 (to avoid overcrowding in the tables). One may read the absolute size of this coefficient as a way to assess the relative importance of various regressors that cause the Treasury to move a country up the ladder in the findings. By this criterion, in Table 1 the partner’s current account beats out the bilateral balance by a fairly small margin: a one-standard-deviation increase in the partner’s current account has a larger effect than a one-standard-deviation increase of the US bilateral deficit. The US unemployment-election variable comes third in importance, whether judged by statistical significance or standardized response (among the variables that are significant). 2.2.3 Controlling for findings of preceding Treasury reports It would not be surprising to find some persistence over time in the Treasury findings. That is, if it chooses to investigate a country for possible manipulation in one period, it is likely to do so again in the next period (possibly due to omitted variables). To check this, we augmented the basic model by including in the X-vector a new dummy that indicates that Y > 0 in the previous report. This conjecture is confirmed in Table 2: the goodness of fit (pseudo R2) increases sharply and the variable is highly significant in all cases. Its presence also boosts the strength of some of the other estimated coefficients, notably the change in partner reserves. Also the US unemployment rate is now highly statistically significant on its own. information, and there seems little justification for throwing it away. (But we give a taste of the smaller samples in Table 3.) 24 When we include unemployment and the election dummy separately alongside their interaction, although all tend to lose significance, the interaction term dominates. (Not reported here.) Indeed the coefficient on regular election years isn’t even positive. Particularly among the Asian countries that are the usual targets, high-unemployment election years are the ones that have the significant effects.
14
We also tried interacting the previous report variable with the other determinants. Our findings (not reported here) are that a high US bilateral deficit this period, or high partner surplus on the current account or overall balance of payments, counts significantly less if the partner was already investigated last period. 2.2.4 Other extensions of results
It appears that the Treasury is eager not to single out one country for unique opprobrium. There has never been a case where a single country is left completely exposed on its own. Other things equal, the country with the top ranking in terms of the combination of economic and political variables is less likely to be named than if it had some other country to hide behind, while the second-ranked and third-ranked countries are more likely to be moved up, to give the leader company. These results are highly significant statistically.25
As a final robustness check, in Table 3 we added time period dummies. This would allow, for example, for different approaches under different presidents or Treasury secretaries. The disadvantage is that we lose the US political variables, unemployment and the election dummy, since these vary only over time and not by trading partner. The result is that all variables are highly significant statistically: the bilateral balance, the partner’s current account, the real exchange rate, and the partner’s change in reserves. Their significance survives the narrowing of the sample better than it did when there were no time dummies: only the reserves variable becomes insignificant on the Asia-only samples. 2.2.5 Conclusions from the analysis of the Treasury reports
There is evidence for both hypotheses. The variables that an economist would recognize as legitimate have a statistically significant effect on the decisions in the Treasury reports – particularly the partners’ overall current account/GDP, and sometimes also the overvaluation of its currency relative to PPP, and its reserve changes. But variables that an economist would not recognize as legitimate also matter. In particular the bilateral trade balance is the most consistently and strongly significant. It is generally significant at the 1% level of significance. The US unemployment rate is often significant, though not always. When the presidential election dummy is interacted with US unemployment, it is more highly significant.
Overall, three aspects of the regression results suggest that the domestic political variables are as important determinants of the Treasury decision as the legitimate global manipulation criteria: the absence of a clear role for reserve accumulation by the partner country as mandated by the IMF criteria, the significance of US unemployment (especially in election years), and the very high significance of the bilateral balance notwithstanding that Treasury (2005) deliberately excludes this indicator from its list of criteria. If it was the IMF interpreting the criteria in the Articles of Agreement, rather than the Treasury interpreting the criteria in the 1988 US law, then consistent uni-directional intervention in the foreign exchange market would receive a lot more emphasis, and the US-specific variables such as the bilateral trade balance and US unemployment would not appear at all. 25 Table 5 of the Working Paper.
15
It should be noted that the law governing the Treasury reports mandates both sorts of tests: “If the Secretary considers that such manipulation is occurring with respect to countries that (1) have material global current account surpluses; and (2) have significant bilateral trade surpluses with the United Sates, the Secretary of the Treasury shall take action to initiate negotiations…” In that sense, to interpret evidence (that the bilateral balance numbers drive the Treasury decision to accuse a country of manipulation) as political, requires assigning the political motivation to the Congress, which passed the law, rather than to the Treasury that merely has to follow it. Alternatively, one could argue that the legally operative criterion lies in the interpretation of the ambiguous word “manipulation,” that many of the 185 members of the IMF currently satisfy conditions (1) and (2) above – most of whom are never mentioned in the Treasury reports -- and that therefore Treasury does genuinely have the latitude necessary to exercise its judgment. Others, however, would argue that the phrase “material global current account surpluses” means that the country in question must have a big share of the global surplus, as China does but Cote d’Ivoire does not, to qualify as a manipulator.
American politicians could come to regret it, if China finally followed their advice,
because the result could well be an abrupt upward movement in US interest rates when the Chinese authorities stopped intervening in the market by buying dollar securities. The same could be the result if the Chinese authorities were to switch the composition of their reserves away from the dollar, perhaps in line with the ongoing shift in the currency composition of their reference basket away from the dollar. Our recommendation to the Treasury, if it finds it impossible to resist the political pressure from the Congress to name China a manipulator, is to invoke the provision in the last sentence of Section 3004: “The Secretary shall not be required to initiate negotiations in cases where such negotiations would have a serious detrimental impact on vital national economic and security interests…” The Secretary would then explain to Congress that the detrimental economic impact would fall on his ability to sell Treasury securities (and the detrimental security impact would fall on the US Government’s ability to enlist China’s help on higher priority goals such as defusing the North Korean nuclear threat). A third hypothesis should also be noted: that the US Treasury (in any administration) walks a fine line. On the one hand, it needs to placate vote-conscious Congressmen who are in danger of passing protectionist legislation more damaging than anything likely to come out of a Treasury report. On the other hand, it needs to take into account the constraints of international diplomacy (too much pressure on China would backfire politically) and of international markets (the danger of sparking a hard landing for the dollar, in which the dollar falls abruptly, interest rates rise, and securities prices fall).
16
3. WHAT IS THE CURRENT EXCHANGE RATE REGIME IN CHINA?
If a country announces the adoption of a basket peg but does not reveal the exact weighting of the component currencies, how would one verify if the authorities’ actions are consistent with their words? We apply a simple methodology first developed more than a decade ago27 to the case of the RMB currency basket to study its evolution since July 21, 2005. To summarize our findings from the outset, we find that the Chinese currency continues to assign heavy weight to the US dollar, but that there are signs of some modest but steady increase in flexibility since the spring of 2006. We also look at the possibility of US pressure being a cause of steps toward increased flexibility, by counting complaints from US officials about the RMB as reported in the press. There is some evidence that US officials’ complaints tend to be associated with gradual reductions in the weight of the dollar in the RMB currency basket. This trend is modest, however, and there is no evidence that such complaints have led the Chinese to revalue the RMB relative to the currency basket. 3.1 Uncovering the Secrets in an Opaque Currency Basket The Chinese currency had been effectively pegged to the US dollar at the rate of 8.28 RMB/dollar since 1997 until July 21, 2005, when the Chinese central bank announced the switch to a managing float regime “with reference to a basket of currencies.” The announcement was billed as a major regime change. (Incidentally, however, China’s official policy has never been a pegged exchange rate. This just goes to show the common divergence between de jure and de facto exchange rate regimes and the importance of inferring the true regime from observed data, a point that is by now well understood.) 3.1.1 What is publicly announced and what is not
As is often the case with currency baskets, the weights were not made public. Speculation ensued after the announcement about which currencies were in the new reference basket and what their weights were. Jen (2005), for example, guessed that the weight on the dollar was 85%. On August 9, 2005, Central Bank Governor Zhou Xiaochuan (2005) disclosed a list of 11 currencies as constituents of the reference basket, in a speech in Shanghai marking the opening of the central bank’s second headquarters. In particular, he stated that the major currencies in the basket are the US dollar, the euro, the yen, and the Korean won. We will label these four as the first-tier currencies in the basket. In addition, Governor Zhou stated that the rest of the currencies in the basket are the Singapore dollar, the British pound, the
27 Frankel (1993) and Frankel and Wei (1994, 1995). The approach has since been used by others, including Bénassy-Quéré (1999), Ohno (1999), Frankel, Schmukler and Servén (2000), and Bénassy-Quéré, Coeuré, and Mignon (2004). For the RMB: Eichengreen (2006), Shah, Zeileis, and Patnaik (2005), and Yamazaki (2006, p.8). Haldane and Hall (1991) had earlier regressed the British pound exchange rate against the dollar and the Deutschemark; but their equation did not have a theoretical basis as estimation of basket weights, as the pound was not on a basket peg system.
17
Malaysian ringgit, the Russian ruble, the Australian dollar, the Thai baht, and the Canadian dollar. The last seven will be labeled as the second-tier currencies. The governor said that these currencies were chosen because of their economies’ importance for China’s current account. Still not announced were the weights on these currencies, or the frequency and the criteria with which these weights might be altered.28 3.1.2 A picture is worth a thousand words
Before we turn to regression-based estimation, it may be useful to inspect some simple time series plots. Some perspective can be gleaned from Figure 1, the graph that traces out the spot and three forward rates (from 1, 3 and 12 months non-deliverable forward contracts, respectively) of the USD/RMB exchange rate from April 2003 to January 2007. Interestingly, even though the actual regime change came in July 2005, the market had been expecting an RMB revaluation as reflected in the forward rate ever since October 2003. In fact, on July 20, 2005, the day before the actual regime change, the 12-month forward contract was forecasting an exchange rate of 8 RMB/US dollar, which implied a higher magnitude of appreciation than what actually happened the day after, but which turned out to be relatively close to the actual spot rate a year later (July 20, 2006).
To see how the RMB’s value has evolved relative to major currencies, we turn to
Figure 2, the one that plots the value of the yuan in units of US dollars, euros and yen, respectively, since July 1, 1995. The three exchange rate series are rescaled to be equal to one on the first day (July 21, 2005) after the exchange rate regime reform, so that one can easily see subsequent percentage changes. A number of features stand out. First, in spite of the announced abandonment of the dollar peg, the link to the US dollar even after July 21, 2005, is clearly much stronger than to either the euro or the yen. Second, one can discern a gradual (and very slow) strengthening of the RMB against the dollar, accumulating a total of another 4% of appreciation from July 21, 2005 to the end of 2006. Third, the value of the RMB against the euro and the yen fluctuates a lot, mostly a reflection of the fluctuation in the value of the US dollar against these other two currencies. Relative to July 20, 2005, the day before the exchange rate reform, the RMB had by April 2006 appreciated by about 12% against the yen, but was at about the same level against the euro. Then by the end of 2006, the yuan was down against the yen as much as it was up against the euro. In other words, the action has been in the euro and yen.
To get a sense of the evolving range of the dollar/RMB movement, Figure 3 plots the percentage changes (the first differences in the log) of the exchange rate since July 22, 2005. Up to the spring of 2006, most of the daily movement was within 0.05%, with occasional movements approaching or exceeding 0.1% especially in the more recent period. In other words, the daily movement of the dollar/RMB had been tiny, despite the announced switch to a managed floating exchange rate. Since the spring of 2006, however, there has been a visible increase in the daily movement, with daily changes exceedingly 0.1% frequently.
28 According to a 2006 report, which may not be reliable, Governor Zhou put the dollar weight at “much less than 50 percent.” http://www.forbes.com/markets/feeds/afx/2006/01/26/afx2481184.html ,
18
As another way to see the evolving flexibility, Figure 4 plots the standard deviation of
the daily exchange rate movement over a sequence of rolling 20-day sample since July 22, 2005. After some initial moderate gyration in the rate following the announced regime change, the fluctuations die down in the last few months of 2005 and the beginning of 2006. The standard deviation then trends upward after the beginning of 2006, reaching around 0.08% by the end of 2006, a tripling relative to the magnitude in the immediate aftermath of the regime change announcement. In order not to lose sight of the big picture, we note again that, in spite of the visible increase in exchange rate flexibility, the absolute magnitude of the movement has been small so far. 3.1.3 Implicit weights in the currency basket
Assuming that the value of the RMB is indeed determined by a currency basket, how does one uncover the currency composition and weights in the basket? This is a problem to which Ordinary Least Squares regression is unusually well suited. If we know the list of currencies, of which the ones used in the basket can be a subset, then we regress changes in the log value of the RMB against changes in the log values of the candidate currencies.
The reason to work in terms of changes rather than levels is the likelihood of non-stationarity. Concern for nonstationarity goes beyond the common refrain of modern time series econometrics, the inability to reject statistically a unit root, which in many cases can be attributed to insufficient power. One of the most important hypotheses we are testing is that the authorities have allowed the yuan to drift away from a basket, perhaps via an upward trend. Thus it is important to allow for nonstationarity. Working in terms of first differences is the cleanest way to do so. We should include a constant term to allow for the likelihood of a trend appreciation in the RMB, whether against the dollar alone or a broader basket. Algebraically, if the RMB is pegged to currencies X1, X2, … and Xn, with weights equal to w1, w2, … and wn, then logRMB(t+s)-logRMB(t) =c+ ∑ w(j) [logX(j, t+s) - logX(j, t)] If the exchange rate is truly governed by a strict basket peg, then we should be able to recover the true weights precisely, so long as we have more observations than candidate currencies, and the equation should have a perfect fit.
Shah, Zeileis, and Patnaik (2005) adopted this methodology to study the Chinese currency basket after July 21, 2005 and found that the RMB is still tightly pegged to the dollar, and no other currencies. However, they only consider four candidate currencies in the RMB basket (the dollar, the yen, the euro, and the pound), probably unaware of the eleven-currency disclosure made by the Chinese central bank. In addition, their sample was only the initial few months after July 21, 2005. Frankel and Wei (2006) extended to 11 the components of the basket, but found that the RMB regime in the second half of 2005 was still
19
a tight dollar peg – as tight as that of the Hong Kong SAR regime. Ogawa (2006) found the same. Eichengreen (2006, p. 22-25) had daily observations of data that ran from July 22, 2005, to March 21, 2006, and found a dollar weight around .9, but with no evidence of a downward trend in the weight, and no significance on non-dollar currencies. Each of these four papers was too early to catch the evolution in 2006. Yamazaki (2006, p.8) updated the estimation, and found some weight had shifted to the euro, yen and won; but he estimated the equation in terms of levels rather than changes (risking non-stationarity), did not allow for a trend, did not allow for the other currencies on the list, and had a relatively small number of (bimonthly) observations.
One methodological question must be addressed, before we turn to the new results. How do we define the “value” of each of the currencies? This is the question of the numeraire. 30 If the exchange rate is truly a basket peg, the choice of numeraire currency is immaterial; we estimate the weights accurately regardless.31 If the true regime is more variable than a rigid basket peg, then the choice of numeraire does make some difference to the estimation. Some authors in the past have used a remote currency, such as the Swiss franc (e.g., Frankel and Wei, 1994). But a weighted index such as a trade-weighted measure or the SDR (Special Drawing Right, an IMF unit composed of a basket of most important major currencies) is probably more appropriate. Here is why. If the true regime is a target zone or a managed float centered around a reference basket, where the authorities intervene to an extent that depends on the magnitude of the deviation – and this seems the logical alternative hypothesis in which a strict basket peg is nested -- then the error term in the equation represents shocks in demand for the currency that the authorities allow to be partially reflected in the exchange rate (but only partially, because they intervene if the shocks are large). Then one should use a numeraire that is similar to that used by the authorities in measuring what constitutes a large deviation. The authorities are unlikely to use the Swiss franc or Canadian dollar in thinking about the size of deviations from their reference point. They are more likely to use a weighted average of major currencies. If we use a similar measure in the equation, it should help minimize the possibility of correlation between the error term and the numeraire.32 Similarly, if there is a trend in the exchange rate equation (a constant term in the changes equation) representing deliberate gradual appreciation of the currency, then the value of the RMB should be defined in terms of whatever weighted exchange rate index the authorities are likely to use in thinking about the trend. These considerations suggest a numeraire that is itself composed of a basket of currencies. We choose here the SDR.
Using daily exchange rates (from July 21, 2005 to the beginning of 2007) and the SDR as the numeraire currency, we implement a sequence of estimations for the whole sample. Bilateral exchange rates are observed at the same moment in the day. Column 1 of
30 Frankel (1993) used purchasing power over a consumer basket of domestic goods as numeraire; Frankel and Wei (1995) used the SDR; Frankel and Wei (1994, 2006), Ohno (1999), and Eichengreen (2006) used the Swiss franc; Bénassy-Quéré (1999), the dollar; Frankel, Schmukler and Luis Servén (2000), a GDP-weighted basket of five major currencies; and Yamazaki (2006), the Canadian dollar. 31 If the linear equation holds precisely in terms of any one “correct” numeraire, then add the log exchange rate between that numeraire and any arbitrary unit to see that the equation also holds precisely in terms of the arbitrary numeraire. This assumes the weights add to 1, and there is no error term, constant term, or other non-currency variable.
20
Table 4 reports the result for the entire sample period. Of the 11 currencies that are supposedly in the basket, only two currencies receive weights that are steady enough throughout the sample period to show up with positive and statistically significant weights: the US dollar (90% weight) and Malaysian ringgit (5% weight). Surprisingly, the two major non-dollar currencies, the euro and the yen, receive zero weight in the basket. (These results stay the same when we switch the numeraire currency from SDR to Swiss franc or gold as a robustness check.) It appears that the Chinese authorities are more concerned with preserving trade competitiveness against major Asian rivals than with minimizing variability vis-à-vis the world’s most important currencies or China’s most important export markets.
Despite the official pronouncement that China has ceased its particular link to the US dollar, the sample-wide estimated weight on the dollar is still 90%. Further, the regression has a tight fit, with R2 of 0.95 and root mean squared errors (MSE) of 0.03%, suggesting a tight peg to the basket. This finding is in contrast to the official position that the link to the basket (whatever its composition) is loose, that it is just a reference point. For comparison, we implement the same methodology on a currency that is clearly floating, namely the Japanese yen, and another currency that is known to be pegged to the US dollar, namely, the Hong Kong dollar. The R2 is 0.54 for the Japanese yen, much lower than that of the RMB. It is 99% for Hong Kong dollar, not that much different from the RMB. Similarly, the root mean squared error is 0.36% for the yen, an order of magnitude bigger than for the RMB, but is 0.02% for the Hong Kong dollar, virtually the same as the RMB. It is striking that the behavior of the Chinese RMB since July 21, 2005 closely resembles that of a known dollar pegger, the HK dollar, but is very far from a known floater, the yen.
We implemented the methodology on three other East Asian currencies as well: the Singapore dollar, the Malaysian ringgit, and the Korean won (reported in the Working Paper). They constitute intermediate cases. Of the three, the Singapore dollar and Malaysian ringgit both appear to be following loose basket pegs. The weights on the dollar are lower, and the fit looser, than in the case of the RMB. Nevertheless, considering that the Malaysian currency appears to be the only important non-dollar currency in the Chinese basket, it is striking that the ringgit itself gives .5 weight to the dollar (also .1 weight, each, to the Taiwan dollar, Philippine peso and Indian rupee). It means there is even less scope for yuan appreciation against the dollar.
Some have reacted to our results by pointing to high multicollinearity and reverse-
causality among the regressors in the RMB equation and wondered whether the coefficient estimates are biased. After all, we have just seen that the Malaysian dollar is highly correlated with the US dollar, and have suggested that this is deliberate policy on the part of Kuala Lumpur But the independent significance of the US and Malaysian dollars in the RMB equation suggests that the relationship is strong enough to prevail over the multicollinearity. (Of course, that is what multivariate regression is designed to discover.) And the tightness of the fit suggests that the existence of another simultaneous equation determining the ringgit would not much bias the estimates in the RMB equation. Recall that, in the limit, a perfect basket peg will produce perfect coefficient estimates: the error term cannot be correlated with righthand side variables if there is no error term.
21
3.2 Evolution of the Basket
The situation is changing rapidly over time. Estimates that impose unchanging coefficients could well be misleading.
3.2.1 Estimates from the sub samples
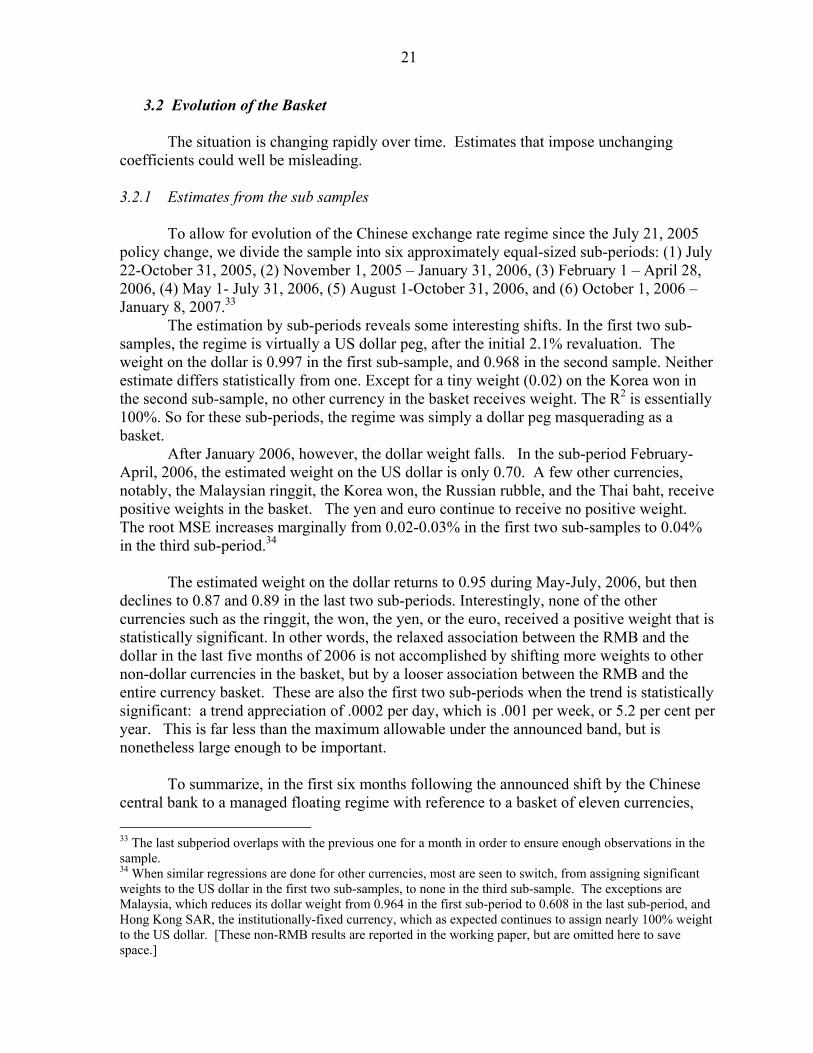
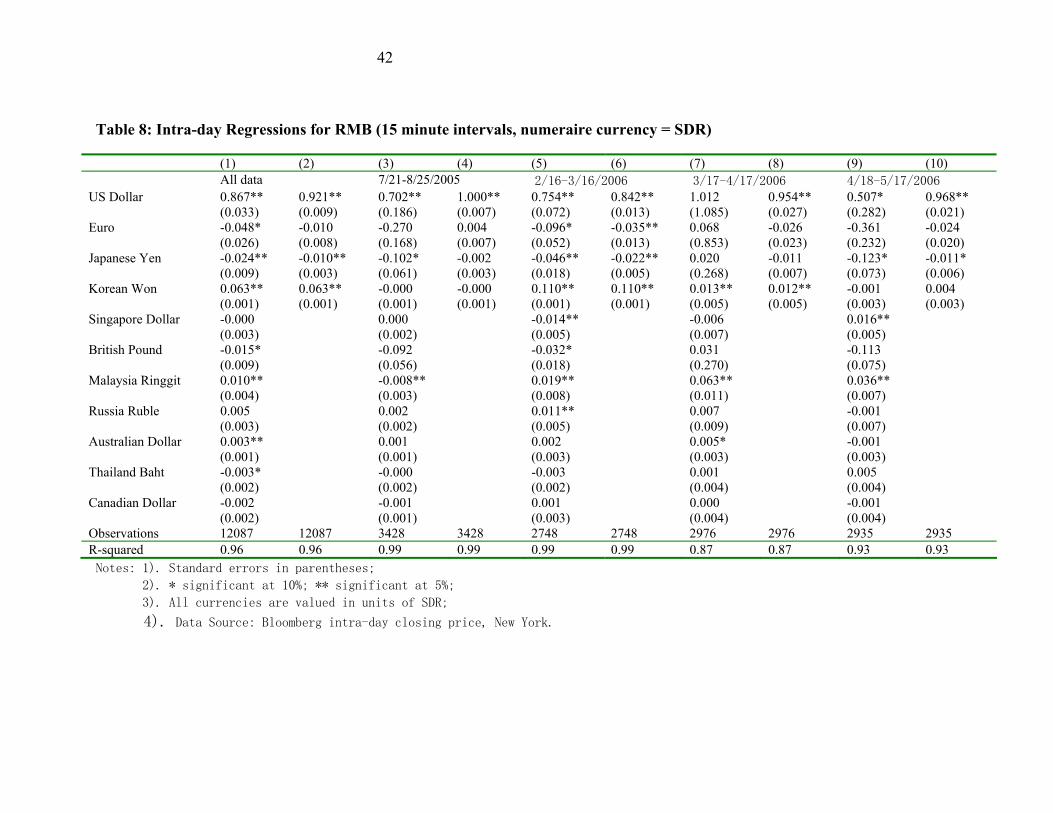
To allow for evolution of the Chinese exchange rate regime since the July 21, 2005 policy change, we divide the sample into six approximately equal-sized sub-periods: (1) July 22-October 31, 2005, (2) November 1, 2005 – January 31, 2006, (3) February 1 – April 28, 2006, (4) May 1- July 31, 2006, (5) August 1-October 31, 2006, and (6) October 1, 2006 – January 8, 2007.33 The estimation by sub-periods reveals some interesting shifts. In the first two sub-samples, the regime is virtually a US dollar peg, after the initial 2.1% revaluation. The weight on the dollar is 0.997 in the first sub-sample, and 0.968 in the second sample. Neither estimate differs statistically from one. Except for a tiny weight (0.02) on the Korea won in the second sub-sample, no other currency in the basket receives weight. The R2 is essentially 100%. So for these sub-periods, the regime was simply a dollar peg masquerading as a basket.
After January 2006, however, the dollar weight falls. In the sub-period February-April, 2006, the estimated weight on the US dollar is only 0.70. A few other currencies, notably, the Malaysian ringgit, the Korea won, the Russian rubble, and the Thai baht, receive positive weights in the basket. The yen and euro continue to receive no positive weight. The root MSE increases marginally from 0.02-0.03% in the first two sub-samples to 0.04% in the third sub-period.34
The estimated weight on the dollar returns to 0.95 during May-July, 2006, but then
declines to 0.87 and 0.89 in the last two sub-periods. Interestingly, none of the other currencies such as the ringgit, the won, the yen, or the euro, received a positive weight that is statistically significant. In other words, the relaxed association between the RMB and the dollar in the last five months of 2006 is not accomplished by shifting more weights to other non-dollar currencies in the basket, but by a looser association between the RMB and the entire currency basket. These are also the first two sub-periods when the trend is statistically significant: a trend appreciation of .0002 per day, which is .001 per week, or 5.2 per cent per year. This is far less than the maximum allowable under the announced band, but is nonetheless large enough to be important.
To summarize, in the first six months following the announced shift by the Chinese central bank to a managed floating regime with reference to a basket of eleven currencies, 33 The last subperiod overlaps with the previous one for a month in order to ensure enough observations in the sample. 34 When similar regressions are done for other currencies, most are seen to switch, from assigning significant weights to the US dollar in the first two sub-samples, to none in the third sub-sample. The exceptions are Malaysia, which reduces its dollar weight from 0.964 in the first sub-period to 0.608 in the last sub-period, and Hong Kong SAR, the institutionally-fixed currency, which as expected continues to assign nearly 100% weight to the US dollar. [These non-RMB results are reported in the working paper, but are omitted here to save space.]
22
China made such a heavy reference to the US dollar that it was indistinguishable from a dollar pegger. However, since February, 2006, there are signs of increased flexibility. First, in the spring of 2006, some weight in the basket was shifted to other currencies, particularly the Malaysian ringgit, the Korean won, the Russian ruble, and the Thai baht. Surprisingly, throughout the sample, there is not an iota of evidence of any positive weight assigned to the yen or the euro. Second, since the fall of 2006, in addition to the lesser weight on the dollar (an estimated weight of 0.9 rather than 1.0 as in the earlier periods), the association between the RMB and the reference currency basket has become looser. There is a non-negligible trend of appreciation against the basket, and slightly looser fit. 3.2.2 Robustness with respect to numeraire currency We have chosen to emphasize estimates that use the Special Drawing Right as the numeraire currency. We noted earlier that the choice of the numeraire is irrelevant if the currency is strictly pegged to a currency basket. However, if the value of the currency relative to the basket is allowed to fluctuate, different numeraires might generate different point estimates. For this reason, we examined if the conclusions are robust with respect to the choice of numeraires, repeating the regressions using the price of gold as an alternative numeraire. The gold-based regression results are reported in the working paper. Although the exact point estimates vary somewhat, the same qualitative results as before emerge clearly. First, in the initial eight months after July 21, 2005, the Chinese exchange rate regime is best characterized as a virtual peg to the US dollar. The goodness-of-fit measure and RMSE for the Chinese RMB are closer to those of the Hong Kong dollar, than to currencies known to have some flexibility. Second, there are signs of increased flexibility since February of 2006. The weight on the US dollar declines (though the estimated magnitude of the decline is not as large as when the SDR is used as the numeraire). Third, as before, there is no evidence of a positive weight assigned to either the euro or the yen. 3.2.3 Allowing for steady acceleration in the shift Several considerations suggest it would be useful to return to estimation over the entire 18-month sample period but to allow for steady escalation of the various flexibility parameters. First, everything we know about Chinese government officials, from their history of economic reforms to their own words, points to policy change that is gradual. Second, looking simply at the yuan/dollar exchange rate in Figure 2, there is a gradual trend appreciation that visually accelerates. Third, looking at the econometric estimates across our sub-samples, all three flexibility parameters loosen up as we move from 2005 to late 2006: the weight on the dollar tends to fall, the appreciation trend becomes positive and significant, and the fit becomes looser. All these considerations presume very little movement in the short-term, but suggest signs of a pattern of acceleration that if extrapolated a few years into the future could imply substantial flexibility.
23
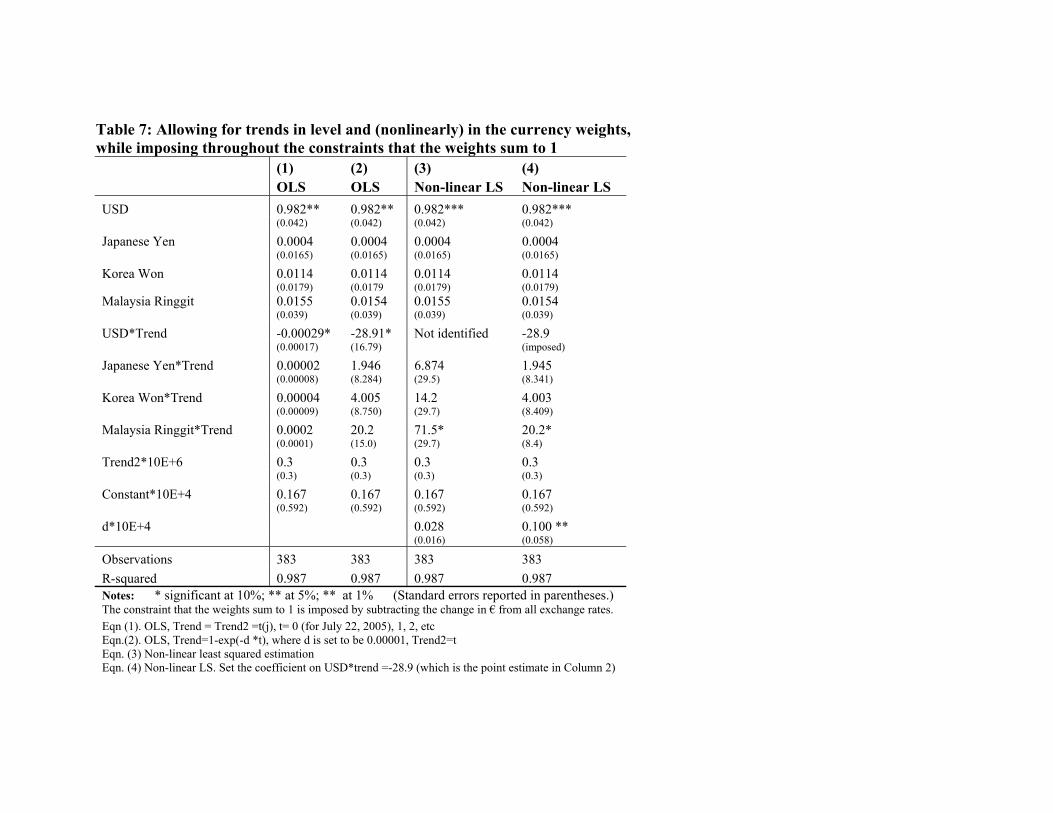
Allowing for a time trend of appreciation that is linear in the log of the exchange rate is easy; that is the constant term that has been in the changes regression all along. Allowing for a steadily accelerating time trend requires adding some function of time to the changes equation. The simplest is to add time itself. Allowing for there to be a time trend in weight placed on the dollar versus non-dollar currencies is trickier. We add to the equation time-dependent terms that interact with the changes in currency values, to see how the weights change over time. We begin with a simple linear trend specification for these time-dependent terms as well, even though linearity here is less realistic than for the trend in the log of the RMB exchange rate itself. The penultimate row of estimates in Table 5 shows a highly significant downward linear trend in the weight placed on the dollar.36 The constant term is still highly significant statistically as well, but the implied estimated trend appreciation against the basket (.0001 per day, or 2.5 per cent per year) is now half what it was before. Interestingly, there is only weak evidence here of an acceleration of the trend appreciation per se (third to last row of estimates in Table 5). Apparently the visual impression of accelerating appreciation in, for example, Figure 2, is primarily due to the (quite modest) shift in weight to non-dollar currencies at a time when they have been appreciating against the dollar. 3.2.4 Pressure from the US and the movement of the Chinese currency
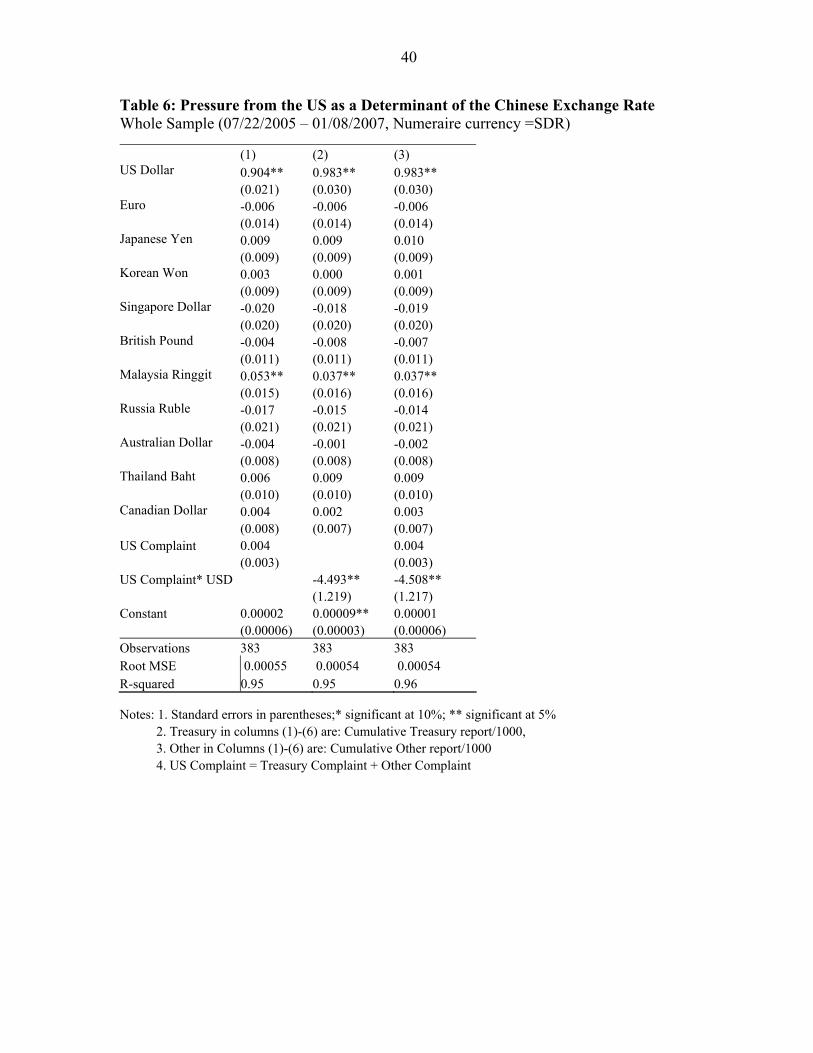
We now turn to a question that links the two parts of the paper: Do complaints about the Chinese exchange rate from US Treasury officials or other US officials lead China to respond by appreciating its currency relative to the basket and by reducing the weight of its currency on the dollar? The change of the currency regime on July 21, 2005, came after two years of complaints from the United States (and a few other countries). Complaints from US officials and politicians continued thereafter, perhaps because as we have seen there had been so little de facto change to match the announcement. To document the official US pressure systematically, we searched an electronic database of news reports (FACTIVA/NewsPlus) and recorded the number of news stories in all English-language newspapers in Washington DC, New York City, and Los Angeles, in which US officials are reported to have asked China to speed up the exchange rate flexibility/revaluation from July 1, 2005 to January 8, 2007. To see whether Chinese exchange rate behavior is related to the complaints, Table 6 reports a sequence of currency weight regressions that have added the cumulative US complaints and their interactions with the weight on the dollar as extra regressors. There is no evidence of an association between the complaints from US officials and appreciation of the RMB relative to the currency basket. There is evidence that cumulative complaints are associated with a reduction in the RMB basket’s weight on the US dollar. An attempt to
36 We have also allowed for non-linear trends, which would slow down with the passage of time. The basic results were little changed.
24
distinguish between the effect of complaints from Treasury officials versus other US officials suggests that the former may have carried more punch.37 Since the complaint series is by construction a non-decreasing function of time, one could wonder if they simply pick up a trend effect. We add a time trend and its interaction with the dollar weight as the additional regressors. The results are little changed. Again, there is evidence of a gradual decline in the RMB’s weight on the US dollar, but there is no evidence of a steady appreciation of the RMB relative to the whole basket. 3.2.5 Constraining the basket weights to sum to 1
There is a good argument for constraining the weights on the currencies to add up to 1. However weak one thinks the link to the reference basket might be, or however large or small the weight on the dollar, the authorities must view movements in the RMB through the metric of distance from some reference rate or effective exchange rate. The easiest way to implement the adding up constraint is to run the regressions with the changes in the log yuan value on the left-hand side of the equation transformed by subtracting off the changes in the log value of one of the currencies, say the dollar, and the changes in the values of the non-dollar currencies on the right-hand side transformed in the same way. To see this, we repeat equation (1): ∆ log RMBt = c + ∑ w(j) [∆ logX(j)t ]
= c + α ∆ log $ t + β(1) ∆ log €t + β(2) ∆ log £t + β(3) … We want to impose the adding up constraint α = 1 - β(1) - β(2) - β(3) … We implement it by running the regression equation (2): [∆ log RMB t - ∆ log$t ]
The results are reported in the working paper. One can recover the implicit weight on the dollar by adding the estimated weights on the non-dollar currencies, and subtracting the sum from 1. We learn for example, that the weight on the dollar is 1 minus the weights on the won (.02) and ringgit (.07), which is .91. These are very similar to the corresponding estimates when no constraint was imposed on the weights. The increase in the Root MSE is tiny, suggesting that a test would not reject the constraint that the weights sum to one. But imposing the constraint sharpens the estimates a bit; for example the coefficient on the Korean won now appears statistically significant not just when gold is used as numeraire but also in the preferred case where the SDR is used as numeraire. The basic findings are unchanged: significant weights only on the same two non-dollar currencies, a trend appreciation against the basket, and gradually diminishing linear weight on the dollar. When we impose the adding-up constraint in the equation where we test the role of official US complaints, the results are again little changed; but the complaints have an even
37 Results reported in the Working Paper. When estimated separately, the effects of Treasury and non-Treasury complaints were not statistically significant (let alone the difference between the two), probably because they are collinear.
25
stronger negative effect on the dollar weight. There is little evidence that they lead to an immediate appreciation, however small, per se. 3.2.6 Allowing for nonlinear trends in the weights
In sections 3.2.3 and 3.2.4 we allowed for a downward trend in the weight assigned to the dollar in the basket of reference currencies. But the specification was a linear trend. Since the currency weights are logically bounded by 0 and 1, a linear functional form for the trend in the weights, which has the undesirable property that the weights eventually breech the limits of 0 or 1, is not the best specification. Instead, the term designed to capture the possible shifting of weight toward non-dollar currencies can be assumed proportionate to [1-exp(-δ t)], which runs from 0 to 1 as required. The parameter δ helps captures the speed of the shift.
We can continue to impose the constraint that the weights sum to 1, not just at t=0 but throughout the period, implementing the constraint by subtracting the change in the value of an arbitrary currency from all currency variables (i.e., from both the change in the RMB value and the change in the values of other candidate currencies in the basket). Algebraically, if X(j) is the value of currency j in the basket, and w(j) is the weight on that currency, then
∆ log RMBt = f(t) + ∑ w(j) ∆ X(j)t
To impose the constraint that ∑1
J w(j) =1, we only need w(1) = 1- ∑2J w(j) .
Now we choose euro as the first currency. The constraint on the weights implies that
where w(j) can be anything between zero and one. Now let us add the time-dependent weight terms, using the exponential functional form for the weights w(j). We consider four different ways to specify and/or estimate the trend terms. The choice depends on how one feels about nonlinear estimation.38 • Specification 1: let w(j) = b0(j) + b1(j)* t, f(t) = c0 + c1*t .
This is the simplest specification and is estimated with OLS.
While the trend on the currency weights is non-linear, by selecting a particular value for d we keep the specification still linear in the parameters to be estimated. Therefore, this equation can be estimated with OLS as well.
38 We tried also imposing the constraint that the relative importance of the non-dollar weights vis-à-vis each other remains constant over time, while still allowing the upward trend in their collective importance. But this constraint was not supported by the data, and those results are not included here.
Instead of imposing a value, d is a parameter to be estimated. A non-linear least squares method is used for estimation. However, b1(US) turns out not to be identified in the estimation.
This time, we set b1(USD) = -28.9, which is the point estimate of b1(USD) from specification 2. The parameter d is still to be estimated, which we do by a non-linear least square method.
The results, reported in Table 7, are probably the most important for distinguishing whether the gradual appreciation of the yuan against the dollar is attributable to a shift of weights in the basket away from the dollar, or rather to an appreciation against the basket. The table confirms that in the immediate aftermath of the policy change in July 2005, the weight on the dollar was an estimated .98, statistically indistinguishable from 1. It also confirms a downward trend in the weight on the dollar (this time estimated in a realistic nonlinear functional form). While it is less clear which of the other currencies are receiving the reallocation of weight, an upward trend in the weight on the Malaysian ringgit appears the strongest statistically. Under the technique of non-linear least squares, the ringgit trend acquires statistical significance (the last two columns in the table). Strikingly, there is no statistical significance to the trend of appreciation against the basket, let alone to acceleration in that trend. Rather the action comes from the decline in the weight on the dollar.
Could the steady decrease in the dollar weight that we find produce important flexibility in the future if it continues? It is hard to judge the importance of the parameter estimates by just looking at them, especially for estimates from a non-linear specification. So we calibrate what the implied path for the weight on the dollar would be out into the future, extrapolating the trend of our sample period based on the last column in the table. Figure 5 reveals the shift away from the dollar to be painfully slow over a five year period: starting at .98 in 2005, the dollar weight would fall only to .87 by 2010. 3.3 Other extensions Some extensions of the empirical estimates allow us to gain more confidence in the findings. 3.3.1 Method of moments
Bénassy-Quéré, Coeuré, and Mignon (2004) propose a modification of the Frankel-Wei methodology based on a method of moments approach. The advantage of the modification is that it does not depend on the choice of a numeraire currency. As a robustness exercise, we apply the Bénassy-Quéré et al approach to the Chinese currency data. We take as given the eleven currencies that the Chinese central bank says are in the basket, impose the restriction that the weights in the basket sum to one, and estimate by GMM. We experimented with different sets of lagged regressors as the instrumental variables [skipping
27
the first lag to avoid contamination from possible first-order serial correlation]. Unfortunately, it is generally difficult for the estimation to converge in our sample.
As an alternative, we focus on the set of first-tier currencies in China’s announced basket, namely, the dollar, the yen, the euro, and the Korean won. This time, we do obtain convergence. There is also a decline in the weight on the US dollar by this approach, though the decline is more moderate than in the previous estimation, from 0.97/0.98 in the first and second subperiods to 0.91 in the last subperiod. As before, the Korean won receives some positive weight, especially in the latest subperiod, and there is little sign of positive weight on the euro or yen. 3.3.2 Intra-daily movements
It is possible that the RMB regime governing intra-day exchange rate movement is different from that governing day to day or month to month movement. In particular, the regime announced in July 2005 sets a limit on intra-day movement, leaving the possibility that the rules governing the change from daily close to the following day’s open quotes could be different. Unfortunately, as RMB trading is relatively thin, there are generally too few observations to perform a regression based on one day’s data. So we have to pool intra-day data together.
We have collected intra-day data (quotes at 15 minute intervals) for two periods: July 22 – August 25, 2005, and February 16 – May 17, 2006. In a given 15 minute interval, say, 10:00-10:15 am, the exchange rate is the last quote during the interval. If there is no active quote available, then the most recently available quote is used. For a very active currency, say the euro, the quote is likely to take place at or close to 10:15 am. However, for a thinly traded currency, such as the RMB, the actual time of the quote could be much earlier. It is useful to bear in mind that this potential mismatch in timing among the different exchange rates introduces noise into our estimation.
Table 8 reports a sequence of estimation using 15-minute exchange rates and the SDR as the numeraire currency.39 If one focuses on the four first-tier currencies in the Chinese basket, one sees that the weight on the dollar is very high throughout the sample, virtually 99-100% in all sub-periods. If one uses all 11 currencies as candidate currencies in the basket, then the weight on the dollar fluctuates (between 0.51 in the very last sub-period to nearly 1 in the second-to-the last sub-period).40
These results are consistent with the interpretation that the intra-day RMB regime may be somewhat different from the day to day or month to month regime. Within a day, the dollar weight is likely to be high and close to 1, now as in 2005. However, from day to day, the dollar weight may have declined subsequent to the first months after the July 2005 announcement.
39 The SDR rate is reported once a day by the International Monetary Fund. However, since its composition is fixed in the sample except for a one-time discrete adjustment of the currency weights on January 1, 2006, we can compute its intra-day rate vis-a-vis the dollar based on the intra-day exchange rates of the currencies that make up the SDR. 40 Table 23A in the working paper repeats these estimation but using the Swiss franc as the numeraire currency.
28
3.4 Conclusions regarding the recent Chinese exchange rate regime
To summarize our findings, within 2005 there was very little change in the de facto
regime despite the announced policy change in July of that year. Not only did the true weight on the dollar in the basket remain close to 1, but the tightness of the fit was similar to that of the Hong Kong dollar, which is on a currency board! 42 In 2006, the de facto regime began to put a significant, but still small, weight on some non-dollar currencies. These were not primarily the yen or euro as one would expect, but rather the currencies of other Asian developing countries (the won and the ringgit) which themselves do not float freely against the dollar. Moreover, these weights were still small and the peg was still tight. The small increase in flexibility that we have seen could be important only if it were a harbinger of more to come. This is likely, as Chinese leaders gradually become more comfortable with the idea.
Reporting in the financial press has focused on the appreciation of the RMB against
the dollar. The focus is understandable, both because this is the question of political interest, and because looking at a graph of the dollar/yuan exchange rate (e.g. in Figure 2) seems to tell a clean story of an appreciation trend that, though starting out very small, has been gradually escalating in an exponential way. If this accelerating trend were in fact deemed part of the current regime, one could extrapolate it and predict more serious appreciation in the future.
Our results, however, suggest that the regime probably is not best described as a dollar peg with a trend appreciation, let alone a gradually accelerating trend. The findings of Section 3.2.6 are the sharpest on this point. Rather, the regime is better described as a basket peg with weights on non-dollar currencies that, though starting out very small in 2005, rose gradually in 2006. The difference in characterizations of the regime could make a big difference for the future. Our results suggest that if the Korean won and Malaysian ringgit stop appreciating against the dollar, or even begin to reverse, so will the Chinese currency. In any case, the evidence supports the hypothesis of small steps away from the dollar link more than small steps toward appreciation per se. This ultimately may not be enough to appease the US Treasury or, especially, the US Congress.
This adds to the onus on the IMF to deal with the yuan/dollar question. Multilateral institutions and international law are more relevant to this issue than is the case with most big-power issues realistically speaking. The Members originally intended the Fund, not national authorities, to judge manipulation. More recently, the institution was given a reinforced mandate in the spring of 2006, both by its governing body and – perhaps more importantly -- by the G-7. The mandate was to reconsider the 1977 Decision and thereby expand the surveillance described in the Articles of Agreement beyond the World Economic Outlook and bilateral Article IV consultations, and to look into the issue of global current account imbalances through a multilateral consultation process. In practical terms, this
42 As often with countries said to be on a currency board, Hong Kong SAR’s regime differs in some ways from a pure idealized currency board.
29
means that the US Treasury in 2006 passed the RMB hot potato on to the IMF, giving that institution a rare potential opportunity to pass judgment or at least help broker a multilateral agreement over the Chinese currency and also G-7 imbalances.43 Many economists identify G-7 imbalances as far more a result of deficient US national saving than of China’s support of the dollar against its own currency.44 A cooperative agreement might entail concrete steps by the US government to raise national saving, together with a decision by China jointly with other Asian countries, and oil-exporters which are running even larger surpluses, to allow their currencies to appreciate simultaneously. Europe would have a role as well.45 Negotiations over such an agreement cannot take place in the G7 because China, Korea, and the others are not members. The IMF is the logical place.
Agreeing on such multilateral cooperation will not be easy. Both sides will be reluctant to make the necessary concessions. The United States is not likely to give up easily on the politically attractive idea that China bears some responsibility for its trade deficit, represented numerically by the bilateral deficit. Congress deliberately intended to legitimize the bilateral deficit in the 1988 law, however the IMF Articles of Agreement define manipulation. China for its part is not likely to give up easily on the idea that it has the sovereign right to move as slowly on currency reform as it deems in its interest. But both sides also have something important to lose if the issue is not settled. China’s leaders run the danger of losing free access to a very large and important export market. The US leaders run the risk of the political momentum behind the scapegoat strategy backfiring, in the form of either self-inflicted protectionist legislation or a hard landing for the dollar and US securities in global financial markets. The RMB/dollar rate and associated imbalances constitute a better subject for multilateral surveillance and international cooperation than any subject to come along in many years, and it is more likely to be amenable to progress in the forum of the IMF than anywhere else. If nothing else, this process might help delay and deflect protectionist fervor in the US Congress.
43 To Mervyn King (2006), the IMF either takes this opportunity or else is out of a job. The US Treasury also supported a strengthening of IMF surveillance: in Adams (2006) and US Treasury (2006a), e.g., by making more explicit the definition of “protracted large-scale intervention.” The IMF Managing Director responded to the new mandate with a process to review surveillance, both bilateral and multilateral, as part of his Medium-Term Strategy for the Fund. 44 Frankel (2006b) considers the various arguments. 45 Traditionally the part of European policymakers is to agree to make their goods and labor markets more flexible. Perhaps a more realistic European contribution to the package could be an agreement to stand by in the event that the dollar goes into uncontrolled freefall, ready to buy up dollars to put a reasonable floor under its value. Talk of a “new Plaza Agreement” could be dangerous unless there is also a “new Louvre Agreement” waiting in the wings.
30
References
Adams, Tim, 2006, “Working with the IMF to Strengthen Exchange Rate Surveillance,” remarks by Treasury Undersecretary for International Affairs, Feb. 2.; www.treas.gov/press/releases/js4002.htm. Bénassy-Quéré, Agnès, 1999, “Exchange Rate Regimes and Policies: An Empirical Analysis,” in Exchange Rate Policies in Emerging Asian Countries, edited by Stefan Collignon, Jean Pisani-Ferry, and Yung Chul Park (Routledge: London), 40-64. Bénassy-Quéré, Agnès, Benoit Coeuré, and Valérie Mignon, 2004, “On the Identification of de facto Currency Pegs,” Journal of Japanese and International Economies. Bergsten, C.Fred, 1989, “Currency Manipulation? The Case of Korea,” Statement before the Committee on Finance, Subcommittee on International Trade,” United States Senate, May 12. Bergsten, C.Fred, 2006, Testimony before the Hearing on US-China Economic Relations Revisited, Committee on Finance, United States Senate, March 29. Boughton, James, 2001, Silent Revolution: The International Monetary Fund 1979–1989 (International Monetary Fund: Washington). October 1, 2001. Bubula, Andrea, and Inci Otker-Robe (2002) Exchange Arrangements and Foreign Exchange Markets: Development and Issues, Monetary and Exchange Affairs Department, IMF, 2003. Calvo, Guillermo, and Carmen Reinhart, 2002, “Fear of Floating,” Quarterly Journal of Economics, 117, no. 2, May, 379-408. Cooper, Richard, 2005, “Living with Global Imbalances: A Contrarian View,” Policy Brief No. 05-3, Institute for International Economics, December. De Vries, Margaret, 1986, The IMF in a Changing World, 1945-1985. (International Monetary Fund: Washington) June 15, 1986. Eichengreen, Barry, 2006, "China's Exchange Rate Regime: The Long and Short of It," revision of paper for Columbia University's conference on Chinese money and finance held in New York on February 2-3. Frankel, Jeffrey, 1984, "The Yen/Dollar Agreement: Liberalizing Japanese Capital Markets," Policy Analyses In International Economics No.9, M.I.T. Press for Institute for International Economics: Washington, D.C.. Frankel, Jeffrey, 1993a, "Foreign Exchange Policy, Monetary Policy and Capital Market Liberalization in Korea," in Korean-US Financial Issues, Joint Korea-US Academic Symposium Vol. 3, Chwee Huay Ow-Taylor, ed., Korea Economic Institute of America, Washington, D.C., 91-107. Frankel, Jeffrey, 1993b, "Liberalization of Korea's Foreign Exchange Markets, and the Role of Trade Relations with the United States," in Shaping a New Economic Relationship: The Republic of Korea and the United States, Jongryn Mo and Ramon Myers, eds., Hoover Institution Press, Stanford, CA: 120-142. Frankel, Jeffrey, 1993, "Is Japan Creating a Yen Bloc in East Asia and the Pacific?" in Regionalism and Rivalry: Japan and the US in Pacific Asia, edited by Jeffrey Frankel and Miles Kahler, University of Chicago Press, Chicago, 53-85. Frankel, Jeffrey, 2006a, “On the Yuan: The Choice Between Adjustment Under a Fixed Exchange Rate and Adjustment under a Flexible Rate,” in Understanding the Chinese Economy, edited by Gerhard Illing (CESifo Economic Studies, Munich). NBER WP No. 11274.
Frankel, Jeffrey, 2006b, “Global Imbalances and Low Interest Rates: An Equilibrium Model vs. a Disequilibrium Reality -- Comments on Caballero, Farhis and Gourinchas,” BIS Annual Research Conference, Brunnen, Switzerland, June 19-20. Frankel, Jeffrey, Sergio Schmukler and Luis Servén, 2000, ”Verifiability and the Vanishing Intermediate Exchange Rate Regime,” Brookings Trade Forum 2000, edited by Susan Collins and Dani Rodrik (Brookings Institution, Washington DC). Frankel, Jeffrey, and Shang-Jin Wei, 1994, “Yen Bloc or Dollar Bloc? Exchange Rate Policies of the East Asian Economies,” in Macroeconomic Linkages: Savings, Exchange Rates and Capital Flows, Takatoshi Ito and Anne O. Krueger, eds., Chicago: University of Chicago Press, 295-329. Frankel, Jeffrey, and Shang-Jin Wei, 1995, "Emerging Currency Blocs," The International Monetary System: Its Institutions and its Future, Hans Genberg, ed., Springer, Berlin, 111-143. Frankel, Jeffrey, and Shang-Jin Wei, 2006, “Currency Mysteries,“ May 28. Goldstein, Morris, 2003, “China's Exchange Rate Regime,” Testimony before the Subcommittee on Domestic and International Monetary Policy, Trade, and Technology, Committee on Financial Services, US House of Representatives, Washington, DC, October 1. Goldstein, Morris, 2004, “Adjusting China’s Exchange Rate Policies,” High-Level Seminar, Dalian, China, May 26-27. Working Paper 04-1, Petersen Institute for International Economics, Washington, DC. Goldstein, Morris, 2007, “Assessing Progress on China’s Exchange Rate Policies,” Testimony before the Hearing on Risks and Reform: the Role of Currency in the US-China Relationship, “ US Senate Finance Committee, Washington DC, March 28. Goldstein, Morris, and Nicholas Lardy, 2003, “Two-Stage Currency Reform for China,” Wall Street Journal, September 12.
Goldstein, Morris, and Nicholas Lardy, 2005, “China's Role in the Revived Bretton Woods System: A Case of Mistaken Identity,” WP 05-2, Petersen Institute for International Economics, Washington, DC.
Haldane AG, and SG Hall, 1991, “Sterling’s Relationship with the Dollar and the Deutschemark: 1976-89,” The Economic Journal, 101: 436-443. International Monetary Fund, 2006a , “Article IV of the Fund’s Articles of Agreement: An Overview of the Legal Framework,” Legal Department, June 28. International Monetary Fund, 2006b, “People’s Republic of China: 2006 Article IV Consultation – Staff Report,” IMF Country Report No. 06/394, October. International Monetary Fund, 2006c, “Selected Decisions and Selected Documents of the IMF, Thirtieth Issue – Surveillance over Exchange Rate Policies, Legal Department, updated June 30. Jen, Stephen, 2005, “Chinese RMB Basket Still a Mystery,” Global Economics Forum, Morgan Stanley, August 19. King, Mervyn, 2006, “Through the Looking Glass – Reform of the International Institutions,” Inaugural Distinguished Lecture, Governor of the Bank of England, to the Melbourne Centre for Financial Studies, 21 December.
Levy-Yeyati, Eduardo, and Federico Sturzenegger, 2003, “To Float or to Trail: Evidence on the Impact of Exchange Rate Regimes,” American Economic Review, 93, No. 4, Sept.. McKinnon, Ronald, 2006, “Comment” in response to “Request for Public Comments on the Report to Congress on International and Exchange Rate Policies,” Stanford University, April McKinnon, Ronald, and Gunther Schnabl, 2003, “The East Asian Dollar Standard, Fear of Floating, and Original Sin,” Stanford University, September. McKinnon, Ronald, and Gunther Schnabl, 2004, “The Return to Soft Dollar Pegging in East Asia: Mitigating Conflicted Virtue,” International Finance 7, pp. 169-201. Mundell, Robert, 2004, “Adjustment in China’s exchange rate regime,” remarks at Inaugural Seminar on Foreign Exchange System,” Dalian, China, May 26-27. Noland, Marcus, 1997, "Chasing Phantoms: The Political Economy of USTR," International Organization, Summer. Ogawa, Eiji, 2006, "The Chinese Yuan after the Chinese Exchange Rate System Reform", China & World Economy, Vol. 14, no.6, Nov.-Dec. 2006, pp.39-57. Ohno, Kenichi, 1999, “Exchange Rate Management in Developing Asia," Working Paper No.1. (January), Asian Development Bank Institute. Prasad, Eswar, and Shang-Jin Wei, 2005, “The Chinese Approach to International Capital Flows: Patterns and Possible Explanations,” NBER Working Paper 11306. Forthcoming as a chapter in S. Edwards, ed, Reinhart, Carmen, and Kenneth Rogoff (2004) “The Modern History of Exchange Rate Arrangements: A Reinterpretation.” Quarterly Journal of Economics, 119(1):1-48.. Roubini, Nouriel, 2007, “Why China Should Abandon Its Dollar Peg,” RGE Monitor, January . Shah, Ajay, Achim Zeileis, and Ila Patnaik, 2005, “What is the New Chinese Currency Regime?” Unpublished, November. Shambaugh, Jay, 2004, “The Effect of Fixed Exchange Rates on Monetary Policy,” Dartmouth College; forthcoming, Quarterly Journal of Economics. Snow, John, 2003, Testimony of Treasury Secretary Before the Senate Committee on Banking, Housing and Urban Affairs, October 30. Taylor, John B., 2003, "China’s Exchange Rate Regime and its Effects on the US Economy," Under Secretary of Treasury for International Affairs’ Testimony before the Subcommittee on Domestic and International Monetary Policy, Trade, and Technology House Committee on Financial Services, October 1. US Treasury Department, 2005, “Semiannual Report on International Economic and Exchange Rate Policies,” November. US Treasury Department, 2006, “Semiannual Report on International Economic and Exchange Rate Policies,” May. Yamazaki, Kazuo, 2006, “Inside the Currency Basket,” Columbia University and Mitsubishi UFJ Trust and Banking Corp., December.
33
Zhou, Xiaochuan, 2005, Governor’s speech at the opening of the Shanghai headquarters of the People’s Bank of China (in Chinese), www.hexun.com, August 10 (accessed 8/25/05). Speech (in English) on PBoC website: http://www.pbc.gov.cn/english//detail.asp?col=6500&ID=82.
-0.616 -0.745* -0.591 -0.694* 0.350 -0.243 Partner’s real exchange rate relative to PPP
(ppp) (0.415)
(0.424)
(0.411)
(0.413)
0.006 -0.015 0.008 -0.008 3.050 -0.025
Partner country’s change in reserves/
GDP ratio (res)
(0.021)
(0.025)
(0.020)
(0.022)
US unemployment rate 0.092 0.149* (0.078) (0.082)
Election year dummy 0.107* 0.096 (0.056) (0.062)
0.022** 0.022** 2.604 0.059 US unemployment rate * Election year dummy (0.010) (0.011)
Period Dummies no no no no Observations 2009 1721 2009 1721
Pseudo R-squared 0.17 0.21 0.17 0.20 Notes: a) Robust standard errors in parentheses (clustered by country) b) * significant at 10%; ** significant at 5%; *** significant at 1% (1) Using all 63 countries; (2) Excludes Algeria, Kuwait, Mexico, Nigeria, Norway, Russia, Saudi Arabia, United Arab Emirates and Venezuela.
35
Table 2: Adding Previous Report’s Finding
Ordered Probit, Oct. 1988 ~ Dec. 2006
(1) (2) (3) (4) (5)
Variable Full sample
Excluding oil
exporters Asian 15 SD of
variable
Standardized Response =
Coeff.est. from (2) x SD from (4)
-0.724** -0.719** -0.593*** 0.1568 -0.1127 US bilateral goods trade balance with partner country (tb)
(0.301)
(0.307)
(0.230)
0.039*** 0.060*** 0.043** 5.1593 0.3082 Partner country’s Current account/GDP ratio (ca)
0.223 0.213 0.212 0.4497 0.0957 US Election Year dummy (0.139) (0.148) (0.156) Previous finding † 3.212*** 3.156*** 2.715*** 0.2143 0.6764 (0.231) (0.233) (0.194) Period Dummies no no no Observations 2009 1721 473 Pseudo R-square 0.58 0.59 0.46
Notes: a) Robust standard errors in parentheses (clustered by country) b) * significant at 10%; ** significant at 5%; *** significant at 1% (1) Using all the 63 countries; (2) Excludes Algeria, Kuwait, Mexico, Nigeria, Norway, Russia, Saudi Arabia, United Arab Emirates and Venezuela; (3) Includes Bangladesh, China, Hong Kong SAR, India, Indonesia, Japan, South Korea, Malaysia, Pakistan, Philippines, Russia, Singapore, Sri Lanka, Taiwan, Province of China and Thailand. † Dummy equals one if a country was investigated during last report.
36
Table 3: Ordered Probit Regressions with Period Dummies, Oct. 1988 ~ Dec. 2006 (1) (2) (3) (4) (5) (6)
Full sample
Excluding oil exporters
Asian 15 Asian 8 Standard Deviation of Variable
Standardized Response = Coeff.est. from (2) x SD from (5)
-1.109*** -1.212*** -1.049*** -0.827*** 0.177 -0.215 US bilateral goods trade balance with partner country (tb) (0.234) (0.192) (0.274) (0.307)
0.059*** 0.092*** 0.078*** 0.059** 5.171 0.474 Partner country’s Current account/GDP ratio (ca) (0.017) (0.028) (0.030) (0.027)
0.063*** 0.047** 0.033 0.025 3.038 0.144 Partner country’s change in reserves/GDP ratio (res) (0.017) (0.020) (0.022) (0.023) Previous finding † 4.060*** 3.952*** 3.666*** 3.477*** 0.215 0.849 (0.383) (0.400) (0.401) (0.426) Period Dummies yes yes yes yes Observations 2072 1775 488 290 Pseudo R-square 0.67 0.68 0.58 0.53 Notes: a) Robust standard errors in parentheses (clustered by country) b) * significant at 10%; ** significant at 5%; *** significant at 1% (1) Using all the 63 countries; (2) Excludes Algeria, Kuwait, Mexico, Nigeria, Norway, Russia, Saudi Arabia, United Arab Emirates and Venezuela; (3) Includes Bangladesh, China, Hong Kong SAR, India, Indonesia, Japan, South Korea, Malaysia, Pakistan, Philippines, Russia, Singapore, Sri Lanka, Taiwan, Province of China and Thailand; (4) Includes China, Hong Kong SAR, Japan, South Korea, Malaysia, Russia, Singapore and Taiwan, Province of China. † Dummy equals one if a country was investigated during last report.
37
Figures and Tables for Part 3: Estimating the Implicit Weights in the Chinese RMB Basket
Figure 3: Fluctuations in CNY/USD exchange rate
-.002
0.0
02.0
04ln
(cny
)-ln
(cny
[_n-
1])
01 Jul 05 01 Jan 06 01 Jul 06 01 Jan 07date
Changes in CNY per USD over Time: 07/22/05-1/8/2007
Figure 4 Variability in Yuan/Dollar Exchange Rate
.000
2.0
004
.000
6.0
008
.001
Std
. Dev
. of C
hang
es in
CN
Y/U
SD
0 5 10 15 20Period
Every 20 days over 07/01/05-01/08/07Std. Dev. of Changes in CNY/USD
38
Table 4: Estimating the Implicit Basket Weights in Determining the Yuan (07/22/2005 – 01/08/2007)
(numeraire currency = SDR)
Sub-period Whole sample (1) (2) (3) (4) (5) (6)
US Dollar 0.904** 0.997** 0.968** 0.695** 0.947** 0.867** 0.886** (0.021) (0.034) (0.031) (0.050) (0.045) (0.134) (0.087)
Table 5: Trend appreciation of the Yuan and trend change in the dollar weight Whole Sample (07/22/2005 – 01/08/2007, Numeraire currency =SDR) (2) (3) (4) (5) (6) (7) (8) (9)
Notes: 1). Standard errors in parentheses; * significant at 10%; ** significant at 5%;
2). Change in the log value of the target currency is regressed on changes in the
log values of other currencies;
3). Data Source: Bloomberg daily closing price, New York.
40
Table 6: Pressure from the US as a Determinant of the Chinese Exchange Rate Whole Sample (07/22/2005 – 01/08/2007, Numeraire currency =SDR) (1) (2) (3) US Dollar 0.904** 0.983** 0.983** (0.021) (0.030) (0.030) Euro -0.006 -0.006 -0.006 (0.014) (0.014) (0.014) Japanese Yen 0.009 0.009 0.010 (0.009) (0.009) (0.009) Korean Won 0.003 0.000 0.001 (0.009) (0.009) (0.009) Singapore Dollar -0.020 -0.018 -0.019 (0.020) (0.020) (0.020) British Pound -0.004 -0.008 -0.007 (0.011) (0.011) (0.011) Malaysia Ringgit 0.053** 0.037** 0.037** (0.015) (0.016) (0.016) Russia Ruble -0.017 -0.015 -0.014 (0.021) (0.021) (0.021) Australian Dollar -0.004 -0.001 -0.002 (0.008) (0.008) (0.008) Thailand Baht 0.006 0.009 0.009 (0.010) (0.010) (0.010) Canadian Dollar 0.004 0.002 0.003 (0.008) (0.007) (0.007) US Complaint 0.004 0.004 (0.003) (0.003) US Complaint* USD -4.493** -4.508** (1.219) (1.217) Constant 0.00002 0.00009** 0.00001 (0.00006) (0.00003) (0.00006) Observations 383 383 383 Root MSE 0.00055 0.00054 0.00054 R-squared 0.95 0.95 0.96 Notes: 1. Standard errors in parentheses;* significant at 10%; ** significant at 5% 2. Treasury in columns (1)-(6) are: Cumulative Treasury report/1000, 3. Other in Columns (1)-(6) are: Cumulative Other report/1000 4. US Complaint = Treasury Complaint + Other Complaint
Table 7: Allowing for trends in level and (nonlinearly) in the currency weights, while imposing throughout the constraints that the weights sum to 1 (1) (2) (3) (4) OLS OLS Non-linear LS Non-linear LS USD 0.982** 0.982** 0.982*** 0.982***
(0.042) (0.042) (0.042) (0.042)
Japanese Yen 0.0004 0.0004 0.0004 0.0004 (0.0165) (0.0165) (0.0165) (0.0165)
Korea Won 0.0114 0.0114 0.0114 0.0114 (0.0179) (0.0179 (0.0179) (0.0179)
Malaysia Ringgit 0.0155 0.0154 0.0155 0.0154 (0.039) (0.039) (0.039) (0.039)
USD*Trend -0.00029* -28.91* Not identified -28.9(0.00017) (16.79) (imposed)
Japanese Yen*Trend 0.00002 1.946 6.874 1.945 (0.00008) (8.284) (29.5) (8.341)
Korea Won*Trend 0.00004 4.005 14.2 4.003 (0.00009) (8.750) (29.7) (8.409)
Malaysia Ringgit*Trend 0.0002 20.2 71.5* 20.2* (0.0001) (15.0) (29.7) (8.4)
Observations 383 383 383 383R-squared 0.987 0.987 0.987 0.987Notes: * significant at 10%; ** at 5%; ** at 1% (Standard errors reported in parentheses.) The constraint that the weights sum to 1 is imposed by subtracting the change in € from all exchange rates. Eqn (1). OLS, Trend = Trend2 =t(j), t= 0 (for July 22, 2005), 1, 2, etc Eqn.(2). OLS, Trend=1-exp(-d *t), where d is set to be 0.00001, Trend2=t Eqn. (3) Non-linear least squared estimation Eqn. (4) Non-linear LS. Set the coefficient on USD*trend =-28.9 (which is the point estimate in Column 2)
4). Data Source: Bloomberg intra-day closing price, New York.
43
Figure 5: Extrapolation of the estimated nonlinear time trend in the weight on the dollar in the Chinese basket
Weight on the dollar
0.80.820.840.860.88
0.90.920.940.960.98
1
7-200
5
1-200
6
7-200
6
1-200
7
7-200
7
1-200
8
7-200
8
1-200
9
7-200
9
1-201
0
7-201
0
month-year
Weight on the dollar over time = b0(USD) + b1(USD) [1- exp(-d*t)] where b0(USD) = 0.982, b1(USD) = -28.9, and d = 0.00001, based on the estimates from a non-linear regression, reported in the column (4) of Table 7.
DATA APPENDIX for Part 2 [Revised – 3/30/2007 ] Treasury Department Report to Congress on International Economic and Exchange Rate Policy: 31 reports have been released since 1988. Recent reports are available on the Treasury website while older reports were obtained from the American Statistics Index (ASI) Microfiche Library held in the Government Documents section of the Lamont Library at Harvard. They are catalogued under the number 8002-14 for each year. We classify as zero countries that are not identified in the Treasury reports as having been examined at all. Potential exchange rate manipulators can be broken into three categories. (1) “economies were closely examined as potential exchange rate manipulators if they had significant global current account surpluses and bilateral surpluses with the United States and maintained a fixed or actively managed exchange rate system during the period of this report” (this is the language used in the reports from 1999-2001). For some of these economies, (2) Treasury recommends policy changes or indicates that it has commenced discussions with their governments. Finally, (3) Treasury can escalate to officially designating an economy as a currency “manipulator”. These categories have been applied to eight economies since publication of the reports commenced in 1988: China, Taiwan, Province of China, South Korea, Singapore, Hong Kong SAR, Malaysia, Japan and Russia. The data are included in the following table:
Economies Examined as Potential Currency Manipulators
In the Probit specification in Table 6, the limited dependent variable is defined in two ways. In the first two columns of the table, the dependent variable is whether the economy has been named as an exchange rate manipulator (mapping from the classification in the data appendix table: value of 0 if 0, 1 or 2; value of 1 if 3). In the last two columns of the table, the dependent variable is whether Treasury has at least recommended policy changes or is conducting discussions with the government (value of 0 if 0 or 1; value of 1 if 2 or 3). The ranks for April 2006 are based on the predicted values using data for the period up to December 2005. The probability next to each ranked country refers to the probability of a positive outcome in April 2006. Table 7 reports that China is generally a higher probability target than any other country. Explanatory variables: The 63 countries/economies included in the dataset are: Algeria, Argentina, Australia, Austria, Bangladesh, Belgium, Brazil, Canada, Chile, China, Colombia, Costa Rica, Denmark, Dominican Republic, Ecuador, Egypt, El Salvador, Germany, Finland, France, Gabon, Greece, Guatemala, Honduras, Hong Kong SAR, Hungary, India, Indonesia, Ireland, Israel, Italy, Ivory Coast, Jamaica, Japan, Korea, Kuwait, Malaysia, Mexico, Netherlands, New Zealand, Nigeria, Norway, Pakistan, Panama, Peru, Philippines, Poland, Portugal, Russia, Saudi Arabia, Singapore, South Africa, Spain, Sri Lanka, Sweden, Switzerland, Taiwan, Province of China, Thailand, Trinidad and Tobago, Turkey, United Arab Emirates, United Kingdom and Venezuela. The data are for the period reviewed by a particular report rather than the release date of the report to acknowledge the lags in real time data release. For example, the November 2005 report covers the first half of 2005, so the data corresponding to this report are for the period ending June 2005.
46
US bilateral goods trade balance with partner country: US goods exports minus US goods imports by country over 12 months as a ratio to US GDP. The trade data are obtained from the US Census Bureau and the GDP data from Global Financial Data. The series for Russia includes data for the USSR prior to 1993. Partner country’s current account: The current account (surplus is positive) of the partner country over 12 months as a ratio to the partner country’s GDP. The Current account data was obtained from the IMF’s International Financial Statistics (IFS) Database. Where data were unavailable in the IFS, data from the IMF’s World Economic Outlook (WEO) Database were used. The series for Russia prior to 1992 is a Commonwealth of Independent States and Mongolia series from the WEO Database. Partner’s Exchange rate relative to PPP: The PPP conversion rate to official exchange rate ratio, so a number less than 1 reflects undervaluation relative to PPP. The PPP conversion rate data were obtained from the WEO Database. The national currency per US dollar official exchange rate were obtained from the IFS Database. The official exchange rate for Taiwan, Province of China was obtained from Global Financial Data. Data for Argentina (prior to 1991), Brazil (prior to 1996), Ecuador (prior to 2005) and Peru (prior to 1993) are the PPP conversion factor to official exchange rate ratio from the World Bank’s World Development Indicators (WDI) Database. Partner country’s change in reserves: The 12 month change in the stock of foreign exchange reserves of the partner country. The foreign exchange reserves data were obtained from the IFS Database. Data for Taiwan, Province of China are for total reserves minus gold, also from the IFS database. Data for Russia prior to 1992 are for the USSR from BIS Annual Reports 1989-1994. Data for Hong Kong SAR are unavailable prior to 1990. Partner country’s GDP and GDP (PPP): The data were obtained from the WEO Database. The series for Russia prior to 1992 is a Commonwealth of Independent States and Mongolia series from the WEO database. Partner country’s imports: Imports C.I.F. data were obtained from the IFS database. The series for Russia prior to 1992 is a USSR/Commonwealth of Independent States merchandise imports series from the WTO. US unemployment rate: data obtained from BLS. US GDP growth: Year ended growth in US real GDP. Data obtained from BEA. Presidential election year: A dummy variable where the two reports prior to a Presidential Election receive a 1 while other reports receive a zero.