57
Assessing College Wide SLOs using a Student Perception Survey: A Tale of Two SLOs Jeanne Edman and Brad Brazil Cosumnes River College
| Date post: | 26-Dec-2015 |
| Category: |
Documents |
| Upload: | moris-daniels |
| View: | 218 times |
| Download: | 1 times |

Assessing College Wide SLOs using a Student Perception Survey: A Tale of Two SLOs
Jeanne Edman and Brad Brazil Cosumnes River College

Major goal of study:
I. Assess two college wide SLOs using a student perceptions survey: A. “Be actively involved in campus life and
express a sense of engagement with the campus culture.”
B. “Develop a foundation for cultural pluralism, a rejection of previous personal prejudices, and knowledge of and comfort with others unlike themselves.”
II. Examine whether student perceptions predict academic success

Academic success is linked to a feeling of campus belonging.
Campus climate is an important factor for academic success among ethnic minority students.
Academic self efficacy is associated with academic success.
Are these relationships true among community college students?

Little is known about the impact of student perceptions on academic success among community college students.
However, African American and Hispanic students have less success obtaining educational goals than Asian and White students.
We will assess two college wide SLOs by ethnicity

Who are our students?
Demographic characteristics of CRC Students

Ethnicity

Income
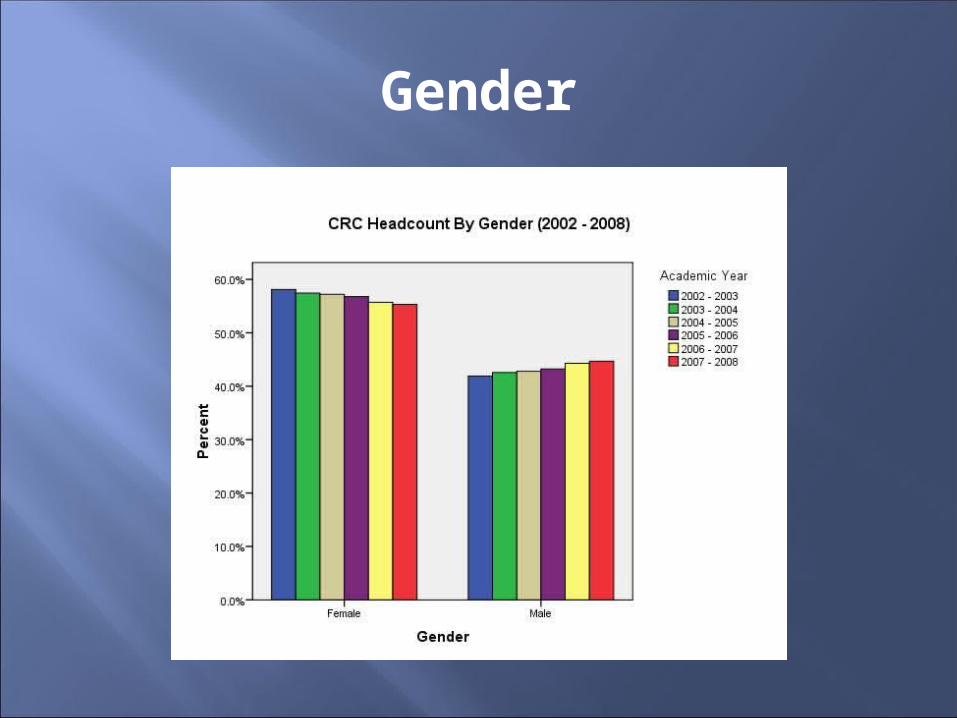
Gender

Age
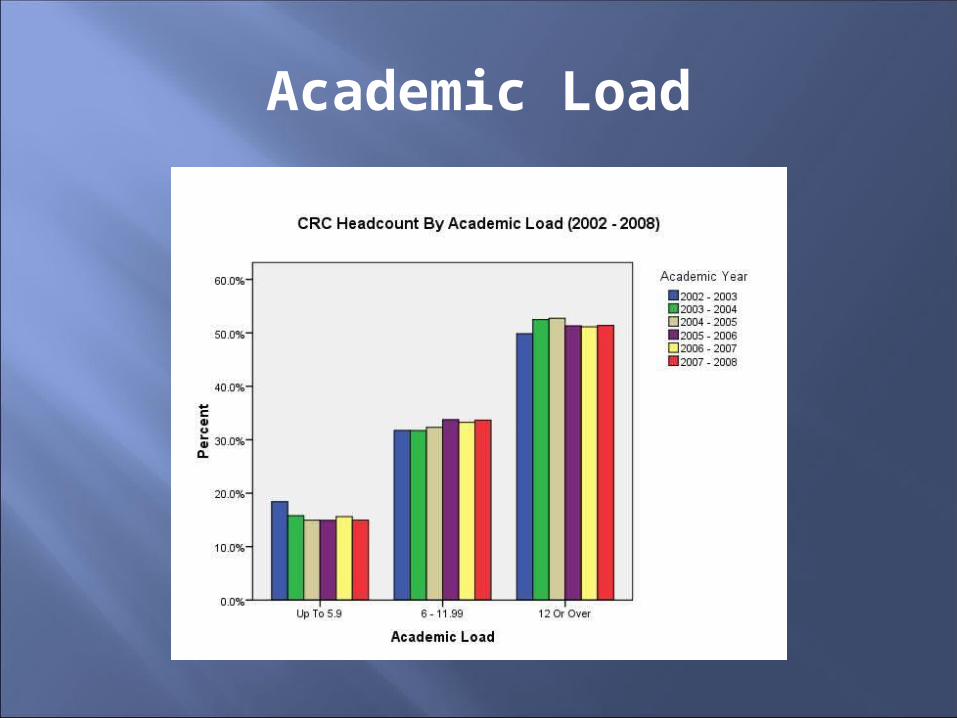
Academic Load

1703 students volunteered to complete the survey.
Demographic comparisons for 1513 students who provided student ID.
Courses represented all major divisions Questionnaire took approximately 10-15
minutes to complete.

Cultural Congruity (Gloria) Social Support (Peer and Mentoring,
Gloria) Academic Self Efficacy (Bandura) Campus Environment (Gloria) College wide SLOs were derived from
these instruments

Comparison of Social Items by the following ethnic groups:
Asian (N=552)African American (N=195)Caucasian (N=366)Latino (N=246)
The following slides include only the two extreme scores on the likert scales related to cultural fit and social support

SLO 1
“Be actively involved in campus life and express a sense of engagement with the campus culture.”

Question 1:
What percentage of students are involved in 4 or more student clubs or activities?
A. More than 60% B. 40-60% C. 20-39% D. 5-19% E. less than 5%

Question # 2
Approximately what percentage of students report having NO mentor?
A. 40% B. 50% C. 60% D. 70%

Question #3
Which ethnic group reports the highest number of friends on campus?
A. African American B. Asian C. Caucasian D. Latino

Question #4
Which ethnic group values their social life most?
A. African American B. Asian C. Caucasian D. Latino

01020
3040
5060
7080
90
Asian African Amer Caucasian Latino
none
more than 4

0
10
20
30
40
50
60
70
80
Asian African Amer Caucasian Latino
no one
4 or more

0
10
20
30
40
50
60
Asian African Amer Cacuasian Latino
no one
4 or more

0
5
10
15
20
25
30
35
Asian African Amer Caucasian Latino
no one
4 or more

0
10
20
30
40
50
60
Asian African Amer Cacuasian Latino
no one
4 or more

05
101520
2530
354045
Asian African Amer Caucasian Latino
not import
very import

Answers
1. E (less than 5%) 2. D (70%) 3. B (Asian) 4. B (Asian)

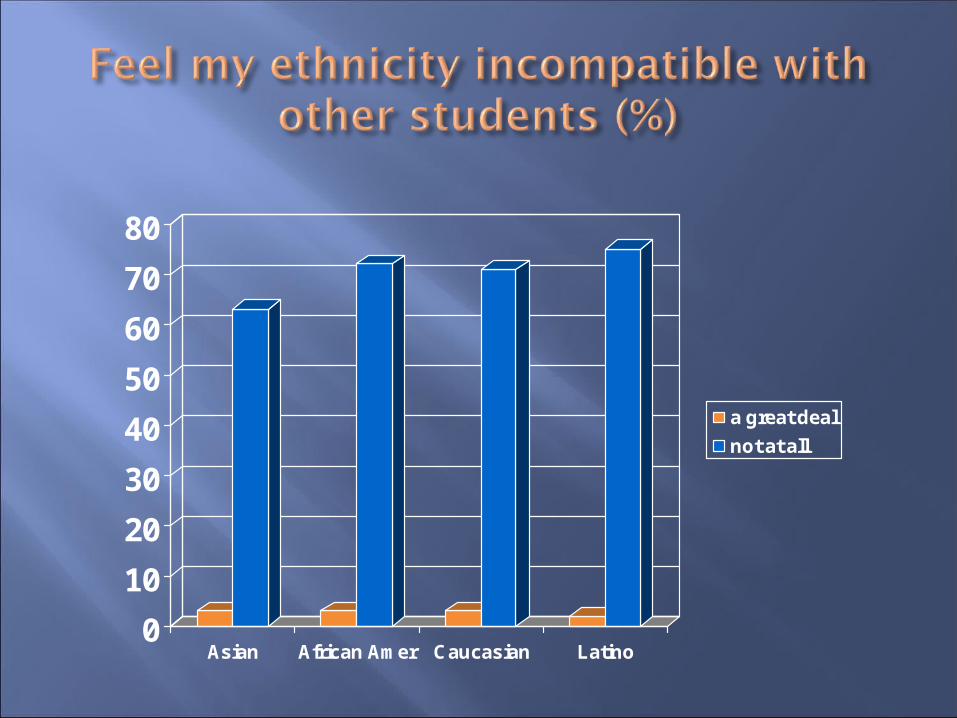
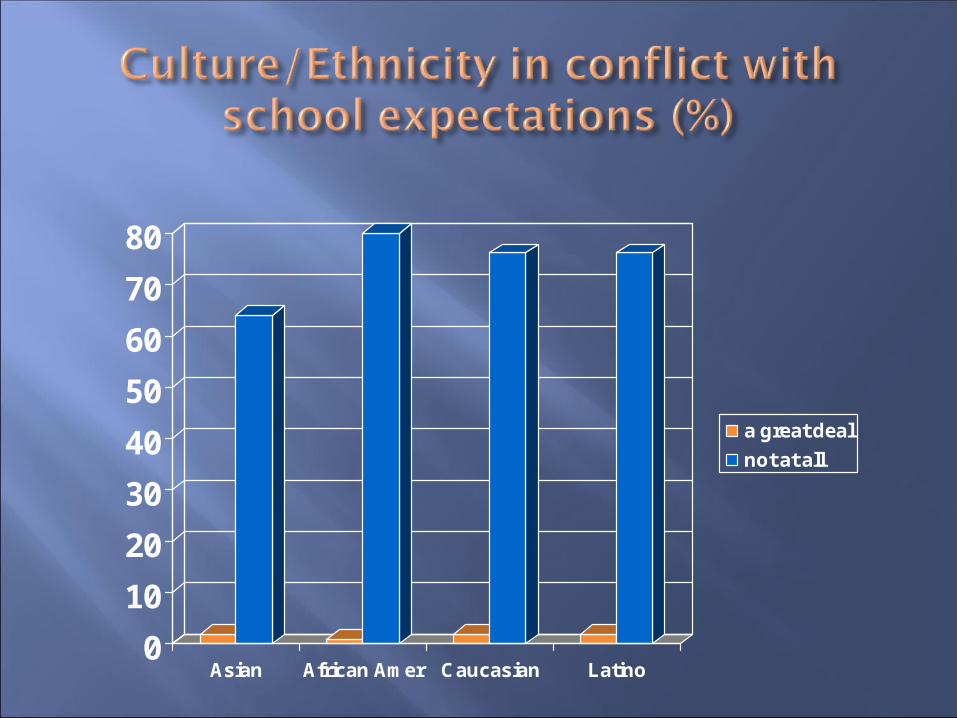
SLO 2: “Develop a foundation for cultural pluralism, a rejection of previous personal prejudices, and knowledge of and comfort with others unlike themselves.”

Question 1
Which ethnic group has the highest percentage that feel they have to change to fit in?
A. African Americans B. Asian Americans C. Caucasians D. Latinos

Question 2
Which cultural groups feel most accepted at CRC?
A. Asians and Caucasians B. Asians and Latinos C. African Americans and Latinos D. Latinos and Caucasians

Question 3 Approximately what percentage of
students feel that they do NOT have to change depending on the ethnicity of those they interact with?
A. 30% B. 40% C. 50% D. More than 60%

Question 4 Which cultural group has most difficulty
communicating school problems to family members?
A. African American B. Asian American C. Caucasian D. Latino

Question 5
Which ethnic rated the item, ‘as a member of my ethnic group, I feel I belong’ highest?
A. African American B. Asian American C. Caucasian D. Latino

0
10
20
30
40
50
60
70
80
Asian African Amer Caucasian Latino
a great deal
not at all

0
10
20
30
40
50
60
70
80
Asian African Amer Caucasian Latino
a great deal
not at all
0
10
20
30
40
50
60
70
80
Asian African Amer Caucasian Latino
a great deal
not at all

010
203040
5060
708090
Asian African Amer Caucasian Latino
a great deal
not at all
0
10
20
30
40
50
60
70
80
Asian African Amer Caucasian Latino
a great deal
not at all

0
10
20
30
40
50
60
Asian African Amer Caucasian Latino
a great deal
not at all

0
10
20
30
40
50
60
70
80
Asian African Amer Caucasian Latino
a great deal
not at all

0
10
20
30
40
50
60
70
80
Asian African Amer Caucasian Latino
a great deal
not at all

0
10
20
30
40
50
Asian African Amer Caucasian Latino
a great deal
not at all

0
10
20
30
40
50
60
Asian African Amer Caucasian Latino
a great deal
not at all

0
10
20
30
40
50
60
70
Asian African Amer Caucasian Latino
a great deal
not at all

Answers
1. B (Asian) 2. C (African American/Latinos) 3. D (more than 60%) 4. B (Asian) 5. A (African American)

Statistical differences as follows: Asians lower cultural congruity than other
groups African Americans higher academic self
efficacy than other groups African Americans lower GPA than other groups Latino lower GPA than Asians and Caucasians Asians higher social score than Caucasians

4949.5
5050.5
5151.5
52
52.553
53.5
Asian African Amer Caucasian Latino

0
1
2
3
4
5
6
7
8
Asian African Amer Caucasian Latino

0
0.5
1
1.5
2
2.5
3
Asian African Amer Caucasian Latino

49.550
50.551
51.552
52.5
5353.5
54
Asian African Amer Caucasian Latino

5
5.1
5.2
5.3
5.4
5.5
5.6
Asian African Amer Caucasian Latino

African Americans: No relationship between Cultural congruity, social support, mentoring, academic self efficacy and GPA.
Asians: Academic self efficacy correlated with GPA.
Caucasians: Cultural congruity positively correlated with GPA, social support negatively correlated with GPA.
Latinos: Mentoring and Academic efficacy correlated with GPA.

Explanations for low campus involvement
Very diverse community, many activities to participate in off campus/daily life
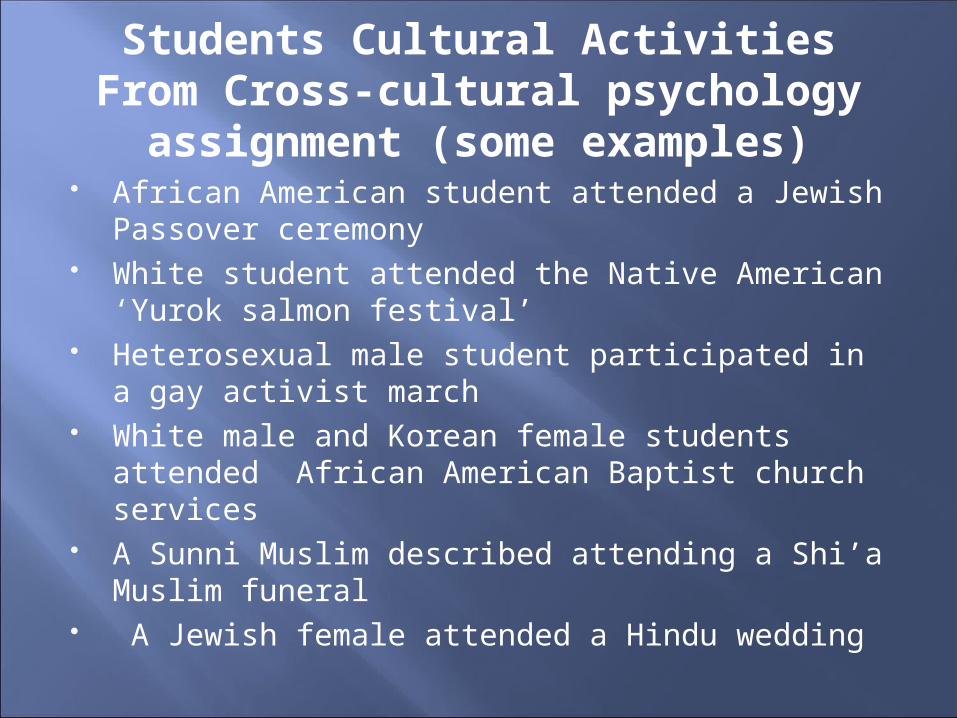
Students Cultural ActivitiesFrom Cross-cultural psychology assignment (some examples)
African American student attended a Jewish Passover ceremony
White student attended the Native American ‘Yurok salmon festival’
Heterosexual male student participated in a gay activist march
White male and Korean female students attended African American Baptist church services
A Sunni Muslim described attending a Shi’a Muslim funeral
A Jewish female attended a Hindu wedding

“As a returning student at 36 yrs of age, a lot of the social things are inconsequential to me. I work 40+ hours, am a single mom – don’t have a lot of time for much else. School has been motivating though and I can always find help”.
“I have no social life because I have to work (some people have kids). At most serious colleges, no one tries to make friends”.
“I’m not in school to really socialize. I just want to learn. Having a full time job makes it a bit difficult though”.

Fail to support previous findings among University students: in lack of relationship between student
perceptions and academic success among African Americans.
African Americans have the highest levels of cultural fit and academic efficacy.
Cultural congruity is associated with Academic success only among Caucasians.
Mentoring was not associated with Academic success among Asians, Caucasians and African Americans.

Assessing SLOs at the college level. Stimulating campus discussions on equity
issues. Obtaining student feedback as to the findings of
the survey. Development of student support programs and
courses. Providing data to support the planning process. Providing student perception data to improve
campus teaching and learning.

Data dissemination/Discussion
Presented the findings from the SLO/diversity survey to the following groups: Spring 2009.
Cultural competence committee Faculty senate College planning committee Student services administrators College assessment committee College research meeting
Why is social support and mentoring not associated with academic success?
How can you explain the lack of relationship between academic efficacy and GPA among African American and Caucasian students? What implications does this have for the classroom?
What are some possible explanations for the finding that cultural fit was only associated with GPA among Caucasian students?
What are some possible explanations for the lower cultural congruity scores among Asian students?


