Assessing conservation priorities: the African Vertebrates Databank (AVD) Istituto di Ecologia Applicata Via L.Spallanzani, 32 00161 Rome ITALY email: [email protected]Luigi Boitani Dept. Animal Biology, University of Rome
Transcript
Assessing conservation priorities: the African Vertebrates Databank (AVD)
Istituto di Ecologia ApplicataVia L.Spallanzani, 3200161 Rome ITALYemail: [email protected]
Luigi BoitaniDept. Animal Biology, University of Rome
Participating Institutions
• IUCN/SSC• Conservation International - CABS• Natural History Museum – London• University of Cambridge• Natural History Museum – Copenhagen• Birdlife International• Istituto di Ecologia Applicata• University of Rome
Project goals
• Produce a continental scale conservation tool for African vertebrates
• This major goal is achieved by:
– building a data bank on African vertebrates with the aim of providing the raw data for future applications and analyses on conservation options and priorities
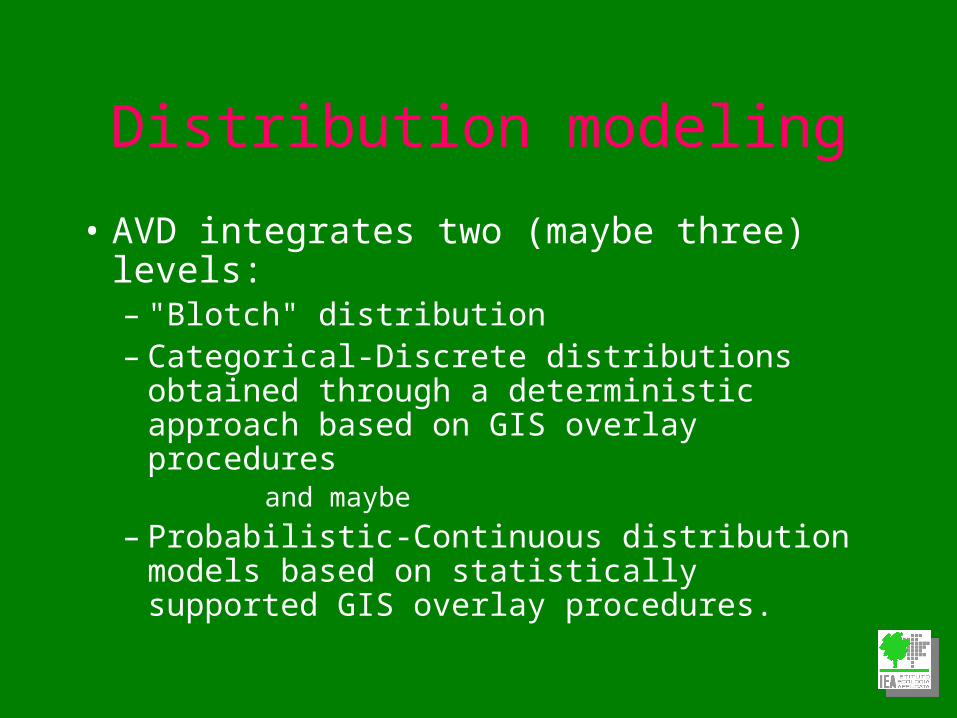
– modeling actual and potential species distribution
through a deterministic approach based on GIS overlay procedures
and maybe
– Probabilistic-Continuous distribution models based on statistically supported GIS overlay procedures.
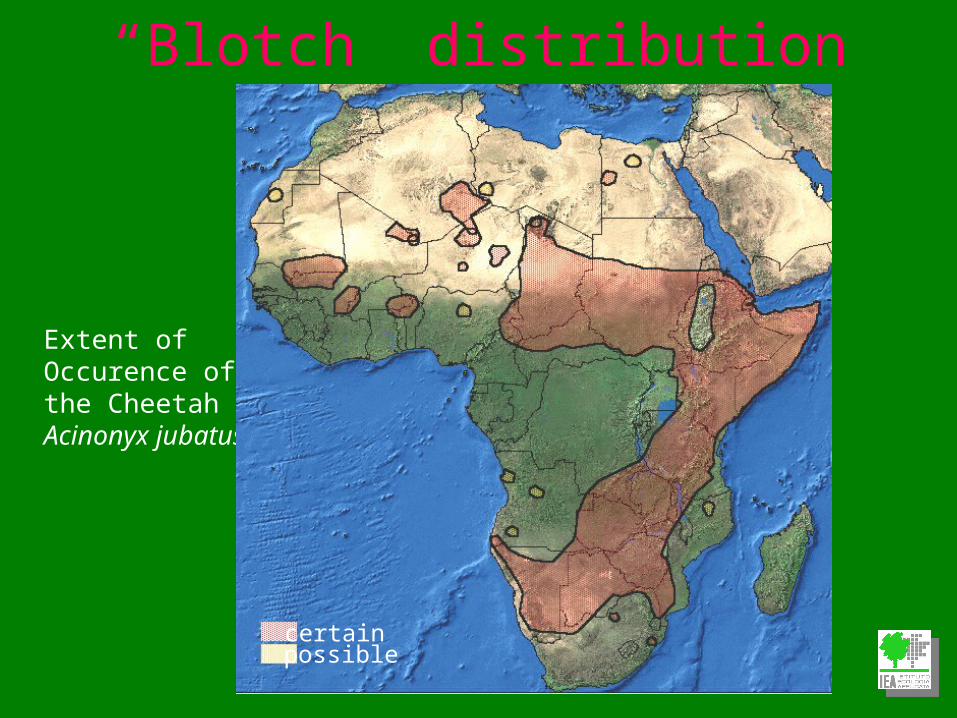
“Blotch” distribution
Extent of Occurence of the CheetahAcinonyx jubatus
certainpossible
Categorical Discrete Model
Area of Occupancy of the CheetahAcinonyx jubatus
Probabilistic Continuous Model
Suitability surface for the CheetahAcinonyx jubatus
Categorical Discrete ModelValidation
• The AMD project was validated with field work carried out in four selected countries in Africa
•Botswana, Cameroon, Morocco, Uganda• 427 plots were allocated at random within the four
countries• The presence/absence of each species at each of the
predetermined points was verified by:•direct observation•in loco collection of publications and scientific reports•interviews with local experts/authorities/inhabitants
• In each country a team composed by a researcher from a local Institution and one IEA staff member carried out the field work
Categorical Discrete ModelValidation
Validation parameters
Valid plots = all plots falling inside the Extent of Occurrence + all other plots in which the species was found during field work
Index of Accordance = Percentage of valid plots in accordance with the Categorical Discrete model
Categorical Discrete ModelValidation
• The AVD limited budget resources will prevent direct field work
• Similar scheme will be implemented using known species locations from bibliography
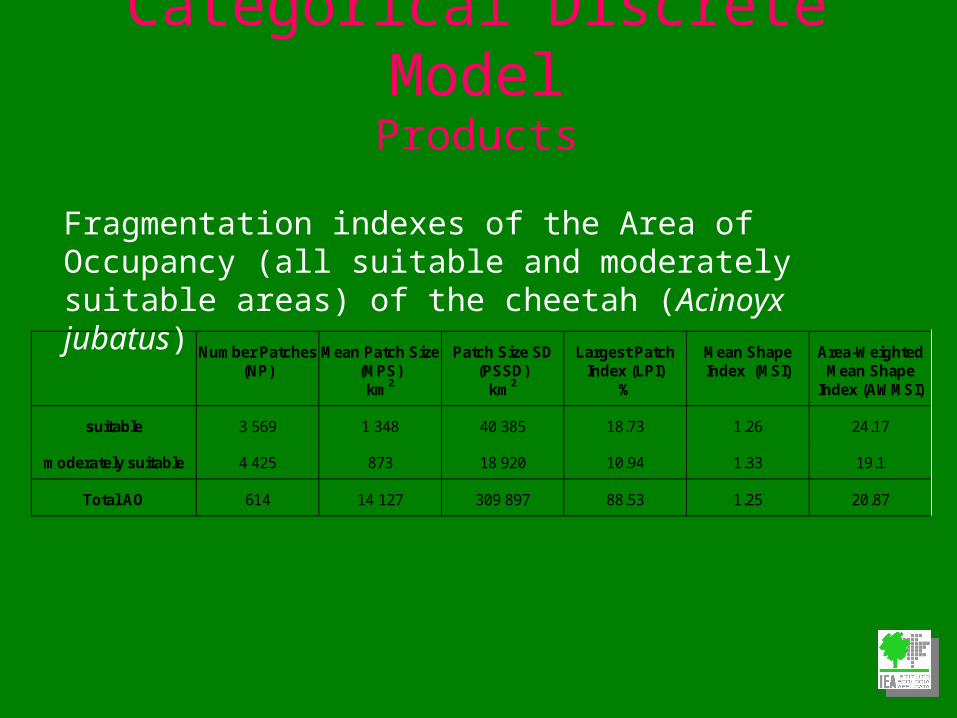
Fragmentation indexes of the Area of Occupancy (all suitable and moderately suitable areas) of the cheetah (Acinoyx jubatus)
Categorical Discrete ModelProducts
Efficacy of protected areas for the speciesVulnerable (VU: A1d+2d,C1) as A. jubatusEndangered (EN: C2a, D1) as A. j. hencki NW African cheetah
Management tools
• The different types of distribution models produced can be included in management tools of increasing information content:
– Blotch distribution• hot spots identification• effectiveness of protected areas
– Categorical Discrete Distribution Model• population fragmentation • management strategies for conservation
– Probabilistic Continuous Distribution Model• metapopulation PVA• corridors identification
Mammals biodiversity hotspots281 species of large mammals
Mammals biodiversity hotspots281 species of large mammals
AMD Products• a printed volume containing for each of the 281 species:
• Taxonomic notes• IUCN threat category• Available ecological information• Bibliography• Extent of Occurrence (“Blotch”)• Categorical Discrete Model• Probabilistic Continuous Model• Comments and conservation issues
• set of 10 CD-ROM with the digital version of all the above information
• web site with all data sets:
– www.gisbau.uniroma1.it/amd
AVD: where we are ?• Mammals:
– Rodents
– Bats
– Insectivores
– Others…
• Birds
• Amphibians
• Herps– Snakes
– Lizards
– Others ?
• Fishes ??
Why modeling? And how• Purpose of distribution maps
– ….– …. conservation: maps must be current and at the appropriate
resolution/scale for each taxon
• Maps ARE models !!• Increasing distribution information:
– Points (if qualified: date, accuracy, species biology) (good for transformation into blotches and/or for inductive modeling and/or for model validation)
– Polygons (if qualified)– Grids (if all cells are qualified)– Models (if validated)