Assessing Assessing Democracy Democracy Team Team Presentation by: Lisa Presentation by: Lisa Pearson, Cameron Pearson, Cameron McLaughlin, Ivy Mueller, McLaughlin, Ivy Mueller, and Alex Matthews and Alex Matthews
Transcript
Assessing DemocracyAssessing DemocracyTeam Team
Presentation by: Lisa Pearson, Presentation by: Lisa Pearson, Cameron McLaughlin, Ivy Cameron McLaughlin, Ivy
Mueller, and Alex MatthewsMueller, and Alex Matthews
Introduction to ProjectIntroduction to Project
Four indicators: Four indicators: Life ExpectancyLife Expectancy Literacy RateLiteracy Rate Internet AccessInternet Access % of Population in Poverty% of Population in Poverty Our countries were chosen at Our countries were chosen at
randomrandom
Statement of IntentStatement of Intent
We are assessing democracy with We are assessing democracy with these four social indicators to these four social indicators to determine whether or not democracy determine whether or not democracy produces the greatest amount of produces the greatest amount of good for the greatest amount of good for the greatest amount of people.people.
ChallengesChallenges
We obtained the exact number for We obtained the exact number for internet users, we had to obtain internet users, we had to obtain percentage of population.percentage of population.
One of our countries was North One of our countries was North Korea, self explainable. Korea, self explainable.
Some countries didn’t publish Some countries didn’t publish poverty rates example: Australiapoverty rates example: Australia
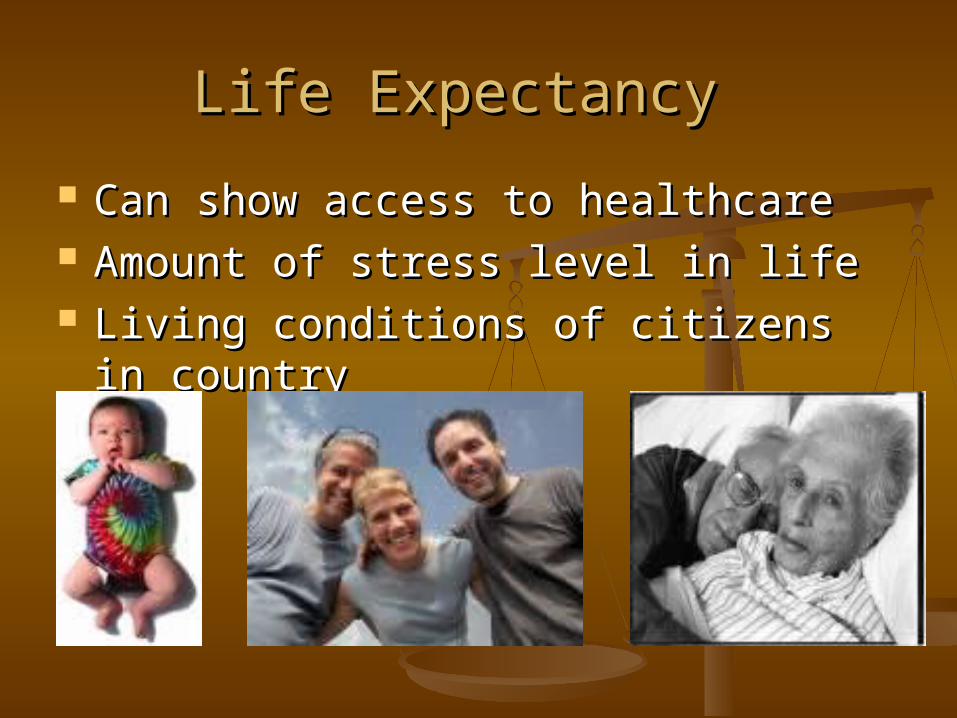
Life ExpectancyLife Expectancy
Can show access to healthcareCan show access to healthcare Amount of stress level in lifeAmount of stress level in life Living conditions of citizens in Living conditions of citizens in
countrycountry
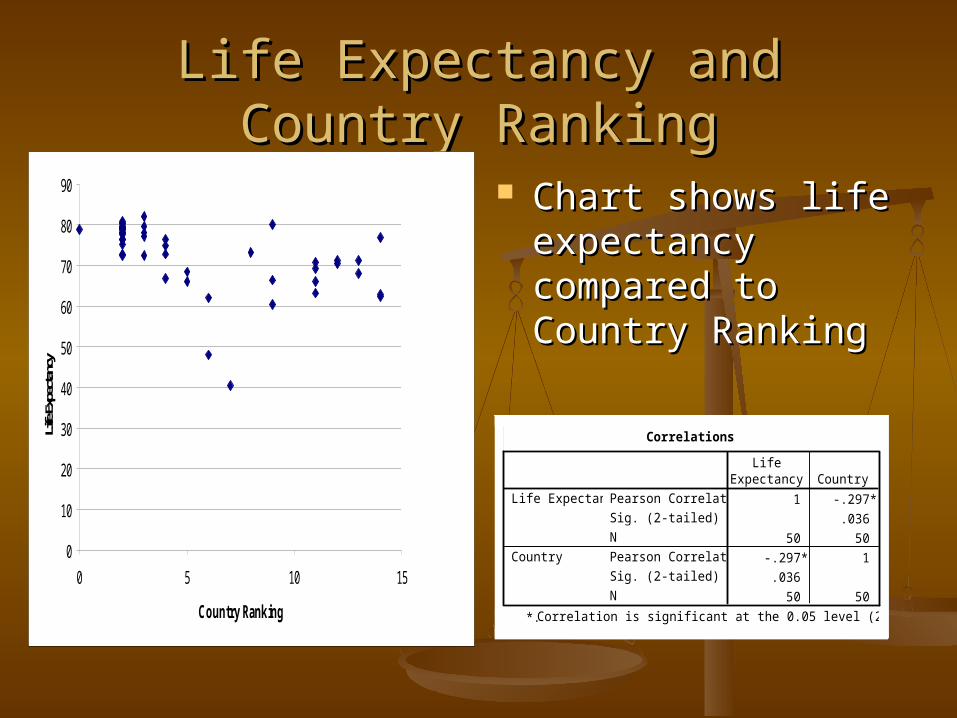
Life Expectancy and Country Life Expectancy and Country RankingRanking
Chart shows life Chart shows life expectancy expectancy compared to compared to Country RankingCountry Ranking
0
10
20
30
40
50
60
70
80
90
0 5 10 15
Country Ranking
Life E
xpec
tancy
Correlations
1 -.297*
.036
50 50
-.297* 1
.036
50 50
Pearson Correlation
Sig. (2-tailed)
N
Pearson Correlation
Sig. (2-tailed)
N
Life Expectancy
Country
LifeExpectancy Country
Correlation is significant at the 0.05 level (2-tailed).*.
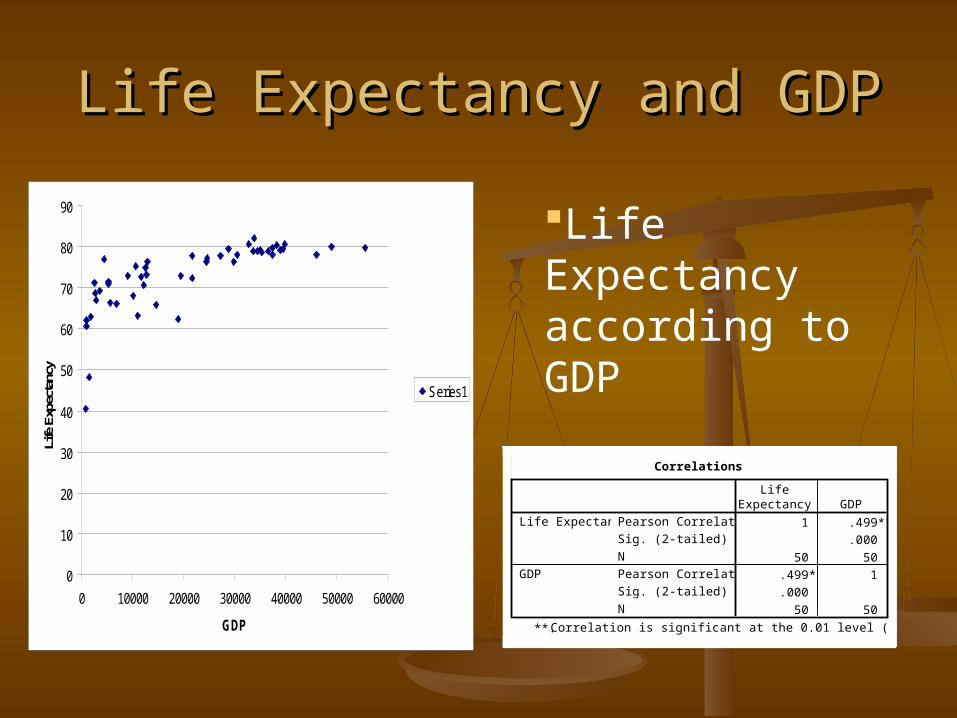
Life Expectancy and GDPLife Expectancy and GDP
0
10
20
30
40
50
60
70
80
90
0 10000 20000 30000 40000 50000 60000
GDP
Life
Exp
ecta
ncy
Series1
Correlations
1 .499**
.000
50 50
.499** 1
.000
50 50
Pearson Correlation
Sig. (2-tailed)
N
Pearson Correlation
Sig. (2-tailed)
N
Life Expectancy
GDP
LifeExpectancy GDP
Correlation is significant at the 0.01 level (2-tailed).**.
Life Expectancy according to GDP
Literacy RateLiteracy Rate
Shows education of countryShows education of country When people are educated they can When people are educated they can
get better jobs, making them happierget better jobs, making them happier The more people can read, the more The more people can read, the more
they can participate in the they can participate in the government and be more informedgovernment and be more informed
The more they are aware of what’s The more they are aware of what’s going on in the country, and try to going on in the country, and try to make it a better placemake it a better place
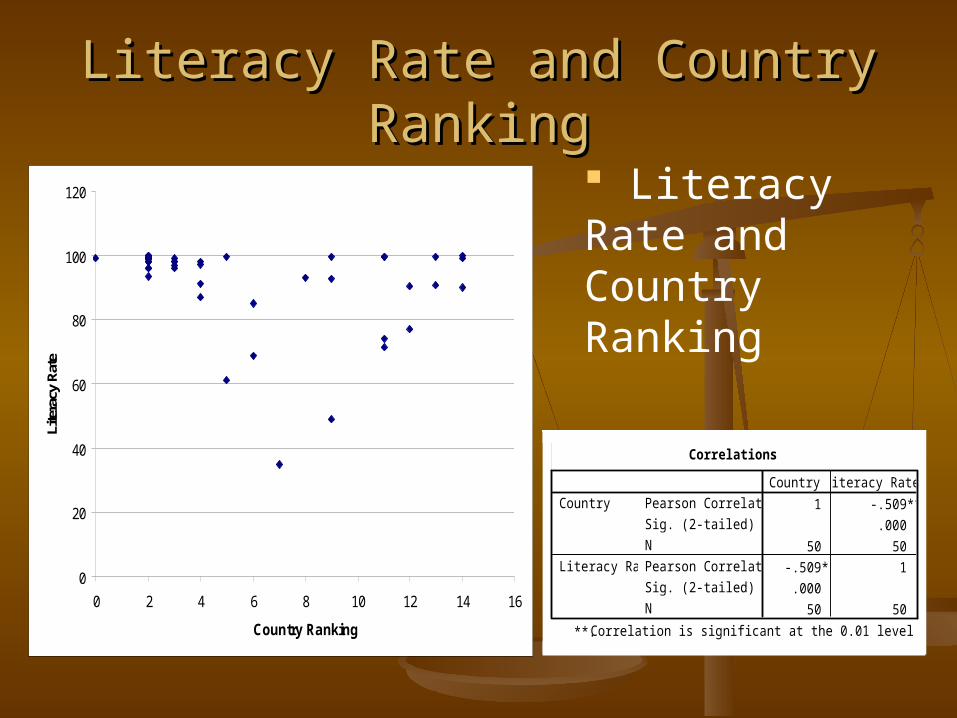
Literacy Rate and Country RankingLiteracy Rate and Country Ranking
0
20
40
60
80
100
120
0 2 4 6 8 10 12 14 16
Country Ranking
Lite
racy
Rat
e
Correlations
1 -.509**
.000
50 50
-.509** 1
.000
50 50
Pearson Correlation
Sig. (2-tailed)
N
Pearson Correlation
Sig. (2-tailed)
N
Country
Literacy Rate
Country Literacy Rate
Correlation is significant at the 0.01 level (2-tailed).**.
Literacy Rate and Country Ranking
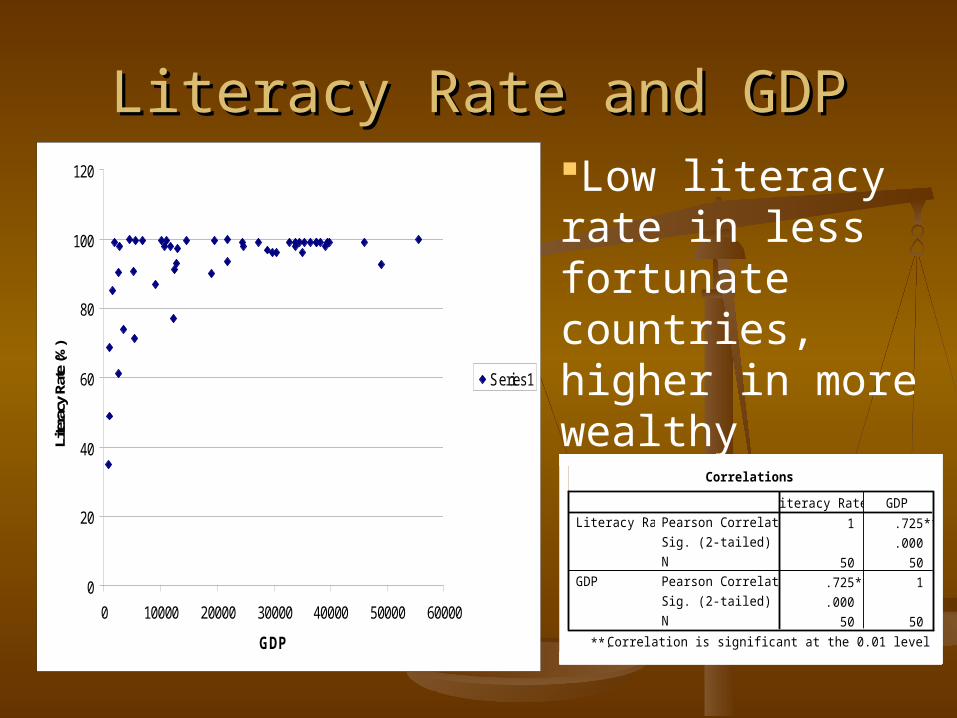
Literacy Rate and GDPLiteracy Rate and GDP
0
20
40
60
80
100
120
0 10000 20000 30000 40000 50000 60000
GDP
Lite
racy
Rat
e (%
)
Series1
Correlations
1 .725**
.000
50 50
.725** 1
.000
50 50
Pearson Correlation
Sig. (2-tailed)
N
Pearson Correlation
Sig. (2-tailed)
N
Literacy Rate
GDP
Literacy Rate GDP
Correlation is significant at the 0.01 level (2-tailed).**.
Low literacy rate in less fortunate countries, higher in more wealthy
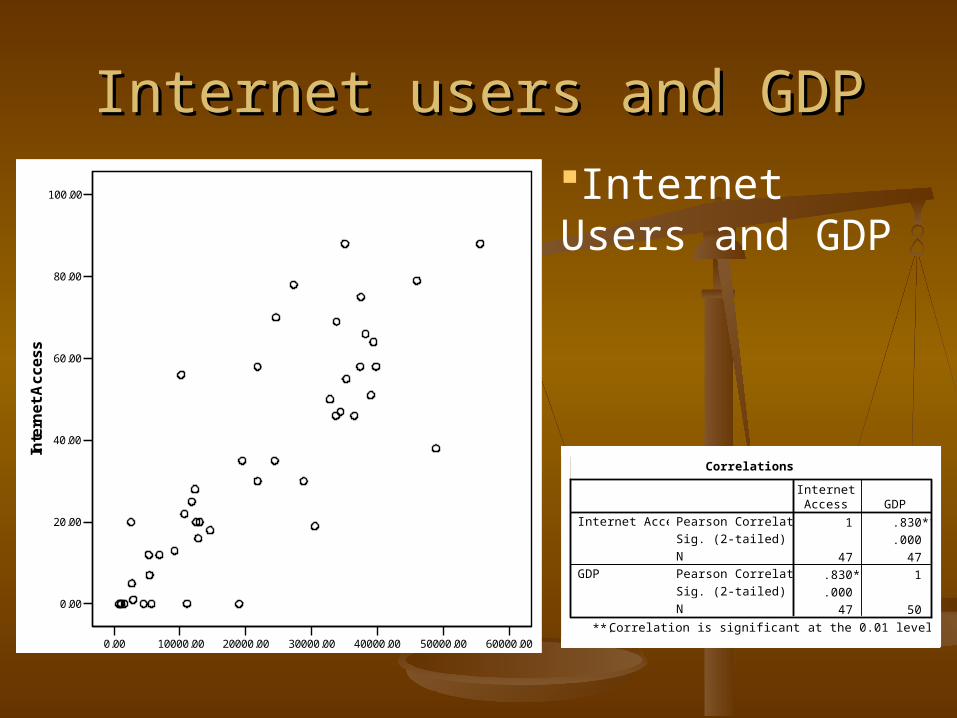
Percent of Internet UsersPercent of Internet Users
Shows citizens access to informationShows citizens access to information Shows country level of technological Shows country level of technological
advancement and modernization advancement and modernization
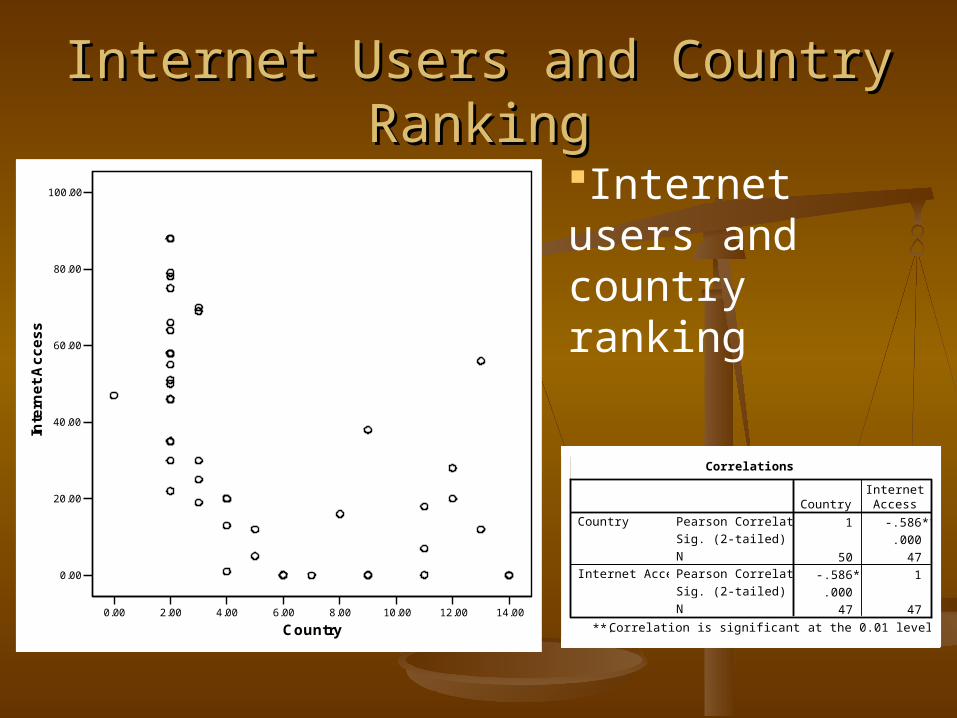
Internet Users and Country Internet Users and Country RankingRanking
0.00 2.00 4.00 6.00 8.00 10.00 12.00 14.00
Country
0.00
20.00
40.00
60.00
80.00
100.00
Inte
rne
t A
cc
es
s
Correlations
1 -.586**
.000
50 47
-.586** 1
.000
47 47
Pearson Correlation
Sig. (2-tailed)
N
Pearson Correlation
Sig. (2-tailed)
N
Country
Internet Access
CountryInternetAccess
Correlation is significant at the 0.01 level (2-tailed).**.
Correlation is significant at the 0.01 level (2-tailed).**.
Internet Users and GDP
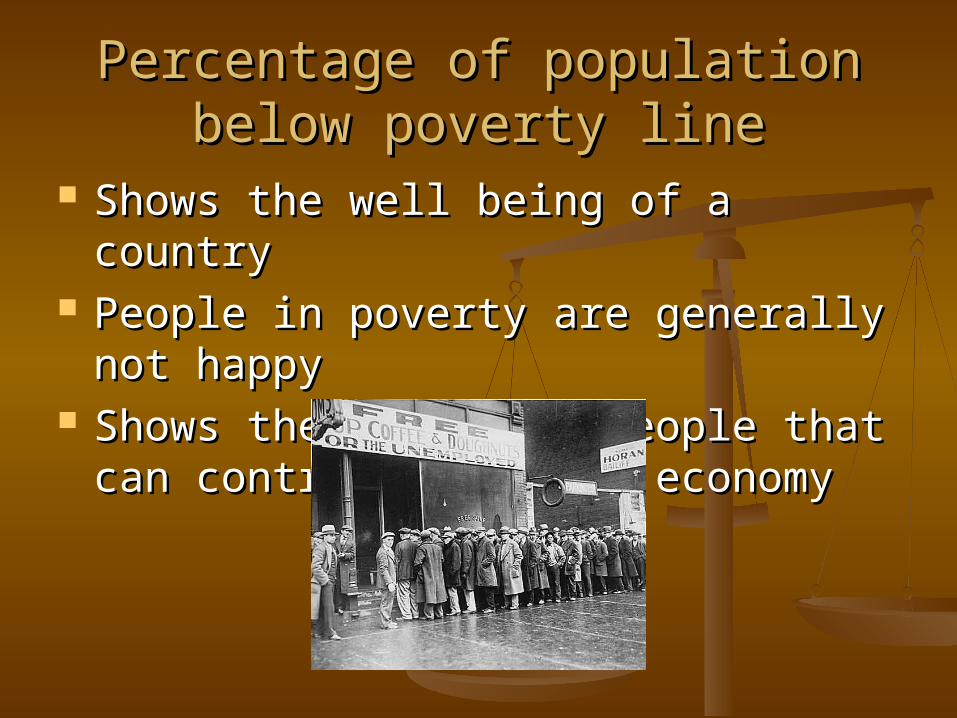
Percentage of population below Percentage of population below poverty linepoverty line
Shows the well being of a country Shows the well being of a country People in poverty are generally not People in poverty are generally not
happyhappy Shows the amount of people that can Shows the amount of people that can
contribute to the economycontribute to the economy
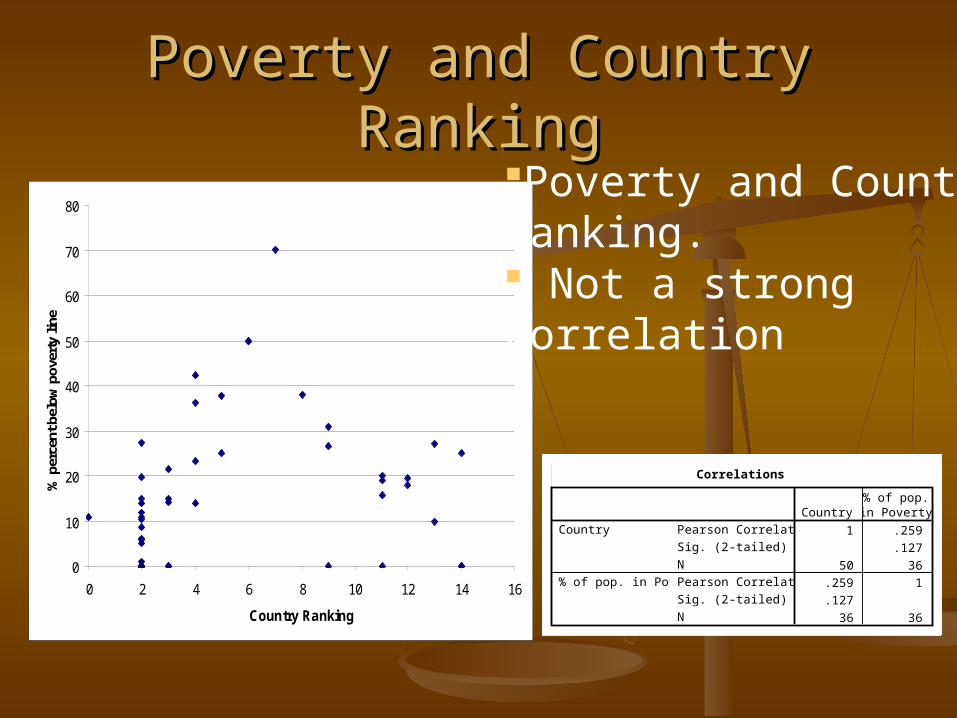
Poverty and Country RankingPoverty and Country Ranking
0
10
20
30
40
50
60
70
80
0 2 4 6 8 10 12 14 16
Country Ranking
% p
erce
nt b
elow
pov
erty
line
Correlations
1 .259
.127
50 36
.259 1
.127
36 36
Pearson Correlation
Sig. (2-tailed)
N
Pearson Correlation
Sig. (2-tailed)
N
Country
% of pop. in Poverty
Country% of pop.in Poverty
Poverty and Country ranking. Not a strong correlation
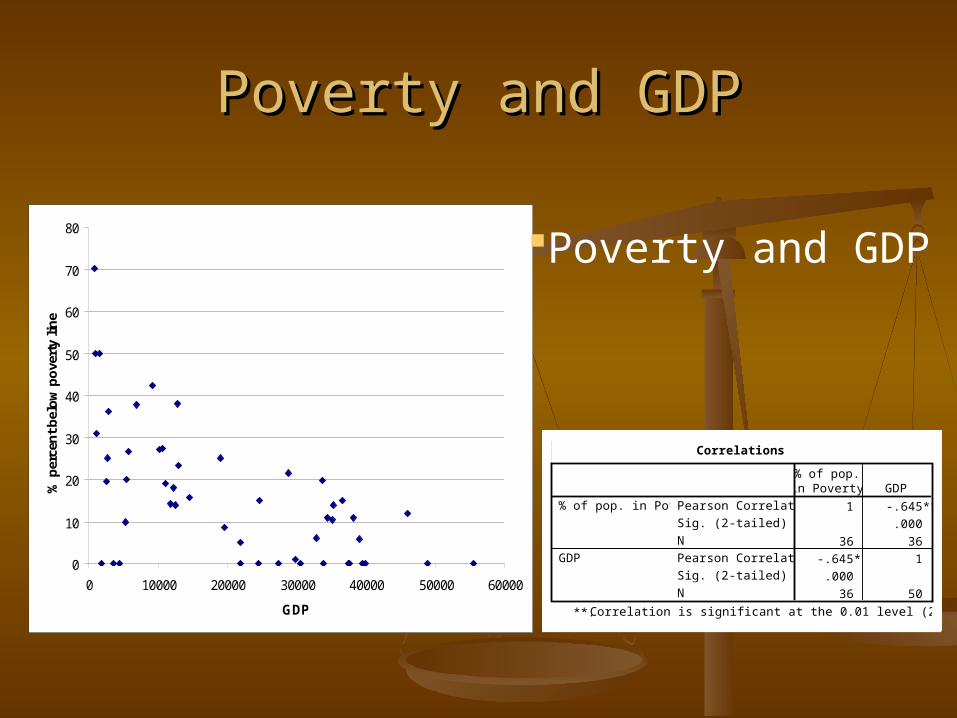
Poverty and GDPPoverty and GDP
0
10
20
30
40
50
60
70
80
0 10000 20000 30000 40000 50000 60000
GDP
% p
erce
nt
bel
ow
po
vert
y li
ne
Correlations
1 -.645**
.000
36 36
-.645** 1
.000
36 50
Pearson Correlation
Sig. (2-tailed)
N
Pearson Correlation
Sig. (2-tailed)
N
% of pop. in Poverty
GDP
% of pop.in Poverty GDP
Correlation is significant at the 0.01 level (2-tailed).**.
Poverty and GDP
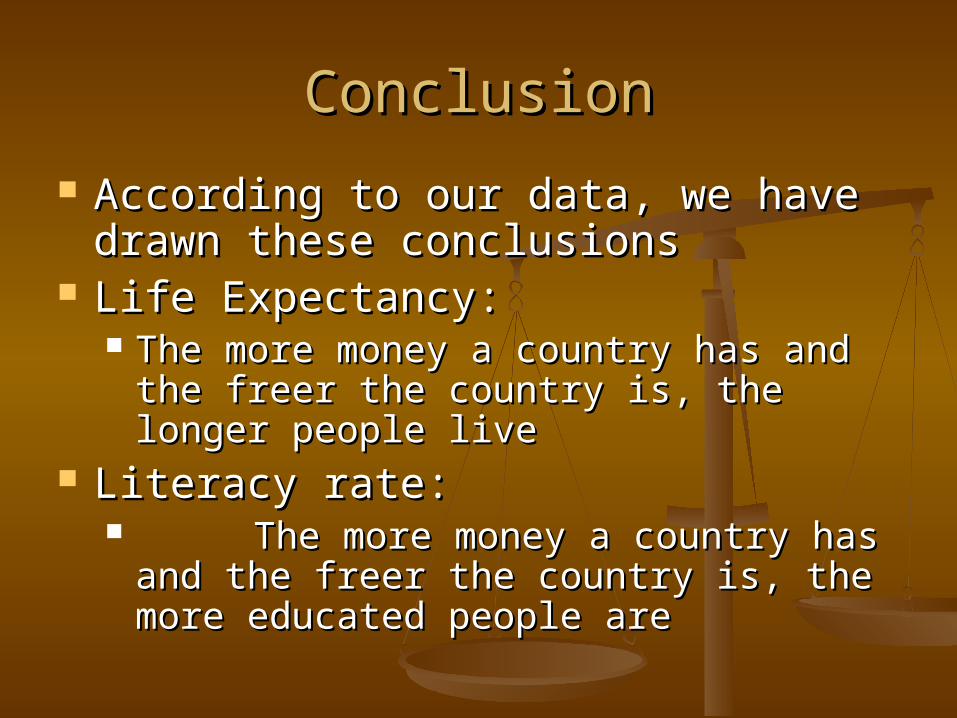
ConclusionConclusion
According to our data, we have According to our data, we have drawn these conclusionsdrawn these conclusions
Life Expectancy: Life Expectancy: The more money a country has and the The more money a country has and the
freer the country is, the longer people freer the country is, the longer people livelive
Literacy rate:Literacy rate: The more money a country has The more money a country has
and the freer the country is, the more and the freer the country is, the more educated people are educated people are
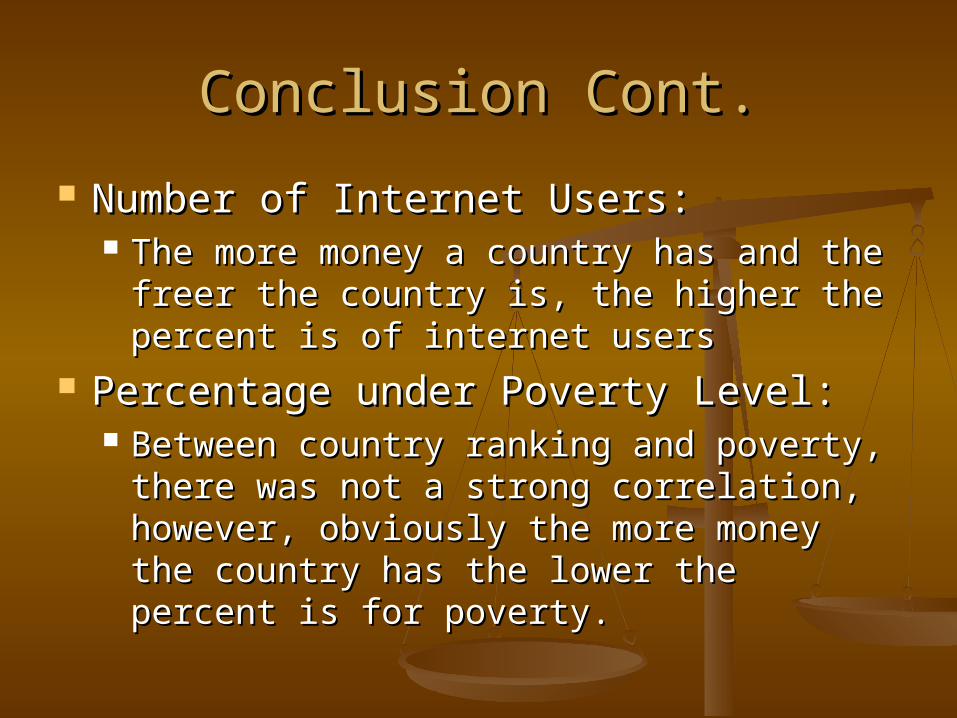
Conclusion Cont.Conclusion Cont.
Number of Internet Users:Number of Internet Users: The more money a country has and the The more money a country has and the
freer the country is, the higher the freer the country is, the higher the percent is of internet userspercent is of internet users
Percentage under Poverty Level:Percentage under Poverty Level: Between country ranking and poverty, Between country ranking and poverty,
there was not a strong correlation, there was not a strong correlation, however, obviously the more money the however, obviously the more money the country has the lower the percent is for country has the lower the percent is for poverty. poverty.
Does Democracy Matter?Does Democracy Matter?
Overall, we conclude, that Overall, we conclude, that democracy does matter, and so does democracy does matter, and so does money.money.