43
Assessing Exchange Rate Competitiveness in the Eastern Caribbean Currency Union Emilio Pineda, Paul Cashin, and Yan Sun WP/09/78
Assessing Exchange Rate Competitiveness in the Eastern Caribbean Currency Union
Emilio Pineda, Paul Cashin, and Yan Sun
WP/09/78

© 2009 International Monetary Fund WP/09/78 IMF Working Paper Western Hemisphere Department Assessing Exchange Rate Competitiveness in the Eastern Caribbean Currency Union1
Prepared by Emilio Pineda, Paul Cashin, and Yan Sun
April 2009
Abstract
This paper uses three methods to assess movements of real exchange rates in the ECCU over time. First, the purchasing power parity hypothesis is tested and then used to provide a benchmark for equilibrium real exchange rates in the region. Second, a fundamentals-based equilibrium real exchange rate approach is used to explore sources of real exchange rate fluctuations in ECCU countries. And third, a macroeconomic balance approach is used to estimate equilibrium current account or current account “norms”. The main finding of these analyses is that there is little evidence of overvaluation of the EC dollar. Furthermore, this paper contributes to the literature by analyzing the distinctive impact of tourism in determining real exchange rates through the wealth effect induced by tourism-driven increases in terms of trade and productivity.
JEL Classification Numbers: C32, C53, F41 Keywords: Equilibrium real exchange rate; tourism exports; panel estimation; ECCU Authors’ E-Mail Addresses: [email protected] [email protected] [email protected]
1 The authors are grateful to Sam Ouliaris, Luca Ricci, Ketil Hviding, Said Bakhache, Garfield Riley, Kari Grenade, Stephen Tokarick, and seminar participants at the First Eastern Caribbean Central Bank-IMF Research Seminar (July 2008) and Fortieth Annual Caribbean Monetary Studies Conference (November 2008) for helpful comments on earlier versions of the paper, and Cleary Haines for excellent research assistance.
This Working Paper should not be reported as representing the views of the IMF. The views expressed in this Working Paper are those of the author(s) and do not necessarily represent those of the IMF or IMF policy. Working Papers describe research in progress by the author(s) and are published to elicit comments and to further debate.
2
Contents Page
I. Introduction.............................................................................................................................. 3 II. Theoretical Background........................................................................................................... 4 III. Evolution of the Real Exchange Rate in the ECCU ................................................................ 5 A. Analysis of Traditional Real Exchange Rate Measures..................................................... 5 B. Real Exchange Rates Based on Customers and Competitors of Tourism Sector .............. 6 IV. Equilibrium Real Exchange Rate Models................................................................................ 7 A. The PPP Hypothesis........................................................................................................... 7 B. Equilibrium Real Exchange Rate: The Impact of Tourism ............................................... 9 C. Macroeconomic Balance Approach................................................................................. 15 V. Conclusions............................................................................................................................ 19 Tables 1. ECCU: Unit Root Tests on REER ......................................................................................... 25 2. ECCU: Panel Unit Root Tests on REER ............................................................................... 25 3. Results of the Error Correction Specification for Different Samples .................................... 26 4. Estimation Results: Macroeconomic Balance Approach....................................................... 27 Figures 1. ECCU: Real Exchange Rate–Real Effective Exchange Rate, 1979–2009 ............................ 28 2. The Caribbean: Real Exchange Rate–Real Effective Exchange Rate, 1979–2009 ............... 28 3. Real Exchange Rates with Respect to Main Customers of the Tourism Sector 1979–2009 ....................................................................................................................... 29 4. Real Exchange Rates with Respect to Tourism Competitors, 1979–2009 ............................ 29 5. ECCU: Actual and Long-Run Average REER, 1979–2008 .................................................. 30 6. ECCU: Actual and Equilibrium REER, 1979–2008.............................................................. 30 7. ECCU: Actual and Equilibrium REER, 1979–2008.............................................................. 31 8. ECCU: Contributions to Changes in Equilibrium Exchange Rates, 1982–2008................... 32 9. Contributions to Changes of Equilibrium Real Exchange Rates, 1982–2008 ....................... 33 10. ECCU: Current Account Deficit, Actual and Estimated Norms............................................ 34 11. ECCU: Current Account Deficit, Actual and Estimated Norms............................................ 35 12. ECCU: Contributions to Current Account/GDP Norm, 1979–2008 ..................................... 36 Appendices I. Tourism and the Real Exchange Rate.................................................................................... 20 A. Tourism Model................................................................................................................. 20 II. Data Sources .......................................................................................................................... 24 References .......................................................................................................................................... 37
3
I. INTRODUCTION
Recent decades have witnessed fundamental and lasting changes in the economic structures of the countries of the Caribbean. Sugar and bananas, which were the backbones of many economies, have been replaced by tourism as the dominant sector. Indeed, as of end-2006, agriculture as whole accounted for only about 6 percent of GDP in the Eastern Caribbean Currency Union (ECCU), while tourism accounted for over 25 percent of GDP and 75 percent of total export earnings. This strongly suggests that the economies of the eastern Caribbean, and their currencies in particular, have become tourism-dominated. This transformation has been accomplished in a context of remarkable exchange rate and price stability. The EC dollar has been pegged to the U.S. dollar at a rate of 2.7 EC dollars per U.S. dollar since 1976, and inflation has remained in the low single digits throughout much of this period. The ECCU had its antecedents in the Eastern Caribbean Currency Authority (ECCA) and the British Caribbean Currency Board. The British Caribbean Currency Board was an innately conservative monetary mechanism. In a similar vein, the Eastern Caribbean Central Bank (ECCB) is mandated to maintain foreign exchange reserves at not less than 60 per cent of demand liabilities. Member countries surrender their reserves to the ECCB, and the bank manages a common pool of foreign exchange reserves for member countries. The reserve pooling arrangement provides an important check and balance in that no individual country reserves are allocated, but reserves are imputed to individual member countries based on the balance of domestic credit and reserve money (Williams and others, 2001).2 In this context, this paper contributes to the literature by analyzing the distinctive impact of tourism in determining the equilibrium real exchange rate in tourism-dominated economies. As shown in subsequent theoretical and empirical sections, the role of tourism in determining the equilibrium real exchange rate is two-fold. First, through a tourism terms of trade effect where an increase on the price of tourism relative to the price of an imported foreign good is expected to induce an appreciation of the real effective exchange rate through wealth effects. And second, a Balassa-Samuelson effect where an increase in the productivity of the tourism sector will tend to increase wages in the non-tradable sector, and ultimately appreciate the real exchange rate. This paper estimates the equilibrium real exchange rate in the tourism-driven ECCU economies, using three different approaches. First, the purchasing power parity (PPP) hypothesis is tested and then used to provide a benchmark to assess real exchange rates in the region. Second, a fundamentals-based equilibrium real exchange rate approach is used to explore sources of real exchange rate fluctuations in ECCU countries. The main findings of these analyses are that: (i) there is little evidence of overvaluation of the EC dollar, as ECCU real exchange rates are either at, or below, their equilibrium level; and (ii) movements in tourism-driven terms of trade and productivity are important determinants of the equilibrium real exchange rate. Third, the macroeconomic balance approach is used to examine whether
2 An additional feature of the ECCU is the generalized acceptance of the U.S. dollar in current transactions. The impact of currency competition on ECCU real exchange rates is beyond the scope of this paper.
4
the medium-term current account balance of the ECCU deviates from an estimated equilibrium current account position. If the medium-term balance is close to its equilibrium level, then the real exchange rate is assumed to be close to its equilibrium. The paper is organized as follows. Section II provides a brief literature review and sets out the theoretical relationship between tourism exports and the real exchange rate. Section III explores the evolution of different measures of the real exchange rate in the region. Section IV applies an array of univariate and panel unit root tests to investigate the PPP hypothesis, and then provides an assessment of real exchange rates in the ECCU. A fundamentals-based approach is then applied to explore real factors that may explain variations in the real exchange rate, with particular emphasis on tourism. The macroeconomic balance approach to current account determination is then applied, to determine whether the ECCU current account has deviated from its estimated equilibrium current account balance. Section V concludes.
II. THEORETICAL BACKGROUND
Efforts by contemporary economists to determine the degree of misalignment of the nominal exchange rate have been typically anchored in some variant of the purchasing power parity (PPP) hypothesis (Rogoff, 1996). The PPP hypothesis states that arbitrage in international goods causes the real exchange rate to converge to a constant equilibrium, such that foreign currencies should posses the same purchasing power. Estimates of PPP, therefore, are important to provide a long-term benchmark for the equilibrium value of the exchange rate and, as such, a criterion for evaluating the competitiveness of real exchange rates. Furthermore, PPP has been adopted as a central building block for much of open-economy macroeconomics (Lane, 2001). However, whether PPP holds in the long run remains a contentious issue. Despite the low power of statistical tests in finite samples, there appears to be consensus that PPP provides a meaningful benchmark for (very) long-run movements in real exchange rates in developed countries (Cashin and McDermott, 2006; Froot and Rogoff, 1995; Rogoff, 1996; Sarno and Taylor, 2002). Studies that find significant mean reversion of the real exchange rate in industrial countries report short-term real exchange rate deviations from PPP of 3 to 8 years (Cashin and McDermott, 2006; Rogoff, 1996). However, empirical evidence for developing countries is much less conclusive. Cheung and Lai (2000) compare 94 developing and industrialized countries and conclude that PPP is more likely to hold in developing countries, where convergence also appears to be faster. In contrast, Cashin and McDermott (2006) find significant heterogeneity of parity reversion across countries and groups of countries, with the PPP hypothesis more likely to be accepted in developed countries, high inflation countries, and countries with flexible exchange rates. Even if one was to accept results supporting the PPP hypothesis, the slow rate of mean reversion remains a puzzle. Rogoff (1996, p.664) summarizes this issue as follows: “How is it possible to reconcile the extremely high short-term volatility of real exchange rates with the glacial rate at which deviations from PPP seem to die out?” Consequently, recent work has emphasized the time-varying nature of the long-run real exchange rate. Explanations offered by researchers in their attempt to resolve this puzzle include the recognition that real
5
factors have a role in the determination of real exchange rates through channels such as: productivity differentials, real interest rate differentials, and changes in net foreign assets. This literature, however, has mainly concentrated on the sources of real exchange rate fluctuations in developed countries with little resonance for developing countries. These real factors are unlikely to play much of a role in economies—particularly developing economies—characterized by the slow pace of productivity improvements in the production of tradables, the presence of capital controls and underdeveloped domestic financial markets (Cashin, Céspedes and Sahay, 2004). In contrast to the multitude of studies on the behavior of real exchange rates in industrial countries, evidence on the behavior of developing country real exchange rates remains scarce. Terms of trade have been found to influence the real exchange rate through real income or wealth effects, where higher terms of trade appreciate the real exchange (De Gregorio and Wolf, 1994; Diaz-Alejandro, 1982; Edwards, 1989; Edwards and Savastano, 1999). Similarly, fluctuations in the real exchange rate of commodity-dependent countries—most of them developing countries—have been found to be dependent on fluctuations in world commodity prices (Cashin, Céspedes and Sahay, 2004). As primary commodities in general dominate developing country exports, these studies have emphasized the role of movements in the terms of trade of goods. Yet, due to economic growth and increased globalization, not only has trade in goods surged, but also trade in services and particularly in international tourism. Over the last two decades international tourism arrivals around the world have more than doubled, while tourism receipts have grown four-fold. As a result, tourism has become a key source of economic growth, job creation, and government revenue (Gooroochurn and Blake, 2005). Furthermore, tourism has become an increasingly important source of foreign exchange, and thereby has the potential to explain a large share of the movements of the real exchange rate. However, while terms of trade of goods have been considered a key determinant of developing country real exchange rates, there has been to our knowledge no empirical work undertaken to assess the mechanism through which fluctuations in tourism receipts affect the real exchange rate. Appendix I sets out a simple model that details the major channels through which tourism exports can affect the real exchange rate.
III. EVOLUTION OF THE REAL EXCHANGE RATE IN THE ECCU
This section takes two approaches to assess movements in the real exchange rate over time. The first approach looks at traditional real effective exchange rate (REER) measures, based on the ratio of domestic to foreign prices. The second approach is based on specially constructed exchange rate measures that are appropriate for tourism-dominated economies. These measures are based on real exchange rates vis-à-vis: (i) major competitors of the ECCU in the tourism sector; and (ii) major customers of the ECCU tourism sector.
A. Analysis of Traditional Real Exchange Rate Measures
The traditional IMF measure of the real effective exchange rate uses a weighted average of foreign prices, with weights reflecting the home country’s bilateral trade with each foreign
6
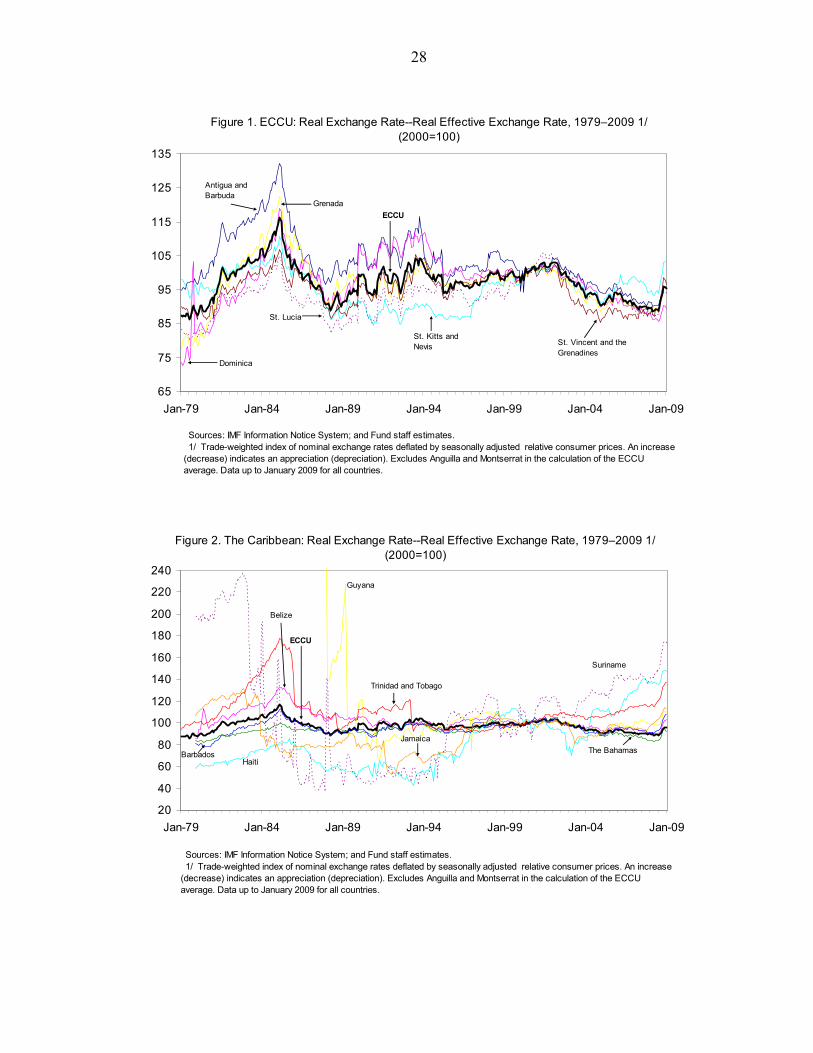
country. The advantage of this definition is that it allows for a comparison of domestic and international prices over time. As shown in Figure 1, the picture that emerges is one of appreciation of the ECCU REERs during the early 1980s and 1990s, and depreciation beginning in 2002. The appreciation was most pronounced in Antigua and Barbuda in the 1980s and in St. Kitts and Nevis in the 1990s. Similarly, Dominica and St. Lucia have had the largest depreciation since 2002. There has also been a rapid real appreciation of ECCU REERs in 2008, due to the appreciation of the U.S. dollar against major currencies. On a Caribbean-wide basis, the real exchange rate of the ECCU has appreciated much less than those of Haiti, Suriname and Trinidad and Tobago (Figure 2).
Since the ECCU economies are dominated by tourism it is of interest to analyze the evolution of the real exchange rate against those of some key tourism customers and tourism competitors. In the following section the paper modifies the traditional measure of real effective exchange rate, and tailors it to the main customers and competitors of the tourism-driven ECCU economies.
B. Real Exchange Rates Based on Customers and Competitors of Tourism Sector
For the analysis of this section, real exchange rate measures based on the currencies of tourism-customer and tourism-competitor countries of the ECCU were constructed. These measures are variants of the traditional real effective exchange rate index calculated by the IMF.3 The index is presented in the equation below, where jRER denotes the real exchange rate of country j; jCPI and jE denote, respectively the consumer price index and (and index of) the nominal exchange rate (measure in U.S. dollars per unit of domestic currency) of country j; and iw denotes the weight assigned to each of the partners countries i. It can be seen that when domestic prices (measured in U.S. dollars) increase more than prices in partner countries, the real exchange rate will appreciate:
( )( )( )[ ] .100*
*ln*exp
*
1∑=
= n
i iii
jjj
ECPIw
ECPIRER
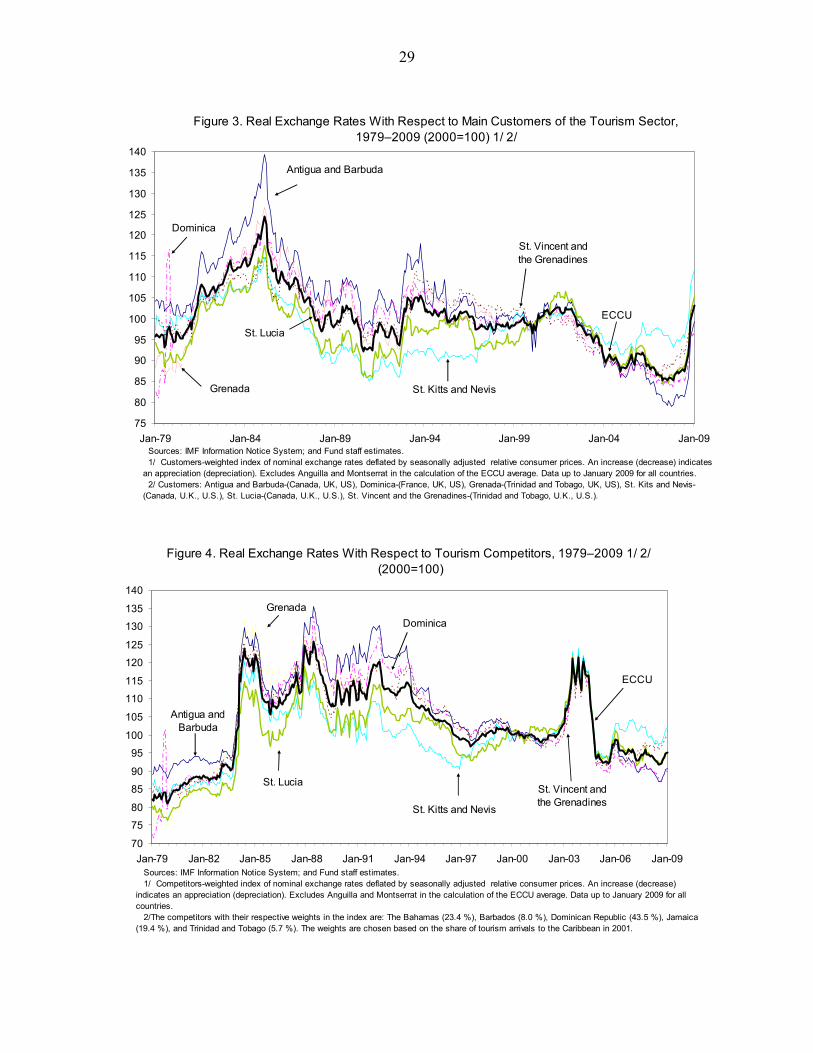
The customer-based real exchange rate indicates in general that the rate was fairly stable during the 1990s, and then experienced a significant depreciation starting in 2002 (Figure 3). During 2008 there was a sharp appreciation in all countries, particularly in St. Kitts and Nevis, with the ECCU average exchange rate close to its 2002 level. Overall, a common 3 These measures have the following weights: (i) Customers: Antigua and Barbuda (Canada, U.K., U.S.); Dominica (France, U.K., U.S.); Grenada (Trinidad and Tobago, U.K., U.S.); St. Kitts and Nevis (Canada, U.K., U.S.); St. Lucia (Canada, U.K., U.S.); St. Vincent and the Grenadines (Trinidad and Tobago, U.K., U.S.); (ii) Competitors: The Bahamas (23.4 percent), Barbados (8.0 percent), Dominican Republic (43.5 percent), Jamaica (19.4 percent), and Trinidad and Tobago (5.7 percent). The weights, in parentheses, are chosen based on the share of tourism arrivals to the Caribbean in 2001.
7
phenomenon for all countries is the continued depreciation of customer-based real exchange rates between 2002 and 2007, then appreciation since 2008. The main factor behind this is the depreciation (appreciation) of the U.S. dollar against tourism-customer currencies—the British pound, the Euro, and the Canadian dollar. Competitor-based real exchange rates have depreciated steadily over the last two decades (by about 20 percent), with the exception of a brief period in 2002–03 when this trend was reversed because of the large depreciation of the Dominican Republic’s peso (Figure 4). In sum, the analysis of different measures of real exchange rate shows a broad improvement in the competitiveness of ECCU real exchange rates. In most cases, the real exchange rate of ECCU countries is at its most competitive level of the last decade. The next section expands this analysis by examining several models of the equilibrium real exchange rate. From this point forward in the paper, the real exchange rate is understood to be the traditional IMF measure based on a weighted average of foreign prices, with weights reflecting the home country’s bilateral trade with each country. Relying on this measure of the real exchange rate for the equilibrium analysis is important, in order to frame our results within the relevant literature, which also typically uses this readily-available measure.
IV. EQUILIBRIUM REAL EXCHANGE RATE MODELS
In this section we make use of two different equilibrium models to estimate the equilibrium real exchange rate for ECCU countries. First, the Purchasing Power Parity (PPP) hypothesis is tested and then used to provide a first benchmark to assess the evolution of real exchange rates in the region. Second, a fundamentals-based equilibrium real exchange rate approach is used to explore the time-varying nature of equilibrium real exchange rates in ECCU countries.
A. The PPP Hypothesis
The PPP hypothesis is a common starting point when calculating the equilibrium real exchange rate. A necessary condition for PPP to hold in the long run is that the real exchange rate be stationary over time, meaning the real exchange rate reverts to a long-run constant equilibrium. If this is not the case, then the nominal exchange rate and the price differential will tend to deviate permanently from one another. This is the rationale for applying unit root tests to real exchange rate data as a means of testing for the long-run purchasing power parity. In these tests the null hypothesis is usually that the process generating the real exchange rate series has a unit root, thereby a failure to reject this null hypothesis indicates that the real exchange rate behavior is not consistent with the PPP hypothesis.
Univariate Unit Root Tests
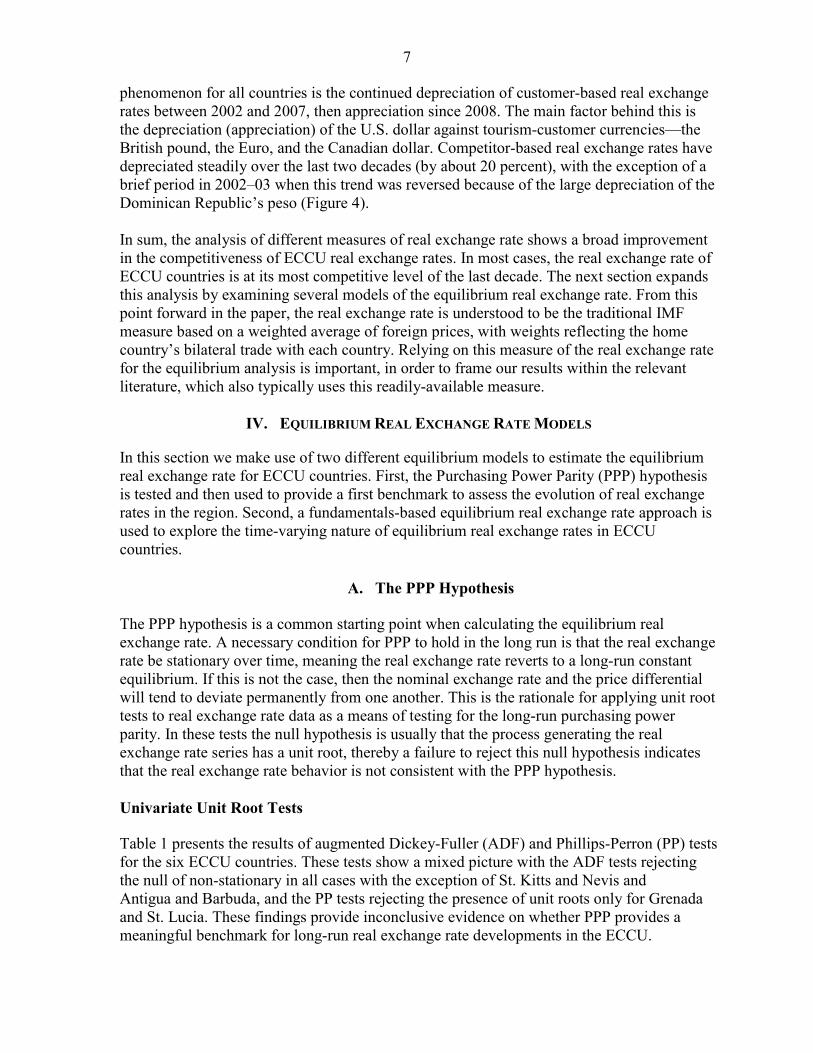
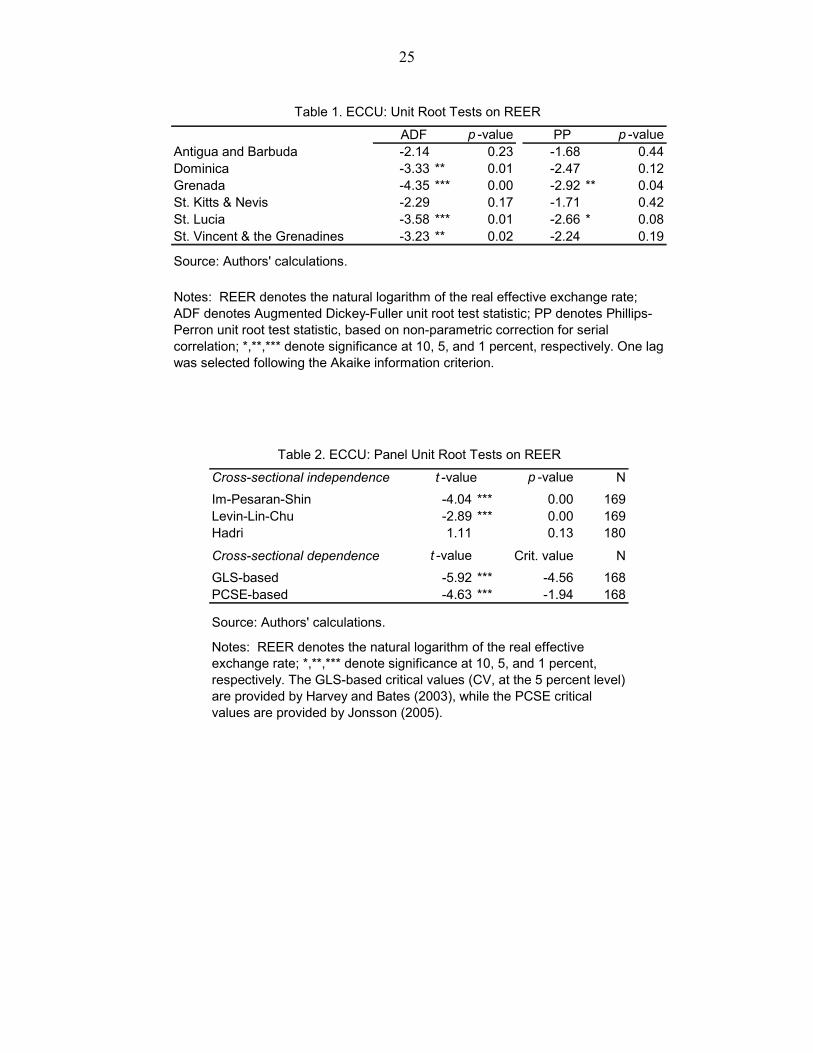
Table 1 presents the results of augmented Dickey-Fuller (ADF) and Phillips-Perron (PP) tests for the six ECCU countries. These tests show a mixed picture with the ADF tests rejecting the null of non-stationary in all cases with the exception of St. Kitts and Nevis and Antigua and Barbuda, and the PP tests rejecting the presence of unit roots only for Grenada and St. Lucia. These findings provide inconclusive evidence on whether PPP provides a meaningful benchmark for long-run real exchange rate developments in the ECCU.
8
However, this does not come as a surprise, as standard unit root tests such as the ADF test are typically not able to reject the hypothesis that the real exchange rate is non-stationary.4 One well-documented explanation for the inability to find evidence of long-run PPP is the low power of conventional unit root tests with a relatively small sample span (Rogoff, 1996; Sarno and Taylor, 1998). Researchers have sought to overcome the power problem in testing for mean reversion in the real exchange rate either through long span studies or through panel unit root studies. In this context, a variety of procedures for the analysis of unit roots in a panel context have been developed to gain statistical power and thereby improve the power of conventional unit root tests.
Panel Unit Root Tests
The first generation of panel unit root tests may be viewed as a pooled ADF test allowing for fixed effects, unit-specific time trends, and differing lag lengths across the units (Im, Pesaran and Shin, 2003; Levin, Lin and Chu, 2002). In contrast to their univariate counterparts, this first generation of panel unit root tests applied to a collection of industrialized countries generally find that real exchange rates are stationary, thereby lending empirical support to the purchasing power parity hypothesis (Sarno and Taylor, 1998; Sarno and Taylor, 2002). Nonetheless, testing the unit root hypothesis by using panel data instead of individual time series involves several additional complications, particularly in the application to the PPP hypothesis, chief among which is the inability to assume that the cross section units are independent—an assumption made in first generation panel unit root tests (Breitung and Pesaran, 2005). To overcome these difficulties, variants of panel unit root tests have been developed that allow for different forms of cross-sectional dependence (O’Connell, 1998; Jönsson, 2005). Table 2 presents a summary of panel unit root tests, assuming both cross-sectional independence and cross-sectional dependence. All four tests where the null hypothesis is that of non-stationarity —Im, Pesaran and Shin (2003); Levin, Lin and Chu (2002); O’Connell (1998) GLS-based; Jönsson (2005) panel-corrected standard errors (PCSE)-based— rejected the null at a 95 percent level of confidence. Hadri’s (2000) test differs from the other tests in that its null hypothesis is that all series in the panel are stationary.5 In sum, all the panel unit root tests performed indicate that the behavior of the real exchange rate is mean-reverting and therefore it is consistent with the PPP hypothesis.
4 Darius and Williams (2000) reject the PPP hypothesis for ECCU countries after conducting univariate unit root tests.
5 When performing this test and correcting for serial correlation of the errors we could not reject the null hypothesis that all series are stationary at a 90 percent level of confidence. This test helps to address difficulties in interpreting the results of the other four tests, since rejection of the null hypothesis of joint non-stationary may occur even if only one of the series is stationary (Sarno and Taylor, 1998).
9
PPP Long Run Equilibrium
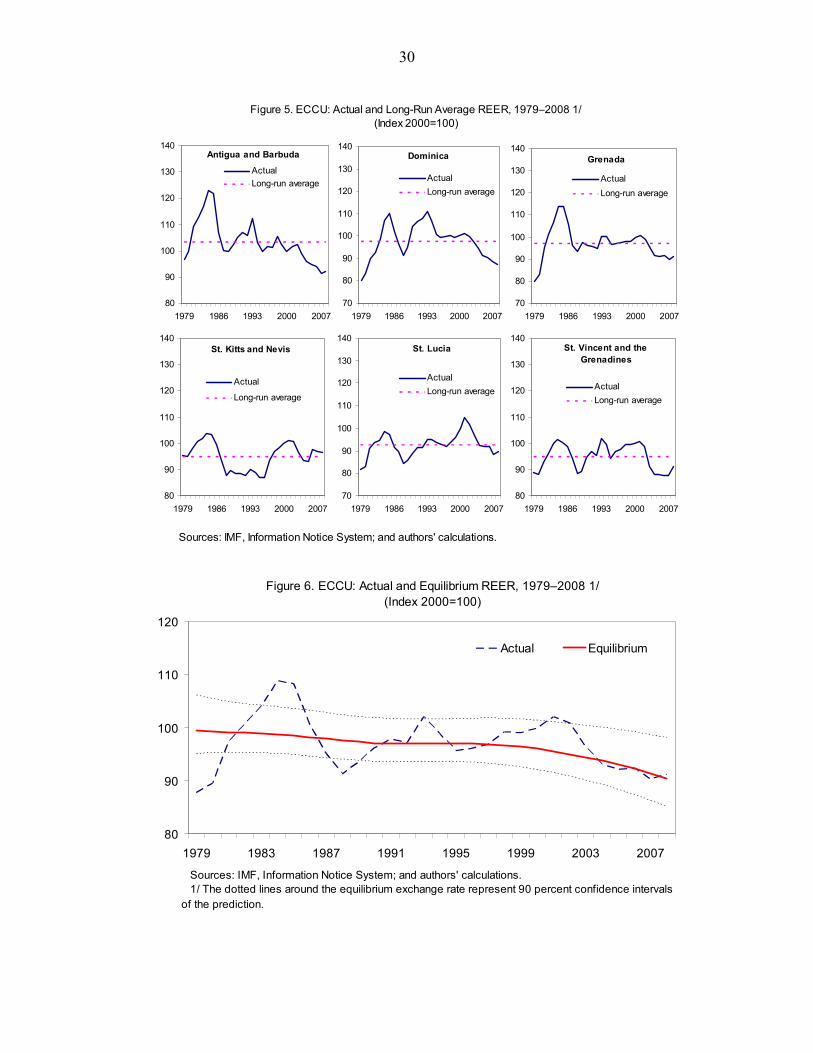
The long-run sample average REER—the equilibrium concept for this model of PPP—provides a first benchmark to assess the level of the real exchange rate in the ECCU. As shown in Figure 5, most ECCU countries had two periods of overvaluation in their real effective exchange rates: first in the early 1980s and then in the early 2000s. Currently the real exchange rate of all ECCU countries is either at its predicted long-run equilibrium level —St. Kitts and Nevis—or below its long-run equilibrium level—Antigua and Barbuda, Dominica, Grenada, St. Lucia, and St. Vincent and the Grenadines. Furthermore, the GLS estimated autoregressive coefficient implies that the half life of real exchange rate misalignment is 2.9 years.6 This estimate is at the lower-end of the consensus estimates of 3-5 years for industrial countries (Rogoff, 1996), and significantly lower than the 5–10 year half-life of deviations found for fixed-exchange rates by Sarno and Valente (2006) and the permanent deviation found by Cashin and McDermott (2006).7 One potential explanation for this apparent faster speed of adjustment in the ECCU is tourism. Tourism has the potential to accelerate the speed of parity reversion to equilibrium in a similar manner to that highlighted by Rogoff, Froot, and Kim (2001)—greater trade flows should, in principle, promote goods market arbitrage, encourage more frequent price adjustments by firms, and reduce the persistence of real exchange rate shocks. Similarly, tourists will exercise arbitrage in tourism consumption when deciding to visit a country or not, and when deciding how much of the tourism services (e.g. length of the stay, expenditure pattern) they will consume once they are present at the destination. This arbitrage should encourage more frequent price adjustments by tourism providers and reduce the persistence of real exchange rate shocks. In sum, panel unit root tests indicate that real exchange rates in the ECCU economies revert to a long-run constant, thereby lending support to the PPP hypothesis. There is little evidence of overvaluation of the EC dollar, and the speed of adjustment toward equilibrium is faster than that typically found in the literature for fixed-exchange rate regimes.
B. Equilibrium Real Exchange Rate: The Impact of Tourism
The previous PPP analysis provides a first benchmark for the analysis of the real exchange rate but it explains only a limited portion of real exchange rate volatility and fails to explain turning points in the real exchange rate. Furthermore, as argued by Polak (2007), there is no basis for the expectation that any observed change in a country’s actual PPP-based real exchange rate will be followed by a reversal, particularly if the observed change is equilibrating or if the observed change is equilibrium neutral (the Balassa-Samuelson effect 6 For an autoregressive process, half life of a misalignment is calculated as –ln(2)/ln(ρ), where ρ is the estimated autoregressive coefficient.
7 As argued by Cashin and McDermott (2006), since the existing literature on developing countries has centered around high-inflation Latin American countries, these findings suffered from a sample selection bias. Our analysis does not suffer from this bias because inflation in the ECCU countries remained in the low-single digits throughout most of the period.
10
would be an example). Thus it is necessary to introduce a model that emphasizes the time-varying nature of the real exchange rate, whereby real factors (fundamentals) have a role in the determination of the real exchange rate. A standard approach to model the time-varying nature of the real exchange rate is the fundamentals-based equilibrium real exchange rate approach.
Fundamentals–Based Equilibrium Real Exchange Rate
There is a large empirical literature on the determinants of the long-run real exchange rate, which has focused on sectoral productivity differentials, government spending, cumulative current account imbalances, movements in the terms of trade, and interest rate differentials as key drivers of long-run deviations from purchasing power parity (see Froot and Rogoff, 1995; Rogoff, 1996; Edwards, 1989; IMF, 2006; Ricci and others, 2008). Since only “fundamentals” (real factors) can influence the long-run real exchange rate, the fundamentals-based equilibrium real exchange rate can be used to determine nominal misalignments by separating the factors that can affect the long-run equilibrium real exchange rate from those that may cause short-run misalignments.8 In the case of the tourism-dominated economies of the ECCU, the real exchange rate is expected to be driven by the following fundamentals: • Productivity differential. According to the so-called Balassa-Samuelson effect, if productivity in the tradables sector grows faster than in the non-tradables sector, the resulting higher wages in tradables will put upward pressure on wages in the non-tradables sector, resulting in a real appreciation of the exchange rate (MacDonald and Ricci, 2003). Most studies use as a proxy for productivity differentials relative per capita GDP, with very few studies using distinct measures of relative sectoral productivity. In this case given the dominance of tourism in the ECCU we have selected as a distinct proxy for productivity differentials in the region per capita tourist arrivals as share per capital tourist arrivals in The Bahamas—the country in the region with the highest per capita tourist arrivals. We expect this measure to be a better productivity proxy for tourism-dominated economies than relative GDP.9 • Terms of trade. Higher terms of trade should appreciate the real exchange rate through real income or wealth effects (Chen and Rogoff, 2004; Cashin and others, 2004).10 Since the relevance of traditional commodity exports, such as sugar and bananas, has been diminishing over time we use a proxy for the tourism terms of trade. The proxy used is movement in the terms of trade of goods and services (TT) not explained by movements in terms of trade of goods only (TTG). The main difference between the TT and TTG in ECCU
8 Recent applications of this methodology include Abidh and Tsangarides (2006), and IMF (2006). 9 Different benchmark countries—including Antigua and Barbuda and Barbados—were used with similar results.
10 Tokarick (2008) points out that an improvement in the terms of trade need not necessarily lead to a rise in the price of nontradables relative to the price of tradable goods—relative price movements will depend on the magnitude of substitution and income effects.
11
countries is the price deflator used for exports of services. This deflator is typically obtained by the ratio of nominal exports of services (largely tourism receipts) and the volume of exports of services (number of tourists), as opposed to the deflator of exports of goods which is based on the price of commodity exports. Thus we expect this variable to be a better proxy for the tourism terms of trade. • Government consumption. Higher government consumption (measured as a share of GDP) is likely to appreciate the real exchange rate to the extent that it falls mostly on nontradables rather than tradables, which then raises the relative price of the former (De Gregorio and Wolf, 1994).
• Net foreign assets. Macroeconomic models predict that countries with higher net foreign assets can in principle sustain a stronger real exchange rate, due to the income flow they receive on their assets. Econometric Methodology
Given the limited length of the sample (30 years), estimating separate real exchange rate equations for each ECCU country gives rather imprecise results. In order to reduce this shortcoming we pool the data for the CARICOM and tourism-dependent countries between 1979 and 2008. As a result we have a panel consisting of a matrix of 10 x 30 (N x T) with 300 potential observations (for CARICOM countries). As suggested by Pesaran and Breitung (2005), in panels where N is small (less than 10) and T is relatively large the standard approach is to treat the equations from the different cross-section units as a system of seemingly unrelated regression equations (SUR), and then estimate the system by generalized least squares (GLS) techniques.11 An advantage of this type of model is that correlation across units becomes a natural part of the specification, whereas in large N small T panels this type of correlation is typically assumed away. In other words, the main attraction of the GLS-SUR procedure lies in the fact that it allows contemporaneous error covariances to be freely estimated.12 Since the covariance matrix of the errors is never known in practice, an estimate is used. This is done by using the residuals computed from the OLS-consistent estimates of the parameter coefficients, using a procedure known as feasible GLS (FGLS). FGLS performs well in large samples and in the limit has all the asymptotic properties of maximum likelihood. Beck and Katz (1995), however, suggest several problems that might arise when using this model in small samples. In particular, they found that FGLS tends to underestimate the true variability of the estimator when the time points (T) are not substantially larger than the cross-sectional
11 Our finding that the real exchange rate in ECCU countries does not exhibit a unit root rules out the possibility of cointegration, and thus standard panel models used in the literature such as dynamic ordinary least squares (DOLS) cannot be used. This strategy is also consistent with that adopted by Chen and Rogoff (2003), who argue that is plausible to assume that over finite samples real exchange rates are stationary. 12 The inability to account for this cross-sectional correlation is one of the constant criticisms of most panel data-based real exchange rate estimations.
12
units (N). In this context, they suggest using Panel Corrected Standard Errors (PCSE) in the case of non-spherical disturbances. This estimator is in effect the OLS estimator as it would look under the assumption that the disturbances are non-spherical. The PCSE also has the advantage that it does not require a time dimension (T) that is significantly larger than (N).13 We make use of both estimators as a robustness check. Given the relatively short sample period and the well-known difficulties of unit root tests in determining the order of integration in short samples, this paper uses the autoregressive distributed lag (ARDL) specification to estimate the regression model (Pesaran and others, 2001; Pesaran and Shin, 1999). The ARDL procedure has two stages. First, the bounds test approach advanced by Pesaran and others (2001) is used to ascertain whether there is a long-run relationship between the real exchange rate and a set of fundamentals, by examining the significance of the lagged levels of the variables in the error-correction form of the underlying ARDL model.14 Importantly, this methodology is applicable irrespective of whether the underlying regressors are stationary, nonstationary, or a mixture of both.15 Second, once the existence of a long-run relationship has been established, the ARDL model is estimated using OLS or GLS, following the ARDL approach of Pesaran and Shin (1999) to estimate an error-correction model of the real exchange rate. The vector of long-run parameters can be recovered by rewriting the estimated ARDL model as an error-correction model, in order to assess the speed of adjustment of the real exchange rate towards its long-run equilibrium. The long-run relationship should be interpreted as an equilibrium relationship rather than a causal one, since one might expect the presence of reverse causality, particularly between the real exchange rate and tourism. The main advantage of this specification is that valid asymptotic inferences on the short-run and long-run parameters can be made, using the generalized least squares estimator of the ARDL model, even in the presence of a lagged dependent variable and irrespective of the order of integration. In addition, the single-equation ARDL is parsimonious in the number of parameters to be estimated, and more efficient in small samples than the VAR-based cointegration approach of Johansen (see Pesaran and others, 2001; Chudik and Mongardini, 2007; Roudet and others, 2007).
13 When comparing the performance of both estimators Jönsson (2005) concludes that the PCSE estimator is preferable to its FGLS counterpart when ½ (N2 + N) ≥ T.
14 This is complicated by the fact the asymptotic distribution of the associated F-statistic is nonstandard and will depend on whether the regressors are I(0) or I(1). Pesaran, Shin, and Smith (2001) tabulate two sets of critical values. The first assumes that all the variables in the ARDL model are I(1) and the second that they are all I(0). This gives a band of critical values that covers all possible classifications of the variables into I(0), I(1), or even fractionally integrated. If the computed F-statistic falls outside this band, a decision about the existence of a level relationship can be made without knowing whether the underlying variables are I(0) or I(1).The critical values for the Wald version of the bounds test are given by k+1 times the critical values of the F-test, where k is the number of regressors. 15 In addition, Pesaran and others (2001) show that the small sample performance of the bound testing approach is superior to other cointegration approaches, particularly that of Johansen.
13
Estimation of the Equilibrium Exchange Rate
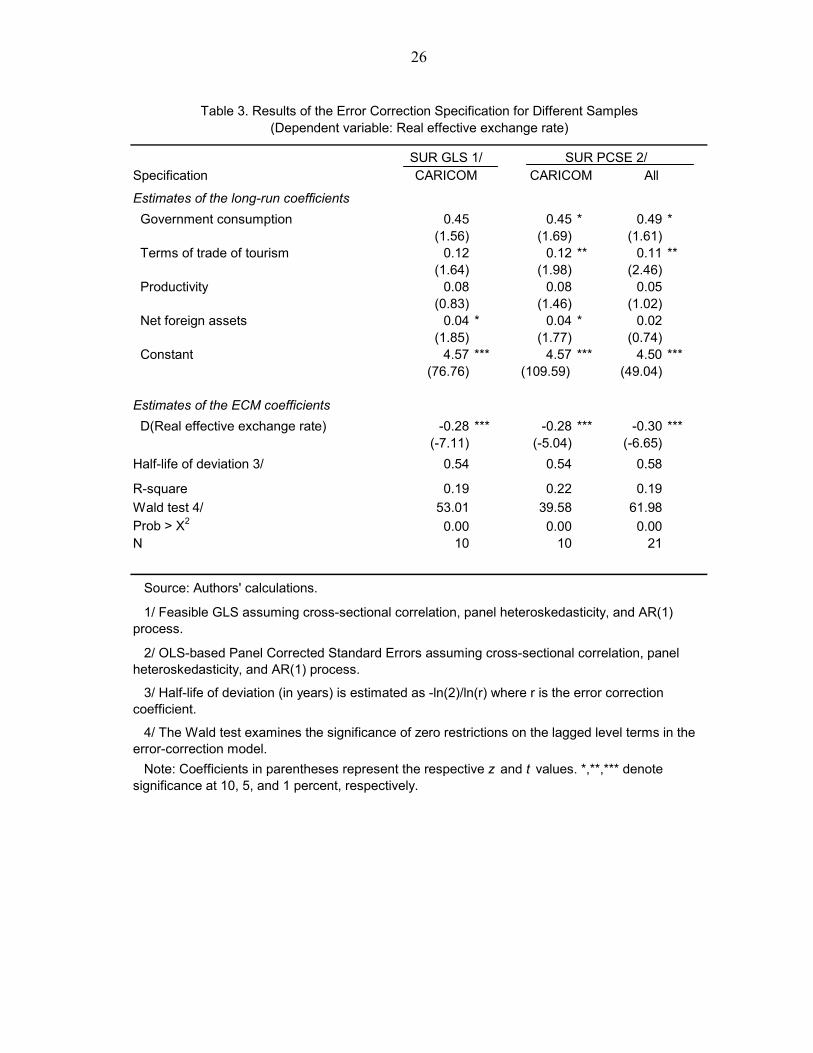
The test for the absence of a long-run level relationship between the real exchange rate and a set of fundamentals is a test for the joint hypothesis that the lagged levels of the variables in an error-correction model are all zero. That is, that there is no long-run relation between the variables. Overall, the results from the estimated model suggest that there exists a long-run relationship between the real exchange rate and the identified fundamentals, as the null of no cointegration was clearly rejected. 16 We ran the regressions for two sets of samples: (i) ECCU countries plus Jamaica, The Bahamas, Barbados, and Belize—the main tourism competitors in the region; and (ii) ECCU countries plus 15 tourism-dependent countries.17 This is to account for the possibility that the true equilibrium exchange rate could be below (or above) any of the realized REER for individual ECCU countries, but the methodology/sample would not be able to detect it. Overall, these results confirm the distinctive impact of tourism on the real exchange rate in tourism-dominated economies through: (i) Balassa-Samuelson effects driven by increases in productivity in the tourism sector; and (ii) wealth effects arising from the tourism terms of trade. Using the ARDL approach to estimate the long-run relations, we obtain the long-run real exchange rate equations set out in Table 3, which presents the results of both the SUR-GLS and the SUR-PCSE estimators.18 The results for the CARICOM sample and SUR-PCSE estimator (column 2) are as follows: • An increase of 10 percent in per capita tourist arrivals relative to per capita tourist arrivals in The Bahamas is associated with an appreciation of around three quarters of 1 percent in the equilibrium REER. Though not statistically significant, this is in line with the findings of IMF (2006) for a panel of developed and developing economies. • A 10 percent increase in the tourism terms of trade is associated with an equilibrium appreciation of the real exchange rate of 1.2 percent. This elasticity with respect to the tourism terms of trade is slightly smaller than that found for commodity-currencies by Cashin and others (2004), which ranged between 0.2 and 0.4. 16 As the model contains 4 regressors, the 95 percent critical value for the bounds F-test is (2.86, 4.01) and for the bounds Wald test is (11.44, 16.04). With a calculated Wald statistic of 53.01 (for model with lag order 1), the null hypothesis that there exists no long-run real exchange rate equation is clearly rejected.
17 Following Bayoumi and others (2005) we defined as tourism-dependent countries those where tourism exports exceeded a threshold of 20 percent of total export receipts. Bayoumi and others (2005) find 29 tourism-dependent countries, however, given the lack of tourist arrivals time-series for eight of them we were left with the following list of 21 countries: Antigua and Barbuda, The Bahamas, Barbados, Belize, Cyprus, Dominica, Dominican Republic, Egypt, Fiji, Greece, Grenada, Jamaica, Jordan, St. Kitts and Nevis, Malta, St. Lucia, St. Vincent and the Grenadines, Mauritius, Samoa, Seychelles, and Vanuatu. See Appendix II for the derivation of the data. 18 The ARDL approach of Pesaran and Shin (1999) is applicable, irrespective of whether the regressors are I(0) or I(1).
14
• An increase in the government consumption-to-GDP ratio of 10 percentage points is associated with an appreciation of the equilibrium real exchange rate of around 5 percent. This semi-elasticity is lower than the 2.6 value found by IMF (2006). • A deterioration of the ratio of net foreign assets to GDP of 10 percentage points would imply a depreciation of the equilibrium exchange rate by about four-tenths of 1 percent. This is in slightly larger than that found in IMF (2006). • The error-correction coefficient is negative and statistically significant, suggesting that the error-correction mechanism is stable. The half-life of deviations from equilibrium is around 6 months, considerably shorter than those predicted by the simple purchasing power parity (PPP) model. This is consistent with the findings of Cashin and others (2004) that controlling for the influence of real factors—such as real commodity prices—is an important channel to reduce the persistence of real exchange rate shocks. Any Evidence of Exchange Rate Misalignment?
The long-run relationship summarized above in Table 3 also permits the calculation of exchange rate misalignments (deviations of the actual real exchange rate from the estimated equilibrium real exchange rate). However, the explanatory variables can exhibit a substantial degree of “noise” or fluctuations. One way to ameliorate the impact of these fluctuations on the evaluation of the equilibrium exchange rate is the application of filtering or smoothing techniques to eliminate short-run fluctuations, so as to derive a proxy for the long run equilibrium or sustainable values of these variables. In order to obtain the predicted equilibrium real exchange rate we applied a Hodrick-Prescott filter with a smoothing factor of 10.19 Figures 6 and 7, derived using the equilibrium relationship found in the CARICOM sample of Table 3, confirm the findings made by the PPP analysis: real exchange rates in the ECCU in general have experienced two periods of overvaluation, one in the early 1980s, and a second in the early 2000s. Currently real exchange rates appear to be either close to their equilibrium level—Grenada, Dominica, St. Vincent and the Grenadines, and St. Lucia—or below their equilibrium values—St. Kitts and Nevis, and Antigua and Barbuda. When using the extended sample of 21 tourism-dependent countries to calculate the equilibrium levels, the real exchange rates of all ECCU countries once again show little evidence of overvaluation. In all cases the real exchange rate of ECCU countries appear to be very close to the equilibrium level, and this finding is robust to different specifications, samples and methodologies. It is useful to analyze the contribution of each of the fundamentals to changes in the equilibrium real exchange rate. As shown in Figures 8 and 9 for all ECCU countries, the
19 A smoothing factor of 10 is suggested by Baxter and King (1999) for annual data.
15
equilibrium real exchange rate has depreciated since 2000 as a result of a continuing accumulation of net foreign liabilities, and worsening terms of trade. In some countries—Antigua and Barbuda and St. Kitts and Nevis—fiscal consolidation has also contributed to a reduction in the equilibrium exchange rate. Higher productivity proxied by higher per capita tourist arrivals, is the only fundamental that has supported a higher equilibrium level since 2000 in all countries.
Overall, these findings are consistent with those of the PPP analysis, supporting the finding of little evidence of any significant misalignment in the EC dollar. Whereas the REER in most ECCU countries experienced a period of overvaluation in the early 2000s, in recent years the REER in all countries appears to be aligned with fundamentals. The empirical analysis suggests that the recent real depreciation of the EC dollar has corrected the real appreciation that occurred between 1998 and 2001.20
C. Macroeconomic Balance Approach
Common arguments to claim an overvaluation of the EC dollar are the apparent high current account imbalances in the region. In order to address this concern and provide an additional robustness check to the previous analyses, in this section we make use of the macroeconomic balance approach of the IMF’s Consultative Group on Exchange Rate Issues (CGER) to assess real exchange rates in the ECCU.21 This approach has been a pillar of current account and exchange rate assessments for a number of years, and is based on standard macroeconomic models that underscores that in open economies national saving may exceed or fall short of domestic investment, thus allowing consumption to be smoothed and investment to reflect relative rates of return (Isard and Faruqee, 1998; Isard and others, 2001; IMF, 2006; Obstfeld and Rogoff, 1996; Lee and others, 2008). The macroeconomic balance approach calculates the difference between the current account (CA) balance projected over the medium term at the prevailing exchange rate, and an estimated equilibrium current account balance or norm (IMF, 2006). If the CA projected for the medium term exceeds the estimated equilibrium CA or norm, there is evidence of overvaluation. In contrast, if the CA projected for medium term is close to its equilibrium level, then the real exchange rate is assumed to be at its equilibrium level. Following the substantial body of literature on the subject we used the following determinants to estimate equilibrium current account balances: • Fiscal balance. In the absence of full Ricardian equivalence, a fiscal surplus raises national saving and thereby increases the current account balance (IMF 2006; Isard and others; 2001). The measure of fiscal balance used below is the difference between the central 20 See also Grenade and Riley (2008) for an analysis of the determinants of the REER in the ECCU.
21 The three main approaches to CGER-based assessments of real exchange rates include the equilibrium real exchange rate approach; the macroeconomic balance approach; and the external stability approach. The latter is not presented here—it involves calculating the difference between the actual current account balance and the balance that would stabilize the net foreign asset position of the country at some benchmark level (for further details see IMF, 2006; Lee and others, 2008).
16
government budget balance to GDP of each ECCU country and the average budget balance of the U.S. and the U.K., the region’s main trading partners. The difference of budget balances is used because if the government balance were to change in all countries simultaneously, little impact would be expected on the current account balance for each country (IMF, 2006). • Oil balance. Higher oil prices decrease the current account balance of oil-importing countries such as the ECCU countries; at the same time it should improve the current account balance of oil-exporting countries (IMF, 2006). The variable used here is the oil balance as a ratio to GDP. • Relative income. The impact of relative per capita income on the CA may differ depending on the level of development. As argued by Isard and others (2001) at relatively low stages of development, increases in relative income would tend to improve a country’s access to foreign capital and thus be negative correlated with the current account balance, while at advanced stages of development the correlation between income and the current account would become positive because most advanced countries tend to be capital exporters. The ratio of PPP-based per-capita income to the average of the U.S. and the U.K. level is taken to measure the relative stage of development. • Relative economic growth. Among countries at a similar stage of development, the stronger is economic growth relative to trading partners, the lower is likely to be the current account balance (IMF, 2006). Thus the current account balance is expected to decline with relative growth. The deviation of the real per-capita GDP growth rate from the average of the U.S. and the U.K. is the variable used to capture relative economic growth. • Foreign Direct Investment. Typically, a developing country’s ability to run deficits is restricted by the availability of external financing. In this context, FDI typically provides a more stable source of financing for current account imbalances. Higher FDI also tends to affect the current account balance through increased imports. The sign of the coefficient on FDI is likely to depend on the import content of FDI (Rahman, 2008). • Grants. In a similar fashion to FDI, grants typically offer a significant source of financing for tourism-dependent economies. The sign of the coefficient is again likely to depend on the import-content of grant spending.
Estimation Results
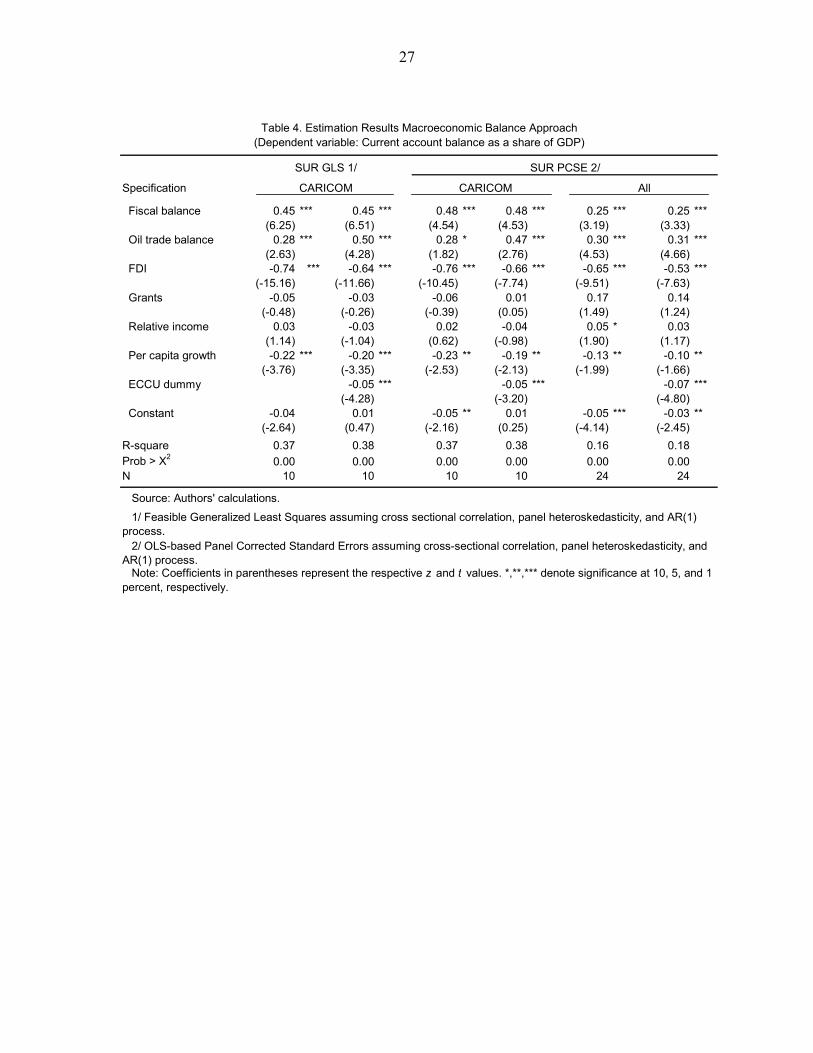
The estimated model found a significant long-run relationship between the current account deficit and identified fundamentals. As with the earlier analysis of the equilibrium real effective exchange rate, the same sets of samples were used in the panel estimation for the period 1979–2008. Estimated coefficients imply that for the CARICOM countries (see column 4 of Table 4):
• A 1 percentage point increase in the fiscal balance (relative to trading partners) would lead to around one-half of a percentage point of GDP improvement in the current account balance. This coefficient is consistent with those found by Chinn and Prasad (2003) and
17
Rahman (2008), who estimated a coefficient of 0.31 and 0.39, respectively, for panels of industrial and developing countries. • A 1 percentage point increase in the oil balance would be reflected in an increase in the current account balance of 0.47 percentage points of GDP. This coefficient is close to that found by IMF (2006) for a panel of industrial and developing countries (0.23). • The coefficient of -0.04 on relative income (while not statistically significant) implies that a country whose income is half the average of the U.S. and the U.K. level would have a current account balance that is 2 percentage point of GDP smaller than that of the U.K. and the U.S. This is of a similar magnitude (but opposite sign) to the results found by IMF (2006) and Chinn and Prasad (2003) for panels of industrial and developing countries. • At similar stages of development, a 1 percentage point increase in real GDP growth (compared to its trading partner average) reduces the current account balance by about 0.2 percentage points of GDP. This is in line with the results found by the CGER for a panel of industrial and developing countries (IMF, 2006).
• A 1 percentage point increase in FDI (as a share of GDP) would be reflected in a decrease in the current account balance of about 0.7 percentage points of GDP. This is close to the value found by Rahman (2008) for a panel of European countries, and likely reflects the high import content of the initial phases of FDI in tourism-dependent countries.
• A 1 percentage point increase in grants (as a share of GDP) would be reflected in a slight increase in the current account balance of about 0.01 percentage points of GDP.
• The current account balance of the ECCU as a whole is about 5 percentage points of GDP larger than those of other countries in the sample. Current Account Norms
The equilibrium relationship summarized above permits the calculation of equilibrium current account balances or “CA norms”. Figures 10 and 11 present current account balances and the CA norms for the ECCU aggregate and for individual countries. In computing the norms, medium-term (2014) values of the fiscal balance, oil balance, economic growth, FDI, grants, and relative income are obtained from IMF staff projections, as set out in the IMF’s World Economic Outlook database. The ECCU value is a simple average of the individual country norms.
The equilibrium current account deficit (the current account ‘norm’) is estimated at between 16-20 percent of GDP for the ECCU, for sample sets consisting of CARICOM-based and tourism-based economies. Accordingly, the staff’s projected medium-term current account balance for the ECCU is below the estimated level of the equilibrium current account when using either (i) the CARICOM sample or (ii) an extended sample of tourism-dependent countries, including a dummy variable for the ECCU. This implies that despite their apparent high levels, medium-term current account deficits in the region appear sustainable and in line with the equilibrium levels predicted by fundamentals. This also indicates that there is little
18
evidence of overvaluation of the real exchange rate, as the medium-term current account balance is close to the current account norm. When the extended sample is used without a dummy variable for the ECCU, the projected medium-term current balance is slightly above the estimated equilibrium level. In the estimation without the ECCU dummy, biases can arise if there are important factors explaining the cross-country variation in the data that are not captured in the specification but are correlated with the other variables. While the specification with the dummy controls for this possibility, the resulting estimates may be unduly influenced by historical realizations of the dependent variable. For this reason estimation results are presented for both specifications.22 23 As noted by Isard (2007), the macroeconomic balance approach to the assessment of exchange rate competitiveness may not be helpful for countries (like those of the ECCU) that have healthy future growth prospects and are thereby attracting sizeable external capital inflows, which are then mirrored in large current account deficits. In such cases, assessments of the level of the exchange rate would need to take into account, among other things, the extent to which such foreign capital inflows are used for productive investments that engender a reduction in current account imbalances over time. In this context, the financing of ECCU current account imbalances appears stable and likely to reduce future current account imbalances. In particular, the large projected current account deficits are not expected to be financed by the accumulation of external sovereign debt or by resources intermediated through domestic financial systems, but rather by private capital inflows (particularly FDI). Tourism sector investment, particularly for hotel construction, continues to be overwhelmingly financed by FDI, which is a highly-persistent channel of external flows (De Gregorio, 2003).24 As tourism-based investment opportunities in the ECCU decline over the medium term, both capital inflows and current account imbalances will narrow.25 Overall, the macroeconomic balance approach supports the findings of the two previous methodologies—there is little evidence of overvaluation of the EC dollar.26 In addition, it is of interest to ascertain the main drivers of the ECCU’s medium-term current account norm. As shown in Figure 12, FDI and the oil trade balance have been the major 22 Macroeconomic balance-based estimates of the equilibrium current account position are typically subject to uncertainty, given the large variation in current account balances across countries and over time, and the limits of the common specification imposed across a diverse set of countries.
23 Current account norms for the ECCU and other tourism-dependent countries are much larger than those calculated for other groups of developing countries, with the exception of the Baltic and new European Union member states (see Rahman 2008). See also IMF (2008) for an analysis of the persistence of current account imbalances in Asia and Europe.
24 In analyzing the capital account of Asian and Latin American countries in the 1990s, De Gregorio (2003) notes that the volatility of more liquid portfolio equity flows and external debt greatly exceed that of FDI.
25 Calculations by the authors estimate the current account elasticity of FDI flows to be in the range 0.5–0.7, meaning that FDI and current account balances move together.
26 Current account deficits in the ECCU are rather persistent, and have occurred in the context of the ECCU’s hard peg exchange rate arrangement. See Chinn and Wei (2008) on the absence of a link between the persistence of current account imbalances and the exchange rate regime.
19
contributors to the large current account imbalances generated by the countries of the ECCU. Also shown are the calculated current account norm and the actual current account balance—the positive differential between them (actual current account deficit larger than the calculated annual norm) widened in the early 1980s, late 1980s and late 2000s. What factors might be accounting for this persistent differential in the case of the ECCU? Both a positive output gap and rapid growth in bank credit to the private sector would induce a larger current account deficit, by contributing to larger imports (Rahman, 2008). In addition, FDI-induced flows raise spending on both tradables and nontradables, pushing up the relative price of nontradables (a real exchange rate appreciation) and yielding larger current account deficits.
V. CONCLUSIONS
Real exchange rates in the ECCU do not appear to be overvalued. The equilibrium real exchange rate estimation signals that the EC dollar real exchange rate is close to the level indicated by fundamentals. The empirical analysis shows that the depreciation of the EC dollar beginning in 2002 corrected a period of overvaluation, leaving the current real exchange rate closely aligned with fundamentals. In estimating the equilibrium real exchange rate for a panel of tourism-dependent economies, the analysis demonstrates that the impact of tourism on the real exchange rate is twofold. First, the real exchange rate is affected by the tourism terms of trade, where an increase in the price of the tourism good relative to the price of the imported foreign good induces an appreciation of the real effective exchange rate through wealth effects. Second, the real exchange rate is affected by an increase in the productivity of the tourism sector (associated with a Balassa-Samuelson effect) that increases wages in the nontradable sector, and thereby appreciates the real exchange rate. In addition, current account imbalances in the ECCU are projected to remain near equilibrium levels, and as tourism-based investment opportunities in the ECCU decline over the medium term, private capital inflows and current account imbalances will narrow. This implies that despite their current high levels, medium-term current account deficits in the region appear sustainable. Nonetheless, the region’s high levels of current account imbalances, public and external debt and associated financing needs do pose risks that warrant careful monitoring and continued efforts at fiscal consolidation, to enhance debt sustainability, maintain competitiveness, and support the region’s quasi-currency board arrangement.
20
Appendix I: Tourism and the Real Exchange Rate
A. Tourism Model
We consider a small open economy that produces two different types of goods: a tradable good and a non-tradable good, where the tradable is associated with tourism-related services (e.g. restaurant services and hotel accommodation). Our analysis builds on the model of Cashin, Céspedes and Sahay (2004), and is in line with the literature that stresses the role of terms of trade in affecting the real exchange rate (De Gregorio and Wolf, 1994; Obstfeld and Rogoff, 1996).
Domestic Production
There are two different sectors in the domestic economy: one sector produces a tradable good called “tourism services”, and the other sector produces a non-tradable.27 For simplicity we assume that the production of these two different types of good requires labor as the only factor. In particular, the production of tourism services is:
TTT LaY = , (A1)
where Ta is a measure of productivity in the tourism sector and TL is the amount of labor demanded by the tourism sector. Production of the non-traded good is undertaken in a similar fashion where Na represents productivity on the production of this good and NL is the employment of labor in the non-tradable sector:
NNN LaY = (A2) We assume that labor can move freely across sectors in such a way that labor wages must be the same across sectors. Under the assumption of profit maximization, an interior solution and competitive markets, the price side of the model is as follows:
.TT
NN
Paw
Paw
=
=
(A3)
In equilibrium, the marginal productivity of labor must equal the real wage across sectors. Furthermore, we assume that the price of the tourism good is exogenously determined and there is perfect competition in the non-traded sector. It follows then that the price of the non-
27 Crucially we assume “tourism services” to be a tradable as tourists will exercise arbitrage in the tourism consumption decision when deciding: whether to visit a country or not, and when deciding how much of the tourism services (e.g. length of the stay, restaurant meals, etc.) they should consume once they are at the destination.
21
traded good can be expressed as a function of the price of the tourism good and relative productivities:
.TN
TN P
aa
P = (A4)
From equations (3) and (4) it follows that an increase in the price of the tourism good will also increase wages and prices in the non-tradable sector, given our assumption of freely mobile labor.
Domestic Consumption
The domestic economy is inhabited by identical individuals that supply labor inelastically (with NT LLL += ) and consume the non-tradable good and an imported good. We assume that the tourism good is not consumed domestically. Domestic residents demand the imported and non-tradable good to maximize their utility which is assumed to be given by:
γγκ −= 1
IN CCC (A5)
where NC is consumption of the non-tradable good, and IC consumption of the imported good which is not produced domestically, and ĸ is an irrelevant constant. The minimum cost of one unit of consumption C is given by:
γγ −= 1
IN PPP (A6)
where IP is the price in local currency of one unit of the imported good, and P is the consumer price index. The law of one price is assumed to hold for, both, the imported good and the tourism good:
EP
P
EP
P
II
TT
*
*
=
= (A7)
where *
TP and *IP are the price of the tourism and imported goods respectively (in terms of
the foreign currency), and E is the nominal exchange rate. Foreign Production and Consumption
The foreign economy consists of two sectors: a non-tradable sector, and an imported good sector. The non-traded sector produces a good that is consumed only by foreigners and the imported good sector produces a good that is consumed only by domestic consumers. The production of both goods only requires labor:
22
***NNN LaY = (A8) .***
III LaY = (A9)
Similar to the domestic economy, we assume labor mobility across sectors of the foreign economy. As a result, foreign wages are equated across sectors, and we can express the price of the foreign non-tradable good as a function of relative productivities and the price of the imported good:
.**
**
IN
IN P
aa
P = (A10)
Foreign consumers are assumed to consume the foreign non-tradable good and the tourism good. They also supply labor inelastically to the different sectors. Therefore, the consumer price index for the foreign economy is given by:
( ) ( ) .1*** γγ −= TN PPP (A11)
Real Exchange Rate Determination
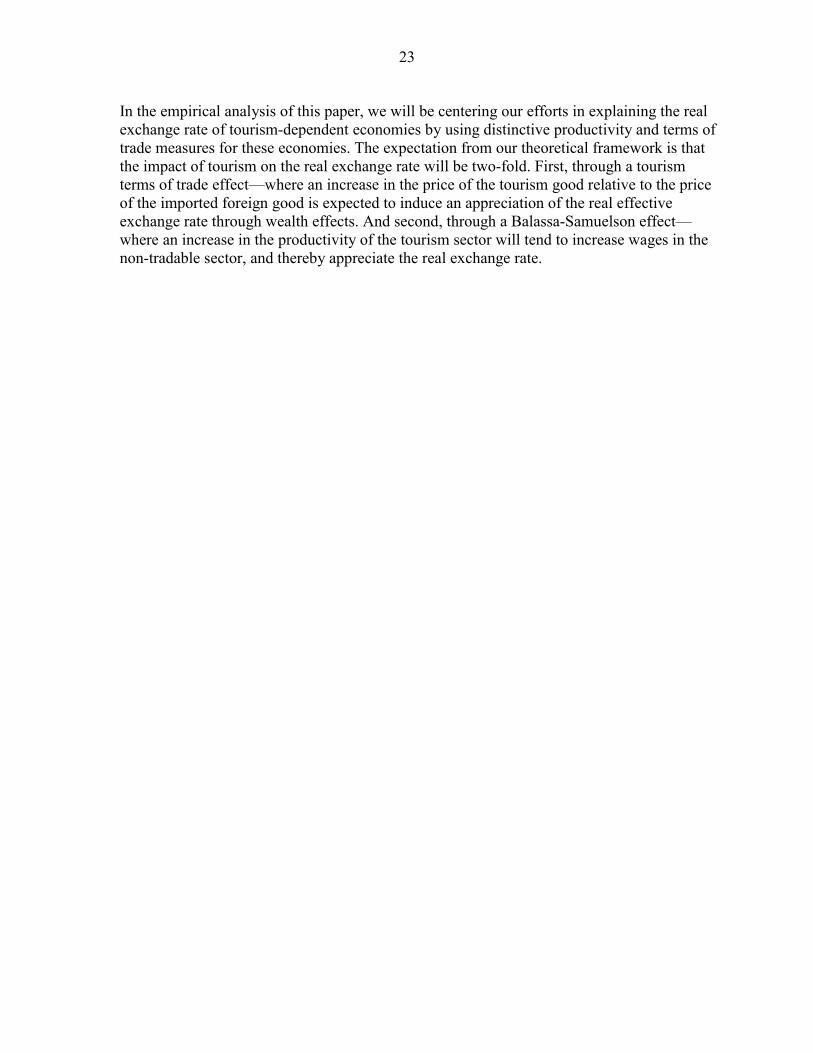
Now we define the real exchange rate as the domestic price of the basket of consumption relative to the price of the foreign basket of consumption (EP/P*). Using equations (A6) and (A10) we can show that:
12
*
*
*
*
*
−
⎟⎟⎠
⎞⎜⎜⎝
⎛⎟⎟⎠
⎞⎜⎜⎝
⎛=
γγ
I
T
IN
NT
PP
aaaa
PEP (A12)
where the term *
*
I
T
PP
corresponds to price of the tourism good with respect to the intermediate
foreign good or tourism terms of trade, *I
T
aa
represents the productivity differentials between
the tourism and foreign import sectors, and N
N
aa*
reflects productivity differentials between
the domestic and foreign non-tradable sectors. The last two terms represent the Balassa-Samuelson effect, where an increase in productivity in the tourism sector (the tradable sector) will tend to increase wages in the non-tradable sector, and thus increase the price of the nontradable good. Since the price of the tourism good is assumed to be determined exogenously, this implies an appreciation of the real exchange rate. Accordingly, just as commodity prices have been shown to play a significant role in determining the real exchange rate, tourism receipts are likely to play an important role in explaining movements of the real exchange rate.
23
In the empirical analysis of this paper, we will be centering our efforts in explaining the real exchange rate of tourism-dependent economies by using distinctive productivity and terms of trade measures for these economies. The expectation from our theoretical framework is that the impact of tourism on the real exchange rate will be two-fold. First, through a tourism terms of trade effect—where an increase in the price of the tourism good relative to the price of the imported foreign good is expected to induce an appreciation of the real effective exchange rate through wealth effects. And second, through a Balassa-Samuelson effect—where an increase in the productivity of the tourism sector will tend to increase wages in the non-tradable sector, and thereby appreciate the real exchange rate.
24
Appendix II. Data Sources
The dataset consists of annual observations for 21 tourism-dependent economies (for the real exchange rate analysis) and 24 tourism-dependent economies (for the macroeconomic balance approach to the current account), both for the period 1979–2008. The ECCU average is the GDP weighted average of the six ECCU countries. Variables • Log REER: Logarithm of the real effective exchange rate (REER), based on the
consumer price index. Source: IMF, Information Notice System (INS) database. • Government consumption: Central government consumption spending as a percentage
of GDP (measured relative to the U.S. and U.K.). Source: IMF, World Economic Outlook (WEO) database.
• Log terms of trade of tourism: The proxy used are movements in the terms of trade of goods and services (TT) not explained by movements in terms of trade of only goods (TTG). Source: IMF, WEO database.
• Productivity: Per capita tourist arrivals as share of per capita tourist arrivals in The Bahamas. Source: World Tourism Organization and Caribbean Tourism Organization.
• Net foreign assets: Net foreign assets as a proportion of GDP, with net foreign assets estimated as the accumulated current account balances (from 1978 onwards). Source: IMF, WEO database.
• Fiscal balance: Central government overall balance as a percentage of GDP (measured as the deviation of each country’s balance from the average balance of the U.S. and U.K.). Source: IMF, WEO database.
• Oil trade balance: Balance of trade in net oil exports (as a share of GDP). Source: IMF, WEO database.
• Relative income: The ratio of PPP-based per-capita income in each country relative to the average of the U.S. and the U.K. levels. Source: IMF, WEO database.
• Per capita growth: The deviation of the real per-capita GDP growth rate from the average of the U.S. and the U.K. Source: IMF, WEO database.
• Foreign direct investment: FDI as a share of GDP. Source: IMF, WEO database. • Grants: External grants as a share of GDP. Source: IMF, WEO database; World Bank,
Global Development Finance.
25
p -value p -valueAntigua and Barbuda -2.14 0.23 -1.68 0.44Dominica -3.33 ** 0.01 -2.47 0.12Grenada -4.35 *** 0.00 -2.92 ** 0.04St. Kitts & Nevis -2.29 0.17 -1.71 0.42St. Lucia -3.58 *** 0.01 -2.66 * 0.08St. Vincent & the Grenadines -3.23 ** 0.02 -2.24 0.19
Source: Authors' calculations.
Notes: REER denotes the natural logarithm of the real effective exchange rate; ADF denotes Augmented Dickey-Fuller unit root test statistic; PP denotes Phillips-Perron unit root test statistic, based on non-parametric correction for serial correlation; *,**,*** denote significance at 10, 5, and 1 percent, respectively. One lag was selected following the Akaike information criterion.
Table 1. ECCU: Unit Root Tests on REER
ADF PP
Cross-sectional independence p -value NIm-Pesaran-Shin -4.04 *** 0.00 169Levin-Lin-Chu -2.89 *** 0.00 169Hadri 1.11 0.13 180
Cross-sectional dependence t -value Crit. value NGLS-based -5.92 *** -4.56 168PCSE-based -4.63 *** -1.94 168
Source: Authors' calculations.
Notes: REER denotes the natural logarithm of the real effective exchange rate; *,**,*** denote significance at 10, 5, and 1 percent, respectively. The GLS-based critical values (CV, at the 5 percent level) are provided by Harvey and Bates (2003), while the PCSE critical values are provided by Jonsson (2005).
Table 2. ECCU: Panel Unit Root Tests on REER
t -value
26
Specification
Estimates of the long-run coefficients Government consumption 0.45 0.45 * 0.49 *
(1.56) (1.69) (1.61) Terms of trade of tourism 0.12 0.12 ** 0.11 **
(1.64) (1.98) (2.46) Productivity 0.08 0.08 0.05
(0.83) (1.46) (1.02) Net foreign assets 0.04 * 0.04 * 0.02
(1.85) (1.77) (0.74) Constant 4.57 *** 4.57 *** 4.50 ***
(76.76) (109.59) (49.04)
Estimates of the ECM coefficients D(Real effective exchange rate) -0.28 *** -0.28 *** -0.30 ***
(-7.11) (-5.04) (-6.65)Half-life of deviation 3/ 0.54 0.54 0.58
R-square 0.19 0.22 0.19Wald test 4/ 53.01 39.58 61.98Prob > Χ2 0.00 0.00 0.00N 10 10 21
Source: Authors' calculations.
Table 3. Results of the Error Correction Specification for Different Samples
Note: Coefficients in parentheses represent the respective z and t values. *,**,*** denote significance at 10, 5, and 1 percent, respectively.
2/ OLS-based Panel Corrected Standard Errors assuming cross-sectional correlation, panel heteroskedasticity, and AR(1) process.
3/ Half-life of deviation (in years) is estimated as -ln(2)/ln(r) where r is the error correction coefficient.
SUR PCSE 2/CARICOM
4/ The Wald test examines the significance of zero restrictions on the lagged level terms in the error-correction model.
1/ Feasible GLS assuming cross-sectional correlation, panel heteroskedasticity, and AR(1) process.
(Dependent variable: Real effective exchange rate)
CARICOMSUR GLS 1/
All
27
Specification
Fiscal balance 0.45 *** 0.45 *** 0.48 *** 0.48 *** 0.25 *** 0.25 ***(6.25) (6.51) (4.54) (4.53) (3.19) (3.33)
Oil trade balance 0.28 *** 0.50 *** 0.28 * 0.47 *** 0.30 *** 0.31 ***(2.63) (4.28) (1.82) (2.76) (4.53) (4.66)
FDI -0.74 *** -0.64 *** -0.76 *** -0.66 *** -0.65 *** -0.53 ***(-15.16) (-11.66) (-10.45) (-7.74) (-9.51) (-7.63)
Grants -0.05 -0.03 -0.06 0.01 0.17 0.14(-0.48) (-0.26) (-0.39) (0.05) (1.49) (1.24)
Relative income 0.03 -0.03 0.02 -0.04 0.05 * 0.03(1.14) (-1.04) (0.62) (-0.98) (1.90) (1.17)
Per capita growth -0.22 *** -0.20 *** -0.23 ** -0.19 ** -0.13 ** -0.10 **(-3.76) (-3.35) (-2.53) (-2.13) (-1.99) (-1.66)
ECCU dummy -0.05 *** -0.05 *** -0.07 ***(-4.28) (-3.20) (-4.80)
Constant -0.04 0.01 -0.05 ** 0.01 -0.05 *** -0.03 **(-2.64) (0.47) (-2.16) (0.25) (-4.14) (-2.45)
R-square 0.37 0.38 0.37 0.38 0.16 0.18Prob > Χ2 0.00 0.00 0.00 0.00 0.00 0.00N 10 10 10 10 24 24
Source: Authors' calculations.
1/ Feasible Generalized Least Squares assuming cross sectional correlation, panel heteroskedasticity, and AR(1) process. 2/ OLS-based Panel Corrected Standard Errors assuming cross-sectional correlation, panel heteroskedasticity, and AR(1) process. Note: Coefficients in parentheses represent the respective z and t values. *,**,*** denote significance at 10, 5, and 1 percent, respectively.
CARICOM
Table 4. Estimation Results Macroeconomic Balance Approach(Dependent variable: Current account balance as a share of GDP)
SUR GLS 1/ SUR PCSE 2/
CARICOM All
28
65
75
85
95
105
115
125
135
Jan-79 Jan-84 Jan-89 Jan-94 Jan-99 Jan-04 Jan-09
Sources: IMF Information Notice System; and Fund staff estimates. 1/ Trade-weighted index of nominal exchange rates deflated by seasonally adjusted relative consumer prices. An increase (decrease) indicates an appreciation (depreciation). Excludes Anguilla and Montserrat in the calculation of the ECCU average. Data up to January 2009 for all countries.
Antigua and Barbuda
St. Vincent and the Grenadines
St. Kitts and Nevis
St. Lucia
Grenada
Dominica
ECCU
Figure 1. ECCU: Real Exchange Rate--Real Effective Exchange Rate, 1979–2009 1/(2000=100)
20
40
60
80
100
120
140
160
180
200
220
240
Jan-79 Jan-84 Jan-89 Jan-94 Jan-99 Jan-04 Jan-09
Sources: IMF Information Notice System; and Fund staff estimates. 1/ Trade-weighted index of nominal exchange rates deflated by seasonally adjusted relative consumer prices. An increase (decrease) indicates an appreciation (depreciation). Excludes Anguilla and Montserrat in the calculation of the ECCU average. Data up to January 2009 for all countries.
Belize
Suriname
Guyana
The BahamasHaiti
ECCU
Jamaica
Barbados
Trinidad and Tobago
Figure 2. The Caribbean: Real Exchange Rate--Real Effective Exchange Rate, 1979–2009 1/(2000=100)
29
75
80
85
90
95
100
105
110
115
120
125
130
135
140
Jan-79 Jan-84 Jan-89 Jan-94 Jan-99 Jan-04 Jan-09
St. Vincent andthe Grenadines
St. Kitts and NevisGrenada
Antigua and Barbuda
Dominica
ECCU
St. Lucia
Sources: IMF Information Notice System; and Fund staff estimates. 1/ Customers-weighted index of nominal exchange rates deflated by seasonally adjusted relative consumer prices. An increase (decrease) indicatesan appreciation (depreciation). Excludes Anguilla and Montserrat in the calculation of the ECCU average. Data up to January 2009 for all countries. 2/ Customers: Antigua and Barbuda-(Canada, UK, US), Dominica-(France, UK, US), Grenada-(Trinidad and Tobago, UK, US), St. Kits and Nevis-(Canada, U.K., U.S.), St. Lucia-(Canada, U.K., U.S.), St. Vincent and the Grenadines-(Trinidad and Tobago, U.K., U.S.).
Figure 3. Real Exchange Rates With Respect to Main Customers of the Tourism Sector,1979–2009 (2000=100) 1/ 2/
70
75
80
85
90
95
100
105
110
115
120
125
130
135
140
Jan-79 Jan-82 Jan-85 Jan-88 Jan-91 Jan-94 Jan-97 Jan-00 Jan-03 Jan-06 Jan-09
St. Vincent andthe Grenadines
St. Kitts and Nevis
Grenada
Antigua and Barbuda
Dominica
ECCU
St. Lucia
Sources: IMF Information Notice System; and Fund staff estimates. 1/ Competitors-weighted index of nominal exchange rates deflated by seasonally adjusted relative consumer prices. An increase (decrease) indicates an appreciation (depreciation). Excludes Anguilla and Montserrat in the calculation of the ECCU average. Data up to January 2009 for all countries. 2/The competitors with their respective weights in the index are: The Bahamas (23.4 %), Barbados (8.0 %), Dominican Republic (43.5 %), Jamaica (19.4 %), and Trinidad and Tobago (5.7 %). The weights are chosen based on the share of tourism arrivals to the Caribbean in 2001.
Figure 4. Real Exchange Rates With Respect to Tourism Competitors, 1979–2009 1/ 2/ (2000=100)
30
Figure 5. ECCU: Actual and Long-Run Average REER, 1979–2008 1/(Index 2000=100)
Sources: IMF, Information Notice System; and authors' calculations.
Antigua and Barbuda
80
90
100
110
120
130
140
1979 1986 1993 2000 2007
ActualLong-run average
Dominica
70
80
90
100
110
120
130
140
1979 1986 1993 2000 2007
ActualLong-run average
Grenada
70
80
90
100
110
120
130
140
1979 1986 1993 2000 2007
ActualLong-run average
St. Kitts and Nevis
80
90
100
110
120
130
140
1979 1986 1993 2000 2007
Actual
Long-run average
St. Lucia
70
80
90
100
110
120
130
140
1979 1986 1993 2000 2007
ActualLong-run average
St. Vincent and the Grenadines
80
90
100
110
120
130
140
1979 1986 1993 2000 2007
ActualLong-run average
80
90
100
110
120
1979 1983 1987 1991 1995 1999 2003 2007
Actual Equilibrium
Sources: IMF, Information Notice System; and authors' calculations. 1/ The dotted lines around the equilibrium exchange rate represent 90 percent confidence intervals of the prediction.
Figure 6. ECCU: Actual and Equilibrium REER, 1979–2008 1/(Index 2000=100)
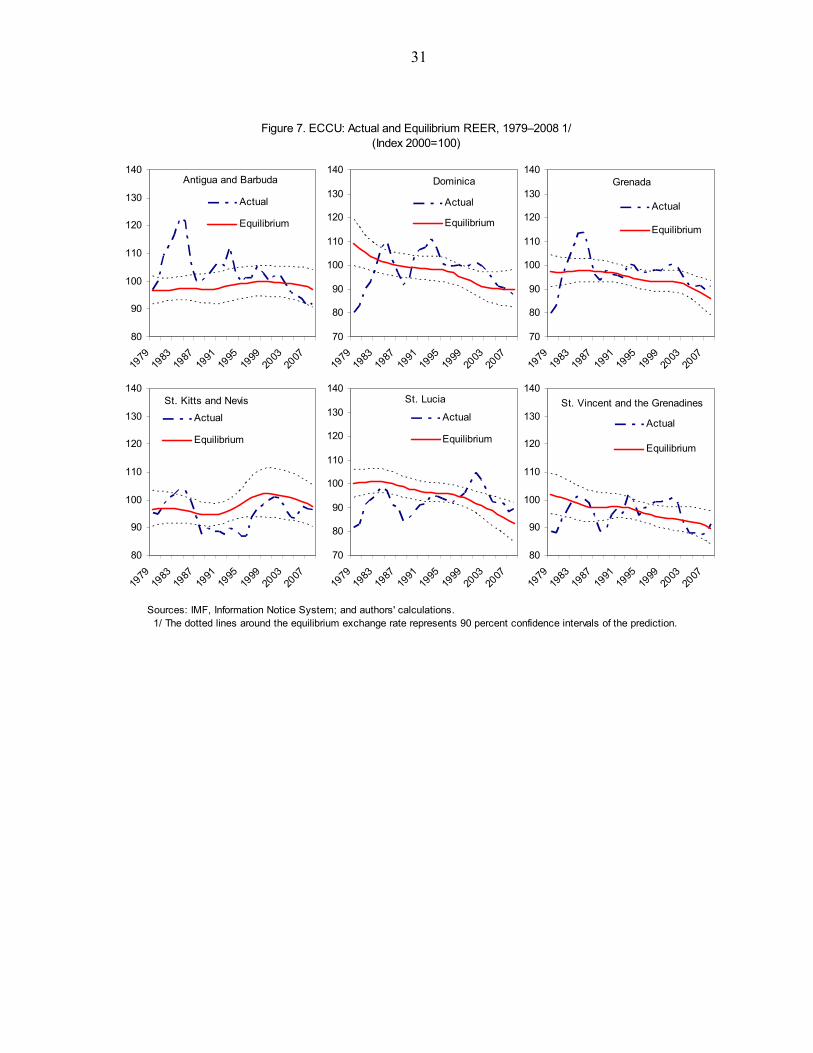
31
Figure 7. ECCU: Actual and Equilibrium REER, 1979–2008 1/(Index 2000=100)
Sources: IMF, Information Notice System; and authors' calculations. 1/ The dotted lines around the equilibrium exchange rate represents 90 percent confidence intervals of the prediction.
Antigua and Barbuda
80
90
100
110
120
130
140
1979
1983
1987
1991
1995
1999
2003
2007
Actual
Equilibrium
Dominica
70
80
90
100
110
120
130
140
1979
1983
1987
1991
1995
1999
2003
2007
Actual
Equilibrium
Grenada
70
80
90
100
110
120
130
140
1979
1983
1987
1991
1995
1999
2003
2007
Actual
Equilibrium
St. Kitts and Nevis
80
90
100
110
120
130
140
1979
1983
1987
1991
1995
1999
2003
2007
Actual
Equilibrium
St. Lucia
70
80
90
100
110
120
130
140
1979
1983
1987
1991
1995
1999
2003
2007
Actual
Equilibrium
St. Vincent and the Grenadines
80
90
100
110
120
130
140
1979
1983
1987
1991
1995
1999
2003
2007
Actual
Equilibrium
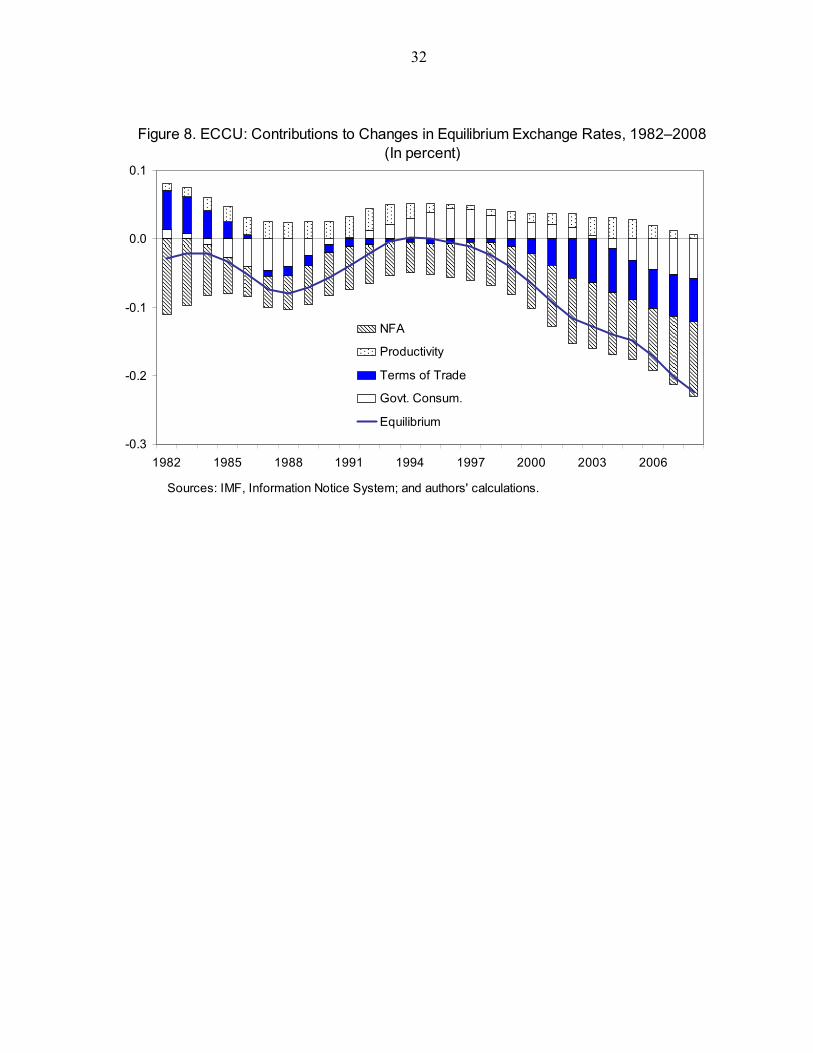
32
-0.3
-0.2
-0.1
0.0
0.1
1982 1985 1988 1991 1994 1997 2000 2003 2006
NFA
Productivity
Terms of Trade
Govt. Consum.
Equilibrium
Sources: IMF, Information Notice System; and authors' calculations.
Figure 8. ECCU: Contributions to Changes in Equilibrium Exchange Rates, 1982–2008(In percent)
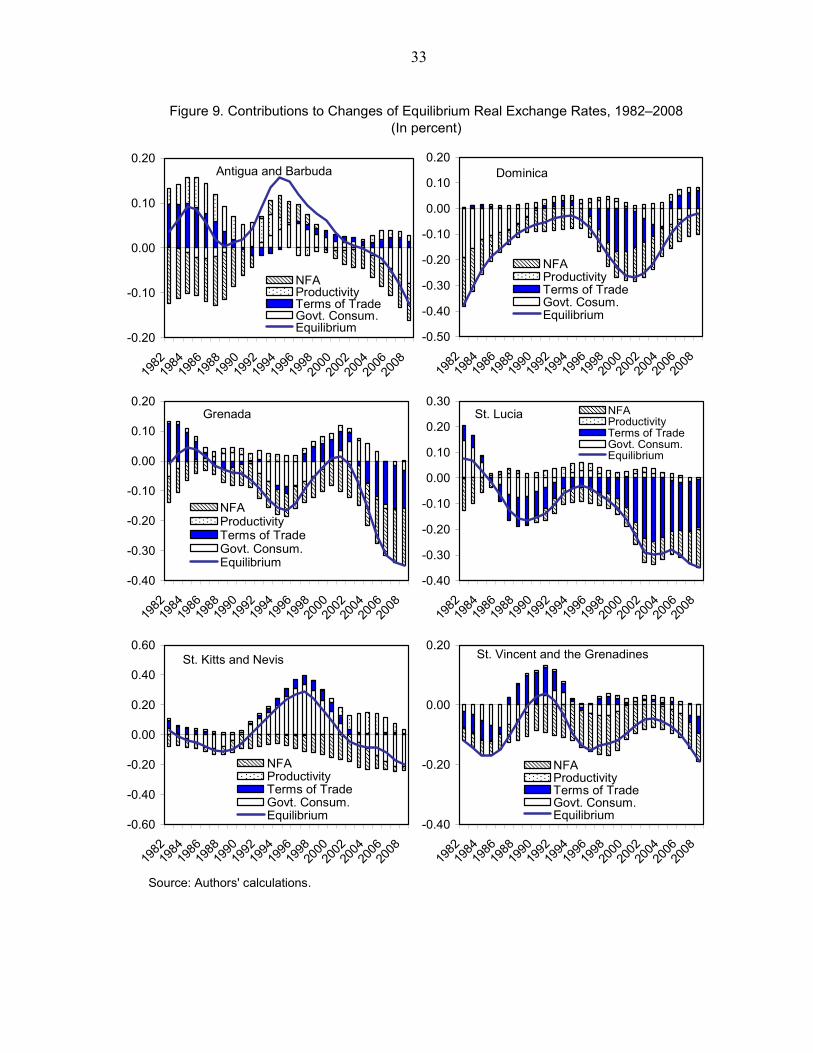
33
Source: Authors' calculations.
Antigua and Barbuda
-0.20
-0.10
0.00
0.10
0.20
1982
1984
1986
1988
1990
1992
1994
1996
1998
2000
2002
2004
2006
2008
NFAProductivityTerms of Trade Govt. Consum.Equilibrium
Dominica
-0.50
-0.40
-0.30
-0.20
-0.10
0.00
0.10
0.20
1982
1984
1986
1988
1990
1992
1994
1996
1998
2000
2002
2004
2006
2008
NFAProductivityTerms of Trade Govt. Cosum.Equilibrium
Grenada
-0.40
-0.30
-0.20
-0.10
0.00
0.10
0.20
1982
1984
1986
1988
1990
1992
1994
1996
1998
2000
2002
2004
2006
2008
NFAProductivityTerms of Trade Govt. Consum.Equilibrium
St. Lucia
-0.40
-0.30
-0.20
-0.10
0.00
0.10
0.20
0.30
1982
1984
1986
1988
1990
1992
1994
1996
1998
2000
2002
2004
2006
2008
NFAProductivityTerms of Trade Govt. Consum.Equilibrium
St. Kitts and Nevis
-0.60
-0.40
-0.20
0.00
0.20
0.40
0.60
1982
1984
1986
1988
1990
1992
1994
1996
1998
2000
2002
2004
2006
2008
NFAProductivityTerms of Trade Govt. Consum.Equilibrium
St. Vincent and the Grenadines
-0.40
-0.20
0.00
0.20
1982
1984
1986
1988
1990
1992
1994
1996
1998
2000
2002
2004
2006
2008
NFAProductivityTerms of Trade Govt. Consum.Equilibrium
Figure 9. Contributions to Changes of Equilibrium Real Exchange Rates, 1982–2008(In percent)
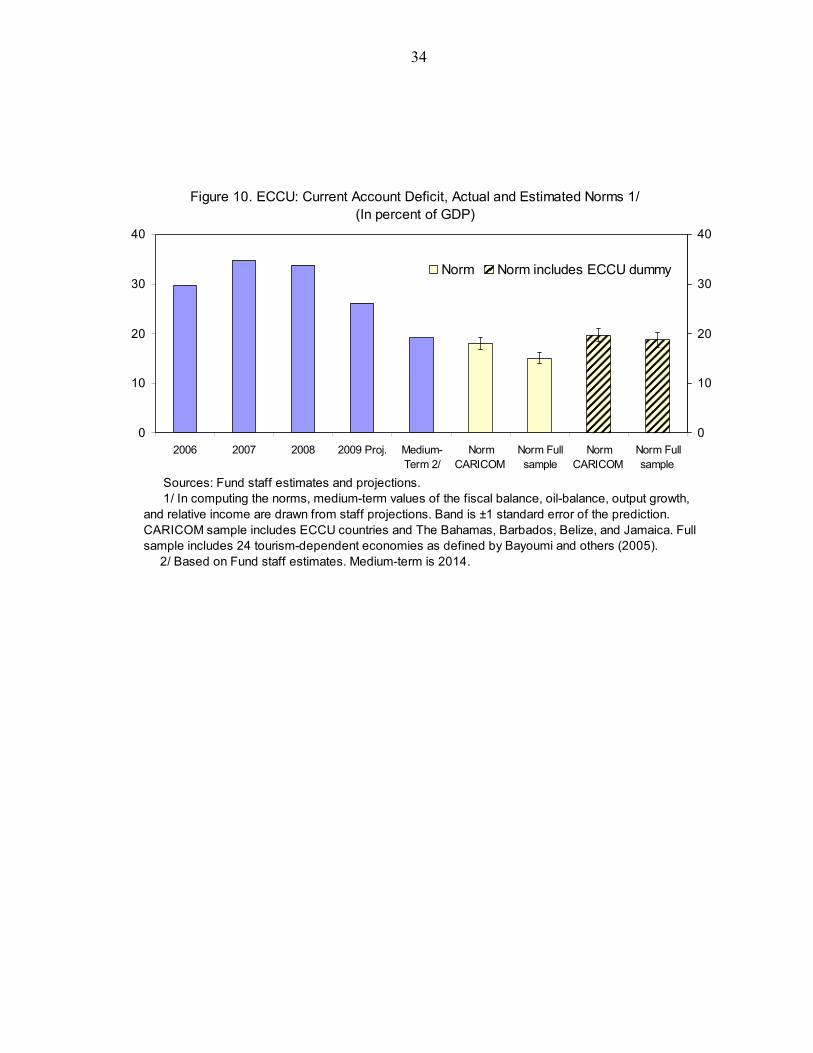
34
0
10
20
30
40
2006 2007 2008 2009 Proj. Medium-Term 2/
NormCARICOM
Norm Fullsample
NormCARICOM
Norm Fullsample
0
10
20
30
40
Norm Norm includes ECCU dummy
Figure 10. ECCU: Current Account Deficit, Actual and Estimated Norms 1/(In percent of GDP)
Sources: Fund staff estimates and projections. 1/ In computing the norms, medium-term values of the fiscal balance, oil-balance, output growth, and relative income are drawn from staff projections. Band is ±1 standard error of the prediction. CARICOM sample includes ECCU countries and The Bahamas, Barbados, Belize, and Jamaica. Full sample includes 24 tourism-dependent economies as defined by Bayoumi and others (2005). 2/ Based on Fund staff estimates. Medium-term is 2014.
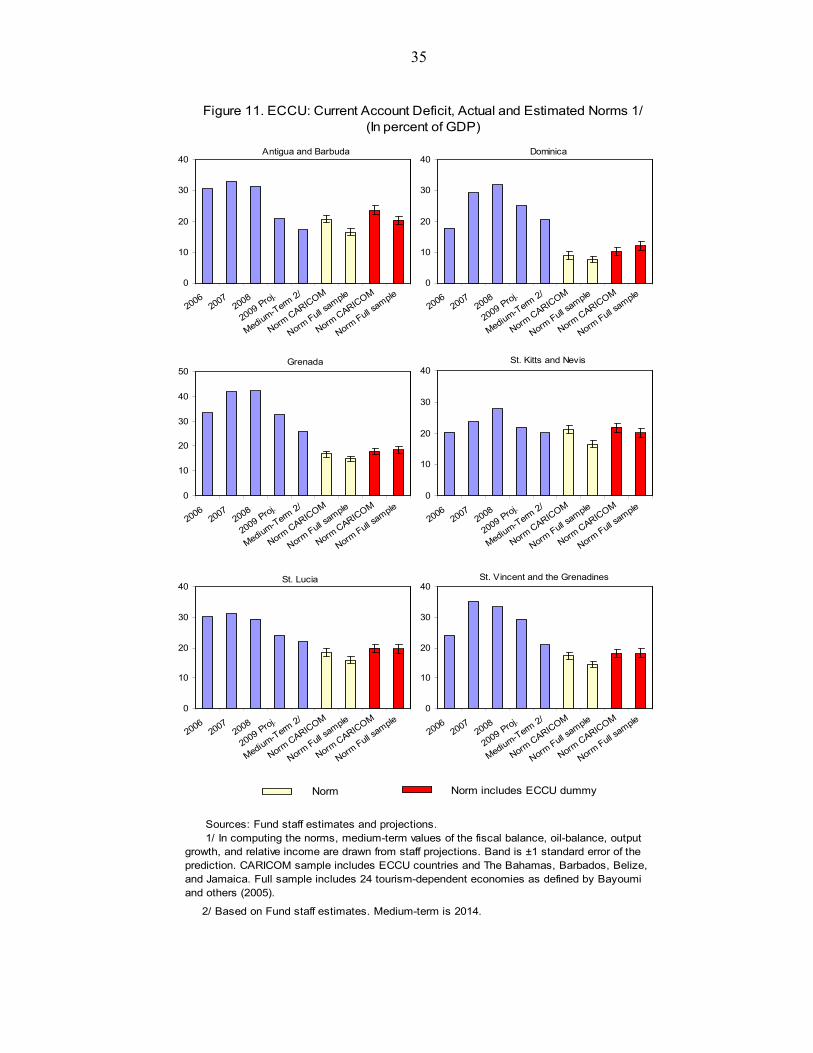
35
Figure 11. ECCU: Current Account Deficit, Actual and Estimated Norms 1/(In percent of GDP)
0
10
20
30
40
20062007
2008
2009 Proj.
Medium-Term 2/
Norm CARICOM
Norm Full s
ample
Norm CARICOM
Norm Full s
ample
Antigua and Barbuda
0
10
20
30
40
20062007
2008
2009 Proj.
Medium-Term 2/
Norm CARICOM
Norm Full s
ample
Norm CARICOM
Norm Full s
ample
Dominica
0
10
20
30
40
50
20062007
2008
2009 Proj.
Medium-Term 2/
Norm CARICOM
Norm Full s
ample
Norm CARICOM
Norm Full s
ample
Grenada
0
10
20
30
40
20062007
2008
2009 Proj.
Medium-Term 2/
Norm CARICOM
Norm Full s
ample
Norm CARICOM
Norm Full s
ample
St. Kitts and Nevis
0
10
20
30
40
20062007
2008
2009 Proj.
Medium-Term 2/
Norm CARICOM
Norm Full s
ample
Norm CARICOM
Norm Full s
ample
St. Lucia
0
10
20
30
40
20062007
2008
2009 Proj.
Medium-Term 2/
Norm CARICOM
Norm Full s
ample
Norm CARICOM
Norm Full s
ample
St. Vincent and the Grenadines
Sources: Fund staff estimates and projections. 1/ In computing the norms, medium-term values of the fiscal balance, oil-balance, output growth, and relative income are drawn from staff projections. Band is ±1 standard error of the prediction. CARICOM sample includes ECCU countries and The Bahamas, Barbados, Belize, and Jamaica. Full sample includes 24 tourism-dependent economies as defined by Bayoumi and others (2005).
2/ Based on Fund staff estimates. Medium-term is 2014.
Norm includes ECCU dummyNorm
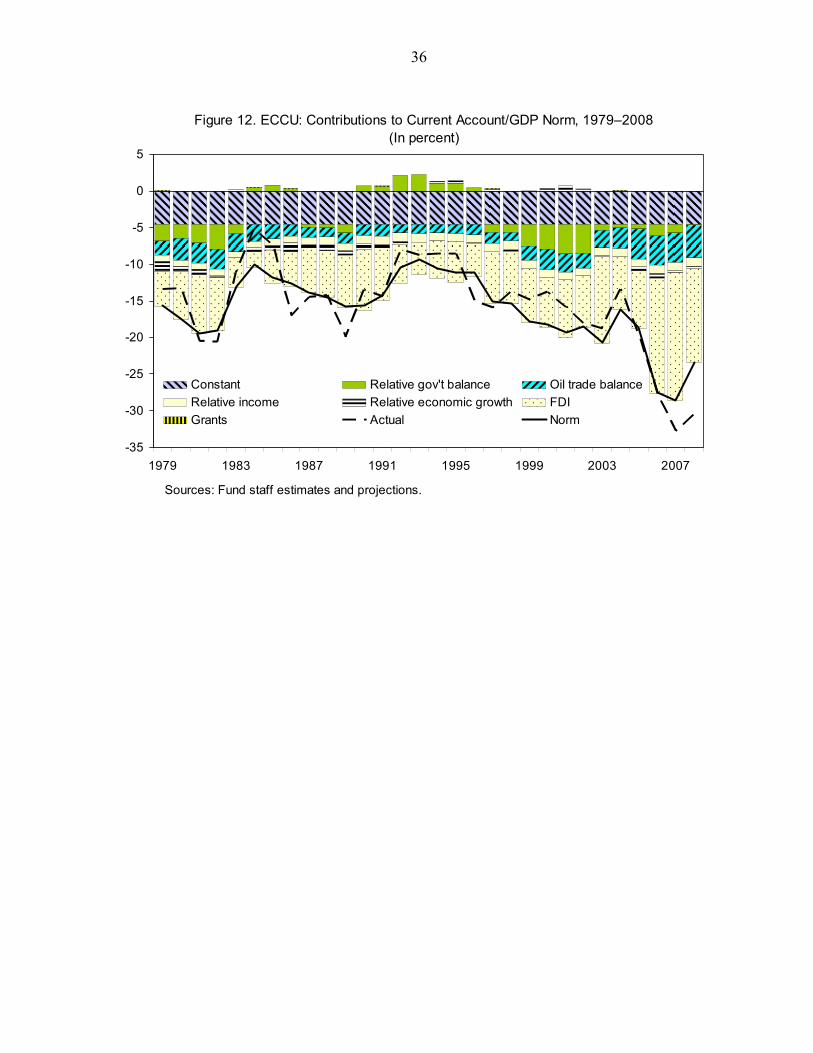
36
-35
-30
-25
-20
-15
-10
-5
0
5
1979 1983 1987 1991 1995 1999 2003 2007
Constant Relative gov't balance Oil trade balanceRelative income Relative economic growth FDIGrants Actual Norm
Sources: Fund staff estimates and projections.
Figure 12. ECCU: Contributions to Current Account/GDP Norm, 1979–2008 (In percent)
37
References Abdih, Y. and C.G. Tsangarides, 2006, “FEER for the CFA Franc,” IMF Working Paper
06/236 (Washington, DC: International Monetary Fund). Baxter, M. and R.G. King, 1999, “Measuring Business Cycles: Approximate Band-Pass
Filters for Economic Time Series,” Review of Economics and Statistics, Vol. 81, pp. 575–93.
Bayoumi, T., H. Faruqee, and J. Lee, 2005, “A Fair Exchange? Theory and Practice of
Calculating Underlying Exchange Rate Trends,” IMF Working Paper 05/229 (Washington DC: International Monetary Fund).
Beck, N. and N. Katz, 1995, “What to Do (and Not to Do) with Time-Series Cross-Section
Data,” American Political Science Review, Vol. 89. Breitung, J. and S. Das, 2005, “Panel Unit Root Tests Under Cross Sectional Dependence,”
Statistica Neerlandica, Vol. 59, pp. 414–33. Breitung, J. and M.H. Pesaran 2005, “Unit Roots and Cointegration in Panels,” CESIFO
Working Paper, No. 1565. Cashin, P. and C.J. McDermott, 2006, “An Unbiased Appraisal of Purchasing Power Parity,”
IMF Staff Papers, Vol. 50, pp. 321–51. Cashin, P., C.J. McDermott and C. Pattillo, 2004, “Terms of Trade Shocks in Africa: Are
They Short-Lived or Long-Lived?,” Journal of Development Economics, Vol. 73, pp. 727-44.
Cashin, P., L.F. Céspedes, and R. Sahay, 2004, “Commodity Currencies and the Real
Exchange Rate,” Journal of Development Economics, Vol. 75, pp. 239–68. Chen, Y.-C. and K. Rogoff, 2003, “Commodity Currencies,” Journal of International
Economics, Vol. 60, pp. 133–60. Cheung, Y.-W. and K. Lai, 2000, “On the Purchasing Power Parity Puzzle,” Journal of
International Economics, Vol. 52, pp. 375–97. Chinn, M. and E. Prasad, 2003, “Medium-Term Determinants of Current Accounts in
Industrial and Developing Countries: An Empirical Exploration,” Journal of International Economics, Vol. 59, pp. 47–76.
38
Chinn, M. and S.J. Wei, 2008, “A Faith-Based Initiative: Do We Really Know that a Flexible Exchange Rate Regime Facilitates Current Account Adjustment?” mimeo, University of Wisconsin.
Choi, I., 2001, “Unit Root Tests for Panel Data,” Journal of International Money and
Finance, Vol. 20, pp. 249–72. Chudik, A. and J. Mongardini, 2007, “In Search of Equilibrium: Estimating Equilibrium Real
Exchange Rates in Low-Income African Countries,” Assessing Competitiveness and Real Exchange Rate Misalignment in Low-Income Countries,” IMF Working Paper 07/90 (Washington DC: International Monetary Fund).
Darius, R. and O. Williams, 2000, “An Examination of the Purchasing Power Parity
Hypothesis in a Low Inflation Environment”, Eastern Caribbean Central Bank, mimeo.
De Gregorio, J. and H. Wolf, 1994, “Terms of Trade, Productivity, and the Real Exchange
Rate,” NBER Working Paper 4807 (Cambridge MA: National Bureau of Economic Research).
De Gregorio, J., 2003, “The Role of Foreign Direct Investment and Natural Resources in
Economic Development,” Central Bank of Chile Working Paper No. 196 (Santiago: Central Bank of Chile).
Diaz-Alejandro, C., 1982, “Exchange Rates and the Terms of Trade in the Argentine
Republic, 1913–76,” in Trade, Stability, Technology, and Equity in Latin America, ed. By M. Syrquin and S. Teitel, (New York: Academic Press), pp. 27-41.
Di Bella, G., M. Lewis, and A. Martin, 2007, “Assessing Competitiveness and Real
Exchange Rate Misalignment in Low-Income Countries,” IMF Working Paper 07/201 (Washington DC: International Monetary Fund).
Edwards, S., 1989, Real Exchange Rate Devaluation and Adjustments (Cambridge, Mass.:
MIT Press). Edwards, S. and M. Savastano, 1999, “Exchange Rates in Emerging Economies: What Do
We Know? What Do We Need to Know?” NBER Working Paper 7228 (Cambridge, Massachusetts: National Bureau of Economic Research).
Faruqee, H., 1995, “Pricing to Market and the Real Exchange Rate,” IMF Staff Papers,
Vol. 42, pp. 855–81.
39
Froot, K. and K. Rogoff, 1995, “Perspectives on PPP and Long-Run Real Exchange Rates,” in Handbook of International Economics, Vol. 3, ed. by G. Grossman and K. Rogoff, (Amsterdam: Elsevier), pp. 1647–88.
Gooroochurn, N. and A. Blake, 2005, “Tourism Immiserization: Fact or Fiction?” Eni Enrico
Mattei, Working Papers: Number 143. Grenade, K. and G. Riley, 2008, “The Real Effective Exchange Rate in the ECCU:
Equilibrium and Misalignment,” paper presented at the Fortieth Annual Caribbean Monetary Studies Conference, Eastern Caribbean Central Bank, St. Kitts and Nevis.
Hadri, K., 2000, “Testing for Stationarity in Heterogeneous Panel Data”, Econometrics
Journal, Vol. 3, pp. 148-61. Harvey, A. and D. Bates, 2003, “Multivariate Unit Roots Tests, Stability and Convergence,”
DAE Working Paper, No. 301, University of Cambridge, England. Im, K.S., M.H. Pesaran, and Y. Shin, 2003, “Testing for Unit Roots in Heterogeneous
Panels,” Journal of Econometrics, Vol. 115, pp. 53–74. International Monetary Fund, 2006, “Methodology for CGER Exchange Rate Assessments”,
IMF Research Department, mimeo. International Monetary Fund, 2008, “Divergence of Current Account Balances Across
Emerging Economies,” Chapter 6 of the World Economic Outlook (Washington DC: International Monetary Fund).
Isard, P., 2007, “Equilibrium Exchange Rates: Assessment Methodologies,” IMF
Working Paper WP/07/296 (Washington DC: International Monetary Fund). Isard, P. and H. Faruqee, 1998, Exchange Rate Assessment: Extensions of the
Macroeconomic Balance Approach, Occasional Paper No. 167 (Washington DC: International Monetary Fund).
Isard, P., H. Faruqee, R. Kincaid and M. Fetherson, 2001, Methodology for Current Account
and Exchange Rate Assessment, Occasional Paper No. 209 (Washington DC: International Monetary Fund).
Jönsson, K., 2005, “Cross-Sectional Dependency and Size Distortion in a Small-sample
Homogeneous Panel-Data Unit Root Test,” Oxford Bulletin of Economics and Statistics, Vol. 63, pp. 369–92.
40
Lee, J., G.M. Milesi-Ferreti, J. Ostry, A. Prati, L.A. Ricci, 2008, Exchange Rate Assessments: CGER Methodologies, Occasional Paper No. 261 (Washington DC: International Monetary Fund).
Lane, P.R., 2001, “The New Open Macroeconomics: a Survey,” Journal of International
Economics, Vol. 54, pp. 235–66. Levin, A., C. Lin, and C.J. Chu, 2002, “Unit Root Tests in Panel Data: Asymptotic and
Finite-sample Properties”, Journal of Econometrics, Vol. 108, pp.1–24. MacDonald, R. and L. Ricci, 2003, “Estimation of the Equilibrium Real Exchange Rate for
South Africa,” IMF Working Paper 03/44 (Washington DC: International Monetary Fund).
O’Connell, P., 1998, “The Overvaluation of Purchasing Power Parity”, Journal of
International Economics, Vol. 44, pp. 1–19. Obstfeld, M. and K. Rogoff, 1996, Foundations of International Macroeconomics
(Cambridge, MIT Press). Pesaran, M.H., 2003, “A Simple Panel Unit Root Test in the Presence of Cross Section
Dependence,” Cambridge Working Papers in Economics, No. 346, University of Cambridge.
Pesaran, M.H. and Y. Shin, 1999, “An Autoregressive Distributed Lag Modeling Approach
to Cointegration Analysis,” in S. Strom, A. Holly and P. Diamond (eds.), Econometrics and Economic Theory in the 20th Century: The Ragnar Frisch Centennial Symposium (Cambridge: Cambridge University Press).
Pesaran, M.H., Y. Shin and R.J. Smith, 2001, “Bounds Testing Approaches to the Analysis
of Level Relationships,” Journal of Applied Econometrics, Vol. 16, pp. 289–326. Polak, J., 2007, “Parity Reversion in Real Exchange Rates: A Puzzle or a Nonissue?,” IMF
Staff Papers, Vol. 53, pp. 476–78. Rahman, J., 2008, “Current Account Developments in New Member States of the European
Union,” IMF Working Paper 08/92 (Washington: International Monetary Fund). Ricci, L., G. Milesi-Ferretti, and J. Lee, 2008, “Real Exchange Rates and Fundamentals: A
Cross-Country Perspective,” IMF Working Paper 08/13 (Washington: International Monetary Fund).
41
Rogoff, K., 1996, “The Purchasing Power Parity Puzzle,” Journal of Economic Literature, Vol. 34, pp. 647–68.
Rogoff, K., K. Froot, and M. Kim, 2001, “The Law of One Price Over 700 Years,” IMF
Working Paper 01/174 (Washington: International Monetary Fund). Roudet, S., M. Saxegaard, and C. Tsangarides, 2007, “Estimation of Equilibrium Exchange
Rates in the WAEMU: A Robustness Approach,” IMF Working Paper 07/194 (Washington: International Monetary Fund).
Sarno, L. and M.P. Taylor, 1998, “The Behavior of Real Exchange Rates During the Post-
Bretton Wood Period,” Journal of International Economics, Vol. 46, pp. 281–312. Sarno, L. and M.P. Taylor, 2002, “Purchasing Power Parity and the Real Exchange Rate,”
IMF Staff Papers, Vol. 49, pp. 65–105. Sarno, L. and G. Valente, 2006, “Deviations from Purchasing Power Parity Under Different
Exchange Rate Regimes: Do They Revert, and If So How?”, Journal of Banking and Financing, Vol. 30, pp. 3147–69.
Taylor, M.P., 2003, “Purchasing Power Parity,” Review of International Economics, Vol. 11,
436–52. Tokarick, S., 2008, “Commodity Currencies and the Real Exchange Rate,” Economics
Letters, Vol. 101, pp. 60-62. Williams, O., T. Polius, and H. Selvon, 2001, “Reserve Pooling in the Eastern Caribbean
Currency Union and the CFA Franc Zone: A Comparative Analysis,” IMF Working Paper 01/104 (Washington DC: International Monetary Fund).


![Assessing the Competitiveness of Smallholders …oar.icrisat.org/10635/1/04 Setotaw Ferede.pdfEthiop. J. Crop Sci. Vol 6 (Special Issue) No. 2, 2018 [51] Assessing the Competitiveness](https://static.documents.pub/doc/80x56/5e3b696df826af22814afda6/assessing-the-competitiveness-of-smallholders-oar-setotaw-feredepdf-ethiop-j.jpg)
