Southern Journal of Rural Sociology Vol. 10, No. 1 ASSESSING HOUSING AFFORDABILITY IN RURAL GEORGIA By Carol B. Meeks and Anne L. Sweaney ABSTRACT Rural areas and the rural South in particular have unique characteristics that render inappropriate many urban-oriented housing affordability approaches, delivery systems and programs. In addition, a lack of data for smaller communities makes accurate assessments of the housing stock difficult. This paper explores factors that influence housing affordability. A methodology is developed that policy makers in local communities can use with volunteers to collect reliable data and to develop a local housing agenda which meets community needs. Regression analysis using data from four rural Georgia communities reveals that housing quality plays a role in housing expenditures. The paper concludes with strategies for rural community housing assessment and implementation. INTRODUCTION Although the majority of Americans are well housed, for too many, housing is still inadequate or unaffordable. This is particularly true in nonrnetropolitan areas where 24.8% of all households pay more than 30% of their income for housing and 10.3% live in units with severe or moderate housing problems (U.S. Dept. of Commerce and U.S. Dept. of Housing and Urban Development, 1993). In the rural South 28.4% of all households pay more than 30% of their income for housing and 16.2% live in units with severe or moderate housing problems. Meeting the housing needs of rural Americans will be one Carol B. Meeks is a professor and Anne L. Sweaney is an associate professor in the Department of Housing and Consumer Economics at the University of Georgia. The authors express their appreciation to the Georgia Housing Coalition and the Georgia Housing and Finance Authority for support in conducting this research, as well as to the volunteers who contributed time collecting the data. This research was also supported by the Georgia Agricultural Experiment Station.
Transcript
Southern Journal of Rural Sociology Vol. 10, No. 1
ASSESSING HOUSING AFFORDABILITY IN RURAL GEORGIA
By Carol B. Meeks and Anne L. Sweaney
ABSTRACT
Rural areas and the rural South in particular have unique characteristics that render inappropriate many urban-oriented housing affordability approaches, delivery systems and programs. In addition, a lack of data for smaller communities makes accurate assessments of the housing stock difficult. This paper explores factors that influence housing affordability. A methodology is developed that policy makers in local communities can use with volunteers to collect reliable data and to develop a local housing agenda which meets community needs. Regression analysis using data from four rural Georgia communities reveals that housing quality plays a role in housing expenditures. The paper concludes with strategies for rural community housing assessment and implementation.
INTRODUCTION
Although the majority of Americans are well housed, for too many, housing is still inadequate or unaffordable. This is particularly true in nonrnetropolitan areas where 24.8% of a l l households pay more than 30% of their income for housing and 10.3% live in units with severe or moderate housing problems (U.S. Dept. of Commerce and U.S. Dept. of Housing and Urban Development, 1993). In the rural South 28.4% of all households pay more than 30% of their income for housing and 16.2% live in units with severe or moderate housing problems. Meeting the housing needs of rural Americans will be one
Carol B. Meeks is a professor and Anne L. Sweaney is an associate professor in the Department of Housing and Consumer Economics at the University of Georgia. The authors express their appreciation to the Georgia Housing Coalition and the Georgia Housing and Finance Authority for support in conducting this research, as well as to the volunteers who contributed time collecting the data. This research was also supported by the Georgia Agricultural Experiment Station.
92 Southern Rural Sociology
of the major social policy issues of the 1990s as efforts to control budget deficits collide with needs. Local and state governmental decision makers will assume even greater roles in the future than they have in the past (Cranston, 1988). The reticence on the part of the federal government to increase its role in the housing area will force state and local governments to be more involved. This will require the development of creative solutions that will not increase the federal deficit or overburden local political jurisdictions.
The purpose of this article is twofold: (1) to explore the factors which influence housing affordability beyond the standard measure of percent of income for housing and (2) to present a methodology which policy makers can use with community volunteers to collect reliable data and develop a local housing agenda. This agenda can then be used as the basis for programmatic efforts such as the development of a Comprehensive Housing Affordability Strategy (CHAS).
The CHAS is a working document used by communities and states that are required by the National Housing Affordability Act to develop an agenda for the provision and maintenance of affordable housing. The Department of Housing and Urban Development (HUD) must approve this five-year housing affordability strategy before housing assistance will be provided. Areas to be incorporated into the community's strategy include: housing and market needs, extent of homelessness, institutional structure, public housing, present use of federal funds including use of low income tax credits, and an estimate of the number of low- and moderate-income families who will be able to obtain affordable housing using funds available under the Act (Comprehensive Housing Affordability Strategies, 1991).
Central to the development of the Act, Congress was concerned with involving local citizens in developing strategies unique to each community. Congress believed that the more community-driven a plan is, the more the citizens will buy into it and push its implementation. For many rural areas, the Comprehensive Housing Affordability Strategy (CHAS) likely will have to show only that the use of federal funding is "consistent" with the CHAS developed at the state level (Gramlich, 1991). Therefore, it is essential that rural decision makers be informed about what the state is doing with the CHAS initiatives. If used with care and as intended, the CHAS will give low-income individuals a greater voice in the planning process.
Meek and Sweaney
Affordability and Quality
Housing affordability remains a problem despite the stabilization of housing prices and rents by the recent recession (Joint Center for Housing Studies of Harvard University, 1992). When taking a closer look at affordability, there are three recurrent themes: (1) the poor lost income at a historically rapid pace during the inflationary period of the 1970s, and the recession of the 1980s and early 1990s; (2) housing costs escalated faster for the poor than for any other group; (3) cuts in federal housing subsidies came into full play in the late 1980s (Ford Foundation, 1989). This has resulted in growing homelessness as affordability and availability issues interact, even areas in the rural South are beginning to face visible problems of homelessness. Homelessness in rural areas is often difficult to detect because these individuals often double up.
The primary financial problem for most low- and moderate- income households is paying for housing (The National Housing Task Force, 1988). Not only has income declined but the supply of affordable housing, particularly rental housing has declined (National Association of Home Builders, 1991). As a result, homeownership rates fell over the 1980s.
Fronczek and Savage (1991) reported that in the spring of 1988, 57 percent of all households could not afford to buy the median-priced home in the region where they lived. A house purchase was 'least affordable for female heads of households with children, and most affordable for married-couple families with no children. More than a third of current owners and 91 percent of current renters could not afford a median-priced house. This phenomenon is even more critical in nonmetropolitan areas where three out of every four poor households have been found to pay more than 30 percent of their income for housing (Lazere, Leonard, & Kravitz 1989).
Closely linked to affordability is cost and availability of residential mortgages. A 1990 study by the Urban Institute for HUD concluded that there is little evidence of a national rural home mortgage credit shortage but noted that the evidence is far from ideal. Rural home buyers were found to be less likely to borrow through standard financial institutions to finance their home purchase.
Regulations affecting housing costs and the impact on
94 Southern Rural Sociology
affordability in urban areas has been studied and a direct relationship has been found between the cost of housing and regulatory systems. Downs (1991) concluded that cumnt housing quality and density standards in many communities are set unrealistically high in relation to the financial abilities of households to pay for them. However, NIMBY ("Not in My Back Yard") regulations are less prevalent in rural areas and, as a result, have received little research consideration (Kean & Ashley, 1991). On the other hand, not enough regulation may result in poor quality housing and lack of protection for the money invested.
Measures of Afforthbility
Housing is considered affordable by the Department of Housing and Urban Development if a household spends no more than 30 percent of adjusted income on housing. Stone (1990) suggested an alternative approach to affordability which includes household size and income along with non-shelter needs. This method of calculation does not increase the extent of the affordability problem but rather changes its distribution. This measure shows that the affordability problem is much more concentrated among lower income and larger households, and relatively less severe among middle income and small households than is indicated by more conventional measures. Lazere, Leonard and Kravitz (1989) also explore this approach and suggest that some smaller households could afford to spend more than 30 percent of income on housing.
Measures of Housing Quality
As Weicher (1986) notes, any measure of housing quality is fundamentally arbitrary. Analyzing several measures of housing quality, Weicher reported that the preferred criteria to add to Census data collection were frequent heating system breakdowns, holes in interior floors, and loose or missing steps in public hallways. Overcrowding was found to be an extraordinarily poor measure of housing inadequacy. In part this is because over-crowding is a function of the characteristics of the occupants rather than the housing unit. Lack of plumbing, kitchen facilities or electricity, although important housing problems, are not good indicators of other less
Meeks and Sweaney 95
severe problems. No attempt was made by Weicher (1986) to investigate whether these simple criteria would work equally well for areas other than Metropolitan Statistical Areas. Lerman (1986) reported that rural substandard housing is more concentrated and severe in the South. Lerman defined substandard housing as having more people than rooms or lacking complete plumbing for the exclusive use of the occupying household. Farmer, Ilvento and Luloff (1989) point out that to the extent that substandard housing exists in a community, poverty exists in that community. When more comprehensive quality definitions are used, the number of units found to be substandard increases.
This paper expands the concept of affordability to include housing quality. Since most units have indoor plumbing facilities and are not crowded, these two traditional measures of housing quality have less meaning today. Thus, alternative measures of housing quality and condition are explored in this paper.
Uniqueness of Rural South
Rural areas have unique characteristics that make urban-oriented housing assistance approaches, delivery systems and programs inappropriate (Meeks, 1989). According to data from the American Housing Survey, ownership of housing is higher in nonmetro areas (73.0 percent) and the nonmetro South (74.5 percent) compared with all areas (64.2 percent) (U.S. Department of Commerce and U.S. Department of Housing and Urban Development, 1993). There are more single-family detached units and manufactured housing units and fewer multifamily units in rural than in urban areas. Nonmetro single family housing units are also smaller in the South than in other regions, there is less square footage per person and units are more crowded. Housing units in the nonrnetro South are more likely to be lacking some or all indoor plumbing facilities and have more severe or moderate physical problems than units in other regions. Further, "rural areas do not fare as well as urban areas in receiving federal grant money" (Ilvento, Fendley & Christenson, 1988). This may be due in part to lack of knowledge and expertise in qualifying for the funds.
A Ford Foundation report (1989) commented that "affordability is
96 Southern Rural Sociology
the dominant problem in urban areas, but quality is the major issue in rural locations." Further, affordability of housing in nonmetro areas is decreasing. Thus, the authors contend that if the quality of housing is controlled in statistical analyses of the issue, the number of nonmetro households with affordability problems would increase even more.
DESCRIPTION OF THE RESEARCH
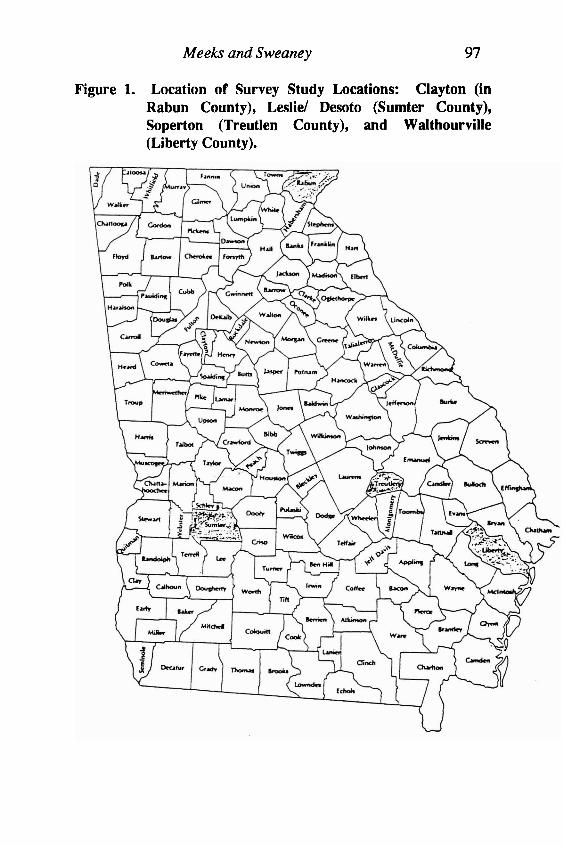
This research is designed to explore factors which influence affordability beyond the standard measure of percent of income for housing. As part of this objective the housing conditions and costs in several rural communities in Georgia are described. An assessment of the overall quality of housing with particular attention to the structural, mechanical and functional qualities of selected housing components is made. The final section of the paper includes an analysis of the affordability of housing in relation to quality and other factors. In 1990, a survey was conducted in four nonmetropolitan communities in Georgia: Clayton in Rabun County in northern Georgia, and Leslie1 Desoto in Sumter County, Soperton in Treutlen County, and Walthourville in Liberty County in southern Georgia (Figure 1). The communities were selected in cooperation with the Georgia Housing Coalition (Housing Assistance Council 1992).
The largest community was Soperton with a population in 1990 of 2,797 (U.S. Census, 1990). Prior to 1980, population declined in each of the communities except Walthourville. Between 1980 and 1990 the population in Soperton continued to decline while the other three communities grew. Walthourville increased in population 124 percent. The racial composition varied between Clayton which was predominantly white (97 percent) and the other three locations in which 45 percent or more of the population was black. These communities, mirror the conditions in many other small communities across the rural South and the nation.
Survey Instrument
The survey instrument includes demographic information, measures of housing quality, housing and utility costs, fuels used, and accessibility. The instrument was developed by the University of
Meeks and Sweaney 97
Figure 1. Location of Survey Study Locations: Clayton (in Rabun County), Leslie/ Desoto (Sumter County), Soperton (Treutlen County), and Walthourville (Liberty County).
98 Southern Rural Sociology
Georgia Housing Research Center and pretested with a community group for ease of use. It was also reviewed for content validity by the Georgia Housing Coalition Advisory Board, an advocacy group created with the purpose of improving the quality of housing for low- income citizens in Georgia through civic, educational, research and charitable projects.
The survey was specifically designed to be conducted by volunteers in the four communities. Volunteers were recruited for several reasons; primary among them was the lack of funds to hire personnel. Equally important, however, was the feeling that the personal investment made in participating in the study by collecting data fostered commitment to its completion and the development of a housing strategy. Although a community could hire personnel, there is often a lack of funds in rural areas. Therefore, training volunteers for data collection can be a positive use of resources.
The use of volunteers presented some unique challenges in development of the survey instrument and training. Instead of multiple copies of the questionnaire, each volunteer was given one laminated questionnaire which could be used repeatedly. The questionnaire was keyed to an answer strip on which answers could be easily marked, in most cases by simply circling a number. Extensive training was provided to interviewers with use of graphic presentations depicting various degrees of housing quality.
Sample Selection
Sample selection was related to community size. In communities with populations less than 1,000, such as LeslieDesoto and Walthourville, every fifth house on every street was surveyed. In Clayton every 10th house was surveyed. A starting point was pre- selected to ensure all streets were included. In LeslieDesoto, the final sample met the requirements of every fifth house on every street. In Walthourville the final sample was slightly above 1 in 5. In Clayton, the final sample was somewhat less than 1 in 10.
In a larger community such as Soperton, (population 2,797) a sampling procedure using randomly assigned blocks on a grid was developed. Volunteers were provided a map with a grid on it dividing the community into small blocks. Blocks for the survey were selected
Meeks and Sweaney 99
at random and shaded. A survey was to be completed for each dwelling in shaded blocks. Even though some of the blocks on the map were empty, they were marked anyway in case additional housing had been added since the map was printed. Volunteers were instructed to visit all blocks to ensure that no new housing had been added. Every dwelling in a shaded block was to be sampled. All of the different types of housing in the community were represented in the selected blocks.
DESCRIPTIVE ANALYSIS
There are 225 occupied housing units in the sample from the four communities. Significant differences are found in the following demographic characteristics among the four communities: race, marital status, age, family size and family income (Table 1). Compared with 1991 American Housing Survey data, the sample includes more blacks than the general population and more blacks than typically found in rural areas, but not more blacks than found in the Southern region. LesliePesoto has more widow or widower respondents. Both Clayton and LeslieDesoto have more older respondents. Among the survey respondents, average family size is smaller in Clayton. Family incomes of survey respondents, range from an average of $9,053 in Walthourville to $19,767 in Clayton.
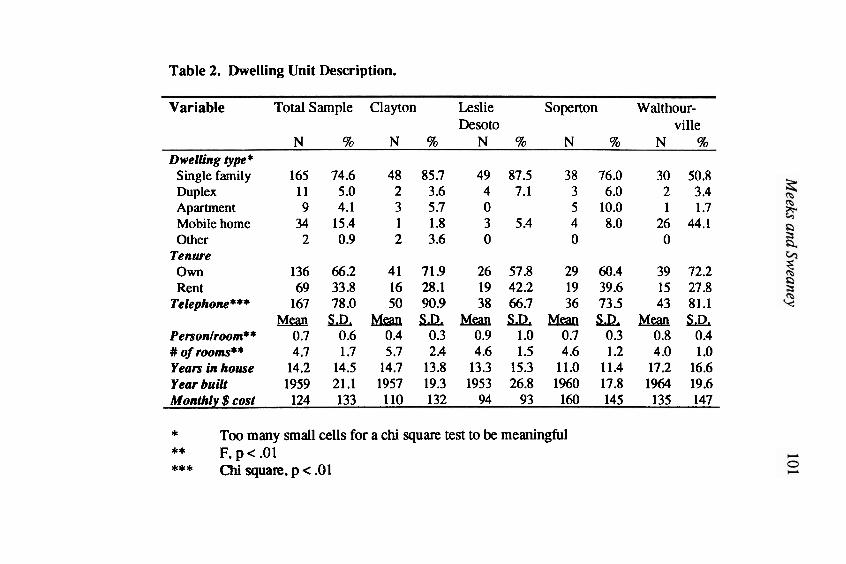
Single-family dwellings dominate all four communities (Table 2). Home ownership rates range from 57.8 percent in LesliePesoto to 72.2 percent in Walthourville. Although 94 percent of all nonrnetro households in the U.S. have a telephone, the survey indicates that only Clayton has a telephone rate close to this (90.9 percent), whereas only 66.7 percent of those in LesliePesoto have telephones. On average none of the dwellings sampled in the four communities are crowded (that is, have more than one person per room). The mean year the occupied units were built is 1959 and the mean length of time lived in the dwelling unit is 14.2 years.
Mean monthly housing costs are $124, with a standard deviation of $133. The 1991 American Housing Survey shows a median monthly housing cost nationally in nonmetro areas of $301 and $255 in the non-metro South. Households in this study spent an average of 24 percent of their income on shelter. Given the low costs described,
Table 1. Demographic Characteristics. [Notes: Income is in thousands of dollars annually. *Chi square significant at p <.05. **Chi square significant at p <.01; F significant, p < .01.] Variable Total Sample Clayton Leslie Soperton Walthour-
S . D . M e a n u M e a n S . D . M e a n S . D . M e a n m Age 52.2 17.6 60.2 15.5 55.2 17.9 46.5 15.6 46.6 17.5 Family size** 3.03 1.7 2.26 1.4 3.43 2.0 3.2 1.3 3.24 1.8 Income ($K) 12.9 15.6 19.7 22.5 10.1 13.7 14.6 14.7 9.1 8.2
Table 2. Dwelling Unit Description.
Variable Total Sample Clayton Leslie Soperton Walthour- Desoto ville
* Too many small cells for a chi square test to be meaningful ** F,p<.01 *** Chi square, p < .0 1
102 Southern Rural Sociology
this is not surprising. A review of the housing quality of the units will show that the survey respondents were not getting a bargain.
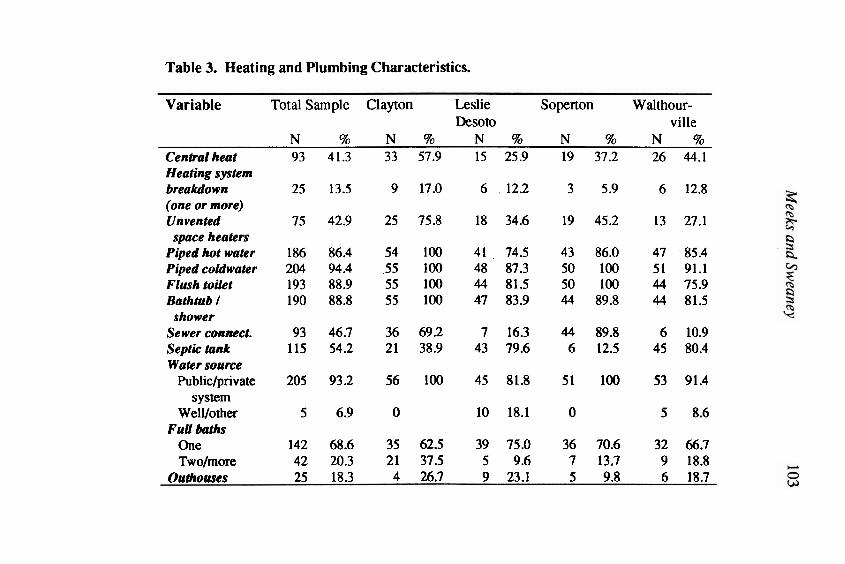
A traditional measure of housing quality has been lack of plumbing. The American Housing Survey makes no estimates of lack of piped hot or cold water due to data limitations. The situation in the four Georgia study communities, however, is worse than one might expect nationally. Although 94.5 percent of the entire sample from a l l four communities has cold piped water, only 86.4 percent of the sample has piped hot water, while 25.5 percent of the sample that was located in LesliePesoto lacks hot piped water (Table 3). A flush toilet and bathtub or shower are found in nearly 89 percent of the units; 18.3 percent of the sample report having an outhouse.
Public or private water systems provide water to 93.2 percent of the sample, above the national nonmetro average of 84.7 percent. However, 52.5 percent of all nonrnetro units nationally are connected to public sewers, compared to 46.7 percent of the sample.
Only 41.3 percent of the sample report having central heat, which even for the Southern region is low. One or more heating system breakdowns in the year preceding the survey were reported by 13.5 percent of the sample. Unvented space heaters are found in 42.9 percent of the housing units.
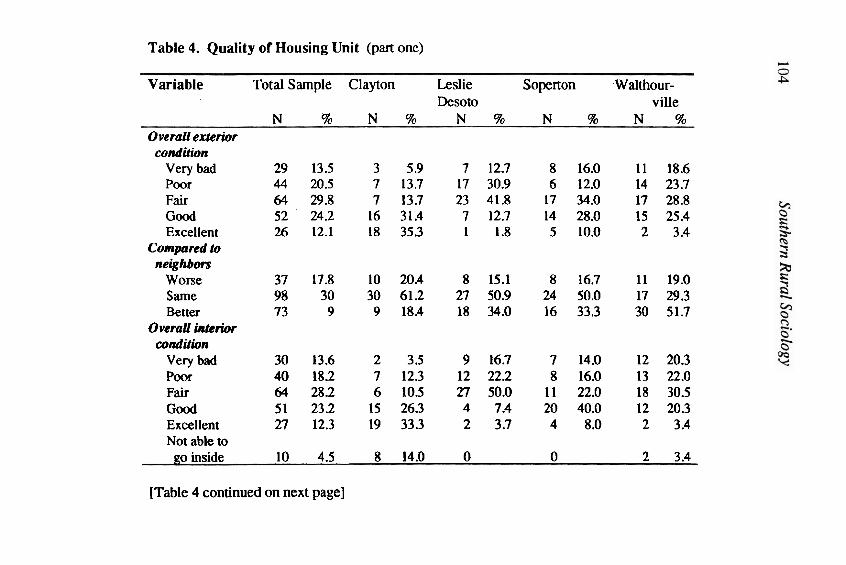
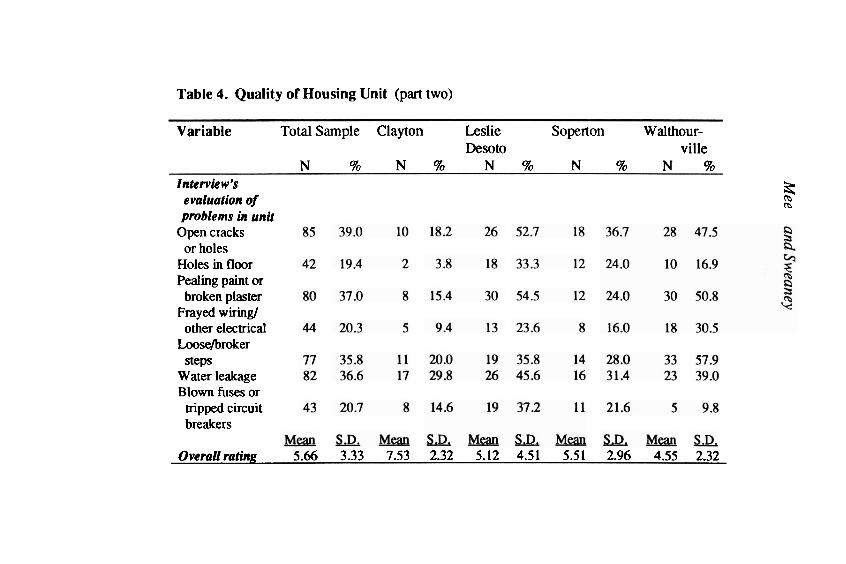
Ratings of overall interior and exterior conditions for the sample units have a normal bell shaped curve, although most of the interviewers rated each subject housing unit as the same or better than others in the neighborhood (Table 4). More than one-third of the units were found to have open cracks or holes in the walls or ceilings, peeling paint or broken plaster, loose or broken steps and water leakage. At least one-fifth of the units have unsanitary conditions and frayed wiring or other electrical problems. Respondents reported blown fuses or tripped circuit breakers in 20.7 percent of the units and 36.6 percent reported water leakage from the outside in the three months prior to the interview. Respondents were asked to rate their house as a place to live on a scale of one to ten; one being the worst and ten the best. This results in a mean rating of 5.66.
MEASUREMENT OF HOUSING QUALITY
The data set includes 26 variables related to housing quality or
Table 3. Heating and Plumbing Characteristics.
Variable Total Sample Clayton Leslie Soperton W althour- Desoto ville
N 5% N % N % N % N % Central heat 93 41.3 33 57.9 15 25.9 19 37.2 26 44.1 Heating system breakdown 25 13.5 9 17.0 6 12.2 3 5.9 6 12.8 (one or more) Unvented 75 42.9 25 75.8 18 34.6 19 45.2 13 27.1 space heaters
condition. Correlation and factor analyses are used to reduce the number of qualitylcondition related variables since the relatively small sample size prohibit use of this many measures separately.
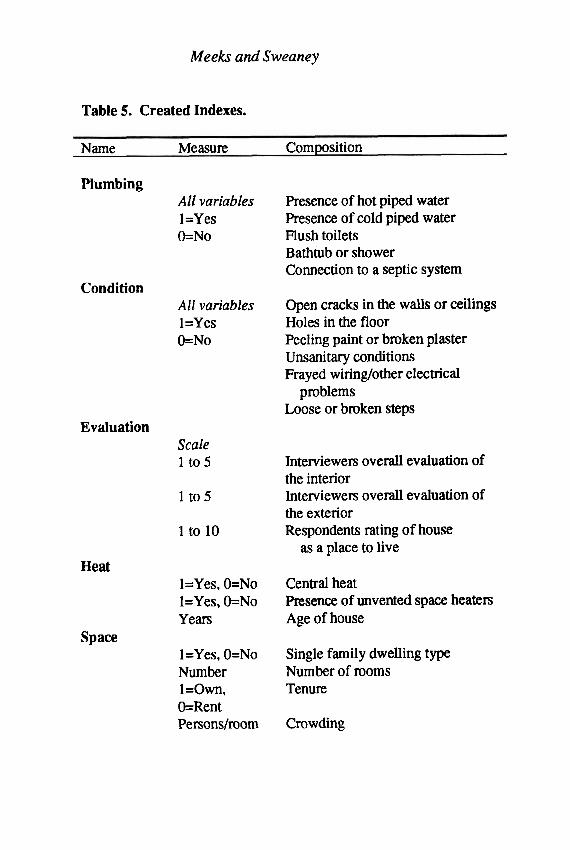
Based on the correlation analysis, three indices are created: Plumbing, Condition, and Evaluation. Variables included in each index are listed in Table 5. In addition, two indices were created by principal components factor analysis: Heat and Space (Table 5). Factor scores, which are estimates for each variable on an underlying factor, formed from the linear combination of observed variables, were calculated. These standardized scoring coefficients provided standardized measures for each factor and are included in the multiple regression analyses.
Regression Analysis
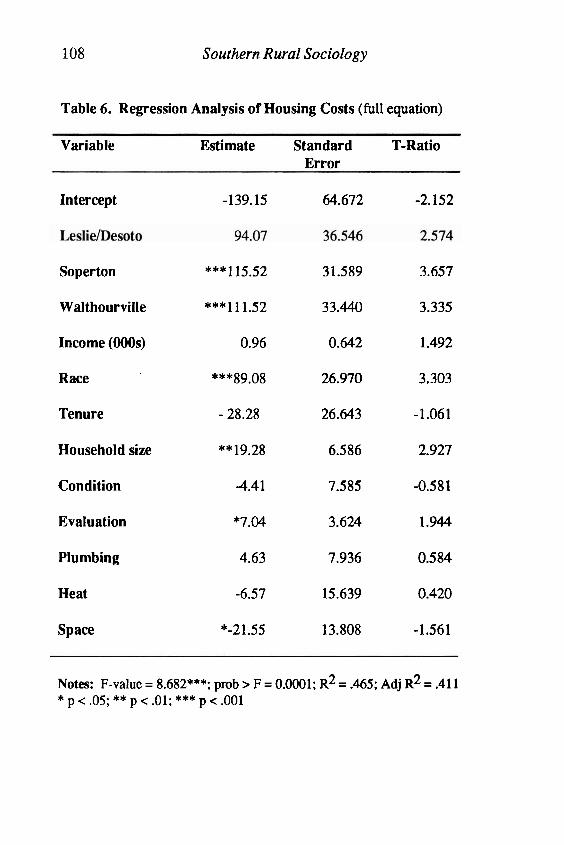
Regression analysis is used to determine the variables that influence housing affordability. (See Table 6.)The dependent variable used in the regression is monthly housing costs, either the mortgage payment or rent. The independent variables used include community location, race, income, tenure. household size and the alternative measures of housing condition and housing quality (discussed previously).
Community is included as a variable since a review of the descriptive analyses suggested differences among the four communities which should be controlled. Community was entered into the regression equation as dummies with Clayton being the omitted community. Income obviously is included, since affordability relates to both housing cost and income available. Some past research has suggested that there are black-white differences for housing, and given the composition of the sample, race is thought to be an appropriate variable (Lazere, Leonard & Kravitz, 1989). Race was coded as 1 = white; 0 = all others, primarily black. Age of the head is highly correlated with tenure, as would be expected. Tenure is used in the analysis, since tenure may be changed by housing policy. Household size is included since housing needs vary with family size.
It was expected that owners would have higher housing costs than renters (Joint Center for Housing Studies of Harvard University, 1992). Households in housing units which lack plumbing facilities
Meeks and Sweaney
Table 5. Created Indexes.
Name Measure Composition
Plumbing All variables 1 =Yes &No
Condition All variables l=Yes &No
Evaluation Scale 1 to5
1 to5
1 to 10
Presence of hot piped water Presence of cold piped water Flush toilets Bathtub or shower Connection to a septic system
Open cracks in the walls or ceilings Holes in the floor Peeling paint or broken plaster Unsanitary conditions Frayed wiringlother electrical
problems Loose or broken steps
Interviewers overall evaluation of the interior Interviewers overall evaluation of the exterior Respondents rating of house
as a place to live Heat
l=Yes, O=No Central heat l=Yes, O=No Presence of unvented space heaters Years Age of house
Space l=Yes, O=No Single family dwelling type Number Number of rooms l=Own, Tenure O=Rent Personsfroom Crowding
108 Southern Rural Sociology
Table 6. Regression Analysis of Housing Costs (full equation)
Variable Estimate Standard T-Ratio Error
Intercept -139.15 64.672 -2.152
Soperton ***I 15.52 31.589 3.657
Walthourville ***I1132 33.440 3.335
Income (000s) 0.96 0.642 1.492
Race ***89.08 26.970 3.303
Tenure - 28.28 26.643 -1.061
Household size **19.28 6.586 2.927
Condition -4.41 7.585 -0.581
Evaluation *7.04 3.624 1.944
Plumbing 4.63 7.936 0.584
Heat -6.57 15.639 0.420
Space *-21.55 13.808 -1.561
Notes: F-value = 8.682***; prob > F = 0.0001; R2 = .465; Adj R2 = .411 * p < .05; ** p < .01; *** p < .001
Meeks and Sweaney 109
would have lower housing costs. Units with a high score on Space related to dwelling type, ownership and space would be expected to have higher costs than units with a lower score. The same prediction is made in relation to Condition, Evaluation and Heat. Higher scores, implying higher quality, would result in higher housing costs. Not all of these indices are expected to be significant, given the relatively small size of the sample. The emphasis is on identification of those quality indices significantly effecting housing costs.
Residents in the three communities all paid more for their housing compared with the omitted community residents. Whites paid more in housing costs than blacks. As the overall quality ratings (Evaluation) increased by one, costs increased by $7.04. As household size increased by one, costs increase by $19.28. Income was not significant. Race and income are significantly correlated (p.314). This may have influenced the results.
POLICY IMPLICATIONS
A major barrier for the adequate provision of housing in rural areas is the fact that the data needed are sketchy or non-existent. Neither the American Housing Survey nor the Census of Housing provide detailed data on small communities because of concerns with confidentiality and the possibility of a family or housing unit being identifiable. Also, the data providing the greatest information are the most difficult to collect; therefore, decisions are often made using misleading indicators. A good example of this is the use of lack of plumbing in formulas to fund housing since lack of plumbing, while a problem, has little relationship to overall quality.
A review of the data collected in this study provides a springboard to policy development in rural areas. The data from the four communities indicate that the housing units are small, not too old, not crowded, and fairly representative of units in the nonrnetro South. Using percent of income spent on housing as a measure of affordability leads to the conclusion that no affordability problem exists in these communities. A closer look at the condition and quality of the units, however, provides a different picture. Less than half the units had central heat, which even for southern Georgia is a concern. Lack of plumbing exists at a rate greater than the national
110 Southern Rural Sociology
average and greater than the nonrnetro South. Water leakage and other problems also are prevalent. Safety problems may arise due to the dominance of unvented space heaters in the homes and electrical problems. Thus, many of the units are of poor quality and inadequate. If the quality of the units were to be improved without subsidy, however, these same units would be unaffordable by the current occupants.
The regression results indicate the importance to housing costs of location, even in rural communities. The key measure of quality that influenced cost was the overall assessment of quality (Evaluation). These results reinforce the need to make a comprehensive study of the whole community because only looking at common indicators (such as age of structure or lack of plumbing) may give a misleading picture of community characteristics. The results also suggest that researchers may need to explore other measures of quality than the traditional age, crowding and lack of plumbing. Use of Lisrel should also be explored because it will simultaneously look at the indicators as latent variables rather than doing a two-step approach of a factor analysis and then a regression analysis. Secondly Lisrel will provide information not only on the goodness of fit but also provide diagnostic statistics for improvement of the model.
A traditional indicator of housing quality has been the lack of plumbing. In this study, presence or absence of plumbing did not significantly influence housing costs in any equation tested. Therefore, this finding needs to be further explored on a national and regional level. A larger rural sample is needed for future research to determine if this lack of influence will hold true. If it does, funding formulas for housing programs may need to be revised.
A strength of the current study format and methodology developed for assessing community housing needs is its ease of replication. The instrument was created for ease of data collection by local volunteer residents. Level of education and data collection experience are not barriers to the instrument's usability. A comprehensive training manual contributes to interviewer reliability. Since so little is presently known about the actual housing conditions in the rural South, the methodology used in this study could be used to compile a comprehensive data base. This methodology also can be replicated in metropolitan areas by treating neighborhoods as
Meek and Sweaney 111
communities. A sampling framework can be developed to collect data representative of the entire metro area While metro sampling could be more complex, the simple questionnaire and ease of administration are its strengths.
Having a model instrument and methodology is only the first step in community needs assessment. The Comprehensive Housing Affordability Strategy (CHAS) will give impetus for assessing community housing needs. If entitlement communities fail to prepare a CHAS, participation in many Federal housing programs will be limited. Smaller communities face less stringent requirements and can refer to the state CHAS. The CHAS format, however, will be a helpful tool to demonstrate their needs. Thus, the passage of the National Affordable Housing Act empowered policy makers with a unique opportunity by mandating a formal assessment of community housing needs and the development of strategies for meeting these needs.
The data collected as part of this survey can give a current update on the market and inventory conditions of community housing stock. The survey provides a much more detailed description of the physical conditions and a more complete housing inventory than is currently available in the United States Census of 1990.
In order to create an effective housing program, local communities must analyze their unique needs and problems, their current housing stock, the community infrastructure and their constraints and resources. Accomplishment of these planning tasks begins with local residents' desire, leadership, commitment and courage to undertake major socio-economic change. This community-driven approach will not only increase awareness but will foster the needed results if residents and community leaders take advantage of the opportunity presented by the Comprehensive Housing Affordability Strategy.
Researchers can assist by further exploring the use of volunteers to collect data with simple to use instruments. More work needs to be performed with a larger sample to determine the relationships of quality and affordability. Renters and owners should be analyzed separately in many instances, depending in part of the kind of housing which is occupied. Regional differences also need to be examined.
The research reported here suggested a new approach to the affordability issue in rural areas. Further analyses with large national
112 Southern Rural Sociology
samples are needed to validate the results and confirm its usefulness in decision-making solutions. These analyses must include the rural South so that more accurate data are the basis for policy decisions related to housing.