Clemson University TigerPrints All eses eses 8-2009 Assessing impact of ISO 9000 certification on international trade Ha Le Clemson University, [email protected]Follow this and additional works at: hps://tigerprints.clemson.edu/all_theses Part of the Business Commons is esis is brought to you for free and open access by the eses at TigerPrints. It has been accepted for inclusion in All eses by an authorized administrator of TigerPrints. For more information, please contact [email protected]. Recommended Citation Le, Ha, "Assessing impact of ISO 9000 certification on international trade" (2009). All eses. 651. hps://tigerprints.clemson.edu/all_theses/651
Transcript
Clemson UniversityTigerPrints
All Theses Theses
8-2009
Assessing impact of ISO 9000 certification oninternational tradeHa LeClemson University, [email protected]
Follow this and additional works at: https://tigerprints.clemson.edu/all_theses
Part of the Business Commons
This Thesis is brought to you for free and open access by the Theses at TigerPrints. It has been accepted for inclusion in All Theses by an authorizedadministrator of TigerPrints. For more information, please contact [email protected].
Recommended CitationLe, Ha, "Assessing impact of ISO 9000 certification on international trade" (2009). All Theses. 651.https://tigerprints.clemson.edu/all_theses/651
ASSESSING IMPACT OF ISO 9000 CERTIFICATION ON INTERNATIONAL TRADE
A Thesis Presented to
the Graduate School of Clemson University
In Partial Fulfillment of the Requirements for the Degree
Master of Science Applied Economics and Statistics
by Ha Thi Viet Le August 2009
Accepted by: Kathryn Boys, Committee Chair
William C. Bridges, Jr Webb M. Smathers
Michael D. Hammig
ii
ABSTRACT
Introduced by the International Organization for Standardization in 1987, the ISO
9000 family of standards is a ‘generic quality management standard’ that has been
claimed to have a great impact on company performance and upon a company’s ability to
satisfy customers’ expectations (ISO, 2009e). In addition, ISO 9000 standards also help
to create consensus on requirements and standards all around the world and in doing so
can facilitate trade. While many studies have examined claims about the impact of ISO
9000 standards as a trade facilitation tool results, thus far, are ambiguous. ISO 9000
standards also have different impacts across countries of different economic status.
To more rigorously assess the trade impacts of ISO 9000 certification, this paper
builds a gravity model for the trade flows by taking into account the ratio of ISO 9000
certified firms within a particular country and industry. Alternative specifications also
include measures of trading country’s economic status. Results suggest that there is a
significant interaction between the impact of ISO 9000 certification and trading partner
economic status. This study shows that the adoption of ISO 9000 will have a significant
and positive impact on trade of most countries. The scale of increase in trade flows,
however, is different across economic levels. These results are consistent with findings of
other authors (e.g. Clougherty and Grajek, 2008) that ISO 9000 standards have more
impact on developing and least developed countries than developed ones. Suggestions for
further research are provided.
iii
ACKNOWLEDGMENTS
I would like to thank all people who have helped me during my Master study in
Clemson University and preparing for this thesis. This work would not have been
possible without the support and encouragement from my advisor Dr. Kathryn Boys. Her
valuable, unstinting advice, patience and constant demanding made me better myself in
accomplishing this paper.
Many thanks go to my committee members for their insight and comments into
my work and for their spending time with my thesis which means shorten their leisure
time with family this summer. I always feel lucky to have you as my committee members
and class instructors.
I especially want to thank Dr. Bonnie Martin for her constant support, patience
and care for me during the time at Clemson University.
My deepest gratitude goes to my family for their unflagging love and support
throughout my life which makes my present and future possible. I love you all.
iv
TABLE OF CONTENTS
Page
ABSTRACT ........................................................................................................................ ii
ACKNOWLEDGMENTS ................................................................................................. iii
LIST OF TABLES ............................................................................................................. vi
LIST OF FIGURES .......................................................................................................... vii
I. INTRODUCTION ........................................................................................................... 1
II. LITERATURE REVIEW ............................................................................................... 6
1. STANDARDS AND TRADE .............................................................................................. 6 a. Overview of importance of standards ...................................................................... 6 b. ISO 9000 ................................................................................................................ 10
i. Adoption of ISO 9000 before 2000 .................................................................... 12 ii. Adoption of ISO 9000 after 2000 ...................................................................... 17
c. Standards and trade ................................................................................................ 21 2. ASSESSING THE IMPACT OF STANDARDS ON INTERNATIONAL TRADE .......................... 29
a. Theoretical approach commonly used ................................................................... 29 i. Absolute and Comparative advantage ................................................................ 29 ii. Heckscher-Ohlin model ..................................................................................... 30 iii. New trade theory .............................................................................................. 31
b. Gravity model ........................................................................................................ 32 i. What is gravity model? ....................................................................................... 33 ii. Use of the gravity model in evaluating the impact of standards on trade .......... 36
III. METHODOLOGY ..................................................................................................... 39
1. DATA .......................................................................................................................... 39 a. Sector concordance ................................................................................................ 39 b. Description of ISO variables ................................................................................. 40
i. Number of certifications ..................................................................................... 42 ii. Firm count data .................................................................................................. 43 iii. Interaction variables ......................................................................................... 44
c. Description of other variables ................................................................................ 44
v
i. Trade flow measures ........................................................................................... 45 ii. GDP ................................................................................................................... 45 iii. Other explanatory variables .............................................................................. 45
2. ANALYTICAL APPROACH ............................................................................................ 46 a. Hypotheses ............................................................................................................. 46 b. Baseline model ...................................................................................................... 47 c. Alternative model specifications ........................................................................... 51 d. Analytical approach ............................................................................................... 54
IV. RESULTS AND DISCUSSION ................................................................................. 56
1. RESULTS FROM BASELINE MODEL .............................................................................. 56 2. RESULTS FROM ALTERNATIVE MODELS ..................................................................... 60
a. Model with including Importer and Exporter Economic Status ............................ 60 b. Model with interaction between the ISO 9000 Ratio and Country Economic status ................................................................................................................................... 67
V. SUMMARY AND CONCLUSIONS .......................................................................... 75
VI. REFERENCES ........................................................................................................... 89
vi
LIST OF TABLES
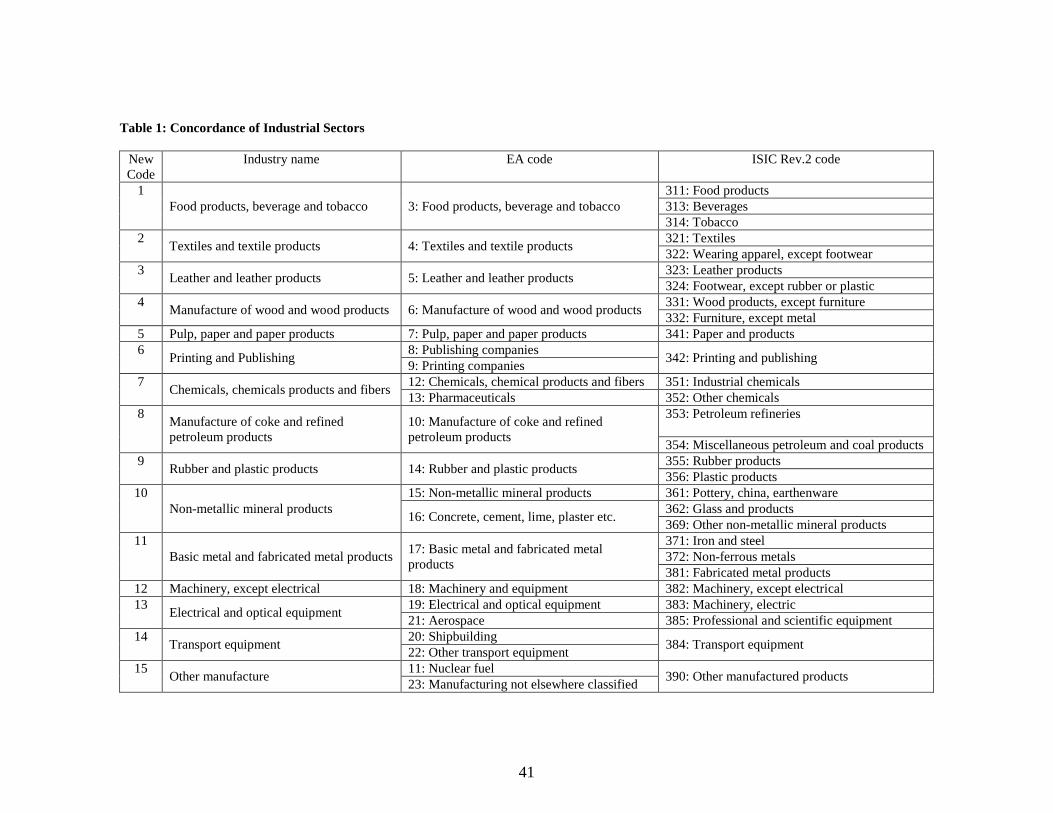
Table 1: Concordance of Industrial Sectors .................................................................................. 41
Table 2: Expected Sign for Baseline Model .................................................................................. 48
Table 4: European Accreditation (EA) Code Industry .................................................................. 80
Table 5: International Standard of Industrial Classification of All Economic Activities (ISIC) Rev. 2 Code ................................................................................................................................... 81
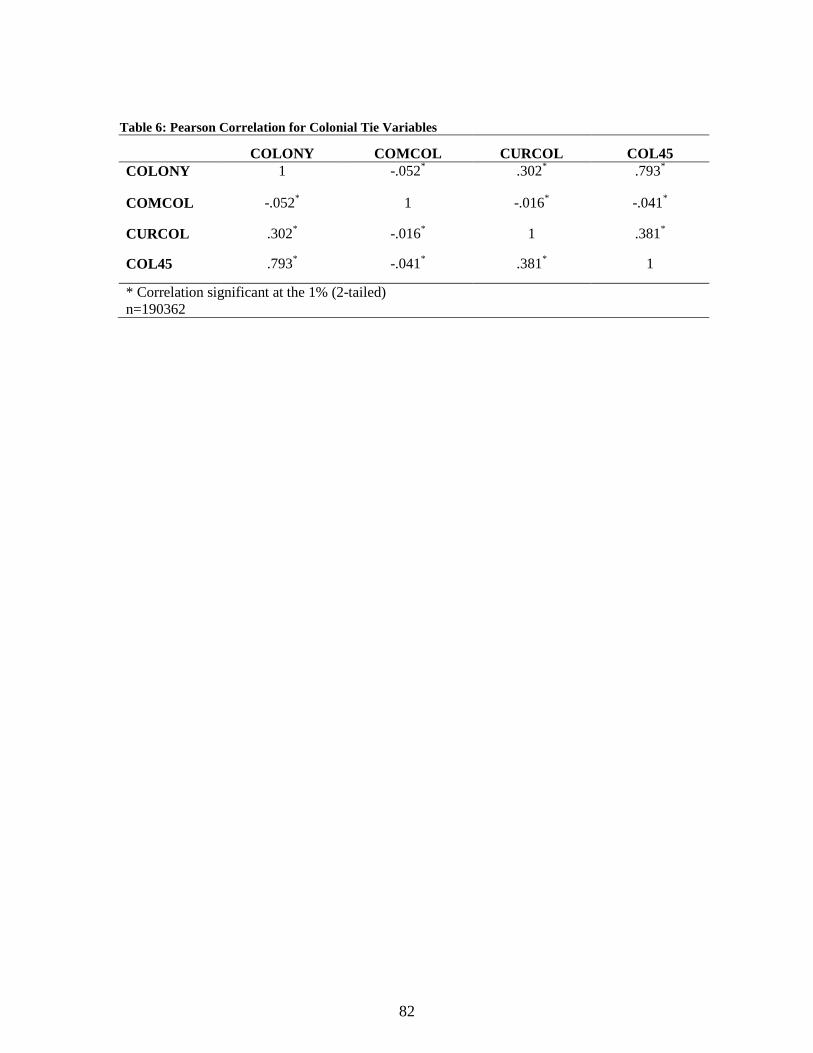
Table 6: Pearson Correlation for Colonial Tie Variables .............................................................. 82
Table 7: Gravity Equation Coefficient Estimates for Model with Economic status ..................... 83
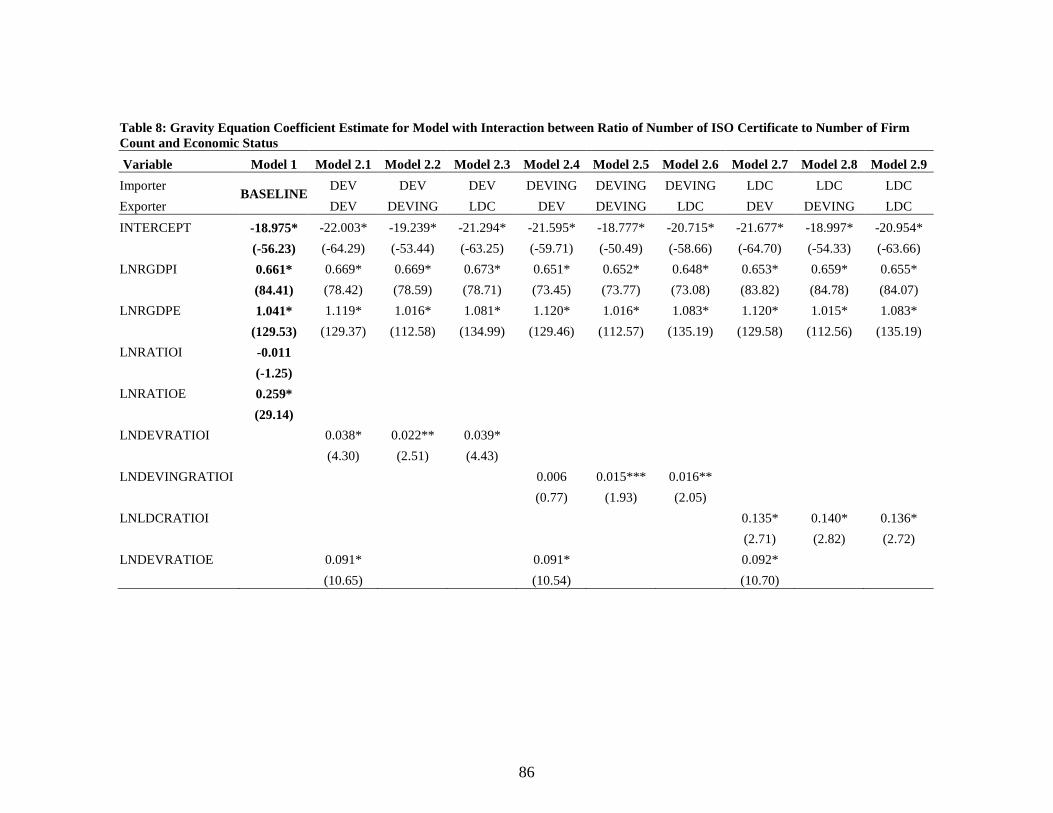
Table 8: Gravity Equation Coefficient Estimate for Model with Interaction between Ratio of Number of ISO Certificate to Number of Firm Count and Economic Status ................................ 86
vii
LIST OF FIGURES
Figure 1: % change in world total of ISO 9000 certification in ten cycles (1993 - 2000) ............. 13
Figure 2: Regional share of ISO 9000 certificates (1993 - 2000).................................................. 15
Figure 3: Countries with highest growth of ISO 9000 certificates in 2000 ................................... 16
Figure 4: Highest number of ISO 9000 certificates by industrial sector in 2000 .......................... 17
Figure 5: World total of ISO 9000: 2001 certificates from December 2001 to December 2007 .. 18
Figure 6: Regional share of ISO 9000 certificates from December 2001 to December 2007 ....... 19
Figure 7: Countries with highest growth of ISO 9000 certificates in 2007 ................................... 20
Figure 8: Highest number of ISO 9000 certificates by industrial sector in 2007 .......................... 21
1
I. INTRODUCTION
Trade liberalization opens doors for every country to trade with each other and
can help boost the global economy through facilitating trade between countries. The scale
of increasing of trade volume, however, would be much higher if countries were to
eliminate protection programs for domestic industries against the outside competition in
the form of tariff and non-tariff barriers (Edwards, 1993). Today, with increasing number
of free trade areas (FTAs) and regional trade agreements (RTAs), tariff barriers has been
gradually reduced and removed and no longer considered a significant hindrance to trade
(WTO, 2005). Instead, countries now tend to use non-tariff barriers and others, which,
they claim, are for the national security, sanitary, environmental protection. These
barriers, however, have been criticized as being imposed primarily as economic
protection measures that are used to partly reduce the ability of foreign countries to
penetrate into the domestic market (WTO, 2005).
Tariffs and non-tariff barriers, however, are imposed by government, therefore, it
is essential to have international standards which can reconcile and harmonize the
differences in countries’ regulations, reduce obstacles to trade as well as connect trading
partners from different countries. The International Organization for Standardization’s
(ISO) purpose is to form a bridge between the public and private sector, also create
consensus on requirements of business and broader needs of society. Therefore, ISO
standards are introduced, partly, in order to facilitate and promote trade. Standards
offered by ISO cover a range of topics from traditional activities (agriculture and
construction), through mechanical engineering, manufacturing and distribution, to
2
transport, medical devices, information and communication technologies, and to
standards for good management practice and for services (ISO, 2009e).
Among those standards are ISO 9000 standards which were introduced with the
intention provide guidance in the management of an organizations’ operations in order to
deliver products that satisfy customers’ requirements and expectations. It can be
considered a “passport” to enter a new market for penetrating companies due to the fact
that having ISO 9000 certificates will be a competitive advantage over other competitors
that do not have (Simmons and White, 1999). In addition, ISO 9000 certificate can act as
a common language for every organization which will connect, align their operation and
hence reduce information asymmetries, and minimize operational costs among them
(Shannon et al., 1999). Those explain the wide use of ISO 9000 standards in millions
organizations in 175 countries in the world and increasing number of companies seeking
for its certification.
Research, however, also finds that ISO 9000 standards can be considered a barrier
to trade as the documentation required by the registration process very time-consuming,
costly and detailed. In addition, there is no international body that is in charge of assuring
the quality of the organizations which provide ISO 9000 certification (accrediting
organization). As such, the value of an ISO certification will depend, in part, on the
relative stringency of the issuing country and auditing organization (Jones and Hudson,
1996). Besides, ISO seems to be more beneficial for developing countries than developed
countries because implementing ISO 9000 standards is a way for developing countries to
reduce transaction cost and information asymmetries as well as strengthen institutional
3
capacity (Clougherty and Grajek, 2008). Yet the implementation is more costly and time-
consuming for them to pursue a certification then that of developed countries (Hudson
and Jones, 2003). Furthermore, buyers may not show any special attention to a
company’s acquisition of ISO 9000 certification due to the fact that some industry
experts and major investors do not feel that pursuing ISO 9000 certificate assures any
improvement in a company’s performance. (Martinez-Costa and Martinez-Lorente,
2003). That observation is also supported by the findings of Dunu and Ayokanmbi (2008)
in their examination of the impact of ISO 9000 certification on an organization’s finance
performance. These authors found that ISO 9000 certification does not significantly
increase the ratio of revenue to assets, or operating income to assets significantly. These
findings then call to a question about the actual effect of ISO 9000 certification on
international trade.
Hudson (2003) suggests, ISO 9000 may enhance trade more than hinder trade in
developed countries, however, the enhancing effect may not be as significant as expected
due to the fact that consumers in developed countries will rely on the domestic standards
and consider the products are of ‘high quality’ rather than products from developing
countries. As ironic as it is, ISO 9000 certificate is anticipated to bring more benefit to
least developed, and developing countries than to developed countries; the cost of
acquiring and maintaining accreditation for companies is rather high in comparison with
their economic scale. This is one of the key reasons that ISO 9000 is adopted in
developed countries than in countries with lower level of economic development. The net
4
effect of ISO 9000 certification on developing and least developed countries remains
unclear.
The purpose of this paper is to evaluate the actual impact of ISO 9000 standards
on international trade. In order to empirical evaluate the real effect of ISO 9000
certification in international trade, the analysis makes use of the gravity model. This
model is commonly used to predict trade flows between two countries based on their
economic size as well as other indicators which are expected to have impact on trade.
Among those indicators, the information about ISO 9000 certification will be included in
the model under three approaches in order to determine whether ISO 9000 certification is
statistically significant to international trade flow across countries. As a first step, in the
baseline model, ISO 9000 certification will be added as the variable about the ratio of
number of ISO 9000 certificates to number of firm count in each industry for the
importing and exporting country. The second step is to add to the baseline model the
dummy variables about economic status of participating countries in trade. The last step
is to take into account the interaction of the economic status and the ratio of number of
ISO 9000 certificate to number of firm count data. The last two approaches are
considered with the purpose of investigating whether there is any difference impact of
ISO 9000 certification on trade of different countries with different economic status.
The rest of this paper is organized as follows. Part II provides a review of the
literature about standards in general, and the ISO 9000 standards in particular. The
impact of standards on trade will also be theoretically explored. Part III will introduce the
methodology used to develop a model suitable to analyze the impact of ISO 9000
5
standards on international trade. This approach is novel and makes use of a new coding
system for industries. Part IV represents the results and a discussion of this analysis. Part
V provides conclusions of this paper and suggestions about future research.
6
II. LITERATURE REVIEW
1. Standards and Trade
a. Overview of importance of standards
Standards are introduced as a common language which can reduce variability,
confusion and can help companies to take advantage of economies of scale to reduce
labor and production costs, and as a consequence reduce products price (Kindleberger,
1983). Product variety is needed to satisfy different customers’ varied tastes, however, in
order to ensure profit, companies will have to optimize the benefit between the degree of
product variety and the degree of economies of scale therefore, companies cannot take
risk by producing too much variety in order to satisfy every customer in the (Lancaster,
1990). Standardization increases the compatibility of products hence increase the
popularity of the products then reduce the difficulties in maintenance and repair of them
(Kindleberger, 1983). In order to control too much variety, standards are products and
process specifications that are used to harmonize the treatments of intermediates in the
production process or the attributions of the final products (Moenius, 2004). Normally, a
product’s value can be evaluated by customers through the number of its users and
customers care not only about the product itself but also about the whole system
containing that product, about its availability, complementary goods and more important
its popularity among consumers (WTO, 2005). That system cannot be obtained if there is
no system acting as a “norm” to align and coordinate related activities in the market. In
international settings, international standards can help facilitate technical compatibility
among countries which, at the same time, can make information sharing become easier
7
and thus reduce transaction costs. Hence, compatibility function plays an important role
in bolstering the development of many aspects in the society even though it may reduce
the number of varieties available to customers (Caves and Roberts, 1975).
Different customers have different preferences and in order to gain market share,
companies will have to diversify their products to satisfy different tastes. Product
diversification, however, incurs high research and production cost for companies which,
many of them cannot bear. Thus, companies have to optimize between cost saving gained
through economies of scale and the expense of product diversification.
One of the ways to control the costs of production diversification is to take
advantage of the compatibility function of standards. Also, by setting the ‘minimum
quality standards’ – the certain level of quality that if products reach that level or above
can be traded in the market (WTO, 2005) – product quality will be considered carefully
and improved substantially, at the same time remarkably reduce the negative risk faced
by customers (Leland, 1979). ‘Minimum quality standards’ also reduce cost of
uncertainty and process of evaluation arising to customers who will be the final
consumers or manufacturers that needs intermediate materials, hence customers have
enough information to make judgments and are not misled by too much information
(Hudson and Hudson, 2008). More than that, standards also provides a ‘manual’ for
company to base their own quality control and provide benchmarks for their own self-
improvement programs. When successful, such programs will gain customer’s loyalty
which will become a valuable intangible asset for company, and which, in turn, become
the motivation for company to maintain high operational and product quality
8
(Kindleberger, 1983). In addition, common standards may also take environmental and
safety issues into account in order to adapt to the general trend and requirements of social
welfare consideration (Blind, 2002). With this, customers can consume the product with
certain confidence in its safety, environmental impact and/ or the firms ethical business
and manufacturing practices (WTO, 2005).
There are many kinds of standards, and many ways to categorize them. In the
World Trade Report (WTO, 2005), the World Trade Organization describes several ways
to classify standards. Firstly, standards can be differentiated vertically and horizontally.
Vertical differentiation refers to “different varieties [that] can be ordered according to
certain scales”, while horizontal differentiation implies that “the characteristics used for
differentiation cannot be ranked”. The ‘minimum quality standards’ mentioned
previously can be placed in the vertical differentiation categorize, while horizontally
differentiation is about different in qualitative characteristics like color, style, etc.
Secondly, standards can be divided into private and public standards due to the
origination of that standard. However, the distinction between which standard will be
considered “public” or “private” is not always clear, and may depend on the perspective
of the observers. In general, “public” standards are the standards that take into account
the benefits of all entities in the society. “Private” standards primarily are concern with
the benefits of firms, and even they consider the benefits of customers, those benefits also
correspond to firms’ benefits as well. Non-governmental organizations (NGOs) like ISO
also set their own standards, and those are considered “private standards” under the
viewpoint of international trade law (WTO, 2005) . Thirdly, standards can be voluntary
9
or mandatory. With mandatory standards, only standardized products can be circulated in
the market, while with voluntary standards, either standardized and non-standardized
products can be distributed. Finally, standards can be used to standardize process or
products, as compared to product standards which concern about the characteristics of a
product, process standards are used to standardize the process of production in order to
control how the goods are produced, how effective the production process is, and how it
affects the environment.
Other authors have developed alternative categorization systems. Hebner
(Hebner, 1998), for example, divided standards into four categories: (1) test and
measurement standards are generic tools or ‘infra’ technologies, (2) product standards
that establish the fitness of a product for a particular use, (3) documentary standards
which set specifications for the function and operation of a device or a system, and (4)
process and management standards that addresses ‘quality and process management’. The
ISO 9000 business management standards and the ‘environmental management’
standards are examples of this latter group (ISO, 2009e). Alternatively, standards can be
divided into standards for minimal admissible attributes (for example: safety levels,
product quality, etc.), standards for reference (definitional standards, for example:
currencies, weights, measures, dimensions of materials, etc.), and standards for interface
(Jones and Hudson, 1996). Moenius (2004) categorized standards by their origin, he
termed de facto standards as standards evolving out of the market process, de jure
standards are standards imposed by law, and institutional standards as standards
10
resulting from coordination in committee and standardizations institution like the
International Organization for Standardization.
b. ISO 9000
This paper is interested in examining the impact of business management
standards on international trade. As among the most widely adopted standards in the
world, the ISO standards will be examined as a case example. ISO 9000 can be placed
into the category of an institutional (Moenius, 2004) , ‘private and voluntary
standards’(WTO, 2005).
The purpose of the ISO 9000 series of standards is to act as ‘generic quality
management standards’. This means that it is intended to be applied to the quality
management of any organization, in the society in general and in business in particular
regardless of the size of ownership or profit seeking status (i.e. privately owned, or state
owned), industry or service. ISO 9000 is a management tool designed to improve an
organization’s management system. It, therefore, does not give organizations specific
steps to run their business, instead this standard defines critical business elements
(activities) that must be considered and for which procedures must be in place for quality
business practices. ISO 9000 requires organizations to have their own “quality manual”
in order to document procedures developed to address the ISO ‘elements’ and to log any
activities that can affect the quality system. This process of procedure development and
documentation is a required intermediate step to get ISO 9000 accredited.(Docking and
Dowen, 1999).
11
It is worth noting, however, that ISO itself does not provide ISO 9000
certification, it is not compulsory to pursue certification. The standard may, instead, be
used to guide internal process development. Without certification, however, companies
cannot claim that they adhere to this standard. ISO 9000 certifications are issued by
independent audit companies. Importantly also, ISO certification is not a ‘once for life-
long certification’. Firms must be re-audited every three years to ensure that they still
adhere to the ISO 9000 requirements (ISO, 2009e).
In 1979, the ISO technical committee ISO/TC 176 was approved to be in charge
of the ISO 9000 family of standards for quality management and quality assurance. At
first, in 1979, it had 20 countries as active participants and 14 countries as observers
(ISO, 2009e). By mid-January 2009, this number has increased to 81 active participants
and 21 observers (ISO, 2009d).
In 1987, ISO/ITC 176 introduced the first version of ISO 9000, called ISO
9000:1987. Since that time, ISO 9000 has revised and introduced many updated versions
(usually every four years). Names of the standard are adjusted to reflect each version of
it, for example, a company could have been initially accredited to the ISO 9000:1994
version, ISO 9001:2000 version, or ISO 9001:2008 version.
While most standard revisions were relatively minor, in 2000, the International of
Standard Organization (ISO) made a significant change to the ISO 9000 standards. Prior
to December 2000, ISO 9000 consisted of a family of standards of ISO 9001, ISO 9002,
and ISO 9003 standards. ISO 9001 standards were for companies and organizations
whose activities included the creation of new products and who wanted to ensure quality
12
assurance in design, development, production, installation, and service. ISO 9002
standards were similar to ISO 9001, but did not include the requirements concerning new
product development. ISO 9003 standards cover only for the final inspection of finished
product, regardless of how the product was produced (Bizmanualz, 2009). After
December 2000, ISO merged ISO 9001, ISO 9002, and ISO 9003 standards into revised
ISO 9001 standards. To further distinguish between the old and new version, the new ISO
9001 standard is referred to as ISO 9001:2000 or ISO 9000:2000 (ISO9000Council.org,
2009). Today, the ISO 9000 family of standards is a general name, which refers to a
collection of standards documents. These are: (1) ISO 9000 standard which provides the
fundamentals and vocabulary used in the entire ISO 9000 family of standards; (2) ISO
9001, which describes quality management system; (3) ISO 9004 which is an extension
of ISO 9001, and is used by companies who wish to introduce a program of continual
quality improvement.
Due to the significant difference in the standard before and after 2000, in order to
have a more accurate view to the development of ISO 9000 standards, this discussion will
continue by separately examining the use of ISO 9000 standards before and after 2000.
i. Adoption of ISO 9000 before 2000
As of December 2000, there were at least 408,631 ISO 9000 certificates awarded
in 158 countries worldwide, this value reflected an increase by 16% (64,988) compared
to that of 1999 when only 150 countries had certified firms. In merely ten years since it
was first introduced, the number of certificates increased twenty times and at increasing
13
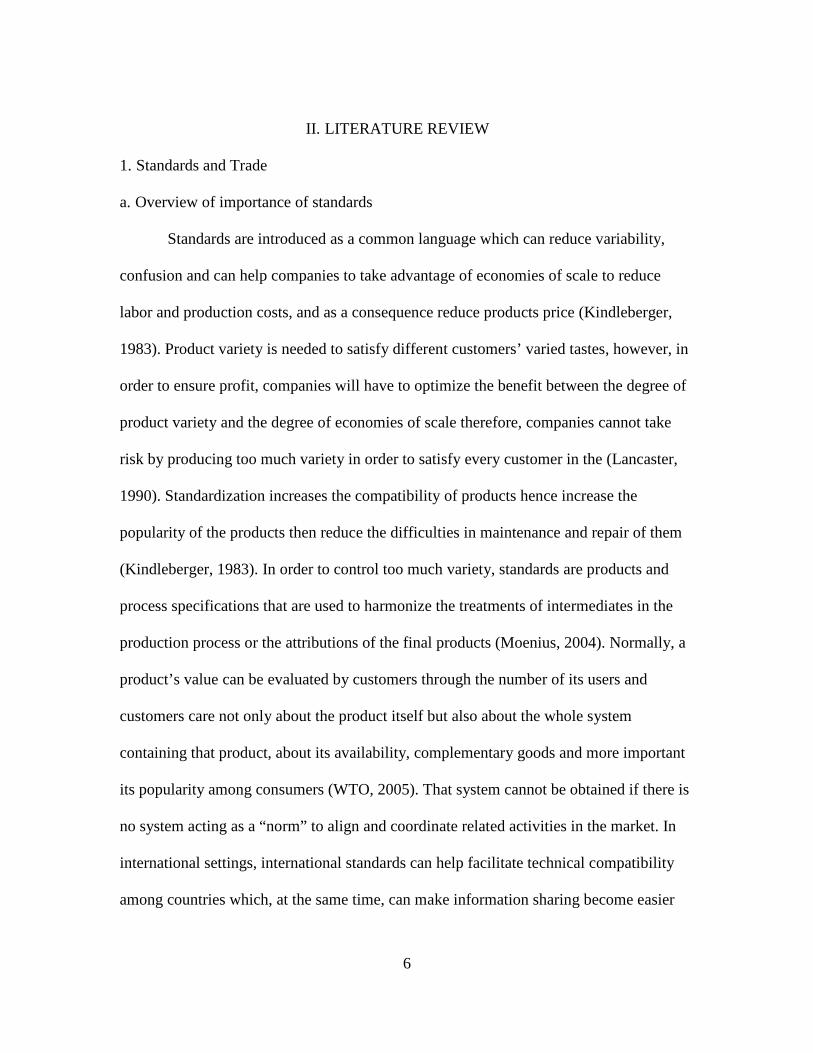
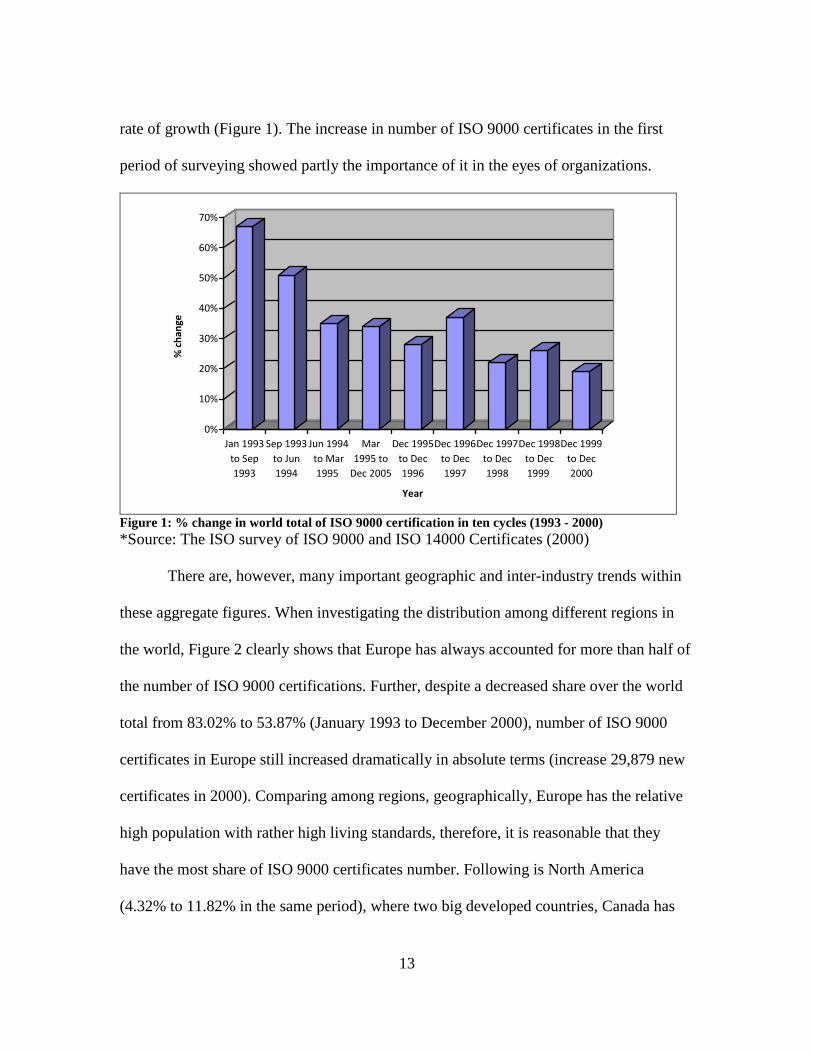
rate of growth (Figure 1). The increase in number of ISO 9000 certificates in the first
period of surveying showed partly the importance of it in the eyes of organizations.
0%
10%
20%
30%
40%
50%
60%
70%
% c
ha
ng
e
Jan 1993
to Sep
1993
Sep 1993
to Jun
1994
Jun 1994
to Mar
1995
Mar
1995 to
Dec 2005
Dec 1995
to Dec
1996
Dec 1996
to Dec
1997
Dec 1997
to Dec
1998
Dec 1998
to Dec
1999
Dec 1999
to Dec
2000
Year
Figure 1: % change in world total of ISO 9000 certification in ten cycles (1993 - 2000) *Source: The ISO survey of ISO 9000 and ISO 14000 Certificates (2000)
There are, however, many important geographic and inter-industry trends within
these aggregate figures. When investigating the distribution among different regions in
the world, Figure 2 clearly shows that Europe has always accounted for more than half of
the number of ISO 9000 certifications. Further, despite a decreased share over the world
total from 83.02% to 53.87% (January 1993 to December 2000), number of ISO 9000
certificates in Europe still increased dramatically in absolute terms (increase 29,879 new
certificates in 2000). Comparing among regions, geographically, Europe has the relative
high population with rather high living standards, therefore, it is reasonable that they
have the most share of ISO 9000 certificates number. Following is North America
(4.32% to 11.82% in the same period), where two big developed countries, Canada has
14
and the United States, especially the United States, are the bases for most of the biggest
companies, organizations in the world. But their share in total ISO 9000 certificates does
not change much through years, this may be due to the fact that they are among the most
developed countries in the world, therefore, their quality can be considered base
standards for others countries. Adopting ISO 9000 is not much attractive to them. Those
characteristics make ISO 9000 certificates popular there. Similar reason for Australia and
New Zealand which are developed countries. The shares of these developed countries in
the total world ISO 9000 certificates map did not change much through time. Replacing it
are the increasing share of developing and least developed economies which are Far East
(from 2.46% to 20.05%), Africa and West Asia ( from 3.42% to 4.945%), and Central
and South America (from 0.1% to 2.64%). These countries, especially developing
countries, have an increasing tendency to adopt ISO 9000 certification in order to
increase their reputation, and to facilitate business transactions internationally.
15
0%
20%
40%
60%
80%
100%
Jan
1993
Sep
1993
Jun
1994
Mar
1995
Dec
1995
Dec
1996
Dec
1997
Dec
1998
Dec
1999
Dec
2000
Year
Sh
are
of
ISO
90
00
ce
rtif
icate
(%
)
Africa/West Asia
Central and
South America
North America
Australia/New
Zealand
Far East
Europe
Figure 2: Regional share of ISO 9000 certificates (1993 - 2000) *Source: The ISO Survey of ISO 9000 and ISO 14000 Certificates (2000)
Within these aggregate regional trends, there are strong countriy – specific trends
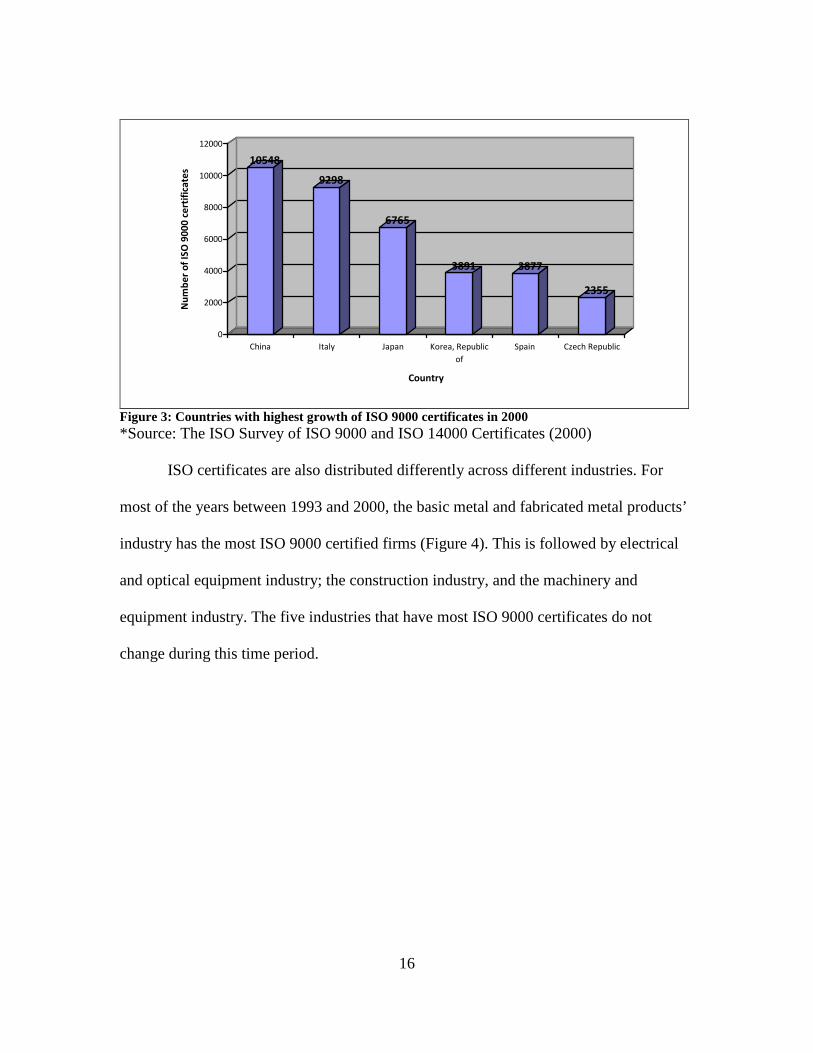
in ISO 9000 adoption that are worth examining. Figure 3 shows more clearly ISO 9000
certificates by countries with the highest rate of adoption. As depicted, Asian and
European countries are among those countries that have the highest increase of the
number of ISO 9000 certificates annually; in 2000, China and Italy have the highest
annual growth with 10,548 new certificates and 9,298 new certificates, respectively.
Japan with 6,765 new certified companies is in the third position, and after that are
Republic of Korea (3,891 new certificates), then Spain (3,877 new certificates) and
Czech Republic (2,355 new certificates).
16
10548
9298
6765
3891 3877
2355
0
2000
4000
6000
8000
10000
12000
Nu
mb
er
of
ISO
90
00
ce
rtif
ica
tes
China Italy Japan Korea, Republic
of
Spain Czech Republic
Country
Figure 3: Countries with highest growth of ISO 9000 certificates in 2000 *Source: The ISO Survey of ISO 9000 and ISO 14000 Certificates (2000)
ISO certificates are also distributed differently across different industries. For
most of the years between 1993 and 2000, the basic metal and fabricated metal products’
industry has the most ISO 9000 certified firms (Figure 4). This is followed by electrical
and optical equipment industry; the construction industry, and the machinery and
equipment industry. The five industries that have most ISO 9000 certificates do not
As ISO 9000 standards require improvement in a business’ management system,
the results are somewhat difficult to evaluate. Further, the impacts of improvement to
business system that can be attributed to ISO 9000 standards are often difficult to
quantify. As the result, real contribution of ISO 9000 to the performance of companies is
still a controversial issue (Gotzamani and Tsiotras, 2001).
Researchers divide into two opposite point of views. One agrees with the idea that
ISO standards actually help companies to improve communication, reduce quality
variation and related costs, increase customers’ satisfaction and keep ongoing
26
improvement in the companies (Williams, 1997). Surveying 4,250 certificated companies
in the United Kingdom about their motivation for pursuing ISO 9000 certification and the
benefits of it, using the five-point Likert-type rating scale, Buttle (1996) found that
certification improves profit, business process and operations, provides marketing
benefits, and that businesses are willing to recommend ISO 9000 standards to their
partners (Buttle, 1996). Similarly, using the data drawn by carrying out survey of ISO
9000 standards certified companies in Greece, Gotzamani and Tsiotras (2001) concluded
that ISO 9000 standards do help companies improve their performance significantly,
enhance their quality commitment, and other benefits to certified companies such as
process management, product design, strategic quality planning. In another research
concerning impact of ISO 9000 standards on only certified small to medium-sized
enterprises (SMEs) in Greater Tehran region, Bayati and Taghavi (2007) surveyed
companies’ opinion and found the same positive impact of ISO 9000 standards on their
performance. Dividing the impacts of ISO 9000 standards externally and internally, using
cluster analysis for 288 Spanish companies, Casadesús and Giménez (2000) found that
65% of the companies using ISO 9000 standards benefit from it, both externally and
internally, only 6% of them do not experience any benefit and the other 29% do not see
the benefit big enough to be considered significant. Most of the surveyed companies
(96%), however, all agree that ISO 9000 standards are useful for quality assurance.
Data gathered by survey, however, is not objective because it is based on
subjective respondent opinion. The results would be more reliable when the data can
reflect the real affect of ISO 9000 certification by using alternative approach such as
27
econometric methods. In a paper using data of 101 countries during from 1995 to 2001,
Grajek (2004) built a gravity model to determine the effect of ISO 9000 adoptions on
bilateral trade flows. This author concluded that using ISO 9000 standards does have
significant positive impact on international trade. The effect, however, was found to be
different under certain circumstances. For example, this study reported that the trade
among certified firms with uncertified firms will not be boosted due to the fact certified
firms tend to trade with certified partners. Also, the impact is not that big for developing
countries and especially least developed countries. Examining ISO 9000 standards from a
different angle by considering their impact on country-pair trade and foreign direct
investment (FDI) using trade and FDI data in 7 years (1995 -2002) of 52 OECD and non-
OECD members using gravity model, Clougherty and Grajek (2008) suggested a
different impact compared to Grajek’s result (Grajek, 2004) while their results still
confirmed about the importance of ISO 9000 standards on trade. Clougherty and Grajek’s
findings reveal that trade and FDI of developed countries do not benefit much from
adopting ISO 9000 standards while for developing countries; the benefit is positive and
statistically significant. Not only popular in the manufacturing sector, ISO 9000 standards
can be applied in the service management sector (Johannsen, 1995), the results by
Johannsen showed that implementing ISO 9000 standards in a correct way will result in
positive effect on the operation of an information sector organization.
Other authors, however, found that the impact of ISO 9000 certification is not
positively clear. Dick (2000) found that there is no significant link between quality
certification and improved business performance. This result was also found by many
28
other papers that have examined specific cases. A company acquires ISO 9000
certification both to improve its business activities but also to improve its image and
reputation in the market. ISO 9000 certification, however, was found to not always bring
much benefit to companies in these areas. Martinez-Costa and Martinez-Lorente
(Martinez-Costa and Martinez-Lorente, 2003) used the stock price of a sample of Spanish
companies to determine whether market perceives ISO 9000 registration as a sign of
better performance in the future. Results of this study found that the market seems not to
pay much attention to the certification, whereas in another paper (Nicolau and Sellers,
2002), the announcement of being certified has a positive effect of the stock price.
Martinez-Costa and Martinez-Lorente argued that this was due to an “illusion effect” and,
in long-term, certification generate a real affect on company’s performance. Lima et al.
(2000) also found the same result when comparing firms in Brazil that were ISO certified
against those that did not. Lima et al.’s (2000) results did not indicate any significant
difference in company’s performance between the two groups of firms.
In addition to these motivations, some companies adopt ISO 9000 standards for
the sake of having certification without any broader long-term commitment to quality.
Although Johannsen (1995) see that this action can increase the bureaucracy and paper
work for companies, it was seen as a useful marketing tool. Using seven-point Linkert
scale to survey the opinion of 272 Australian ISO 9000 certificated companies about their
primary motivation to pursue quality certificate, Jones and Arndt (1997) found that more
companies seek certification under the pressure of external circumstances than companies
seek certification for internal improvement. In the long term the benefit of certification
29
was not found to be significant for companies regardless of their primary purpose of
seeking certification.
2. Assessing the impact of standards on international trade
Trading activities are popular and happen all over the world nowadays. The
question is, however, why countries trade with each other, whether they benefit from
trade or not, if yes, how much is the benefit, or how big the trade flow between countries
is. In order to answer those questions and explain the cause of trade, many trade theories
were developed, such as the absolute advantage by Adam Smith, comparative advantage
by David Ricardo, Heckscher-Ohlin model, the new trade theory, or the gravity model.
These trade theories to some extents can partly demonstrate the incentives of countries
when trading, as well as, predict the magnitude of trade among trading partners.
a. Theoretical approach commonly used
i. Absolute and Comparative advantage
The concept of absolute advantage was introduced by Adam Smith (1776) who
reasoned that in international trade countries will gain if they specialized their production
when they have an absolute advantage in production. By this concept, a country with no
absolute advantage would not gain from international trade. In practice, however, this is
not true as many countries that do not have absolute advantage in the production of any
goods still profit from trading internationally.
As an extension of the concept of absolute advantage, David Ricardo (1815)
introduced the concept of comparative advantage. This theory stated that countries do not
need absolute advantage and can still gain from international trade by specialization in
30
goods in which they have competitive advantage. The comparative advantage theory,
however, also has some weaknesses. First, this theory assumes there would be an extreme
in specialization; this, of course, cannot occur in reality. Second, it assumes that trade
will affect on country as a whole, not on income distribution – which is not the real case.
In fact, as Krugman and Obstfeld reasoned, income distribution within countries is
affected strongly by international trade, because “resources cannot move immediately or
costlessly from one industry to another and costlessly [and] industries differ in the factors
of production they demand”. Hence, trade may benefit the country’s welfare as a whole
but hurt its small groups, at least in short-term. And understanding the income
distribution will be crucial in making trade policy process. Fourthly, it does not consider
the concept of economies of scale when the larger the scale of the production, the more
efficient it will be (similar to increasing returns – doubling inputs in an industry will
cause more than doubling in its production) – which is thought to occur in some countries
(Krugman and Obstfeld, 2003). Economies of scale motives countries to specialize and
trade even when they are not different in resources and technology.
ii. Heckscher-Ohlin model
The Heckscher-Ohlin (H-O) model was developed by Eli Heckscher and Bertil
Ohlin (Feenstra, 2003) to explain trade flow between two countries. This model describes
trade between two countries with two goods and two factors of production. Importantly,
this model is based on assumptions that the two countries have:
- identical production technology
- constant return to scale in the production of output
31
- mobile labor and capital within countries
- immobile labor and capital across countries
- same prices for goods and customer preferences
- perfect competition within each country, no market distortion
- differences in resource endowments (like land, capital and labor).
The H-O theorem suggests that each country will export the good that uses its
abundant factor of production intensively and import the good that uses its scarce factor
intensively. From the theorem with its assumption, it means that the countries are
different only because of differences in the endowment of their factor of production.
However, in 1953, Leontief (Feenstra, 2003) used US trade data and amount of labor and
capital in 1947 to test the H-O model and found out that the result is inverse from that
predicted by the H-O theorem. The findings are called “Leontief’s Paradox”. Future
research (Feenstra, 2003) found that one of the reasons for the paradox is due to the
assumption of identical production technology. Clearly, each country will have different
levels of technology development, and ignoring this difference is thought to cause the
bias in results (Feenstra, 2003).
iii. New trade theory
New trade theory was first introduced by Paul Krugman (1970s) to explain pattern
in international trade could not be fully explained by classic trade theories. New trade
theory takes into account specific country characteristics that may be relevant to explain
trade between countries. First, customers in different countries have different preferences
and/or customers’ preferences are diversified, this explains why there are different
32
brands, color, style preferences for the same products. Second, there exists economies of
scale where countries can save cost and produce at a larger scale. This opportunity to
scale production and export to larger market provides an incentive for international trade.
Third, there is imperfect competition where bigger firms can take advantage of
economies of scale will gain advantage over smaller ones then markets will be dominated
by one or few firms. Fourth, when countries have increasing return on scale of a product,
they will take advantage of the economies of scale to specialize on producing such
product, which will cause them to trade with other countries for other products that they
cannot produce as efficiently. Fifth, the difference in economic geography which creates
difference in transportation and thus productions costs is also another element to affect
trade. Countries have different geography, hence each region tends to produce a specific
product that can make the most of the benefit from that geographic location and the
economies of scale, which induces them to trade with others as well as (Krugman, 1980,
1991, 1994).
b. Gravity model
Those classic and new trade theories above do explain why trade between
countries happens and becomes a popular activity nowadays. They, however, cannot
specify the magnitude of trade between countries. The gravity model was introduced and
“has been a workhorse for cross-country empirical analyses of international trade flows”
(Baier and Bergstrand, 2006).
33
i. What is gravity model?
The gravity model of international trade describes in general terms to explain the
volume of trade between two countries which inspired by the “Law of Universal
Gravitation” by Newton which depicts the attractive force between two objects as:
2ij
jiij D
MGMF = (1)
Where:
ijF is the attractive force
iM , jM are the mass of two objects
ijD is the distance of the two objects
G is the universal gravitational constant
In this model, the gravitational force between two objects is proportional to the
product of the mass of those two objects and inversely proportional to the square of the
distance of the two objects. Applied this concept to trade flow, in 1962, Jan Tinbergen
first depicted the trade volume between two countries by using economic size of two
countries instead of the mass of two objects as formula (1). Most usually, GDP or GNP is
used to represent the economic size of countries. The “gravity model” for trade flow is
then expressed as:
ij
jiij D
YKYT = (2)
Where:
ijT is the total value of trade flowing from country i to country j
34
K is the constant term
iY , jY are the economic size of countries i and j
ijD is the distance between two countries i and j
The model implies that the volume of trade is proportional to the economic size of
the trading partners and is inversely proportional to distance between the countries. Due
to its success in explaining trade flows, this concept is widely used to analyze cross-
countries international trade flows. In empirical analysis, usually this model is expressed
in the form of natural logarithm in order to make use of the regression analysis to access
the impact of each independent variable on the dependent variable. Therefore, model (2)
is transformed to become:
ijjiij DYYKT lnlnlnlnln −++= (3)
However, it was realized that trade is also affected by other factors. Results
generate by the gravity model would be biased if those factors are not included as
explanatory factors of the value of trade flow between two countries.
Through study and intuition, researchers have identified other factors that could
affect trade flows (Anderson and Wincoop, 2003). For example, whether trading
countries share border or not, which will facilitate trade across border a lot if they are
adjacent to each other. Similarly, common language among trading partners is thought to
help trade flow quicker with the help of convenient paperwork, communication.
Countries with colonial ties are thought to trade more based on the fact that they may
have same laws and regulations when under the colonial power, which will facilitate
conducting legal transactions, and contract enforcement. A common currency is another
35
indicator thought to help boost trade between two countries as it reduces the effect of
exchange rate risk. Relatively geographical isolation of countries, being landlocked or
island, is another important element that can hinder or assist trade. When a country is
landlocked, transportation is usually limited to air, rail and/or road which are relatively
expensive. Island nations can take advantage of cheaper, convenient sea transportation.
Membership in regional trade area (RTA) or free trade area (FTA) or World Trade
Organization (WTO) can also help countries to trade more due to preferred trading access
and tariff rates.
To incorporate the impact of these exogenous country characteristics the standard
log-linear gravity equation to investigate the trade flow of two countries is denoted as a
general:
ij
n
xijxjiij ZGDPGDPTrade εββββ ++++= ∑
=3210 )ln()ln(ln (4)
Where:
ijTrade is the value of trade from country i to country j
iGDP , jGDP are the economic size of each country
ijZ is a set of extraneous variables expected to affect trade flow from country i to
country j
Using regression analysis, researchers can determine which factors have a
positive or negative effect on trade flows.
36
ii. Use of the gravity model in evaluating the impact of standards on trade
Since its introduction in 1962, the gravity model has been widely used to analyze
international trade flows. It can be applied widely to estimate the effect of a certain
characteristic of countries on trade, from sharing FTA, RTA to forming a common
monetary zone, etc.
Using a gravity model, Baier and Bergstrand (2006) sought to find empirical
evidence of effect of FTA on two members’ trade. These authors used real bilateral trade
flows of ninety six potential trading partners (country pairs with no trade flows are
excluded) from 1960 to 2000 with other dummy variables to account for exogenous
country characteristics. These authors found that membership in an FTA will increase
two member country’s trade, and the impact will be larger in the later years, increase by
100% in 10 years (Baier and Bergstrand, 2006). Assessing the impact of RTAs on trade,
Grant and Lamber (2008) used the trade data for agricultural and non-agricultural sector
of eighty six countries/regions to draw to the conclusion that RTA increase more trade for
agricultural sector than non-agricultural sector. The authors found that it takes longer
time for members to realize the significant increase in their agriculture trade, increase by
149% after twelve years of being in RTAs. Further, the increase in agricultural trade
facilitates through RTAs is much higher than the increase in non-agricultural trade. The
result, partly, proves the importance of RTAs in liberalizing agricultural trade, because
normally agricultural products receive higher protection than non-agricultural products.
They also found out that the impact of RTA on agricultural and non-agricultural trade is
different for different agreements. In estimating the impact of the West African Monetary
37
Zone (WAMZ), Balolgun (2008) built a gravity model and the estimates show that there
is a significant and positive effect of the same monetary zone on trade flows, and the
positive effect of it on intra-industry trade in agriculture commodities, as well as the
positive effects of adjacency and negative effect of different currency and language.
Similarly, Grajek (2004) built a gravity model to investigate the diffusion of ISO
9000 standards on international trade using trade data from 101 countries in the period of
1995 – 2001, which clearly show the empirical role of ISO 9000 standards on
international trade. The author found that bilateral export of a country will increase
0.27% when there is an increase of 10% in number of ISO 9000 certified firms and
certified firms tend to trade with each other more than uncertified ones. In addition, the
author also mentioned that the ISO 9000 diffusion seemed to have a more positive impact
on trade of developed countries other than less developed countries. In a research by
Clougherty and Grajek (2008), they used the gravity model to evaluate the impact of ISO
9000 certification on trade flows and FDI of OECD countries in the period of 1995-2002,
comparing three different country-pair types: developing to developed, developed to
developing, and developed to developed. They learned that ISO 9000 certification does
not seem to impact trade and FDI of developed countries, while does increase trade (by
exporting to developed countries) and FDI (investment from developed countries) of
developing countries. Exports from developing countries to developed countries will
increase 1.16% when number of ISO 9000 certificate increases 10% and FDI of
developing countries from developed countries will increase $69,600 with one additional
certificate.
38
To investigate the impact of ISO 9000 certification on trade of less developed
countries where have high information asymmetries and quality assurance problems,
Potoski and Prakash (2008) made use of trade data from 140 countries during the period
of 1994 to 2004 to build the gravity model for that purpose. The study also separated the
impact of ISO 9000 certification on different economic status for importing and exporting
countries, by rich, medium, and poor categories based on World Bank’s classification and
for OECD and non-OECD countries. The results show that a 1% increase in number of
ISO 9000 certifications of poor countries will lead to 0.021% increase in export to rich
countries, and 0.046% to medium countries, as well as a 1% increase of that of medium
countries will lead to 0.43% increase in export to rich countries. For OECD countries
classification approach, a 1% increase in number of ISO 9000 certifications of non-
OECD countries will increase export to other non-OECD countries by 0.053% and to
OECD countries by 0.043%.
39
III. METHODOLOGY
The purpose of this study is to assess the effect of ISO 9000 on international trade
flows by building a gravity equation based on variables considered to have impact on
trade flows. At its core this model uses data about the bilateral imports from a country to
another country in a specific industry, the sector-specific proportion of ISO 9000 certified
firms in each country, as well as the GDP of the import and export country. Other factors
which also may affect trade are included through the use of dummy variables.
1. Data
The study uses data from several sources; first the number of ISO 9000
certificates by country by industry using the EA codes system provided by International
Standardization Organization. Second, the number of firm count data by country by
industry using the ISIC Rev. 2 code system provided by the United Nations Industrial
Development Organization’s (UNIDO) Industrial Statistics Database at 3-digit level.
Finally, the bilateral trade flows by industry (using the ISIC Rev. 2), GDP are provided
by World Bank in Trade, Production and Protection database. Dummy variables about
geographical characteristics, colonial tie, language, distance, member of RTA, etc. are
provided by the Centre d’Etudes Prospectives et d’Informations Internationales (CEPII).
a. Sector concordance
Data used in this analysis was obtained from different sources that use different
coding systems to categorize industries. Trade flow information is classified according to
the 3-digit ISIC (the International Standard of Industrial Classification of All Economic
Activities) Rev.2 introduced by the UN (United Nations) to categorize all economic
40
activities based on their products or process (ESDS International, 2009). In this system,
all global manufacturing activities are classified into one of twenty nine industries (Table
4). The EA code system is introduced by the European co-operation for Accreditation,
and has thirty nine industries in it (Table 5). It is under this coding system that the ISO
9000 certification information is classified. Due to differences in the sections under each
of these systems, this study creates its own categorization for industry sectors (Table 1).
This is required to merge data from those different sources into one database. The
classification system which was developed is based on their relative similarity in the final
products as well as the production process.
b. Description of ISO variables
The ISO variable is built by taking the ratio of the number of ISO 9000 certified
firms in each industry to the total number of firms count in that industry. The purpose of
taking the ratio of these two variables is to bring a more robust way of looking at the
number of ISO certifications in a relative comparison with the total number of firms1.
1 A similar measure has been used by other authors (Sung and Reinert, 2009) to assess such approach as the “conformity capacity” to measure the ability of government of exporting countries in helping exporting companies to get accredited by offering a reasonable price as well as acting as a bridge to connect with internationally recognized accredited laboratory.
Electrical and optical equipment 19: Electrical and optical equipment 383: Machinery, electric 21: Aerospace 385: Professional and scientific equipment
14 Transport equipment
20: Shipbuilding 384: Transport equipment
22: Other transport equipment 15
Other manufacture 11: Nuclear fuel
390: Other manufactured products 23: Manufacturing not elsewhere classified
42
i. Number of certifications
This study makes use of data about number of certification issued by ISO for
2005 (ISO, 2005c); at that time there were 607,140 certified firms globally in 147
countries and 39 industries. The reason to choose the data for ISO 9000 certificate in
2005 even when the latest update data for it is 2007 is due to the lack of trade flow data,
GDP, and other needed data beyond. Therefore, ISO 9000 2005 database will be most
suitable to be used in coordination with trade database.
It is important to note that although the ISO certification data is compiled by ISO,
the source does not necessarily reflect an accurate number of ISO certifications due to the
difficulties in collecting data. The difficulties are due to many reasons. First, as
mentioned previously, ISO does not itself act as a certification body. Data regarding
certifications is compiled from other sources. Such as ISO national member institutes, or
accreditation and certification bodies that are members of International Accreditation
Forum (AIF). However, there are still many accreditation and certification bodies not AIF
members. Therefore, the ISO survey of certifications may miss those data from them.
Second, in answering the survey, some surveyed entities are reluctant to answer due to
privacy considerations when information is “used by competitors as ‘business
intelligence’ about their rivals” (ISO, 2005c). In spite of those constraints, the ISO survey
is the most reliable source of data about ISO 9000 certifications. Since 2003, ISO surveys
have been conducted annually. As such ISO can update the incomplete information from
the previous surveys.
43
In its original classification, the ISO 9000 certification data was divided among
thirty nine industries. In the new coding system (Table 1), there are only fifteen
industries. As such the new system combines some of the individual industries in the ISO
survey into one industry under the new code. Therefore, the number of certifications will
be added accordingly in order to truthfully reflect the number of certifications of each
industry under the new system. It is also important to note that, the paper does not use
some of the industries included in the ISO survey due to the fact that the firm count data
does not have information about those industries. Such as industries 1, 2, and industries
24 to 29 (Table 4); these industries are primary and services industries.
ii. Firm count data
Firm count data from World Bank Database are the CD-ROM version of
UNIDO’s Industrial Statistics Database at 3 digit level of the ISIC classifications (Rev.2).
As this source does not have complete information regarding the number of firms in each
industry and in each country across time, some adjustments were required in the use of
this source. To make the best use of the existing data as well as best reflecting the real
situation, the study uses the maximum number of firms among years from 2000 to 2004
within each industry and country to be the number of firms in 2004. The reason for using
the maximum data is due to the large variance in the reported number of firms and
therefore, the maximum number of firms will be the most conservative estimate.
The technique used to deal with the firm count data under the new coding system
is the same as that used for reclassifying the ISO 9000 certifications.
44
The ISO ratio is then calculated by taking the ratio of the number of ISO 9000
certifications to the maximum number of firms of industry k in country ji, among years
from 2000 to 2004.
kji
kji
firmsofNumber
inionscertificatISOofNumberratioISO
);(20042000
);(
)__(max
2005___9000____ = (5)
iii. Interaction variables
In order to further explore the impact of ISO 9000 certification in alternative
specifications of the baseline gravity model, new variables are generated which interact
ISO 9000 ratio with each country’s development status (developed, least developed and
developing). These interaction variables will reflect the effect of ISO certification given a
specific economic status on international trade in the gravity model.
The data describes about the development status of countries comes from
different sources. Developed countries data is taken from the IMF list of high-income
countries. Least developed countries data is taken from WTO website. The remained
countries are developing countries.
c. Description of other variables
The preeminence of the gravity model is that it takes into consideration all
elements that are considered to have significant impact on international trade. Therefore,
beside ISO 9000 data, it is necessary to use other data which are, of course, the dependent
variable – trade flow between countries, independent variables such as economic size of
countries (GDP), and other explanatory variables that can influence trade flows.
45
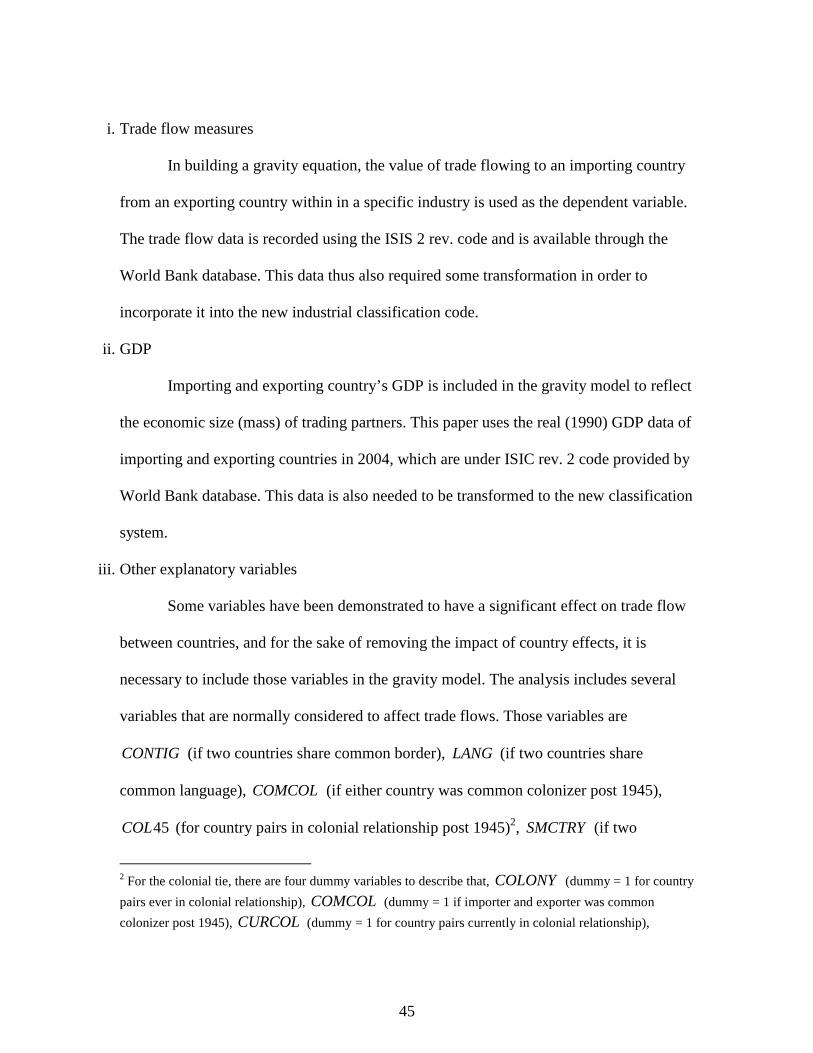
i. Trade flow measures
In building a gravity equation, the value of trade flowing to an importing country
from an exporting country within in a specific industry is used as the dependent variable.
The trade flow data is recorded using the ISIS 2 rev. code and is available through the
World Bank database. This data thus also required some transformation in order to
incorporate it into the new industrial classification code.
ii. GDP
Importing and exporting country’s GDP is included in the gravity model to reflect
the economic size (mass) of trading partners. This paper uses the real (1990) GDP data of
importing and exporting countries in 2004, which are under ISIC rev. 2 code provided by
World Bank database. This data is also needed to be transformed to the new classification
system.
iii. Other explanatory variables
Some variables have been demonstrated to have a significant effect on trade flow
between countries, and for the sake of removing the impact of country effects, it is
necessary to include those variables in the gravity model. The analysis includes several
variables that are normally considered to affect trade flows. Those variables are
CONTIG (if two countries share common border), LANG (if two countries share
common language), COMCOL (if either country was common colonizer post 1945),
45COL (for country pairs in colonial relationship post 1945)2, SMCTRY (if two
2 For the colonial tie, there are four dummy variables to describe that, COLONY (dummy = 1 for country
pairs ever in colonial relationship), COMCOL (dummy = 1 if importer and exporter was common
colonizer post 1945), CURCOL (dummy = 1 for country pairs currently in colonial relationship),
46
countries were ever the same country), DIST (distance between two countries),
ISLANDI (if export country is an island nation), ISLANDJ (if import country is an
island nation), LLI (if export country is a landlocked nation), LLJ (if import country is
a landlocked nation), and RTADUM (if two countries were party to the same RTA in
year 2004). These variables and their expected impact on trade flows (impediment or
facilitator) are summarized in Table 2.
Besides, in order to taking into account the status of economic development of
importing and exporting and the effect of it on trade flow, in some model specifications,
this analysis also uses dummy variable for 3 levels of economic development:
DEVELOPED , DEVELOPING , LDC (least developed).
2. Analytical approach
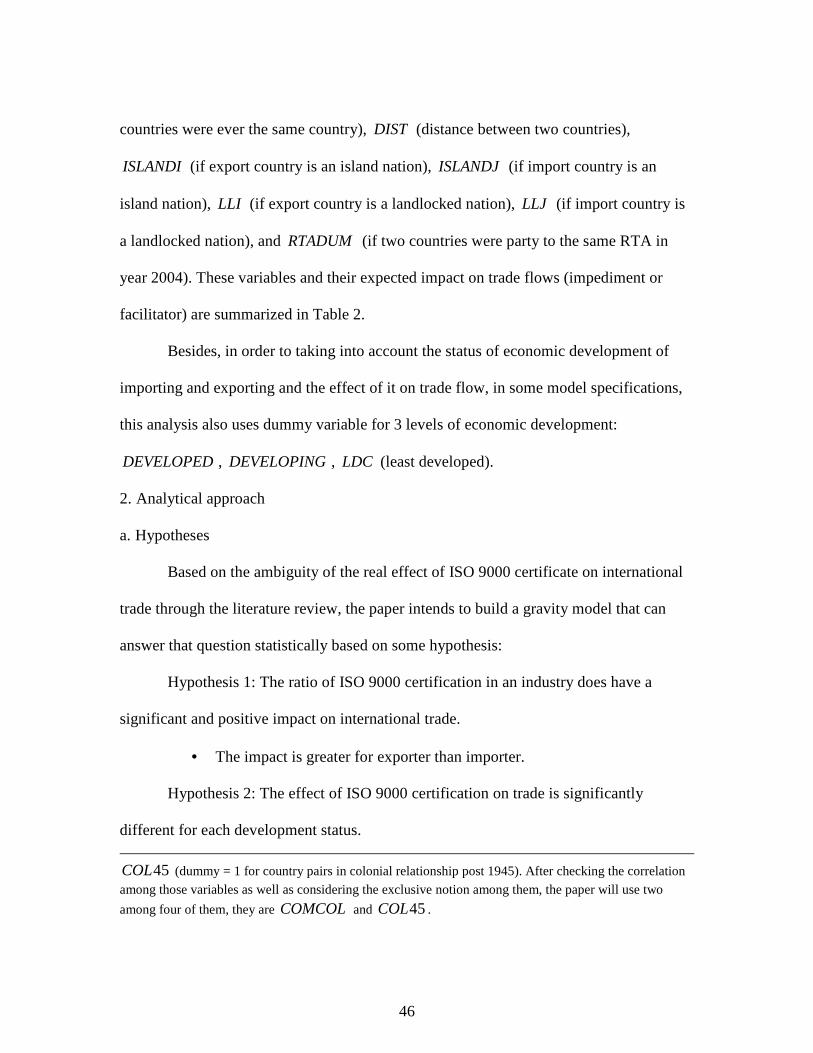
a. Hypotheses
Based on the ambiguity of the real effect of ISO 9000 certificate on international
trade through the literature review, the paper intends to build a gravity model that can
answer that question statistically based on some hypothesis:
Hypothesis 1: The ratio of ISO 9000 certification in an industry does have a
significant and positive impact on international trade.
• The impact is greater for exporter than importer.
Hypothesis 2: The effect of ISO 9000 certification on trade is significantly
different for each development status.
45COL (dummy = 1 for country pairs in colonial relationship post 1945). After checking the correlation
among those variables as well as considering the exclusive notion among them, the paper will use two
among four of them, they are COMCOL and 45COL .
47
Hypothesis 2a: ISO 9000 certification has a positive and significant effect on the
value of trade exported from developed countries to developed countries.
Hypothesis 2b: ISO 9000 certification has a positive and significant effect on the
value of trade exported from developing countries and least developed countries to
developed countries.
• The impact is more for less developed countries than the developed
countries.
b. Baseline model
Baseline model uses the simple data of real GDP, ratio of number of ISO 9000
certificates to number of firms and other indicator variables capture other characteristics
of import and export country.
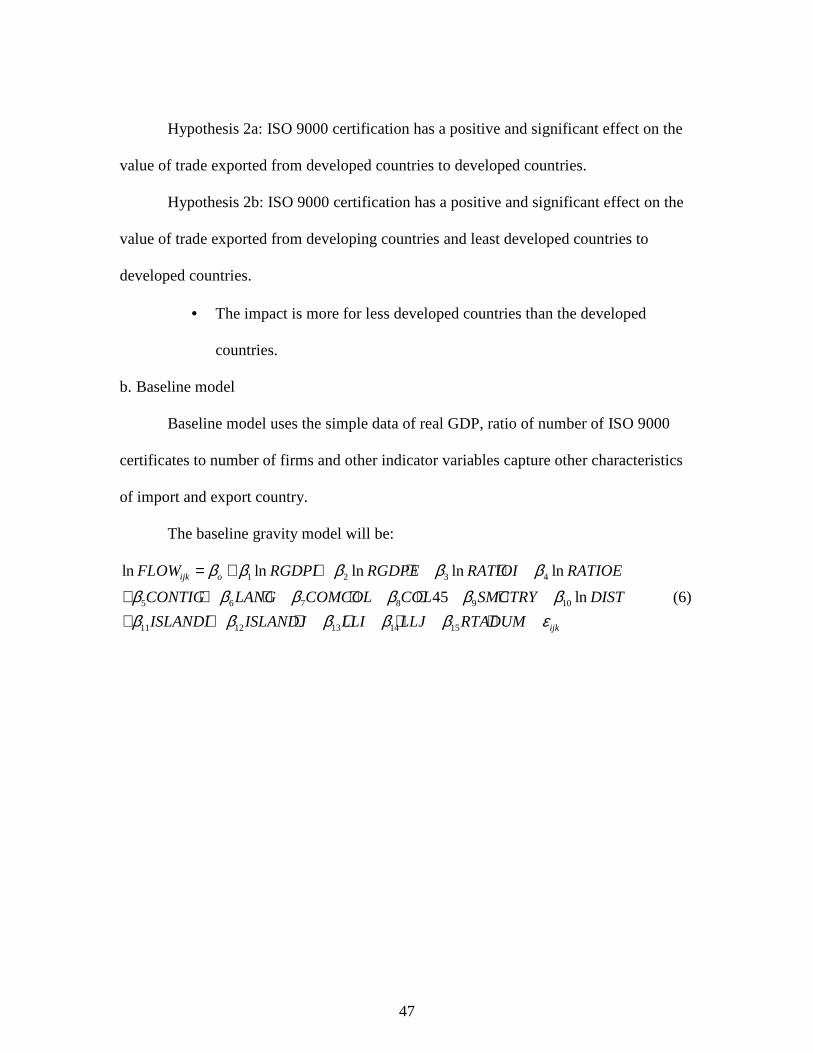
The baseline gravity model will be:
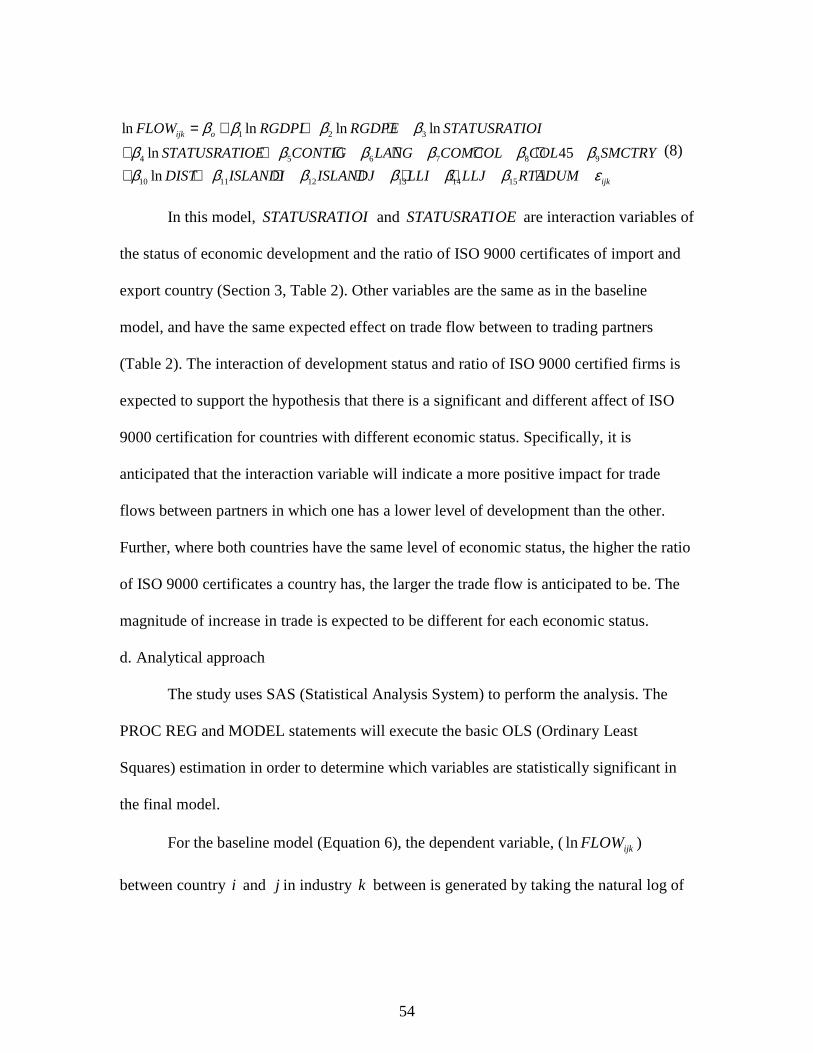
1 2 3 4
5 6 7 8 9 10
11 12 13 14 15
ln ln ln ln ln
45 ln
ijk o
ijk
FLOW RGDPI RGDPE RATIOI RATIOE
CONTIG LANG COMCOL COL SMCTRY DIST
ISLANDI ISLANDJ LLI LLJ RTADUM
β β β β ββ β β β β ββ β β β β ε
= + + + +
+ + + + + ++ + + + + +
(6)
48
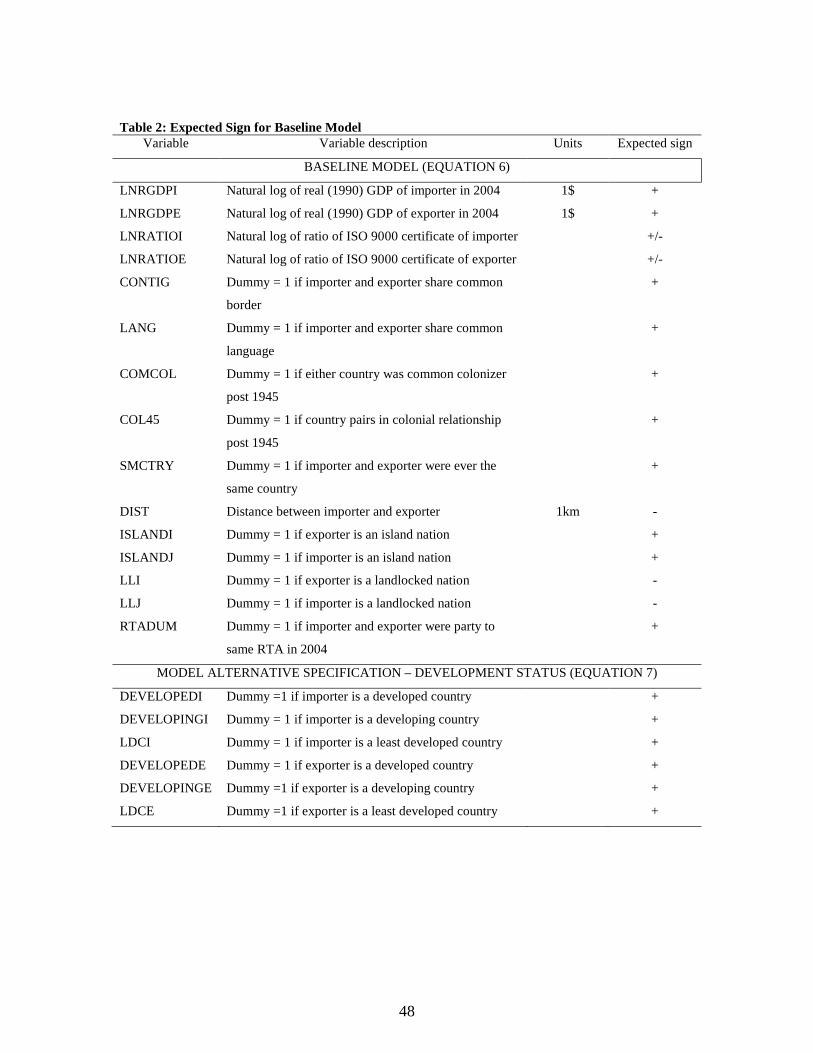
Table 2: Expected Sign for Baseline Model Variable Variable description Units Expected sign
BASELINE MODEL (EQUATION 6)
LNRGDPI Natural log of real (1990) GDP of importer in 2004 1$ +
LNRGDPE Natural log of real (1990) GDP of exporter in 2004 1$ +
LNRATIOI Natural log of ratio of ISO 9000 certificate of importer +/-
LNRATIOE Natural log of ratio of ISO 9000 certificate of exporter +/-
CONTIG Dummy = 1 if importer and exporter share common
border
+
LANG Dummy = 1 if importer and exporter share common
language
+
COMCOL Dummy = 1 if either country was common colonizer
post 1945
+
COL45 Dummy = 1 if country pairs in colonial relationship
post 1945
+
SMCTRY Dummy = 1 if importer and exporter were ever the
same country
+
DIST Distance between importer and exporter 1km -
ISLANDI Dummy = 1 if exporter is an island nation +
ISLANDJ Dummy = 1 if importer is an island nation +
LLI Dummy = 1 if exporter is a landlocked nation -
LLJ Dummy = 1 if importer is a landlocked nation -
RTADUM Dummy = 1 if importer and exporter were party to
same RTA in 2004
+
MODEL ALTERNATIVE SPECIFICATION – DEVELOPMENT STATUS (EQUATION 7)
DEVELOPEDI Dummy =1 if importer is a developed country +
DEVELOPINGI Dummy = 1 if importer is a developing country +
LDCI Dummy = 1 if importer is a least developed country +
DEVELOPEDE Dummy = 1 if exporter is a developed country +
DEVELOPINGE Dummy =1 if exporter is a developing country +
LDCE Dummy =1 if exporter is a least developed country +
49
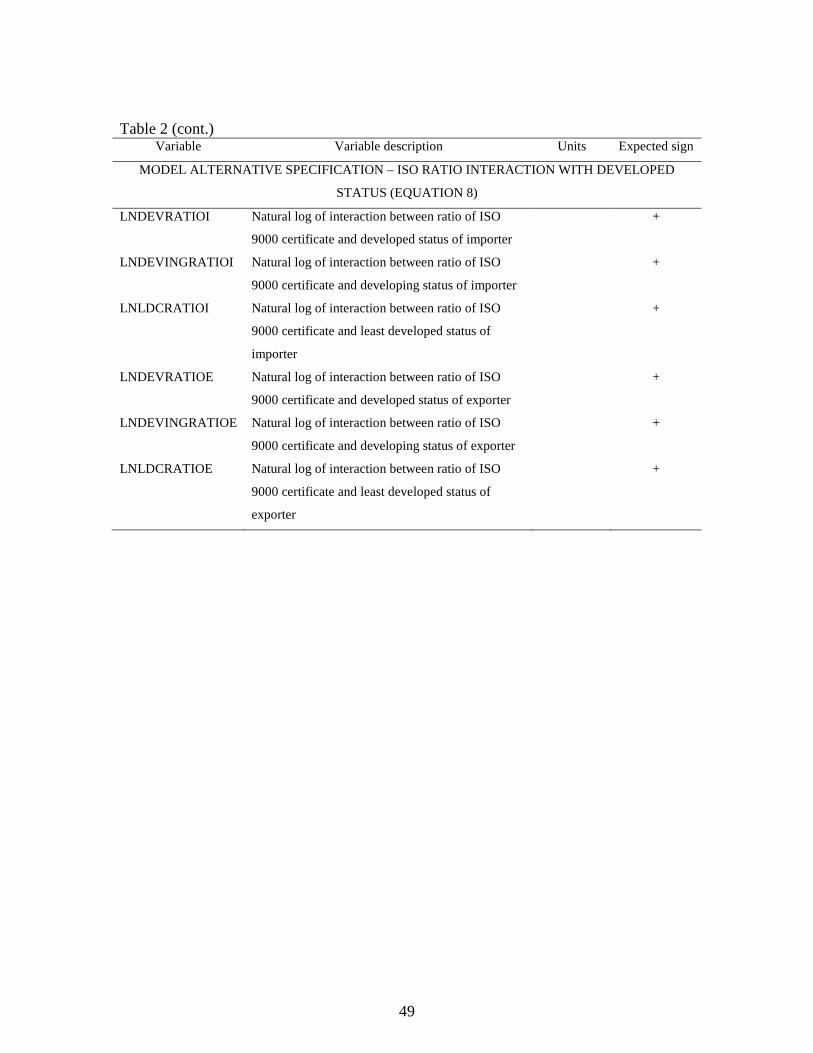
Table 2 (cont.) Variable Variable description Units Expected sign
MODEL ALTERNATIVE SPECIFICATION – ISO RATIO INTERACTION WITH DEVELOPED
STATUS (EQUATION 8)
LNDEVRATIOI Natural log of interaction between ratio of ISO
9000 certificate and developed status of importer
+
LNDEVINGRATIOI Natural log of interaction between ratio of ISO
9000 certificate and developing status of importer
+
LNLDCRATIOI Natural log of interaction between ratio of ISO
9000 certificate and least developed status of
importer
+
LNDEVRATIOE Natural log of interaction between ratio of ISO
9000 certificate and developed status of exporter
+
LNDEVINGRATIOE Natural log of interaction between ratio of ISO
9000 certificate and developing status of exporter
+
LNLDCRATIOE Natural log of interaction between ratio of ISO
9000 certificate and least developed status of
exporter
+
50
In this model, ijkFLOW is the dependent variable and reflects the bilateral imports
of industry k from exporting country i to importing country j , and is expected to be
explained by other independent variables. GDP measures are expected to have a positive
and significant effect on the bilateral trade flow; the higher the GDP of a country is, the
higher trade flow it is anticipated to have. The ISO ratios are anticipated to have a
positive impact on trade flow; the higher the ratio of ISO 9000 certified to total firms, the
larger the trade flow. Dummy variables such as CONTIG , LANG , SMCTRY ,
RTADUM , COMCOL , 45COL , ISLANDI , ISLANDJ are all expected to have a
positive impact on the value of trade between two countries. When two countries share
border, have same common language, were ever same country, are parties to same RTA,
were common colonizer relationship or in colonial relationship post 1945, and are island
nations trade will be increased significantly. Whereas DIST will have negative impact
on trade, the farther the distance between the trading partners, the less they will trade.
Similarly, when two countries are landlocked (LLI and LLJ ), they will tend to trade
less. The error term of the model is denoted by ijkε , has homogeneous variance, and is
normally distributed (mean = 0, variance = 1).
However, the baseline model does not consider all the impacts of the economic
development status of countries on trade which when added will be expected to bring
different scenarios with different status. Therefore, this analysis evaluates the alternative
specifications that include the economic status into the model with the purpose to have
deeper understanding about real effect of ISO 9000 certification on trade.
51
c. Alternative model specifications
The paper takes two more approaches to build the gravity equation for assessing
the effect of ISO 9000 certification on trade flow which use different independent
variables and taking into account the development status of trading partners. The two
models still use the trade flow of each industry as the dependent variable, and
independent variables will again include the real (1990) GDP of each country in 2004,
and other dummy variables as indicators. However, the difference between them is the
way the economic status and the ratio of ISO 9000 certification are included into the
model.
In general, when a country with a lower level of development exports to a country
with a higher level country, it will have more difficulties in meeting the quality
requirements of the higher level country than the reverse direction. Further, countries that
have the same level of development will tend to trade more than countries in different
development status (Hudson and Jones, 2003). However, the question is whether ISO
9000 certificate is not useful at all for companies in those less developed countries to take
up. Taking into account the trading country’s development status in conjunction with ISO
9000 ratio will provide insights into this question.
In the first alternative approach, the model is similar to the baseline model; this
model (Equation 7) includes GDP, the logarithm of the ratio of ISO 9000 certification to
the total number of firms, and the same series of dummy variables to account for country
characteristics. In addition, to isolate the effect of a country’s level of economic
52
development on trade, this model specification also includes dummy variables that reflect
the relative development status of the importing and exporting countries.
The gravity model for adding effect of economic status is:
1 2 3 4
5 6 7 8 9 10
11 12 13 14 15 16
17
ln ln ln ln ln
45
ln
ijk o
ijk
FLOW RGDPI RGDPE RATIOI RATIOE
STATUSI STATUSE CONTIG LANG COMCOL COL
SMCTRY DIST ISLANDI ISLANDJ LLI LLJ
RTADUM
β β β β ββ β β β β ββ β β β β ββ ε
= + + + +
+ + + + + ++ + + + + ++ +
(7)
In this model, the purpose of taking into account the economic status is to isolate
the impacts of the adoption of ISO 9000 certificate and the trading country’s economic
status. Due to the expected variability in the importance of ISO 9000 depending on a
country’s level of development, isolating this affect should make ISO 9000 certification’s
role much clearer compared to the baseline model. Countries with different levels of
development often have different opportunities to trade. Developed countries are
normally assumed to have high quality products and least developed and developing
countries will have lower quality products. This assumption will create more advantage
for developed countries in trade than less developed countries. ISO 9000 certification is a
way to prove organizational quality but as reported by Hudson and Jones (2003),
customers tend to believe in the existing quality of those developed countries rather than
quality based on a certification. Less developed countries will use such certification to
partly prove their quality. Therefore, the impact of ISO 9000 on trade is likely to differ
across countries with different development status. Therefore, STATUSI and STATUSE
are dummy variables that represent the economic development status of the import and
export country (Section 2, Table 2). For this analysis, three levels of economics
53
development are considered: developed, developing and least developed countries. This
new variables about the economic status of a country, the model is expected to have a
more specific result of the effect of them on trade flow.
GDP and country specific indicator variables in this model (Equation 7) are
expected to have the same sign and effect on trade as in the baseline model. With regard
to ISO 9000 ratio, it is expected that higher ratio of ISO 9000 certified firms to the total
number of firms in an importing and/or exporting country, the higher the value of trade
between those two countries regardless of their economic status. The impact of the ISO
ratio on trade, however, is expected to be different for countries of different economic
status. The higher the economic status, the less it is anticipated that that country will
benefit from ISO 9000 certification. Therefore, it is anticipated that the impact on trade of
ISO 9000 for a country with least developed country status will be the largest, followed
by developing and then developed country status.
While the modeling approach outlined by Equation 7 is useful to disentangle the
affect of a country’s development status on trade, it does not account for the joint impact
of ISO 9000 certification and development status. Therefore, a second approach is also
used which takes into account the interaction between the dummy variable of the status of
economic development and the ISO 9000 ratio. It is anticipated that this approach will
give a better view on the real effect of ISO 9000 certification on trade between countries
of various levels of economic development. The gravity model for considering interaction
between ratio of ISO 9000 with economic status is described in Equation 8 below:
54
1 2 3
4 5 6 7 8 9
10 11 12 13 14 15
ln ln ln ln
ln 45
ln
ijk o
ijk
FLOW RGDPI RGDPE STATUSRATIOI
STATUSRATIOE CONTIG LANG COMCOL COL SMCTRY
DIST ISLANDI ISLANDJ LLI LLJ RTADUM
β β β ββ β β β β ββ β β β β β ε
= + + +
+ + + + + ++ + + + + + +
(8)
In this model, OISTATUSRATI and OESTATUSRATI are interaction variables of
the status of economic development and the ratio of ISO 9000 certificates of import and
export country (Section 3, Table 2). Other variables are the same as in the baseline
model, and have the same expected effect on trade flow between to trading partners
(Table 2). The interaction of development status and ratio of ISO 9000 certified firms is
expected to support the hypothesis that there is a significant and different affect of ISO
9000 certification for countries with different economic status. Specifically, it is
anticipated that the interaction variable will indicate a more positive impact for trade
flows between partners in which one has a lower level of development than the other.
Further, where both countries have the same level of economic status, the higher the ratio
of ISO 9000 certificates a country has, the larger the trade flow is anticipated to be. The
magnitude of increase in trade is expected to be different for each economic status.
d. Analytical approach
The study uses SAS (Statistical Analysis System) to perform the analysis. The
PROC REG and MODEL statements will execute the basic OLS (Ordinary Least
Squares) estimation in order to determine which variables are statistically significant in
the final model.
For the baseline model (Equation 6), the dependent variable, ( ijkFLOWln )
between country i and j in industry k between is generated by taking the natural log of
55
real (1990) trade flow in 2004. Using the same technique by taking the natural log of the
independent variables, RGDPIln and RGDPEln are natural logs of real (1990) GDP of
importing and exporting country in 2004, respectively; RATIOIln and RATIOEln are
natural logs of the ratio of the number of ISO 9000 certifications to the total number of
firms. For other dummy variables, the value will be 1 for “yes”, and 0 for “no”.
To evaluate the alternative models, minor adjustments of the baseline model were
required. For alternative model specification with development status (Equation 7), two
dummies variables for the economic status of the importing and exporting countries were
added. As there are three levels of economic status considered, this will generate nine
models reflecting nine pairs of combination of the economic status for importing and
exporting countries
For alternative model specification with the interaction of ISO 9000 ratio and
development status (Equation 8), instead of using the ISO ratio, this model explores the
interaction of ISO 9000 certification and country development status by taking the
multiplication of the ratio and the status. Again, this will bring about nine models for the
nine pairs of importing and exporting countries across the three levels of development
status.
56
IV. RESULTS AND DISCUSSION
Using the gravity model with trade flows between countries in 2004 and ISO
9000 ratio, this study examines the impact of ISO 9000 certification on international trade
from three ways. First, in the baseline model, the study modifies the standard gravity
model by also taking into account the ratio of ISO 9000 certified firms as an independent
variable. Second, to this baseline model, dummy variables that capture the economic
status of importing and exporting countries are added. Third, besides GDP, and other
country characteristics, the study considers the interaction of the ISO 9000 ratio and the
economic status of importing and exporting country.
1. Results from Baseline Model
Results for the baseline model – Model 1 (Table 7) reveals that the independent
variables are statistically significant and have the expected effect on trade flow. Also as
expected, results show that the impact varies among each variable.
In general, an increase in GDP will positively increase the trade flow between two
countries, and an exporter’s GDP will contribute to trade flow more than that of importer.
For real GDP indicator, the coefficient for importer and exporter 1β and 2β are from
0.661 to 1.041, respectively.
With regard to the dummy variables, some have a positive impact on trade flow,
whereas other has a negative impact. Among those that have a positive impact, when
countries have colonial relationship after 1945 ( 45COL ) have biggest affect on trade,
with coefficient is 1.110 (p-value <0.0001) which translates to an increase of 203%
((exp(1.110) – 1) x 100%) in trade between two countries. This can be explained due to
57
the fact that when countries have colonial ties they also tend to have similar
characteristics in culture, law, population, language and also have statistically significant
on trade flow.
When countries pairs are members of the same RTA in 2004, and have a common
border, those characteristics also have a large affect on trade; the coefficients on these
variables are 0.926 (p-value <0.0001) and 0.818 (p-value < 0.0001), respectively. That
means when two countries are members of same RTA, trade flow will increase 152%
((exp(0.926) – 1) x 100%) and when they are contingent (CONTIG ), trade flow will
increase 127% ((exp(0.817) – 1) x 100%) compared to two otherwise similar countries,
all else being constant. This large effect is anticipated. Being members in the same RTA
( RTADUM ) helps countries to improve their trade flow due to the fact that normally
countries in the same regional trade agreement will remove many of their tariff, and non-
tariff barriers, and will create more harmonized standards and technical agreements
which will facilitate trade within the RTA region. Intuitively, when two countries are
contingent to each other, the trade between them will be enhanced due to companies will
have reduced transportation costs and time, ability to quickly meet the demand and adapt
to the change in the market, and often will have a better understanding about the market.
Similar to countries have colonial relationship after 1945 ( 45COL ), when
countries pairs were common colonizer after 1945 (COMCOL ), they also have
statistically significant on trade flow. The baseline results indicate that these nations will
trade with an additional of 118% ((exp(0.780) – 1) x 100%) (p-value < 0.0001) more than
countries that do not have colonial ties.
58
For nations that were once the same country, there often remain many similarities
in terms of population characteristics, language, culture, and law. Not surprisingly, it is
much easier to trade with those countries that have similar characteristics. In the baseline
model, the SMCTRY variable, which reflects whether two countries were ever the same
country, has statistically significant effect on trade flow which increase trade flow; trade
increased by 41.5% ((exp(0.347) – 1) x 100%) (p-value = 0.0083) over that of otherwise
similar countries who were not once the same country.
Sharing the same language (LANG ) is also an advantage in doing business. If
countries share the same language, they can reduce misunderstanding and
miscommunication in establishing and carrying out business transaction, and can save
cost of translating paper work. As such, sharing a common language will facilitate
information flow between two trading partners, and the result will boost trade. Countries
which share a common language on average experience an increase of trade of 43.6%
((exp(0.362) – 1) x 100%) (p-value < 0.0001) to trade relative to otherwise similar
countries.
When a country is an island, it may make great use of the coastal line to use sea
transportation, which makes it much more convenient to do business with other countries
through their maritime port system. When an importing country is an island nation, its
imports can be expected to increase by 41.2% ((exp(0.345) – 1) x 100%) (p-value =
0.0001) higher than that of non-island importers. Similarly, when an exporter is an island,
the increase in trade is expected to be 20.6% ((exp(0.187) – 1) x 100%) higher (p-value =
0.0001). The increase in trade for island importer is higher than for the island exporter
59
maybe because when an importing country has a coastal line; it may become more
attractive in terms of reducing transportation cost and time compared to non-island
countries. And, of course, when exporting country has a coastal line, they will take
advantage of that to lower their transportation cost which can lead to lower price.
This scenario is inverse when two countries are landlocked – trade will decrease
significantly due to the increase in transportation cost when they have only air, rail and
road transportation which are not cheap. When importing countries are landlocked, trade
will be reduced significantly by 33.8% ((exp(-0.291) – 1) x 100%) (p-value < 0.0001) for
importer, but does not really impact exporter (p-value = 0.2451).
With regard to impact of DIST variable, the more distant the two countries are,
intuitively the less they will trade due to increased transportation cost and time, and other
logistics challenges. As expected, baseline results indicate that distance will have a
negative impact on trade. The impact is not big at all, an increase of one unit of the
natural log of the distance between countries will reduces trade at about 68% ((exp(-
1.138) – 1) x 100%) (p-value < 0.0001).
Finally, the impact of the ratio of ISO 9000 certified firms does have a significant
and positive impact on the export of exporting country. This result is as intuitively
expected and lends support to the benefits of ISO 9000 as an international marketing tool.
The effect of ISO 9000 ratio for importing country, however, contrary to expectation,
however, is not significant (p-value = 0.2097). As ISO 9000 certificate is essentially as a
“passport” to enter some markets. Exporters with ISO 9000 certification will have more
opportunity to increase their exports. As such, the certification ratio is expected increase
60
trade flows significantly. This hypothesis is supported by the baseline results. Findings
indicate that with one unit increase in the natural log of the ratio of ISO 9000 certified
firms, will induce an increase in trade of 29.6% ((exp(0.259) – 1) x 100%) (significant
level of 1%).
2. Results from Alternative Models
Countries vary considerably in their potential capacity to benefit from
international trade. Baseline results suggest nothing about development status because
these measures about development status are not included in this model. Intuitively,
developed countries (DEV) with higher skill in management, advanced technology and
established transportation networks are likely to benefit more than developing (DEVING)
and especially least developed countries (LDC). The question remains, however, whether
when taking into consideration development status, the benefit of ISO 9000 certification
differ across country types. Further and importantly, the question remains whether ISO
9000 certification has provided any benefit to developing and least developed countries
who seek to trade internationally.
The baseline model specification does not allow these questions to be addressed.
This analysis proceeds by exploring alternative model specifications that take into
consideration the development status of trading partners.
a. Model with including Importer and Exporter Economic Status
Taking in consideration the economic status of trading countries allows the
gravity model to offer more specific insight into questions about the real impact of ISO
9000 certification (Table 7). At the first glance, adding economic status for countries
61
brings a different view on the role of ISO 9000 certificate on international trade. The p-
values of the ANOVA of nine models (Model 1.1 to Model 1.9) show that it is
statistically significant (p-value < 0.0001), and offers R-squared results that range from
0.5169 to 0.5198 (compared to that of 0.498 of the baseline model). The R-squared
results show that the model is being used has reduced the variability of the trade flow to
nearly 51.69% to 51.98%. Again, in this specification, most variables in the model have
a significant impact on trade flow; here, however, that somewhat impact differs
depending on the economic status under consideration.
Comparing the impact of GDP on international trade across the nine models, it is
clear that GDP is an important explanatory variable when modeling trade flow;
consistently across models it is observed that the higher a country’s GDP is, the larger the
trade flows. As with the baseline model, however, the exporter’s GDP has more of an
impact on trade than does importer’s GDP. The coefficient estimates for GPD importing
country are from 0.655 to 0.678 (p-value < 0.0001), which means with one unit increase
in the natural log of importer’s GDP, trade will be increased by 92.5% ((exp(0.655) – 1)
x 100%) to 97% ((exp(0.678) – 1) x 100%). While the percentage increase of exporting
countries with one unit increase in the natural log of GDP range from 180% ((exp(1.031)
– 1) x 100%) to 183% ((exp(1.041) – 1) x 100%). (p-value < 0.0001).
Results of dummy variables are similar to those in the baseline model. As
expected, dummy variables about contiguity, common language, colonial ties, same
country, membership in the same RTA, island-nation status exporter all increase trade.
Trade, however, again was found to be reduced when countries are landlocked and
62
located far from each other. For all models, the magnitude of the coefficients of these
variables is similar to that of the baseline model.
With regard to the impact of economic status on trade flows, results are not
completely as expected. From the importer perspective, developed country status does
not significantly affect trade flow. Developing and least developed country status,
however, were found to have a significant impact on trade. More specifically, compared
to the baseline model, developing countries experience an increase in trade (positive
coefficient estimate) relative to those with developed and LDC country status, and those
with least developed country (LDC) status experience a decrease in trade (negative
coefficient estimate) relative to those with developed and developing country status. With
the developing country status, trade will be increased around 10.7% (0.001 < p-value <
0.002), and decreased around 67.5% (p-value < 0.0001) for the least developed country
status.
But when examined from the exporter perspective, compared to the baseline
model, countries with developed status do not impact trade significantly, countries with
LDC status experience a decrease in export (negative coefficient estimates). On average,
this decrease is 90% (p-value < 0.0001). Developed country status, however, reflects
significant increases in trade flow (positive coefficient estimates) with around 7.9%
increase (0.0119 < p-value < 0.0267).
Examining the effect of ISO 9000 certification across the nine models shows that
the ISO 9000 ratio of importing countries do not have significant impact on trade (p-
value > 0.1). From an exporting country’s perspective, a higher ratio of ISO 9000
63
certification is demonstrated to be an advantage for them in international trade. This
result is expected. ISO 9000 certification will help exporting countries meet the
administrative requirements of the importing businesses. Furthermore, implementing ISO
9000 will help exporting countries efficiently survey and better understand their
customers’ needs, and thus bolster their own business activities. Coefficient estimates
range from 0.258 (p-value < 0.0001) to 0.267 (p < 0.0001), reflecting a 29.4% to 30.6%
increase in trade.
Model 1.1 examines the case of a developed country importer and developed
country exporter. Results show from this model that for countries of this status, the ratio
of ISO 9000 of importing countries do not significantly impact trade flow (p-value =
0.1955). However, the result is different for exporting country; ISO 9000 ratio does have
significant impact on trade (coefficient = 0.259, p-value < 0.0001). When exporter with
developed country status, it will cause an increase of 7.9% (p-value = 0.018) in trade.
Model 1.2 examines trade between a developed country importer and developing
country exporter. The developing and developed country status of exporting countries
does not have a statistically significant impact on trade relative to that of other economic
status pairings (p-value = 0.8488 and 0.1283, respectively). Considering the impact of
ISO certification shows that for the exporting country the higher the ISO 9000 ratio, the
larger the flow of trade (coefficient estimate = 0.260, p-value < 0.0001), which is not the
same case for importing country for which the ISO 9000 ratio does not reflect a
statistically significant impact on trade (p-value = 0.1998).
64
Model 1.3 considers trade between country pairs in which the importer is
developed and the exporter is an LDC. Least developed status countries have a significant
lower trade flow than other exporting countries (90%, p-value < 0.0001) whereas
countries with developed status do not significantly impact trade. In this case as well, the
impact of the ISO 9000 ratio is still positive for exporting countries (coefficient estimate
= 0.267, p-value < 0.0001) but not significant for importing countries (p-value = 0.1441).
Model 1.4 examines trade between the country pair of a developing country
importers and developed country exporters. If an exporter has developed country status,
trade flow will be increased 7.3% (p-value <0.0001) and developing country status for
importer results an increase of 10.5% (p-value = 0.002) relative to other economic status
pairings. This could be explained based on the rationale that companies in developed
countries are often assumed to have higher standards of product quality; this perception is
particularly attributed to products from developed countries especially when their
business partner is a country of lower economic rank. When considering ISO 9000
certificate, the reasoning above, however, makes the impact of ISO 9000 certification on
trade not clear. A higher ratio of ISO 9000 certification leads to a higher trade to
exporters (which is developed, coefficient = 0.259, p-value <0.0001) but does not
significantly impact trade of importer (which is developing, p-value = 0.2087).
Model 1.5 explores the case when two developing countries trade with each other.
Specifically, if an exporter is a developing country, that will have no significant impact
on trade (p-value = 0.9618). For developing country importers, it will increase trade by
11.2% (p-value = 0.001) relative to other economic status country pairs. An increase in
65
the ratio of ISO certificates for developing exporters will increase trade remarkably
(0.259, p-value < 0.0001), and does not have significant impact trade of developing
country importers (p-value = 0.2146).
Model 1.6 examines trade between a developing country importer and an LDC
exporter. Developing country status leads to an increase in importer trade flow of 10.7%
(p-value = 0.0015) and a decrease of 90% in that of the exporter (p-value < 0.0001). For
developing – LDC trade, the role of ISO 9000 certificate is still positive and significant
for exporting country, and not significant for importing country (p-value = 0.1499).
Export will be increased with an increase in the ratio of ISO 9000 certification for
developing exporter (0.267, p-value = 0.0015).
In model 1.7, the exporting country is developed, and importing country is a least
developed country. Results are that the trade imported by the LDC will decrease trade by
67.5% (p-value < 0.0001), while developed country exporters will increase trade by 8.3%
(p-value < 0.0119) compared to other economic status country pairs. When an exporting
country is Developed, ISO 9000 certification will have large and positive impact on trade
(coefficient estimate = 0.258, p-value < 0.0001). From the LDC importing country
perspective, ISO 9000 certification does not have a significantly affect on trade (p-value
= 0.6014). The explanation for this is when exporting countries are developed; they are
associated with ‘high quality’ status, which makes them easy to do business with abroad.
Therefore, higher ratio of ISO 9000 will lead to higher exports to developed country
exporter and less trade to importer as a least developed country.
66
Model 1.8 investigates the trade relationship between LDC importers and
developing country exporters. Results shows that for developing country exporters,
exports will not be significantly affected (p-value = 0.7137). The status of least
developed countries will decrease their trade by 67.5% (p-value < 0.0001). From a
developing country exporter perspective, an increase in ISO 9000 ratio will lead to an
increase in exports (0.258, p-value <0.0001), while it does not significantly impact trade
of importer (p-value = 0.6124)
Model 1.9 gives a very different result compared with the baseline model.
Through this model, it is apparent that least developed country status of two trading
countries will not increase trade, and, in fact, was found to decrease it considerably;
relative to 66.5% trade flow by LDC importing country (p-value < 0.0001), 90% of LDC
exporting country (p-value < 0.0001). For a unit increase in the ratio of ISO 9000
certification, exporters would have chances to increase export significantly by 30% (p-
value < 0.0001) and does not have significant impact on importers (p-value = 0.4716).
Using this approach of adding economic status into the model seems not to
support the hypothesis. ISO 9000 certification does not have a significant impact on
importer and have a positive and significant impact on exporter, as well as the impact of
ISO 9000 certification on different economic status is not clear. This approach generates
an ambiguous picture about the real impact of both ISO 9000 certification as well as the
economic status on the value of trade flows of a trading country. It appears that separately
considering the impact of the ISO 9000 ratio and economic status does not adequately
67
address the likely interplay between these impacts. As such, an alternative model
specification which jointly considers the impact of these factors is explored.
b. Model with interaction between the ISO 9000 Ratio and Country Economic status
Findings from Model 1.1 to 1.9 raise the question as to whether or not it is
necessary to include economic status into an analytical consideration of the impact of
ISO 9000 on trade. The question is not fully answered because adding variables of ISO
9000 certification and economic status separately into the model does not seem to bring
the actual picture that the hypotheses seek to test about the impact of ISO 9000 certificate
given a country’s economic status. As such, this analysis proceeds by reexamining trade
between these nine country pairs by instead including a term that reflects the interaction
between a country’s development status and their relative use of ISO 9000.
For all models variants which were examined, the p-value of the ANOVA (Table
8) shows that they are statistically significant (p-value < 0.0001), R-squares are around
0.488 which means using the model, the variability of the trade flow is reduced 48.8%.
Comparing these results given to those generates by the first approach (Model 1.1 – 1.9),
second approach portrays a very different picture about the joint impact of ISO 9000
certification and economic status.
Constant with earlier models, these alternative specifications find that GDP is still
one of the main variables that can be used to predict the approximate trade flow between
two countries. The impact on trade of GDP on importing countries is similar in each of
nine model specifications. Coefficient estimates on the importing country GDP range
68
from 0.648 to 0.673 (p-value < 0.0001). These values are much lower than those for the
exporting country GDP which range from 1.015 to 1.120 (p-value < 0.0001).
With regard to other independent variables, several dummy variables have
positive and significant affect on trade for each of the three approaches: contingency,
same language, colonial tie, same country, party to the same RTA, island nation. All of
them have a significant effect in increasing trade flow. As usual and as expected, distance
has a negative impact on trade.
Another difference in the model results is the impact if of geographic location has
on trading countries. For landlocked importing countries, the location will impede trade
approximately 26% (coefficient ranges from -0.284 to 0.304, p-value < 0.0001). While
for exporting countries, however, landlocked country status does not appear to be a big
problem to trade, it still increases international trade by nearly 11.6% (coefficient range
from 0.099 to 0.132, p-value < 0.05).
For most of the cases, the coefficient and the p-value of the interaction of the ISO
9000 certification ratio and the country’s economic development status indicates a
significant and positive interaction affect on trade flow. While the specific magnitude
differs for each different status, statistically results show that LDCs with higher level of
ISO certification will benefit from trade more than developing countries and developed
countries. From the importer’s perspective, the coefficient estimates for the interaction of
ratio of ISO 9000 with least developed, developing and developed countries are around
0.136, 0.016, 0.022 (significant at level of 5%), respectively. From the exporter’s
perspective, the coefficient estimates are around 0.091, 0.126, 0.281, respectively
69
(significant at level of 1%). This result supports the hypotheses above concerning the
significant and positive impact of ISO 9000 certification on trade flows, and specifically
exports from one country to another as well as the different magnitude of impact for
different countries that have different economic status.
The picture is much clearer when investigating each individual model
specification with different interaction of ratio of ISO 9000 and economic status.
Model 2.1 considers the trading relationship between two developed countries. As
expected, when considering trade between developed, the interaction between the ISO
9000 ratio and the developed economic status reflects a positive, significant impact on
trade flow. The higher the ratio of ISO 9000 certificate each developed country has, the
more trade they will create between them. The coefficient estimate for the interaction is
0.091 (p-value < 0.0001) for exporter and 0.038 (p-value < 0.0001) for importer. The
effect, however, is not big. For exporting country, one unit increase in ISO 9000 ratio
will lead to 9.5% increase in export. Same for importing countries, the percentage
increase in trade will be 3.8% (p-value = 0.0395).
Model 2.2 considers the circumstance where the developed country is an
importer, and the exporter is developing country. In this situation, given the developed
status of importer, its interaction with ratio of ISO 9000 certification shows a positive and
significant impact on trade flow (p-value = 0.0120), similarly, the interaction of
R-square 0.5169 0.5170 0.5169 0.5190 0.5171 0.5170 0.5191 0.5178 0.5177 0.5198 * significant at 1%, ** significant at 5%, *** significant at 10% t-statistic in parentheses dependent variable is natural log of real (1990) bilateral flows between two countries in industry k in 2004
86
Table 8: Gravity Equation Coefficient Estimate for Model with Interaction between Ratio of Number of ISO Certificate to Number of Firm Count and Economic Status
Variable Model 1 Model 2.1 Model 2.2 Model 2.3 Model 2.4 Model 2.5 Model 2.6 Model 2.7 Model 2.8 Model 2.9
Importer BASELINE
DEV DEV DEV DEVING DEVING DEVING LDC LDC LDC
Exporter DEV DEVING LDC DEV DEVING LDC DEV DEVING LDC
R-square 0.5169 0.5066 0.5085 0.5053 0.5063 0.5085 0.5051 0.5064 0.5085 0.5051 * significant at 1%, ** significant at 5%, *** significant at 10% t-statistic in parentheses dependent variable is natural log of real (1990) bilateral flows between two countries in industry k in 2004
89
VI. REFERENCES
Amable, B.and Verspagen, B. (1995). The Role of Technology in Market Shares Dynamics.
Applied Economics, 27,197-204
Anderson, E. J.and Wincoop, V. E. (2003). Gravity with Gravitas: A Solution to the Border Puzzle.
The American Economic Review, 93(1),170-92
Baier, L. S.and Bergstrand, H. J. (2006). Do Free Trade Agreements Actually Increase Members'
International Trade? Journal of International Economics, 71(1),72-95
Balolgun, E. D. (2008). An Empirical Test of Trade Gravity Model Criteria for the West African
Monetary Zone (pp. 24): Munich Personal RePEc Archive.
Bayati, A.and Taghavi, A. (2007). The Impacts of Acquiring ISO 9000 Certification on the
Performance of SMEs in Tehran. The TQM Magazine, 19(2),140-49