Assessing Intervention Fidelity in RCTs: Concepts and Methods Panelists: David S. Cordray, PhD Chris Hulleman, PhD Joy Lesnick, PhD Vanderbilt University Presentation for the IES Research Conference Washington, DC June 12, 2008
Transcript
Assessing Intervention Fidelity in RCTs: Concepts and Methods
Panelists:David S. Cordray, PhDChris Hulleman, PhD
Joy Lesnick, PhDVanderbilt University
Presentation for the IES Research ConferenceWashington, DC
June 12, 2008
Overview
• Session planned as an integrated set of presentations• We’ll begin with:
– Definitions and distinctions; – Conceptual foundation for assessing fidelity in RCTs, a special
case.
• Two examples of assessing implementation fidelity:– Chris Hulleman will illustrate an assessment for an intervention
with a single core component– Joy Lesnick illustrates additional consideration when fidelity
assessment is applied to intervention models with multiple program components.
• Issues for the future• Questions and discussion
Definitions and Distinctions
Dimensions Intervention Fidelity
• Little consensus on what is meant by the term “intervention fidelity”.
• But Dane & Schneider (1998) identify 5 aspects:– Adherence/compliance– program components are
delivered/used/received, as prescribed;– Exposure – amount of program content
delivered/received by participants;– Quality of the delivery – theory-based ideal in terms of
processes and content;– Participant responsiveness – engagement of the
participants; and – Program differentiation – unique features of the
intervention are distinguishable from other programs (including the counterfactual)
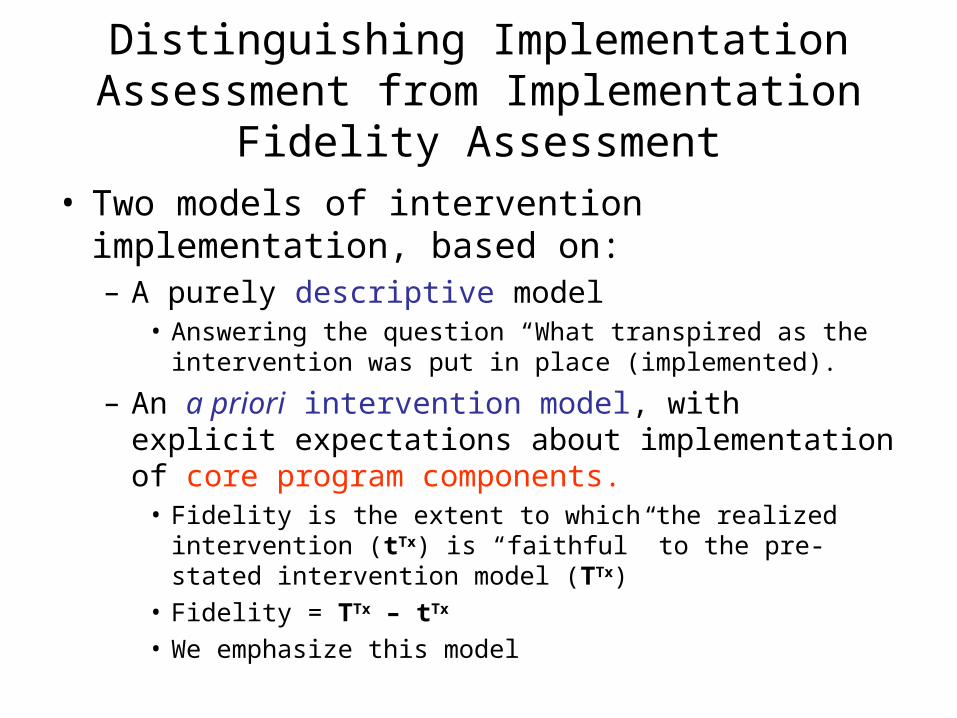
Distinguishing Implementation Assessment from Implementation Fidelity Assessment
• Two models of intervention implementation, based on:– A purely descriptive model
• Answering the question “What transpired as the intervention was put in place (implemented).
– An a priori intervention model, with explicit expectations about implementation of core program components.
• Fidelity is the extent to which the realized intervention (tTx) is “faithful” to the pre-stated intervention model (TTx)
• Fidelity = TTx – tTx
• We emphasize this model
What to Measure?
• Adherence to the intervention model:– (1) Essential or core components (activities,
processes);– (2) Necessary, but not unique to the theory/model,
activities, processes and structures (supporting the essential components of T); and
– (3) Ordinary features of the setting (shared with the counterfactual groups (C)
• Essential/core and Necessary components are priority parts of fidelity assessment.
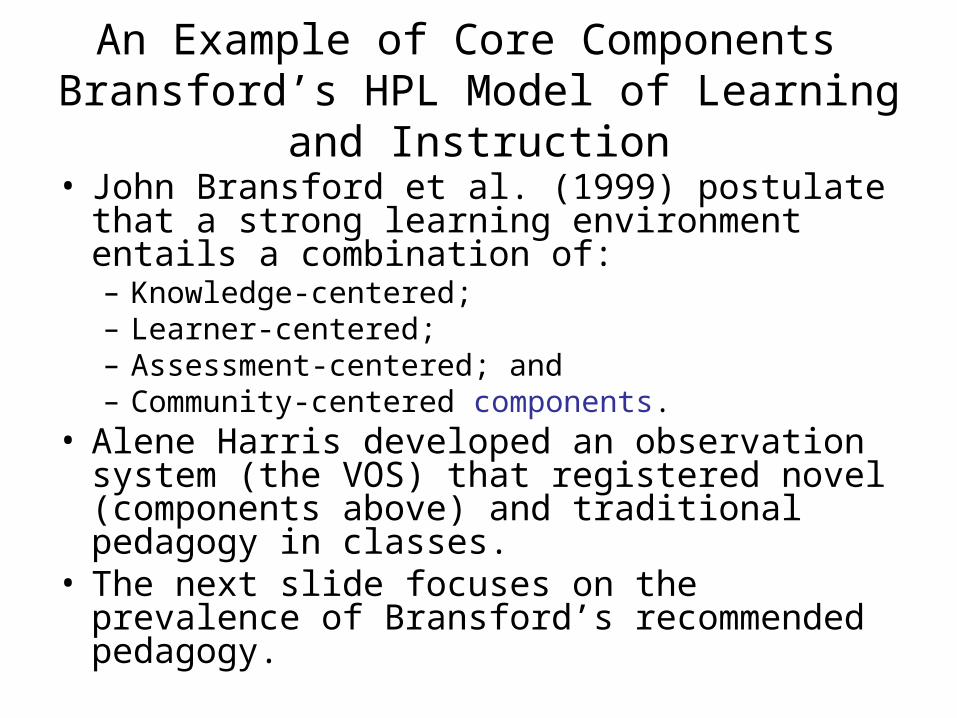
An Example of Core Components” Bransford’s HPL Model of Learning and
Instruction• John Bransford et al. (1999) postulate that a
• Alene Harris developed an observation system (the VOS) that registered novel (components above) and traditional pedagogy in classes.
• The next slide focuses on the prevalence of Bransford’s recommended pedagogy.
Challenge-based Instruction in “Treatment” and Control Courses: The VaNTH Observation System (VOS)
0
5
10
15
20
25
30
35
Year 2 Year 3 Year 4
Control
Treatment
Percentage of Course Time Using Challenge-based Instructional Strategies
Adapted from Cox & Cordray, in press
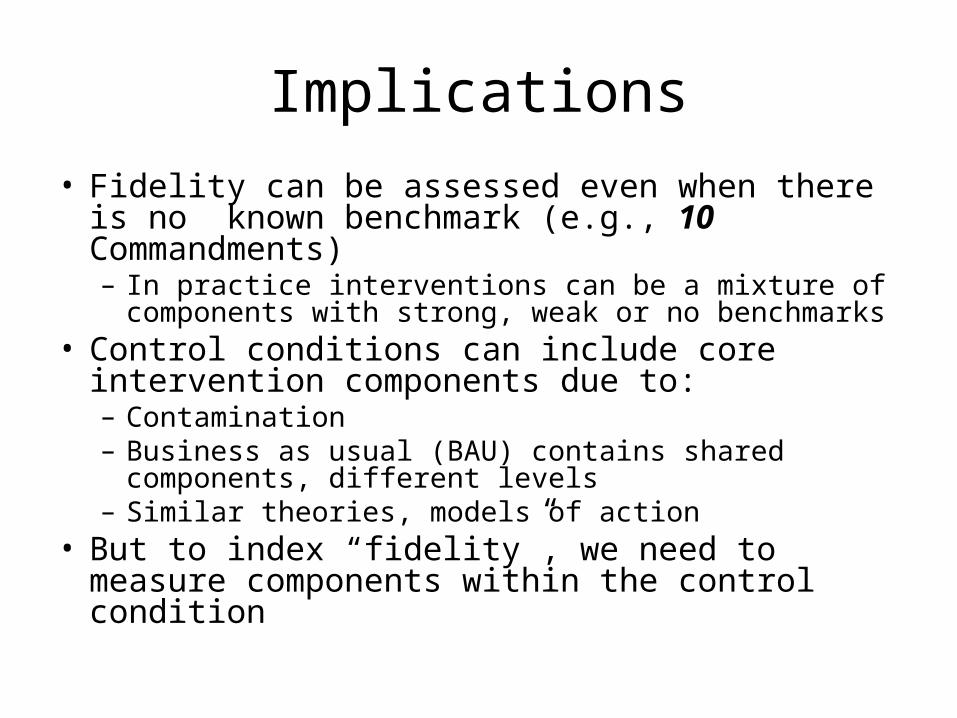
Implications
• Fidelity can be assessed even when there is no known benchmark (e.g., 10 Commandments)– In practice interventions can be a mixture of
components with strong, weak or no benchmarks• Control conditions can include core intervention
components due to:– Contamination– Business as usual (BAU) contains shared
components, different levels – Similar theories, models of action
• But to index “fidelity”, we need to measure components within the control condition
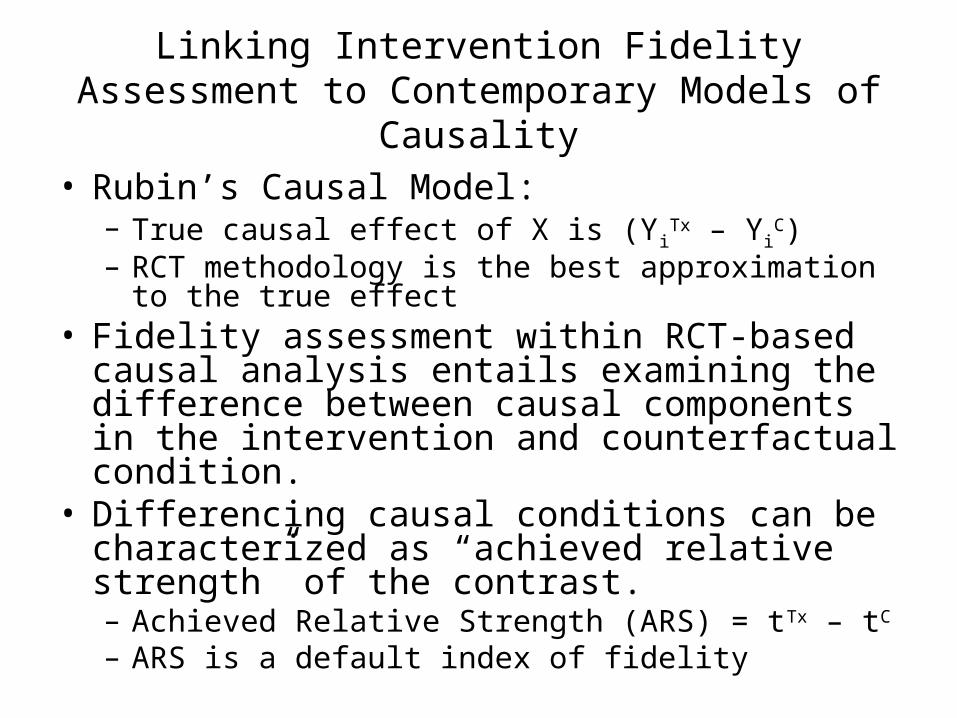
Linking Intervention Fidelity Assessment to Contemporary Models of Causality
• Rubin’s Causal Model:– True causal effect of X is (Yi
Tx – YiC)
– RCT methodology is the best approximation to the true effect
• Fidelity assessment within RCT-based causal analysis entails examining the difference between causal components in the intervention and counterfactual condition.
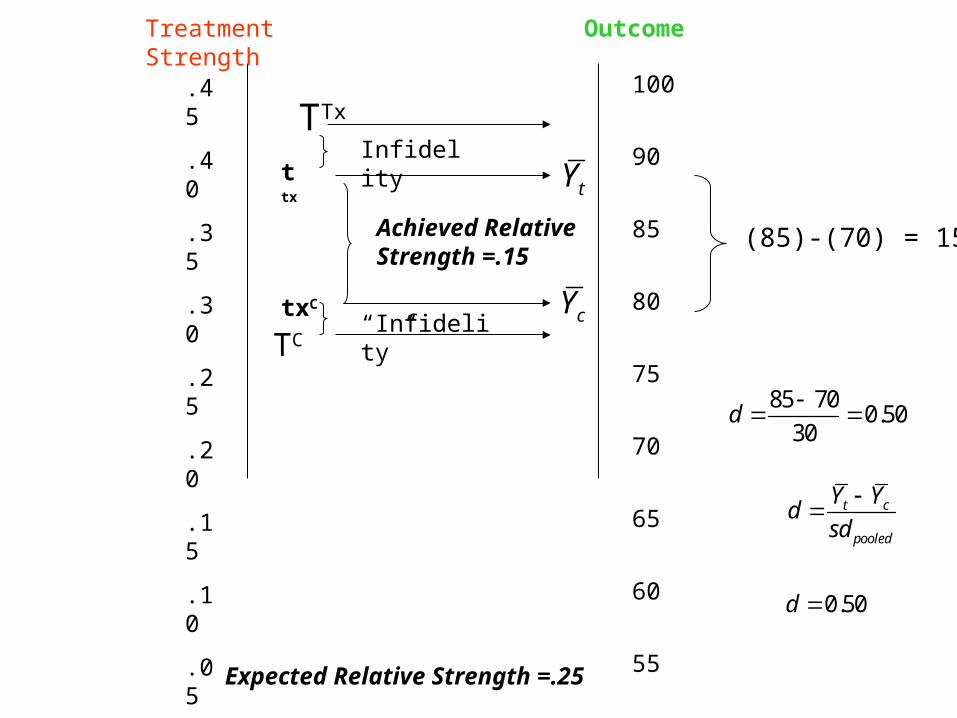
• Differencing causal conditions can be characterized as “achieved relative strength” of the contrast. – Achieved Relative Strength (ARS) = tTx – tC
– ARS is a default index of fidelity
Achieved Relative Strength =.15
100
90
85
80
75
70
65
60
55
50
Outcome
Infidelity
“Infidelity”
TTx
TC
0.50d
85 700.50
30d
t c
pooled
Y Yd
sd
.45
.40
.35
.30
.25
.20
.15
.10
.05
.00
Treatment Strength
(85)-(70) = 15
txC
t tx
cY
tY
Expected Relative Strength =.25
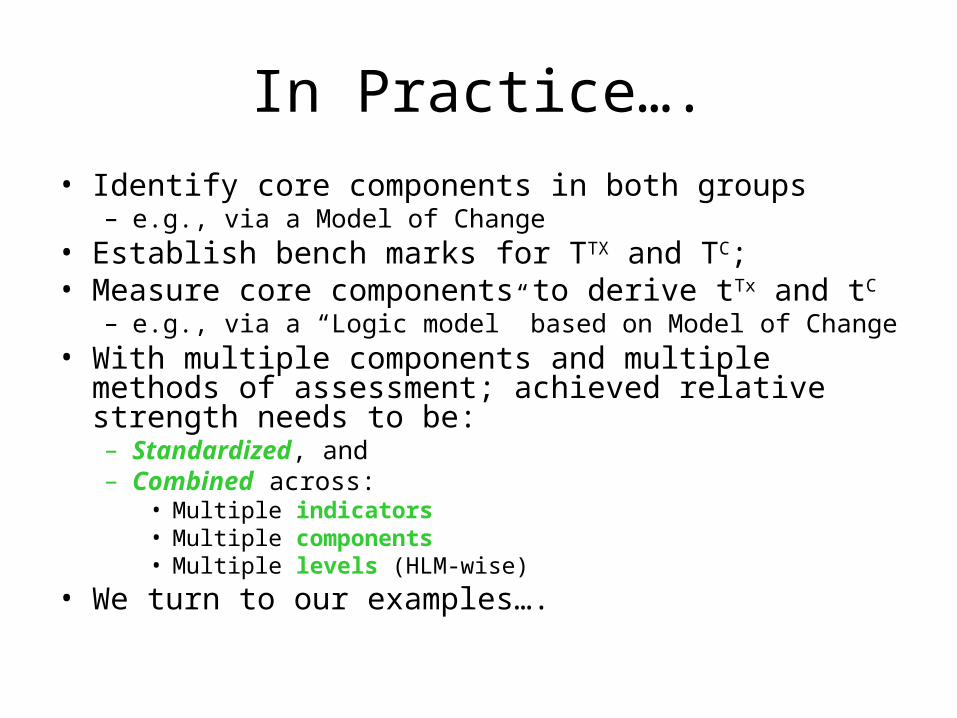
In Practice….
• Identify core components in both groups– e.g., via a Model of Change
• Establish bench marks for TTX and TC;• Measure core components to derive tTx and tC
– e.g., via a “Logic model” based on Model of Change• With multiple components and multiple methods of
assessment; achieved relative strength needs to be: – Standardized, and – Combined across:
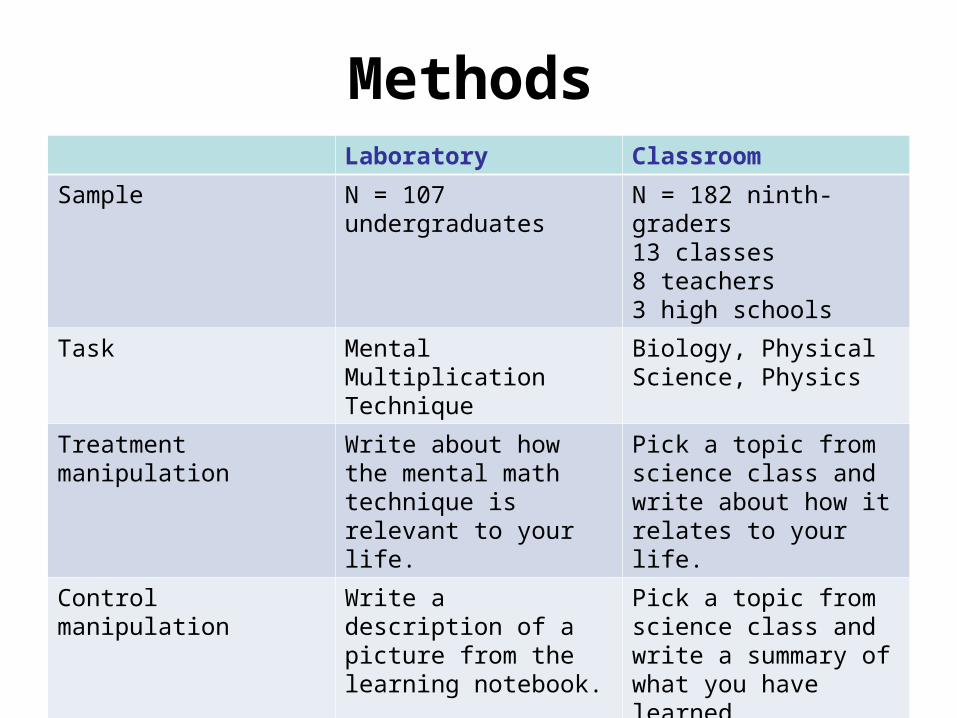
Sample N = 107 undergraduates N = 182 ninth-graders13 classes8 teachers 3 high schools
Task Mental Multiplication Technique
Biology, Physical Science, Physics
Treatment manipulation Write about how the mental math technique is relevant to your life.
Pick a topic from science class and write about how it relates to your life.
Control manipulation Write a description of a picture from the learning notebook.
Pick a topic from science class and write a summary of what you have learned.
Number of manipulations 1 2 – 8
Length of Study 1 hour 1 semester
Dependent Variable Perceived Utility Value
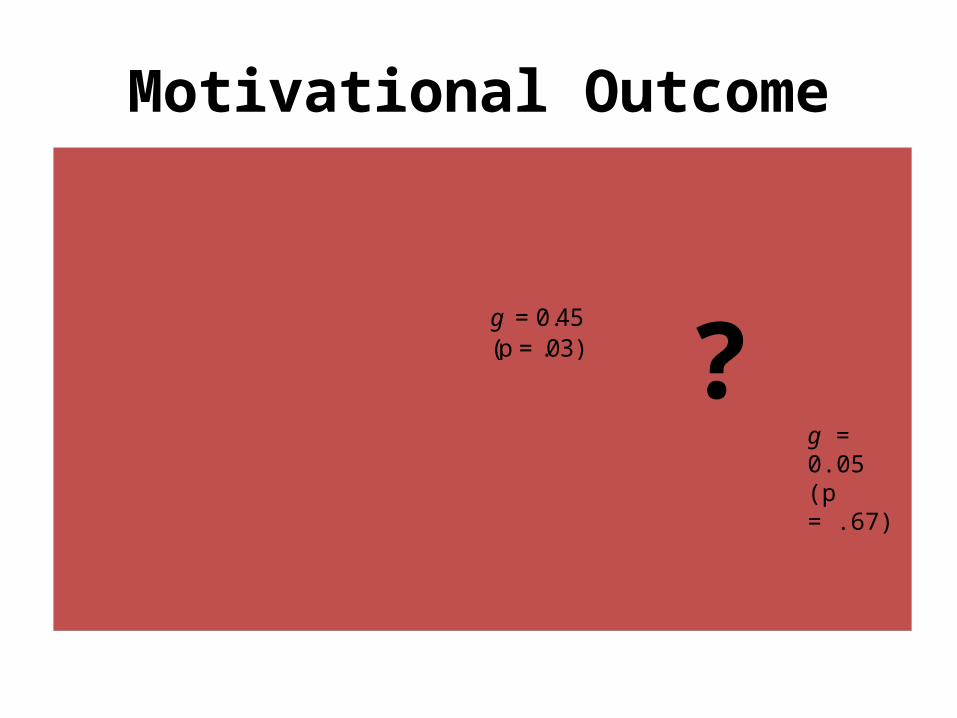
Motivational Outcome
4.78
3.56
5.28
3.62
3
4
5
6
L ab C lassroom
Per
ceiv
ed U
tility
V
alue
C ontrol T reatment
g = 0.45 (p = .03)
g = 0.05 (p = .67)
?
Fidelity Measurement and Achieved Relative Strength
• Simple intervention – one core component
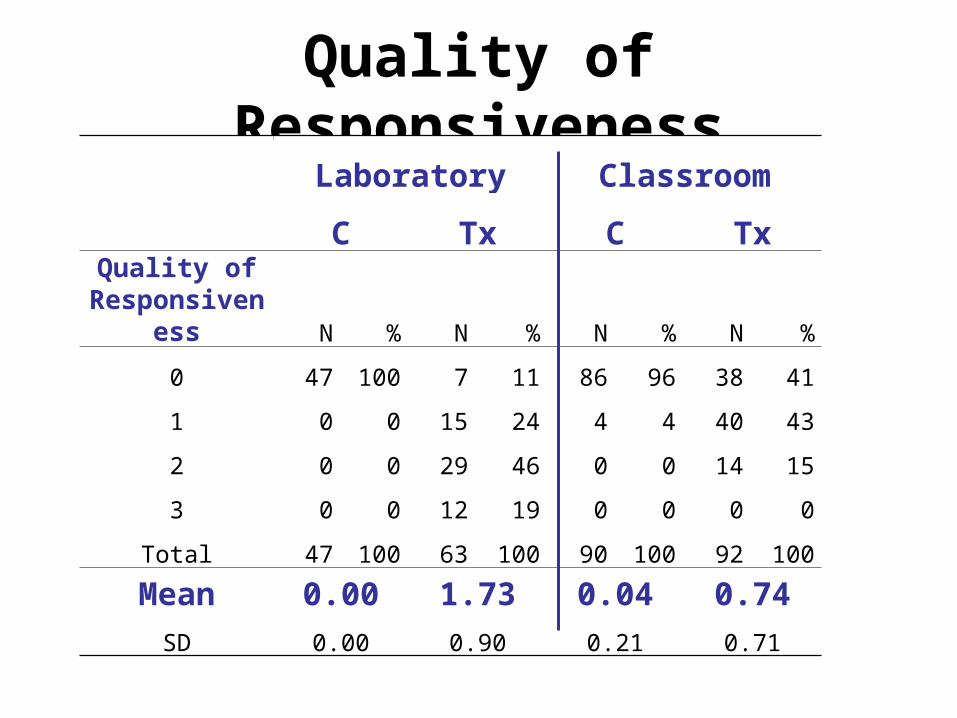
• Intervention fidelity: – Defined as “quality of participant
responsiveness”– Rated on scale from 0 (none) to 3 (high)– 2 independent raters, 88% agreement
Quality of Responsiveness Laboratory Classroom
C Tx C Tx
Quality of Responsiveness N % N % N % N %
0 47 100 7 11 86 96 38 41
1 0 0 15 24 4 4 40 43
2 0 0 29 46 0 0 14 15
3 0 0 12 19 0 0 0 0
Total 47 100 63 100 90 100 92 100
Mean 0.00 1.73 0.04 0.74
SD 0.00 0.90 0.21 0.71
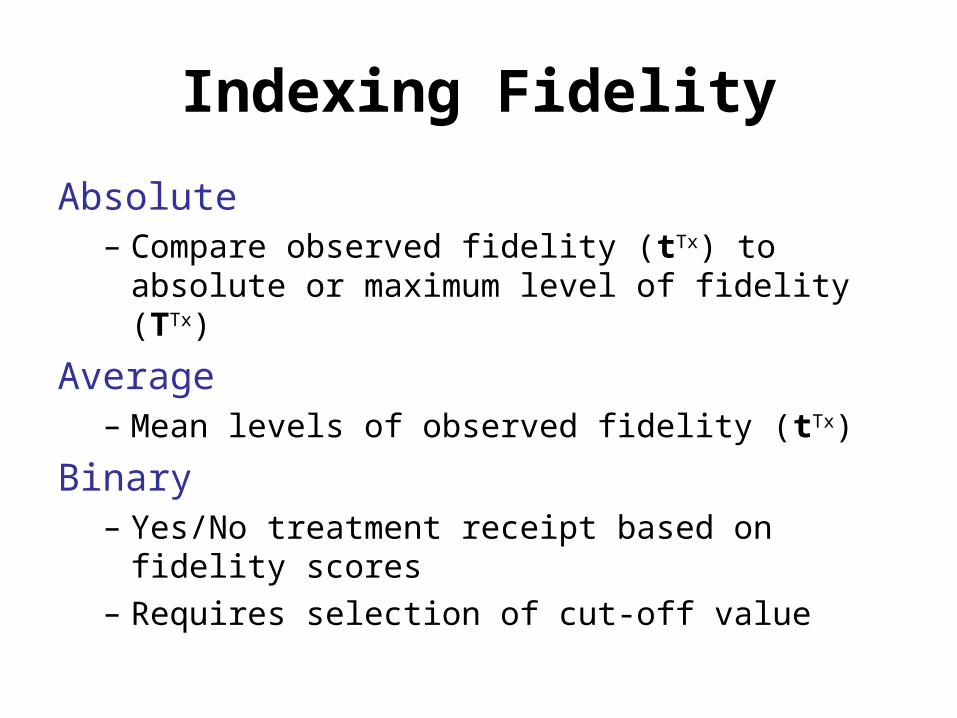
Indexing Fidelity
Absolute– Compare observed fidelity (tTx) to absolute or
maximum level of fidelity (TTx)
Average– Mean levels of observed fidelity (tTx)
Binary– Yes/No treatment receipt based on fidelity scores
– Requires selection of cut-off value
Fidelity IndicesConceptual Laboratory Classroom
Absolute Tx
C
Average Tx 1.73 0.74
C 0.00 0.04
Binary Tx
C
1.73100
3.00 58%
0.00100
3.00 0%
0.74100
3.00 25%
0.04100
3.00 1%
100 Tx TxTx
X t
T
Tx = TxXt
=CCXt
TxTx t
Tx
nt
n
TxC c
C
nt
n
41
630.65
14
920.15
0
470.00
0
900.00
100 C CC
X t
T
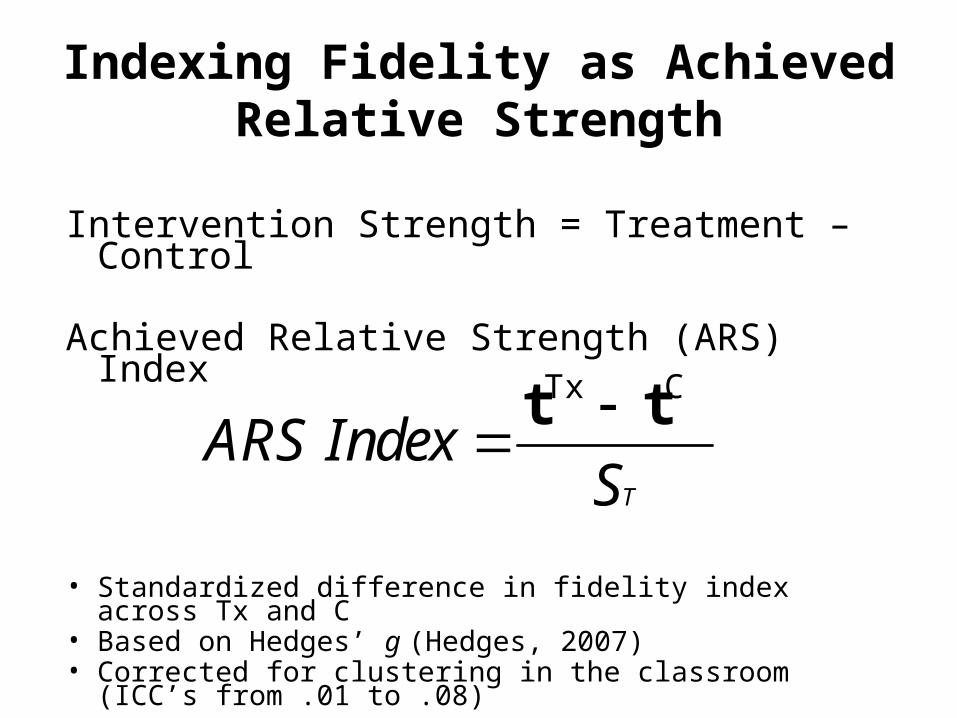
Indexing Fidelity as Achieved Relative Strength
Intervention Strength = Treatment – Control
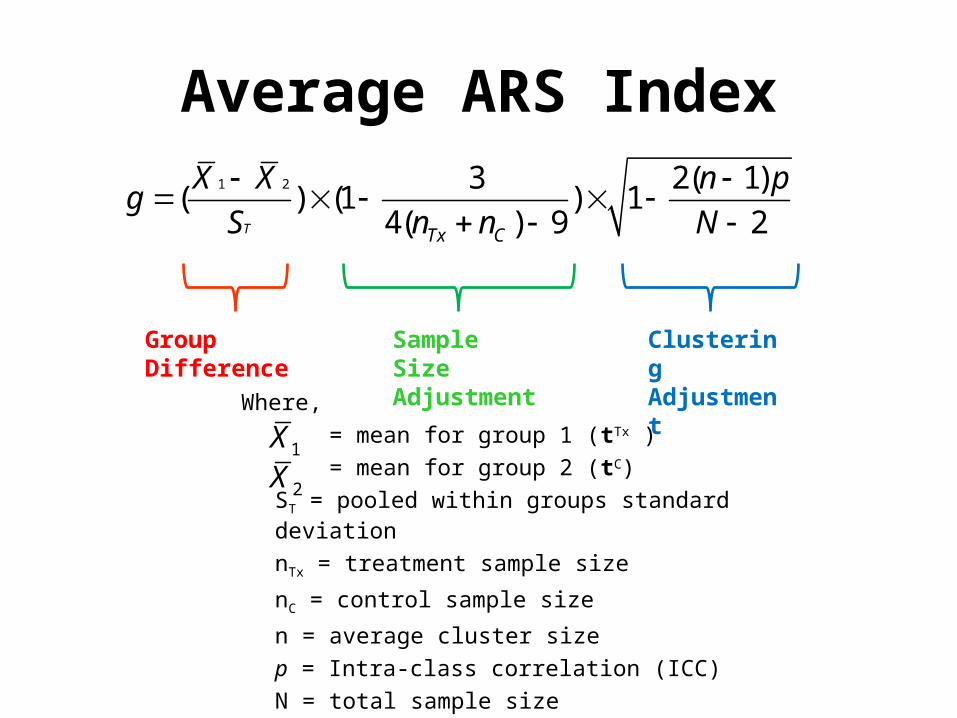
Achieved Relative Strength (ARS) Index
• Standardized difference in fidelity index across Tx and C• Based on Hedges’ g (Hedges, 2007)• Corrected for clustering in the classroom (ICC’s from .01
to .08)
Tx C
T
ARS IndexS
t t
Average ARS Index
Where,
= mean for group 1 (tTx )
= mean for group 2 (tC)
ST = pooled within groups standard deviation
nTx = treatment sample size
nC = control sample size
n = average cluster size
p = Intra-class correlation (ICC)
N = total sample size
1 2 3 2( 1)( ) (1 ) 1
4( ) 9 2T Tx C
X X n pg
S n n N
1X
2X
Group Difference Sample Size Adjustment
Clustering Adjustment
Absolute and Binary ARS Indices
Where, pTx = proportion for the treatment group (tTx )pC = proportion for the control group (tC)
nTx = treatment sample size
nC = control sample sizen = average cluster sizep = Intra-class correlation (ICC)N = total sample size
3 2( 1)2*arcsin ( ) 2*arcsin ( ) (1 ) 1
4( ) 9 2Tx C
Tx C
n pg p p
n n N
Group Difference Sample Size Adjustment
Clustering Adjustment
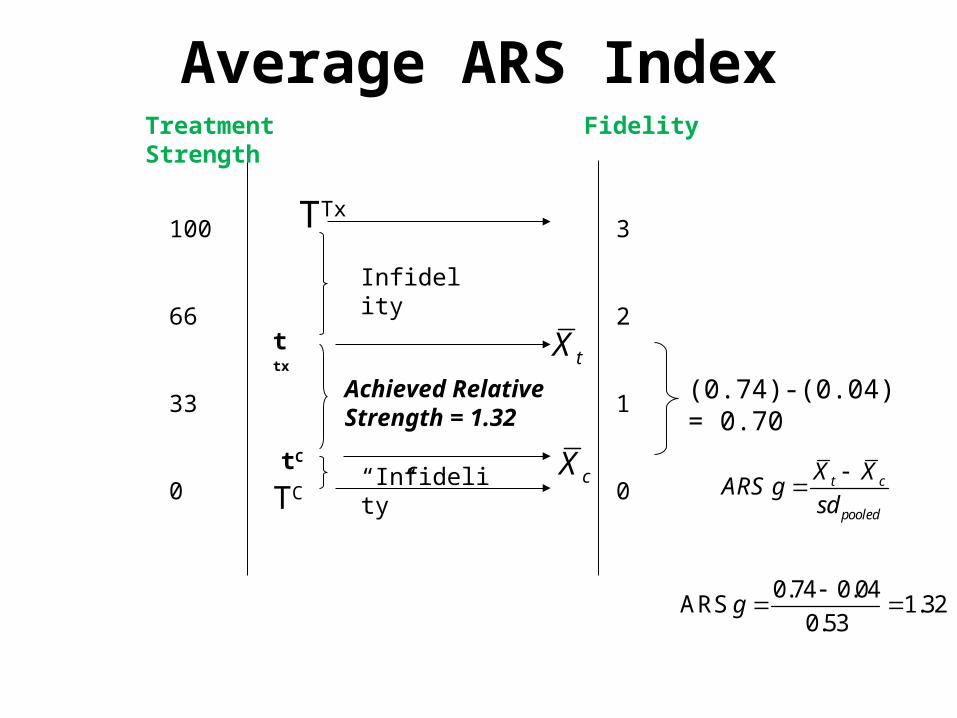
Achieved Relative Strength = 1.32
Fidelity
Infidelity
“Infidelity”
TTx
TC
0.74 0.04ARS 1.32
0.53g
t c
pooled
X XARS g
sd
100
66
33
0
Treatment Strength
tC
t tx
cX
tX
3
2
1
0
Average ARS Index
(0.74)-(0.04) = 0.70
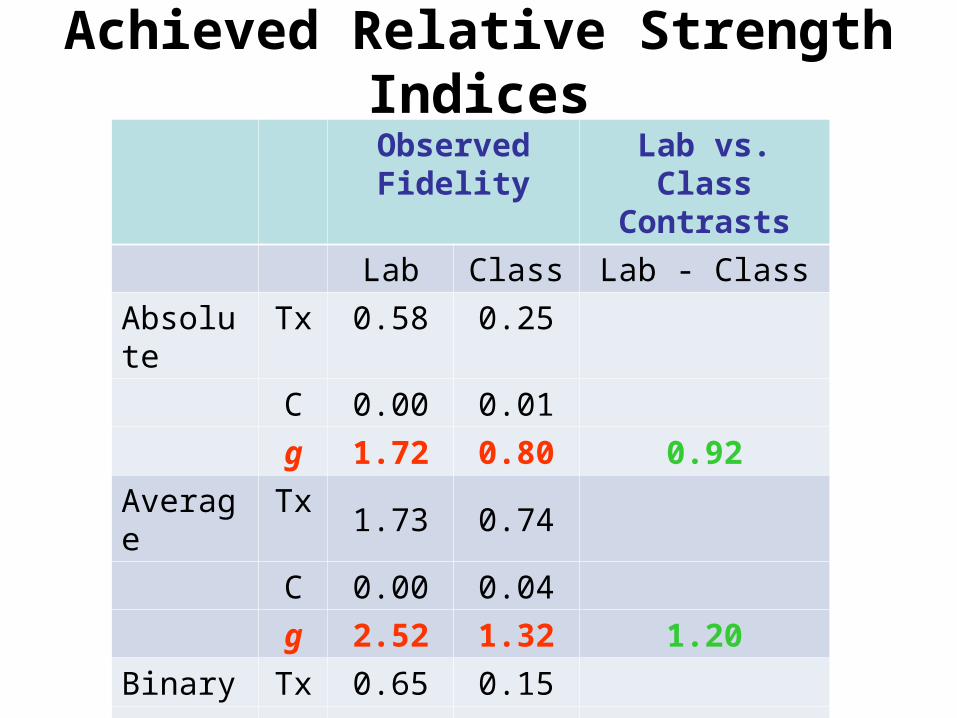
Achieved Relative Strength Indices
Observed Fidelity
Lab vs. Class Contrasts
Lab Class Lab - Class
Absolute Tx 0.58 0.25
C 0.00 0.01
g 1.72 0.80 0.92
Average Tx 1.73 0.74
C 0.00 0.04
g 2.52 1.32 1.20
Binary Tx 0.65 0.15
C 0.00 0.00
g 1.88 0.80 1.08
Linking Achieved Relative Strength to Outcomes
Sources of Infidelity in the Classroom
Student behaviors were nested within teacher behaviors
• Teacher dosage• Frequency of responsiveness
Student and teacher behaviors were used to predict treatment fidelity (i.e., quality of responsiveness).
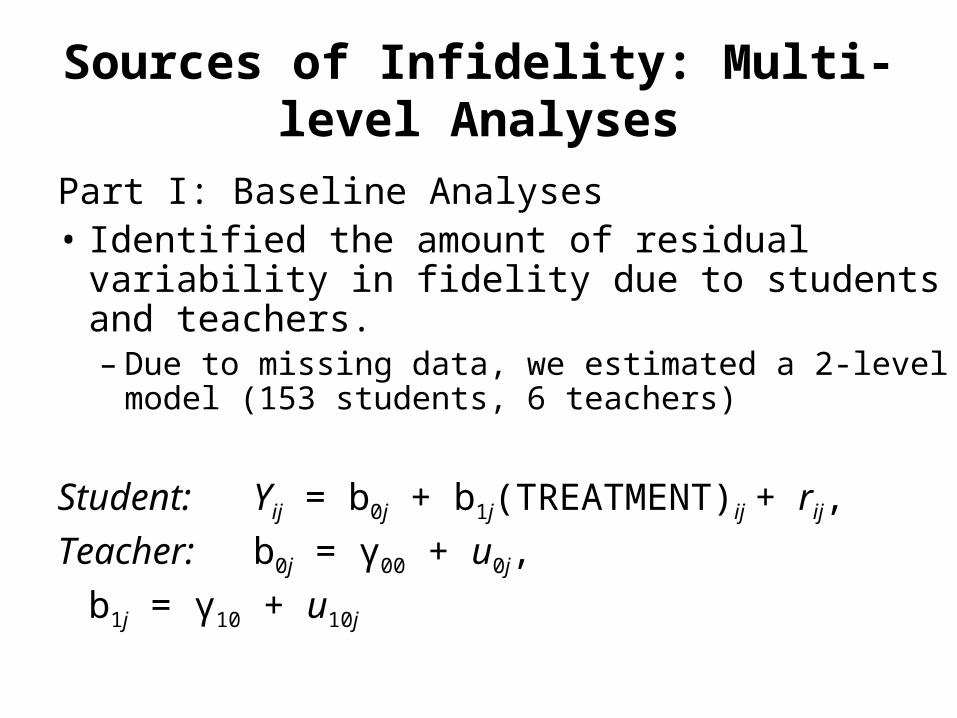
Sources of Infidelity: Multi-level Analyses
Part I: Baseline Analyses• Identified the amount of residual variability in
fidelity due to students and teachers.– Due to missing data, we estimated a 2-level
model (153 students, 6 teachers)
Student: Yij = b0j + b1j(TREATMENT)ij + rij,
Teacher: b0j = γ00 + u0j,
b1j = γ10 + u10j
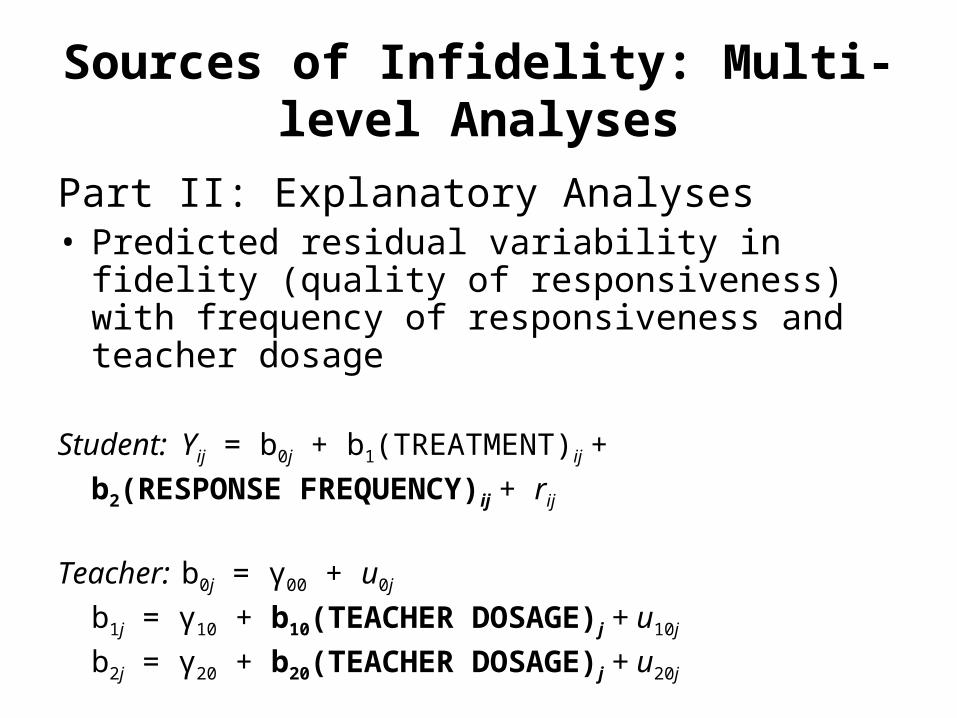
Sources of Infidelity: Multi-level Analyses
Part II: Explanatory Analyses• Predicted residual variability in fidelity (quality of
responsiveness) with frequency of responsiveness and teacher dosage
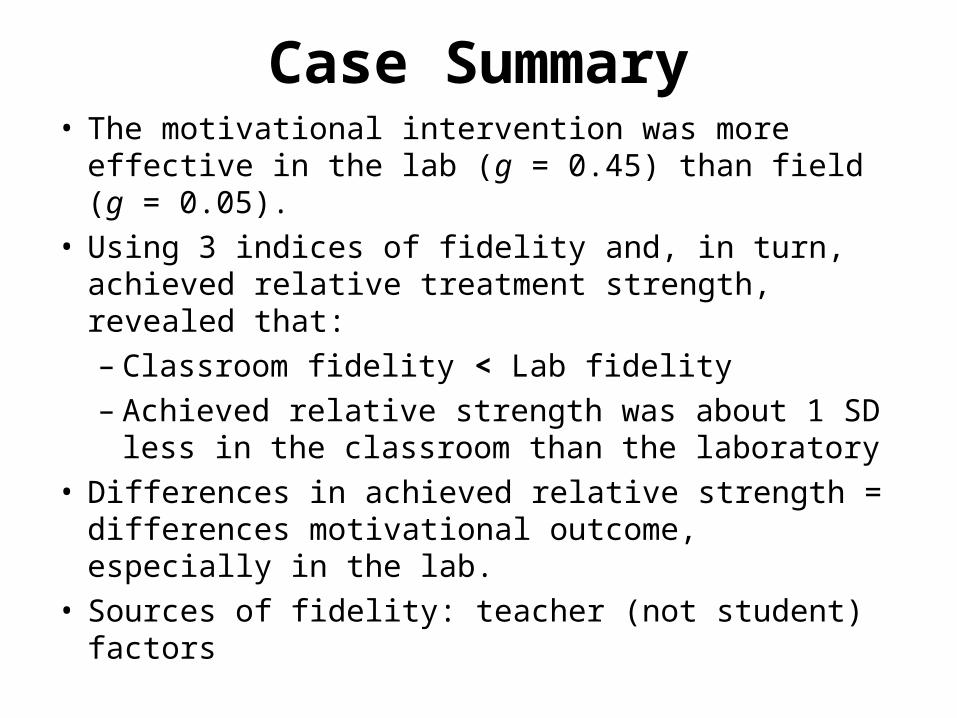
Case Summary• The motivational intervention was more effective
in the lab (g = 0.45) than field (g = 0.05).• Using 3 indices of fidelity and, in turn, achieved
relative treatment strength, revealed that:– Classroom fidelity < Lab fidelity– Achieved relative strength was about 1 SD
less in the classroom than the laboratory• Differences in achieved relative strength =
differences motivational outcome, especially in the lab.
• Sources of fidelity: teacher (not student) factors
Joy Lesnick
Assessing Fidelity of Interventions with Multiple Components: A Case of Assessing Preschool Interventions
33
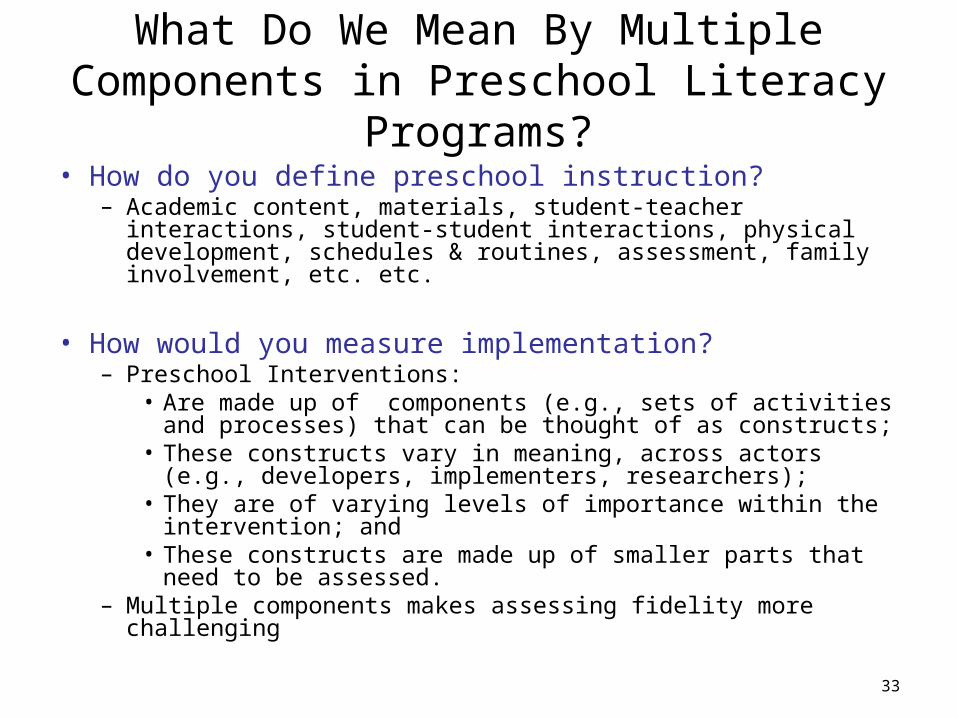
What Do We Mean By Multiple Components in Preschool Literacy Programs?
• How do you define preschool instruction?– Academic content, materials, student-teacher interactions,
student-student interactions, physical development, schedules & routines, assessment, family involvement, etc. etc.
• How would you measure implementation?– Preschool Interventions:
• Are made up of components (e.g., sets of activities and processes) that can be thought of as constructs;
• These constructs vary in meaning, across actors (e.g., developers, implementers, researchers);
• They are of varying levels of importance within the intervention; and
• These constructs are made up of smaller parts that need to be assessed.
– Multiple components makes assessing fidelity more challenging
34
Overview• Four areas of consideration when assessing
fidelity of programs with multiple components:1. Specifying Multiple Components2. Major Variations in Program Components3. The ABCs of Item and Scale Construction4. Aggregating Indices
• One caveat: Very unusual circumstances
• Goal of this work:– To build on the extensive evaluation work that had
already been completed and use the case study to provide a framework for future efforts to measure fidelity of implementation.
35
1. Specifying Multiple Components
Our Process• Extensive review of program materials
• Potentially hundreds of components
• How many indicators do we need to assess fidelity?
36
1. Specifying Multiple Components
Interactions between teacher and child
Physical Environment
Routines and classroom management
Instruction
Assessment
Family Involvement
Materials
Content
Processes
Social & Personal Development
Healthful Living
Scientific Thinking
Social Studies
Creative Arts
Physical Development
Technology
Math
Literacy
Structured lessons
Structured units
Letter and word recognition
Book and print awareness
Phonemic awareness
Language, comprehension, response to text
Oral Language
1234123412341234
1234
Writing
1234
Constructs Sub-Constructs Facets Elements Indicators
37
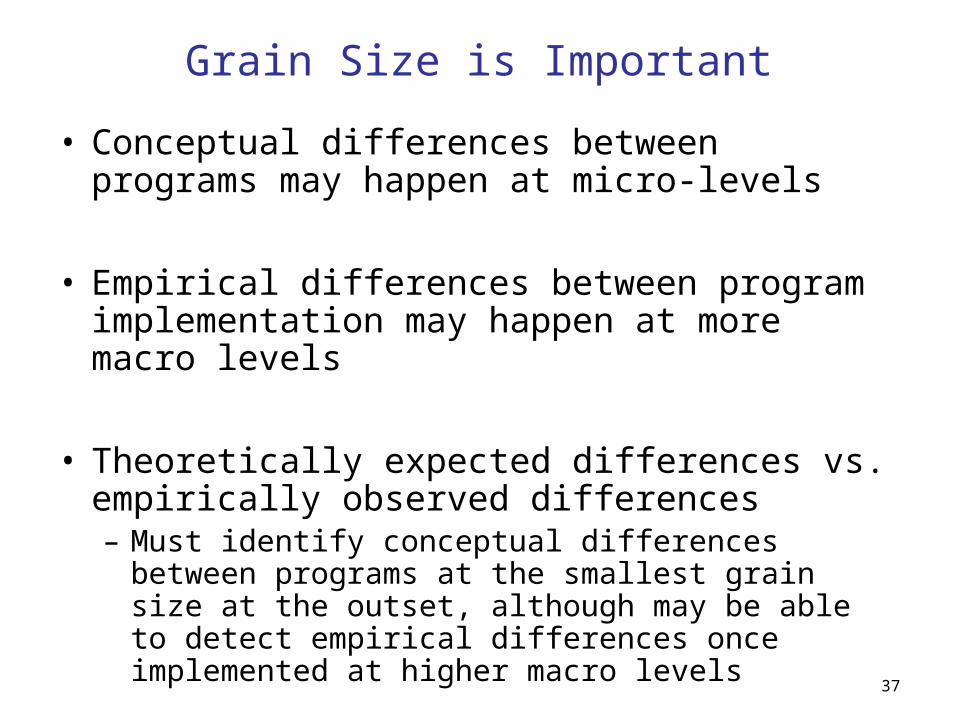
• Conceptual differences between programs may happen at micro-levels
• Empirical differences between program implementation may happen at more macro levels
• Theoretically expected differences vs. empirically observed differences– Must identify conceptual differences between
programs at the smallest grain size at the outset, although may be able to detect empirical differences once implemented at higher macro levels
Grain Size is Important
38
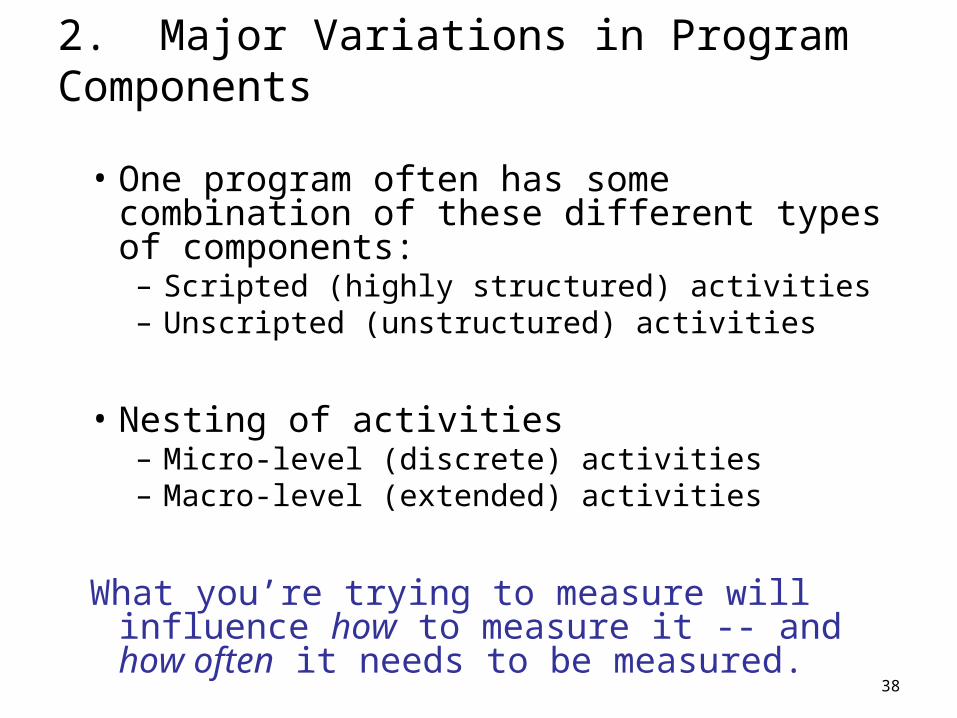
2. Major Variations in Program Components
• One program often has some combination of these different types of components:– Scripted (highly structured) activities– Unscripted (unstructured) activities
• Nesting of activities– Micro-level (discrete) activities– Macro-level (extended) activities
What you’re trying to measure will influence how to measure it -- and how often it needs to be measured.
39
2. Major Variations in Program ComponentsType of Program Component
Example from the Case Study
Implications Abs Avg Bin ARS
Scripted (highly structured) activities
In the first treatment condition, four scripted literacy circles are required. There is known criteria for assessing fidelity.
Fidelity is the difference between the expected and observed values
TTx – tTx
Yes Yes ? Yes
Unscripted (unstructured) activities
In the second treatment condition, literacy circles are required, but the specific content of those group meetings is not specified.
There is unknown criteria for assessing fidelity. We can only record what was done, or in comparison to control
tTx
No? Yes? ? Yes
Abs: “Absolute Fidelity” Index: what happened as compared to what should have happened – highest standard
Avg: Magnitude or exposure level; indicates what happened, but it’s not very meaningful – how do we know if level is good or bad?
Bin: Binary Complier: Can we set a benchmark to determine whether or not program component was successfully implemented? >30% for example? Is that realistic? Meaningful?
ARS : Difference in magnitude between Tx and C – relative strength – is there enough difference to warrant a treatment effect?
Dots under a microscope – what is it???
Starry Night, Vincent Van Gogh, 1889
42
We must measure the trees… and also the forest…
• Micro-level (discrete) activities– Depending on the condition, daily activities (i.e. whole group time, small group
time, center activities) may be scripted or unscripted and take place within larger structure of theme under study.
• Macro-level (extended) activities– Month long thematic unit (is structured in treatment condition and unstructured in
control) is underlying extended structure within which scripted or unscripted micro activities take place.
• In multi-component programs, many activities are nested within larger activity structures. This nesting has implications for fidelity analysis – what to measure and how to measure it.
43
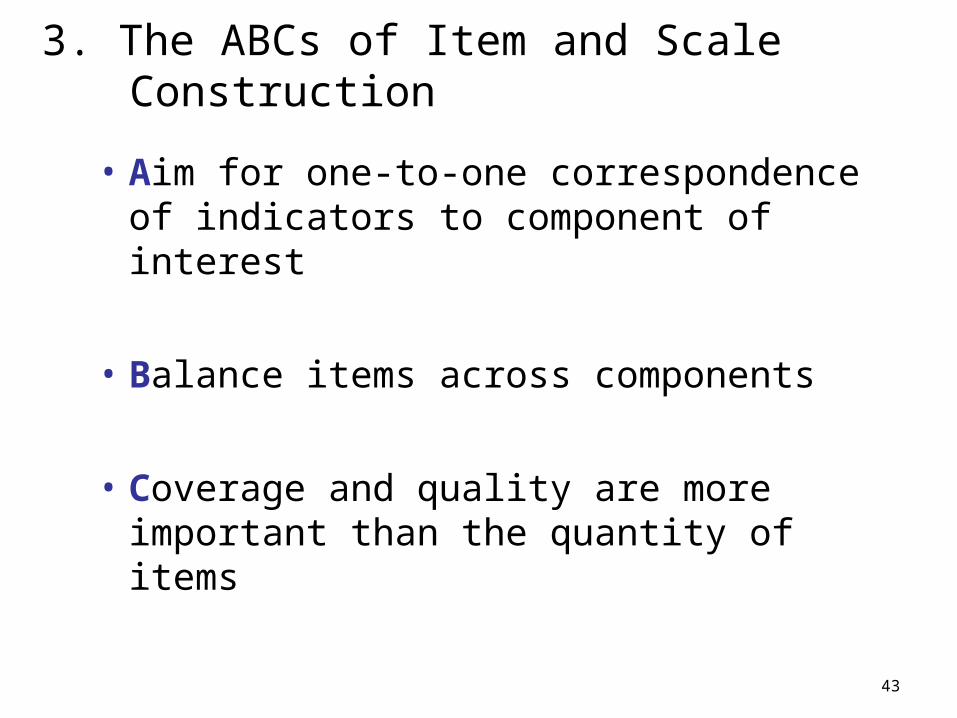
3. The ABCs of Item and Scale Construction
• Aim for one-to-one correspondence of indicators to component of interest
• Balance items across components
• Coverage and quality are more important than the quantity of items
44
3. Aim for one-to-one correspondence
• Example of more than one component being assessed in one item:– [Does the teacher] Talk with children throughout
the day, modeling correct grammar, teaching new vocabulary, and asking questions to encourage children to express their ideas in words? (Yes/No)
• Example of one component being measured in each item:– Teacher provides an environment wherein
students can talk about what they are doing.– Teacher listens attentively to students’ discussions
and responses.– Teacher models and/or encourages students to
ask questions during class discussions.
Diff bw T & C (Oral Lang)*:
T: 1.80 (0.32)
C: 1.36 (0.32)
ARS ES: 1.38
T: 3.45 (0.87)
C: 2.26 (0.57)
ARS ES: 1.62
*Data for the case study comes from an evaluation conducted by Dale Farran, Mark Lipsey, Carol Blibrey, et al.
45
3. Balance items across components
• How many items are needed for each scale?
• Oral-language over represented
• Scales with α<0.80 not reliable
Literacy Content #items α
Oral language 20 0.95
Language, comprehension, and response to text
7 0.70
Book and print awareness
2 0.80
Phonemic awareness 3 0.68
Letter and word recognition
7 0.76
Writing 6 0.67
Literacy Processes:
Thematic Studies 4 0.62
Structured Literacy Circles
2 0.62
46
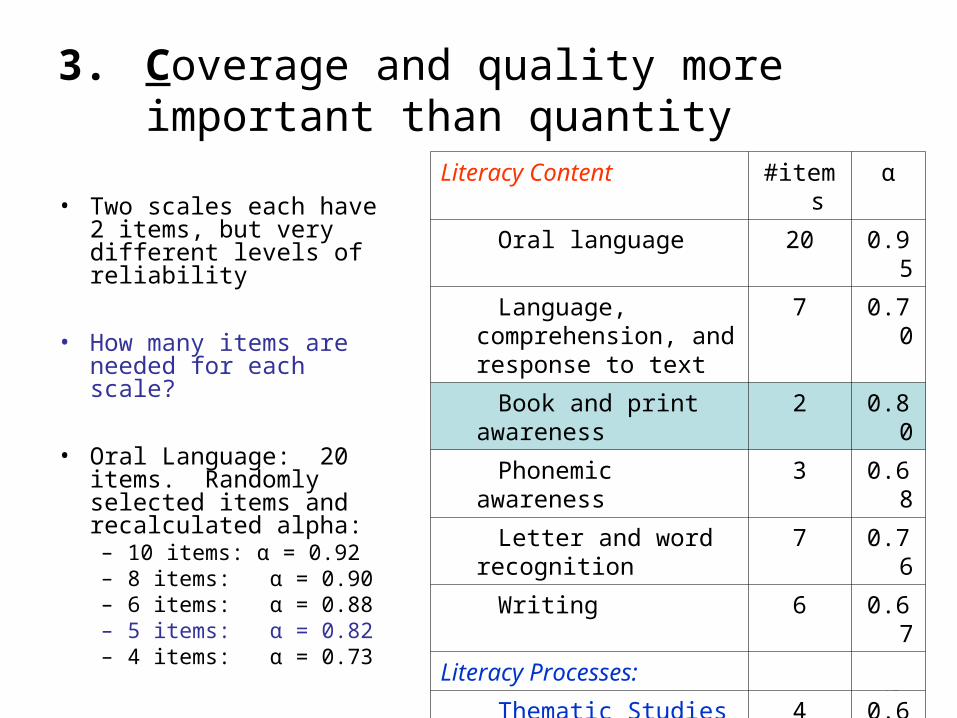
3. Coverage and quality more important than quantity
Literacy Content #items α
Oral language 20 0.95
Language, comprehension, and response to text
7 0.70
Book and print awareness
2 0.80
Phonemic awareness 3 0.68
Letter and word recognition
7 0.76
Writing 6 0.67
Literacy Processes:
Thematic Studies 4 0.62
Structured Literacy Circles
2 0.62
• Two scales each have 2 items, but very different levels of reliability
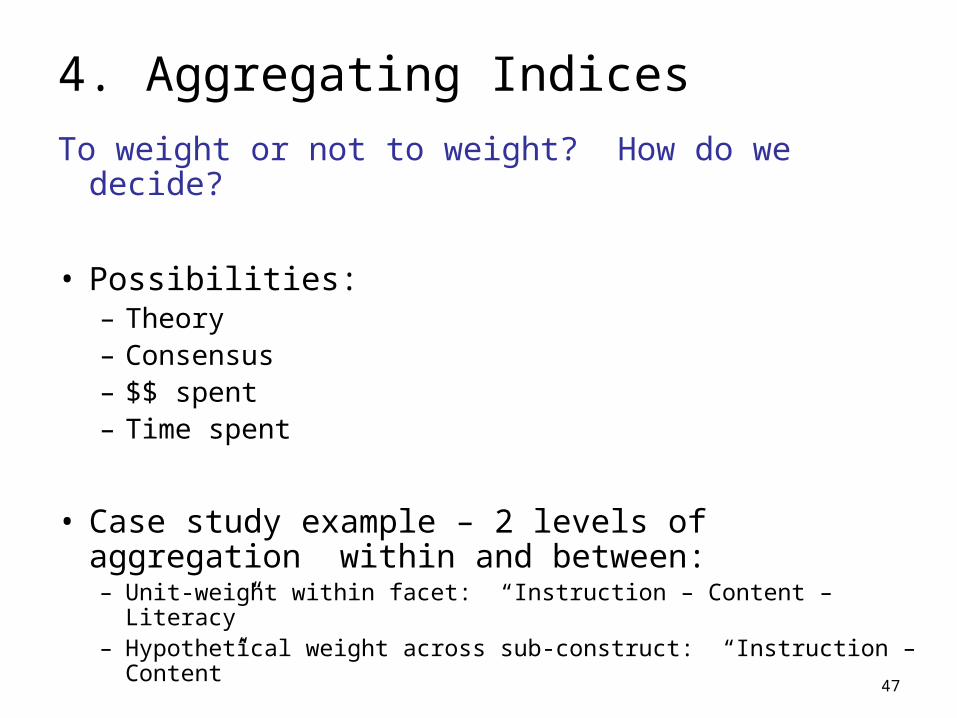
• Possibilities:– Theory– Consensus– $$ spent– Time spent
• Case study example – 2 levels of aggregation within and between:– Unit-weight within facet: “Instruction – Content – Literacy”– Hypothetical weight across sub-construct: “Instruction – Content”
48
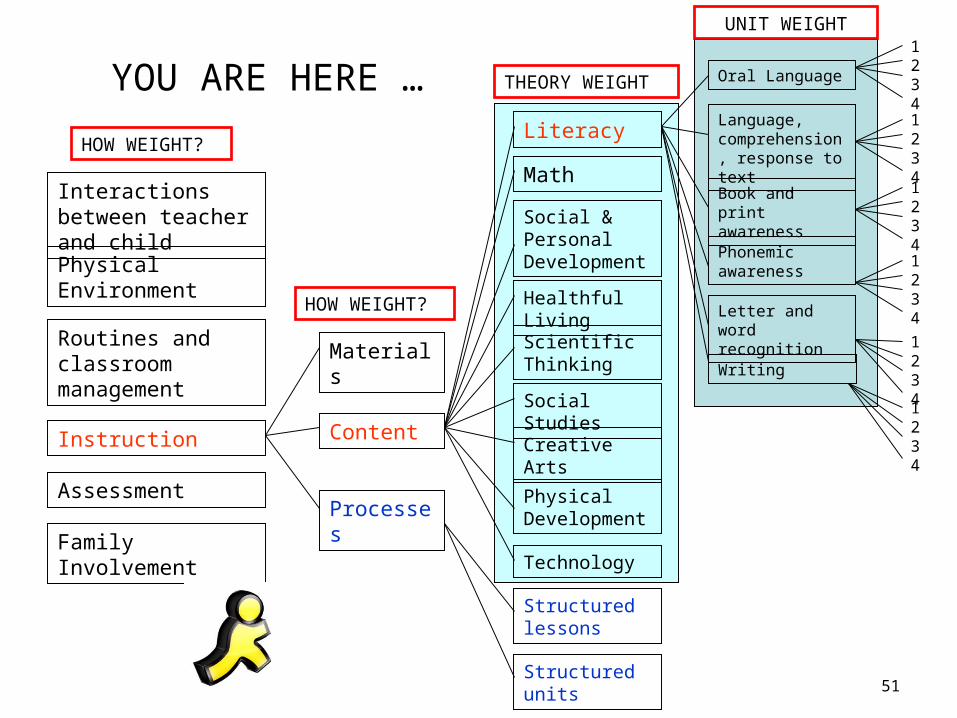
YOU ARE HERE….
Interactions between teacher and child
Physical Environment
Routines and classroom management
Instruction
Assessment
Family Involvement
Materials
Content
Processes
Social & Personal Development
Healthful Living
Scientific Thinking
Social Studies
Creative Arts
Physical Development
Technology
Math
Literacy
Structured lessons
Structured units
Letter and word recognition
Book and print awareness
Phonemic awareness
Language, comprehension, response to text
Oral Language
1234123412341234
1234
Writing
1234
UNIT WEIGHT
THEORY WEIGHT
HOW WEIGHT?
HOW WEIGHT?
49
4. Aggregating Indices
Literacy Content Average Fidelity Index:
Tx
Average Fidelity Index:
C
“Absolute Fidelity” Index:
Tx
“AbsoluteFidelity” Index:
C
Achieved Relative Strength Fidelity Index
(Average)
Achieved Relative Strength Fidelity Index
(Absolute)
Oral language 1.82 1.40 91% 70% 1.36 0.53
Language, comprehension, and response to text
1.74 1.37 87% 69% 1.45 0.44
Book and print awareness
1.91 1.39 96% 70% 1.38 0.73
Phonemic awareness 1.73 1.48 87% 74% 0.74 0.32
Letter and word recognition
1.75 1.36 88% 68% 1.91 0.50
Writing 1.68 1.37 84% 69% 1.22 0.34
Average – unit weighting
1.77 1.38 89% 75% 1.34 0.48
**clustering is ignored
Unit-weight within facet: Instruction – Content – Literacy
4. Aggregating Indices
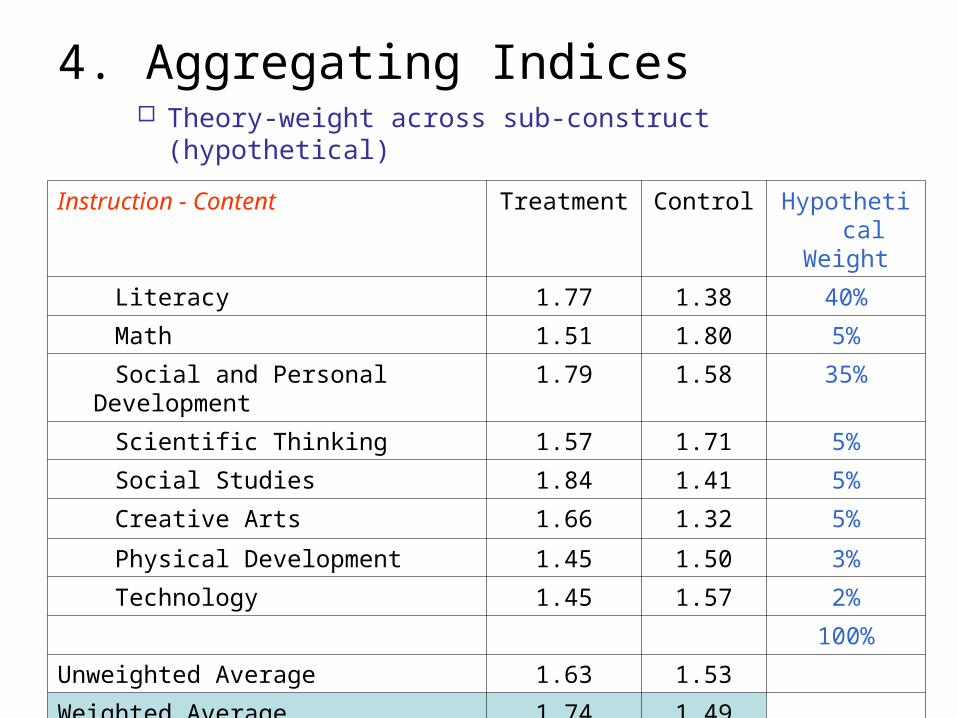
Instruction - Content Treatment Control HypotheticalWeight
Literacy 1.77 1.38 40%
Math 1.51 1.80 5%
Social and Personal Development 1.79 1.58 35%
Scientific Thinking 1.57 1.71 5%
Social Studies 1.84 1.41 5%
Creative Arts 1.66 1.32 5%
Physical Development 1.45 1.50 3%
Technology 1.45 1.57 2%
100%
Unweighted Average 1.63 1.53
Weighted Average 1.74 1.49
Theory-weight across sub-construct (hypothetical)
51
YOU ARE HERE …
Interactions between teacher and child
Physical Environment
Routines and classroom management
Instruction
Assessment
Family Involvement
Materials
Content
Processes
Social & Personal Development
Healthful Living
Scientific Thinking
Social Studies
Creative Arts
Physical Development
Technology
Math
Literacy
Structured lessons
Structured units
Letter and word recognition
Book and print awareness
Phonemic awareness
Language, comprehension, response to text
Oral Language
1234123412341234
1234
Writing
1234
UNIT WEIGHT
THEORY WEIGHT
HOW WEIGHT?
HOW WEIGHT?
Key Points and Future Issues
• Identifying and measuring, at a minimum, should include model-based core and necessary components;
• Collaborations among researchers, developers and implementers is essential for specifying:– Intervention models;– Core and essential components;– Benchmarks for TTx (e.g., an educationally
meaningful dose; what level of X is needed to instigate change); and
– Tolerable adaptation
Points and Issues
• Fidelity assessment serves two roles:– Average causal difference between conditions; and– Using fidelity measures to assess the effects of variation in
implementation on outcomes.
• Should minimize “infidelity” and weak ARS:– Pre-experimental assessment of TTx in the counterfactual