Page 1
ASSESSING PROGRESSIVITY AND CATASTROPHIC
EFFECT OF OUT-OF-POCKET PAYMENTS FOR
HEALTHCARE IN CANADA: 2010-2015
by
Sterling Edmonds
Submitted in partial fulfillment of the requirements
for the degree of Master of Health Administration
at
Dalhousie University
Halifax, Nova Scotia
August 2018
Copyright by Sterling Edmonds, 2018
Page 2
ii
TABLE OF CONTENTS
LIST OF TABLES………………………………………………………………………………………….iv
LIST OF FIGURES…………………………………………………………………………………………v
ABSTRACT…………………………………………………………………………………………………vi
LIST OF ABBREVIATIONS USED……………………………………………………………………...vii
ACKNOWLEDGEMENTS………………………………………………………………………………viii
CHAPTER 1 INTRODUCTION ............................................................................................................ 1
1.1 MOTIVATION ............................................................................................................................... 1
1.2 EQUITY AND THE CANADIAN HEALTHCARE SYSTEM ................................................................. 6
1.3 OBJECTIVES AND CONTRIBUTIONS OF THIS THESIS .................................................................. 9
1.4 ORGANIZATION OF THE STUDY ................................................................................................ 10
CHAPTER 2 LITERATURE REVIEW .............................................................................................. 12
2.1 EMPIRICAL WORK ON PROGRESSIVITY OF OUT-OF-POCKET HEALTHCARE PAYMENTS ..... 12
2.2 EMPIRICAL WORK ON CATASTROPHIC OUT-OF-POCKET PAYMENTS FOR HEALTHCARE .... 17
CHAPTER 3 METHODS ...................................................................................................................... 26
3.1 MEASUREMENT OF PROGRESSIVITY OF HEALTHCARE FINANCING ........................................ 26
3.1.1 The Kakwani Progressivity Index .......................................................................................... 27
3.2 MEASUREMENT OF CATASTROPHIC PAYMENTS FOR OUT-OF-POCKET HEALTHCARE
EXPENDITURES ......................................................................................................................................... 31
CHAPTER 4 ASSESSING PROGRESSIVITY OF OUT-OF-POCKET PAYMENTS FOR
HEALTHCARE IN CANADA: 2010-2015 ............................................................................................... 34
4.1 INTRODUCTION .......................................................................................................................... 34
4.2 DATA .......................................................................................................................................... 37
4.3 METHODS ................................................................................................................................... 39
4.4 RESULTS ..................................................................................................................................... 40
4.4.1 Progressivity Analysis for Total Sample ................................................................................ 40
4.4.2 Progressivity Analysis by Province ....................................................................................... 42
4.4.3 Progressivity Analysis by Urban and Rural Regions............................................................. 45
4.5 CONCLUDING REMARKS ........................................................................................................... 46
CHAPTER 5 ASSESSING CATASTROPHIC OUT-OF-POCKET PAYMENTS FOR
HEALTHCARE IN CANADA: 2010-2015 ............................................................................................... 49
5.1 INTRODUCTION .......................................................................................................................... 49
5.2 DATA .......................................................................................................................................... 50
Page 3
iii
5.3 METHODS ................................................................................................................................... 51
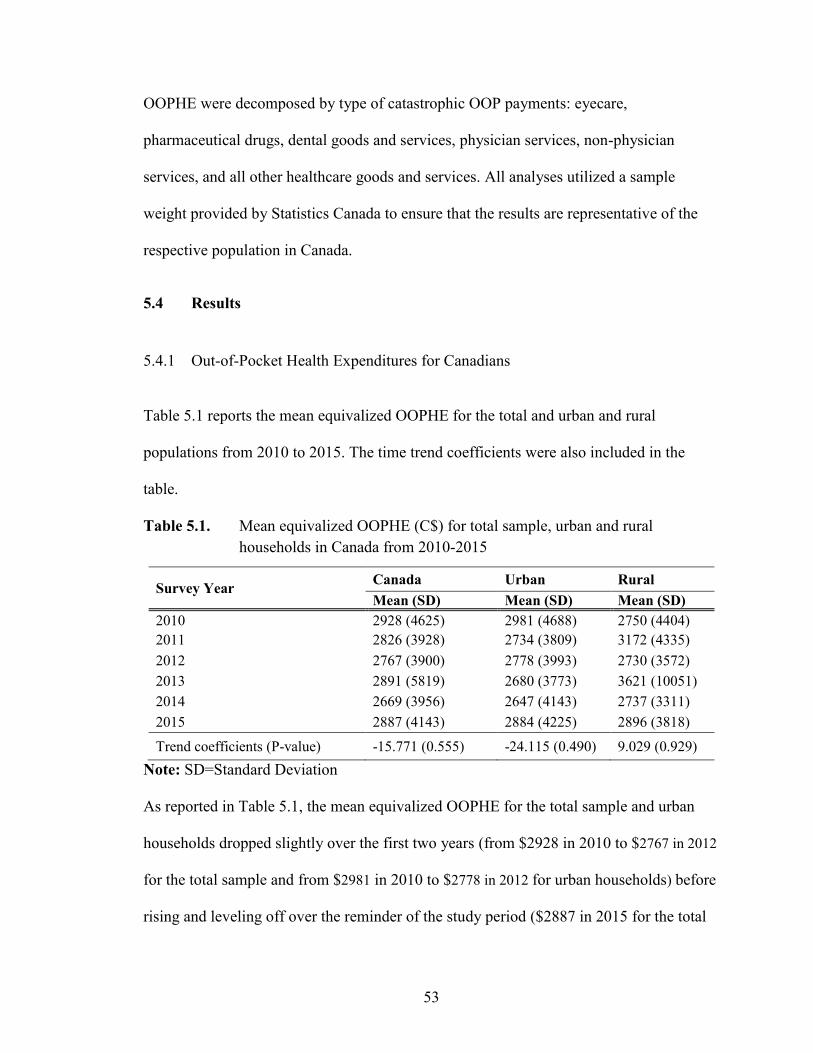
5.4 RESULTS ..................................................................................................................................... 53
5.4.1 Out-of-Pocket Health Expenditures for Canadians ............................................................... 53
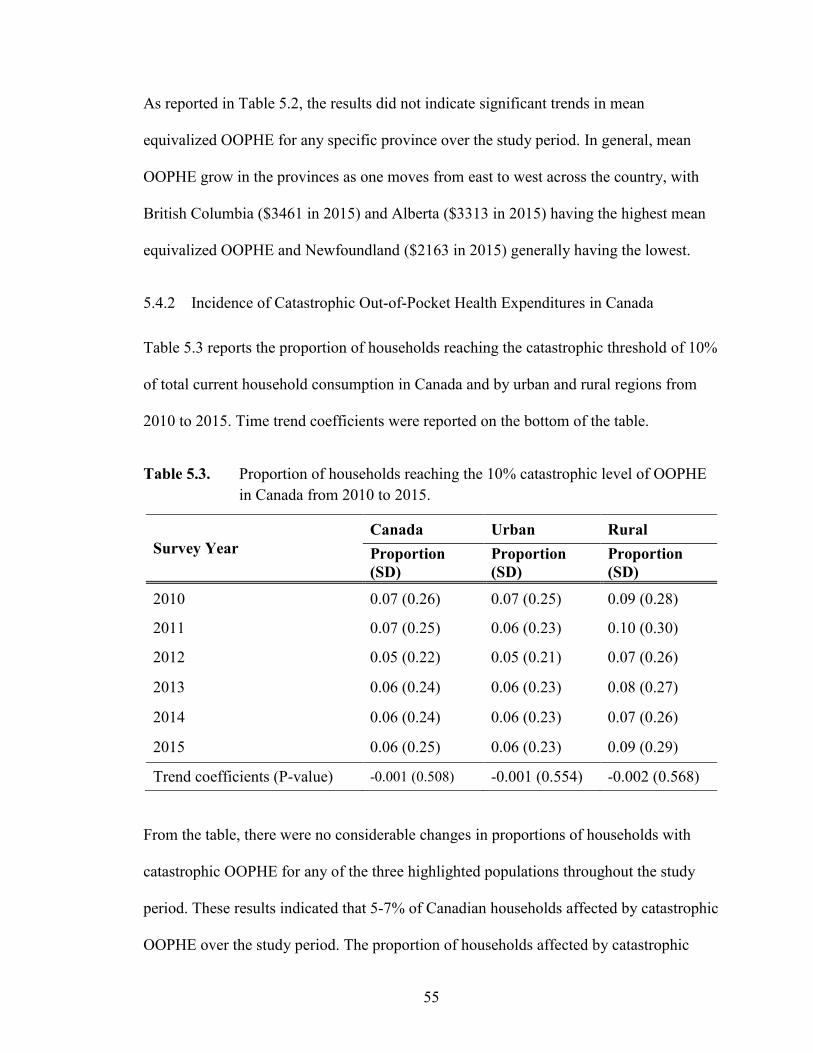
5.4.2 Incidence of Catastrophic Out-of-Pocket Health Expenditures in Canada ........................... 55
5.4.4 Decomposition of Catastrophic Out-of-Pocket Healthcare Expenditures ............................. 58
5.5 CONCLUDING REMARKS ........................................................................................................... 62
CHAPTER 6 DISCUSSION AND CONCLUSIONS .......................................................................... 65
REFERENCES .......................................................................................................................................... 71
APPENDIX 1 – THE GINI COEFFICIENTS, CS, AND KPIS FOR OOPHE FROM
1998 TO 2015…….. ..................................................................................................................................... 80
APPENDIX 2 – CATASTROPHIC OOPHE ANALYSES FOR THE 5% AND 3% OF TOTAL
CURRENT HOUSEHOLD CONSUMPTION THRESHOLDS ............................................................. 81
Page 4
iv
LIST OF TABLES
Table 2.1 Summary of empirical work on progressivity of OOP payments for
healthcare…………………………………………………...………...13-14
Table 2.2 Empirical work on catastrophic OOP payments for healthcare………18-19
Table 4.1 Number of households sampled in each SHS in Canada from 2010 to
2015………………………………………………………………………38
Table 4.2 Gini coefficients, Cs, and KPIs for OOP Healthcare Payments in Canada
from 2010 to 2015……………………………………………..…………41
Table 4.3 The KPIs (95% CI) for OOP healthcare payments by Canadian province
from 2010 to 2015………………………………………………………..43
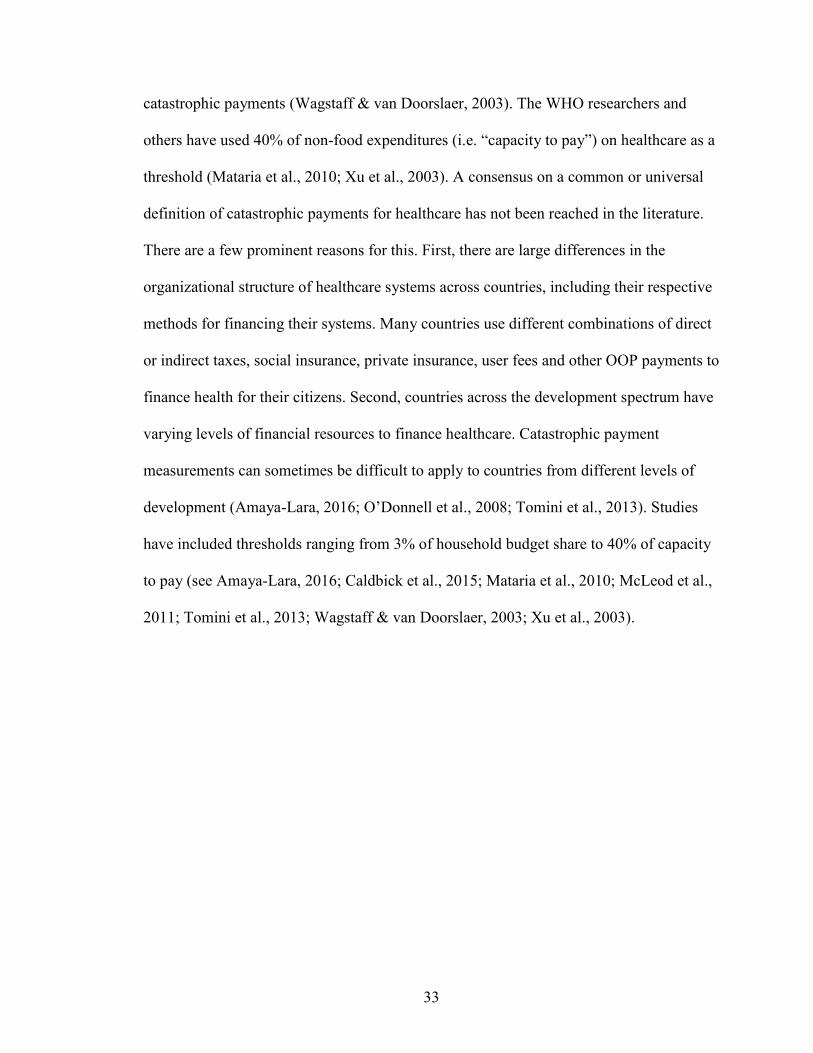
Table 4.4 Gini coefficients, Cs, and KPIs for OOP healthcare payments from 2010 to
2015 by urban and rural regions…………………………………..……...45
Table 5.1 Mean equivalized OOPHE (C$) for total sample, urban and rural
households in Canada from 2010-2015…………………………………..53
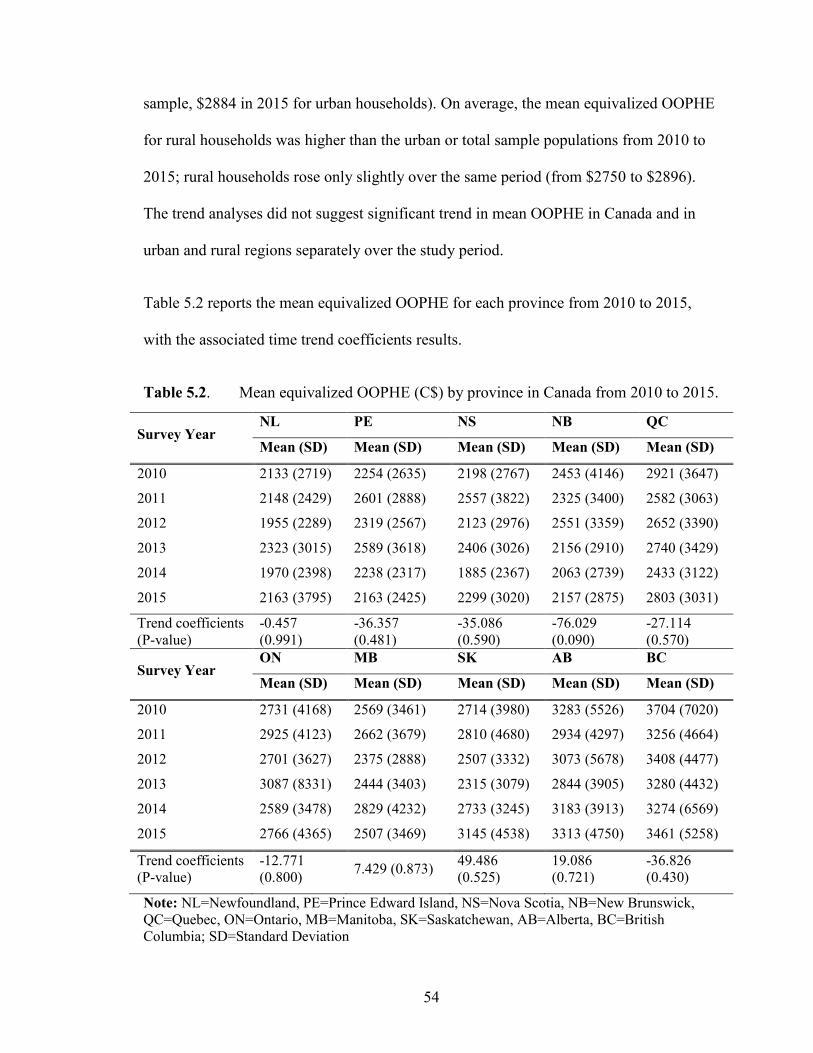
Table 5.2 Mean equivalized OOPHE (C$) by province in Canada from 2010 to
2015……………………………………………………………………....54
Table 5.3 Proportion of households reaching the 10% catastrophic level of OOPHE
in Canada from 2010 to 2015…………………………………………….55
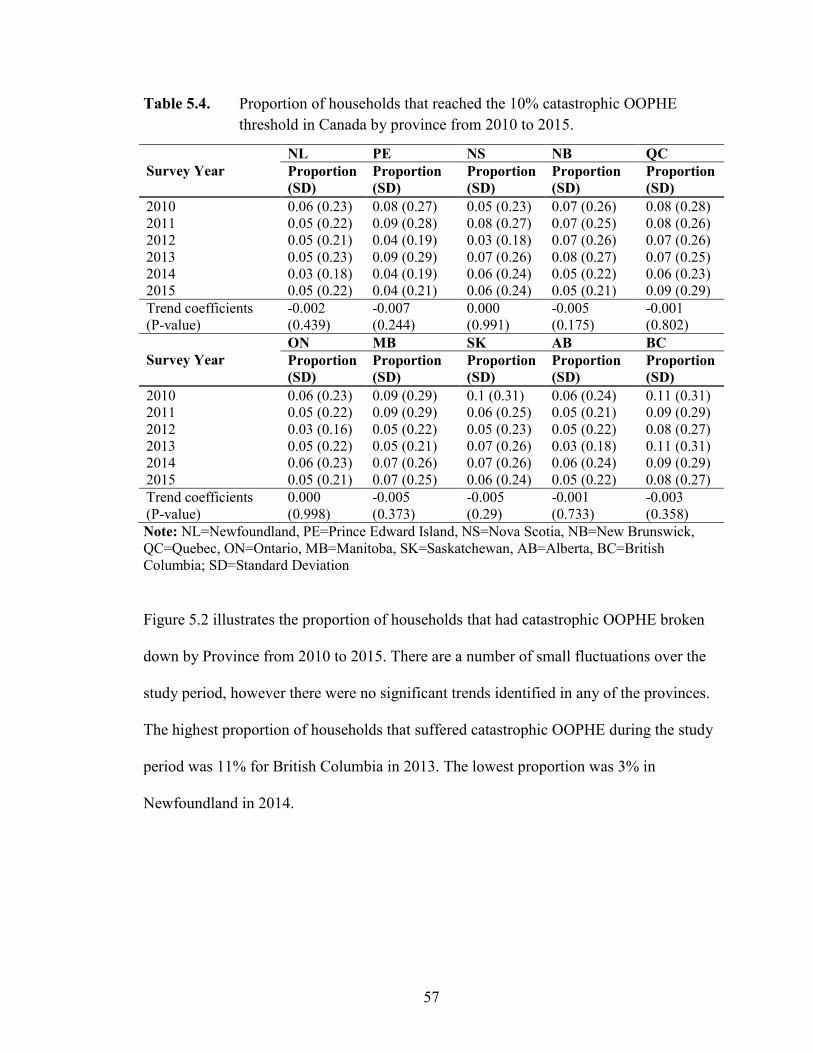
Table 5.4 Proportion of households that reached the 10% catastrophic OOPHE
threshold in Canada by province from 2010 to 2015…………………….57
Table 5.5 Mean equivalized catastrophic OOPHE (C$) by payment type in Canada
from 2010 to 2015………………………………………………………..59
Page 5
v
LIST OF FIGURES
Figure 1.1 Three-dimensional model of universality of a healthcare system………....8
Figure 3.1 The Kakwani Progressivity Index………………………………………..28
Figure 4.1 The KPIs for OOPHE in Canada from 2010 to 2015…….........................41
Figure 4.2 The KPIs for OOPHE by province from 2010 to 2015…………..............42
Figure 4.3 KPIs for OOPHE by urban and rural regions from 2010 to 2015………..44
Figure 5.1 Proportion of households that reached 10% catastrophic OOPHE
threshold for total sample, urban, and rural populations from 2010 to
2015………………………………………………………………………56
Figure 5.2 Proportion of households that reached the 10% catastrophic OOPHE
threshold by province from 2010 to 2015………………………………..58
Figure 5.3 Proportion of mean equivalized catastrophic OOPHE by healthcare
payment type from 2010 to 2015…………………………….……..…....60
Figure 5.4 Proportion of mean equivalized catastrophic OOPHE by healthcare
payment type for urban households from 2010 to 2015……………..…...61
Figure 5.5 Proportion of mean equivalized catastrophic OOPHE by healthcare
payment type for rural households from 2010 to 2015…………………..61
Page 6
vi
ABSTRACT
Equity in healthcare is an important policy objective of the Canadian healthcare system.
Out-of-pocket (OOP) expenses by Canadian households account for a substantial share of
total healthcare expenditures (15%). Using data from Statistics Canada’s Survey of
Household Spending (SHS), this study examines the progressivity and catastrophic effect
of OOP expenditures for healthcare services in Canada over the period 2010 to 2015
inclusive. The Kakwani Progressivity Index (KPI) was used to measure the progressivity
of OOP payments for healthcare for each year of the study period. The catastrophic effect
of OOP payments was calculated using a threshold 10% of total household consumption.
The computed KPI indicated that OOP payments are a regressive source of healthcare
funding in Canada and the regressivity of OOP payments has increased over the study
period. This indicates that the distribution of OOP expenses in Canada is not equitable and
the contribution of households from their total consumption to healthcare as OOP payments
decreases as their consumption increase. Furthermore, the results suggested that 5-7% of
Canadian households face catastrophic OOP healthcare payments. Proportion of
households with catastrophic OOP healthcare payments was higher in rural areas compared
with urban areas over the study period. Policies to enhance financial risk protection among
low-income and rural households are required to improve equity in healthcare financing in
Canada.
Page 7
vii
LIST OF ABBREVIATIONS USED
WHO World Health Organization
ATP Ability-to-Pay
ATN According-to-Need
OOP Out-of-Pocket Payments
CHA Canada Health Act
CIHI Canadian Institute of Health Information
KPI Kakwani Progressivity Index
OLS Ordinary Least Squares
SHS Survey of Household Spending
GDP Gross Domestic Product
OECD Organization of Economic Cooperation & Development
LMICs Low- and Middle-Income Countries
OOPHE Out-of-Pocket Healthcare Expenditures
Page 8
viii
ACKNOWLEDGEMENTS
I would like to express my sincere thanks to my supervisor Dr. Mohammad Hajizadeh for
providing me with the opportunity to further my understanding of healthcare economics
through the research and preparation of this thesis. Your guidance and patience were
appreciated, and your expertise was invaluable. I am very grateful for your supervision
and dedication to this project.
I would also like to thank my readers Drs. Catherine Mah and Majid Taghavi, and my
external examiner Dr. Yukiko Asada for their constructive feedback and insightful
evaluations of my thesis. I appreciate your helpful advice to improve my writing and the
clarity of my ideas.
Finally, I would like to thank Statistics Canada and their Atlantic Research Data Centre
staff for providing me access to the data used in my research. I am grateful for the
opportunity I was given.
Page 9
1
CHAPTER 1 INTRODUCTION
1.1 Motivation
Equity is widely regarded as an important policy objective in both developed and
developing countries (Culyer & Wagstaff, 1993; McLachlan & Maynard, 1982; Mooney,
2003; O’Donnell et al., 2008), and the equitable distribution of healthcare financing and
utilization is an important political objective of many governments throughout the world
(Wagstaff et al., 1992; Wagstaff, van Doorslaer, & Paci, 1989). Nonetheless, countries at
all stages of development experience the prominent issue of equity in healthcare (Molla &
Chi, 2017).
There are different philosophies toward equity in healthcare systems in different countries
around the world. The World Health Organization (WHO) (2010) states that equity in
healthcare includes equitable financing through fair prepayment and protection against
catastrophic payments, and equitable access to healthcare services. One of the more
universal principles of equity in healthcare is the idea that healthcare system payments
should be financed according to ability-to-pay (ATP), rather than according to risk of
illness, and distributed according to need (ATN) (Wagstaff et al., 1992). Based on these
two principles, equity in the healthcare context can be reviewed from two perspectives:
equity in healthcare utilization and equity in healthcare financing.
Page 10
2
Equity in healthcare financial contribution and protection against financial losses is a
common challenge for healthcare systems (WHO, 2000, 2010). Health systems are
typically financed through four sources: general taxation, social insurance, private
insurance and out-of-pocket (OOP) payments. General taxation and social insurance are
state financing methods, whereas private insurance and OOP payments are the
responsibility of the users. Of course, regardless of the payer, residents are the users of
these healthcare services. Health service users typically access full pre-payment or
subsidized health services through state-sponsored financing methods (Wagstaff et al.,
1992; Wagstaff & van Doorslaer, 2000). The unpredictable nature of healthcare needs
contributes to the global challenge of equity in healthcare financial contribution and
protection against catastrophic payments, especially when the burden of payment falls
onto users of differing ATP (Murray et al., 2000; Wagstaff & van Doorslaer, 2000).
There are two primary ways in which OOP payments for healthcare can be unfair for
households. First, households can incur large OOP expenses (for instance, prescription
drug costs for cancer treatment) at the point of care that are not covered under any
insurance or pre-payment scheme. Second, health system financing can impose payments
that are regressive (i.e., the contribution of households/individuals from their income to
OOP payments decrease as their incomes increase) in nature (Wagstaff & van Doorslaer,
2000). In other words, households with a low-level ATP pay proportionately more OOP
than households that are more well off financially (WHO, 2010). Minimizing OOP
payments and relying mostly on insurance or pre-payment schemes, while featuring
progressive or proportionate payments, with respect to income, through a tax-based
healthcare financing system can lead to equitable and effective financing of a health
Page 11
3
system (WHO, 2000, 2010). Therefore, equity in terms of healthcare financing, for the
purpose of this thesis, is defined as the alignment and extent to which payments for
healthcare are related to ATP, and the protection against catastrophic medical expenses
(O’Donnell et al., 2008; Wagstaff & van Doorslaer, 2000). Furthermore, the
establishment and operationalization of equity should be viewed as a state responsibility
both in principle and as an outcome of a publicly funded healthcare system.
Equity in healthcare financing is an important policy objective in Canada. Although not
named explicitly in legislation, healthcare equity is a vital component of the Canadian
universal healthcare system. The federal and provincial governments have different
responsibilities in the equitable financing and delivery of healthcare. Sections 91 and 92
of the Constitution Act, 1867 divides the legislative powers of the federal and provincial
governments respectively (Government of Canada, 1867; Romanow, 2002). Notably, the
provincial governments are responsible “the establishment, maintenance, and
management of hospitals…” and “generally all matters of a merely local or private nature
in the province”, which the courts have interpreted to mean the oversight of healthcare in
the province (Government of Canada, 1867; Romanow, 2002). Although health is the
primary responsibility of the provinces, the federal government influences health policy
and contributes to the financing of “medically necessary” healthcare services through the
Canada Health Act [CHA]. The CHA states that the primary objective of federal
healthcare policy in the country is “… to facilitate reasonable access to health services
without financial or other barriers” (Government of Canada, 1985, p. 5). The federal
government provides the provinces with cash transfers should they follow the program
criteria outlined in the CHA; this fiscal arrangement is also the primary function of the
Page 12
4
CHA (Government of Canada, 1985; Romanow, 2002), which will explained further
below. The five CHA program criteria are: universality, public administration,
comprehensiveness, portability and accessibility (Government of Canada, 1985). Through
the criteria of ‘universality’ and ‘accessibility’, the CHA created the legal basis for equity
in healthcare for all citizens and permanent residents in Canada, regardless of province of
residence. Notwithstanding the CHA principles enforced by the federal government, there
is the potential for interprovincial variations in the equity of healthcare financing because
of the individual responsibilities of provincial governments to deliver services inside
Medicare and regulate those services outside of Medicare coverage (Allin, 2008;
Marchildon & Allin, 2016; Martin et al., 2018). Canada’s healthcare system is based on
the principle that healthcare should be financed according to ATP and should be utilized
based on need (Allin, 2008; McGrail, 2007; Romanow, 2002), although differences in
interprovincial health service management and federal-provincial government powers
form the basis by which healthcare inequities are considered. OOP payments, the subject
of this thesis, are a method of funding those services that fall outside of publicly insured
healthcare services (Martin et al., 2018).
The significant contribution of OOP payments in the Canadian healthcare system
represents a troubling problem for Canadians. The Canadian Institute of Health
Information (CIHI) found that healthcare expenditure contributions from the public and
private sectors (healthcare expenditures by households and private insurance companies)
in Canada have remained relatively stable since the 1990s, with the public-sector
contributing around 70% of total annual health expenditures and the rest by the private-
sector (CIHI, 2016). OOP spending by Canadian households represents the largest portion
Page 13
5
of private healthcare expenditures and accounted for 14.2% of total healthcare
expenditure in 2015 (CIHI, 2016). Although the relative contribution of private spending
from total healthcare expenditures has remained stable in Canada, OOP healthcare
expenditures (OOPHE) have increased over time. The increasing incidence of OOPHE
can place undue financial barriers on Canadian families, especially when these payments
become catastrophic in nature. Financial barriers and lack of financial protection from
catastrophic OOP can lead to cost-related non-adherence of medically necessary services
and interventions (Law et al., 2012). OOPHE have been found to represent a heavy
burden to low-income Canadians, and this burden can lead to decreased utilization of
healthcare services and needed pharmaceutical drugs (Allin, 2008; Law et al., 2012; Lee
& Morgan, 2017). Cost-related non-adherence to prescription medications is a tangible
example of the prominent public health issue of inequity in Canadian healthcare financing
brought on by OOP payments (Law et al., 2012; Lee & Morgan, 2017).
Although equity is considered an important policy objective of the Canadian healthcare
system, relatively few empirical studies (e.g. Caldbick et al., 2015; McLeod et al., 2011;
Sanmartin et al., 2014) have examined equity in healthcare financing in Canada.
Specifically, the extent to which healthcare in Canada is financed according to ATP is
unknown and the degree of progressivity of OOPHE in Canada has not been explored in
Canada. Furthermore, the catastrophic effect of OOPHE in Canada has not been
investigated extensively. This thesis feature two novel and pressing investigations to fill
these identified gaps in the Canadian healthcare literature. First, it assesses the equity of
healthcare financing in Canada by analyzing the progressivity of OOPHE in Canada over
the period from 2010 to 2015. Second, it examines catastrophic OOP payments made by
Page 14
6
Canadians for healthcare. Analyzing equity in healthcare financing in Canada can provide
an important policy and system evaluation to policy-makers and inform the vital decisions
to improve equity in healthcare financing in Canada.
1.2 Equity and the Canadian Healthcare System
The current health system in Canada is highly decentralized. The federal government has
limited, but significant authority to set policy and regulations on some national healthcare
standards; however, it is the provincial governments that have the primary responsibility
to determine how healthcare services are delivered in their respective jurisdictions
(Marchildon & Allin, 2016; Martin et al., 2018). Although these powers are exclusively
provincial, the federal government influences health policy and service provision
throughout the country by providing the provinces with federal cash transfers on the
condition they follow five conditions set out in the CHA (Government of Canada, 1985;
Romanow, 2002). Through this agreement, Canada achieves a loose form of a ‘single
universal healthcare system’ although that is not technically correct. The reality is that
Canada has a national health insurance program that is achieved through the
interconnecting of 13 independent provincial and territorial healthcare systems. This
decentralization has considerable effects on the goal of equity in healthcare financing for
federal and provincial policy-makers. The federal and provincial governments are viewed
as constitutionally equal entities with their own exclusive powers, and as such, the federal
governance of a national healthcare system is an inherent issue to the Canadian political
landscape. Moreover, services that fall outside of the scope of Medicare, and the extent to
which provincial governments are responsible covering these services (as opposed to the
user) pose issues of health equity. Medically necessary hospital and physician services
Page 15
7
covered under public health insurance support the objectives of fairness because of
universal coverage (Marchildon & Allin, 2016; Martin et al., 2018). However, there are
many health services that are not covered under public insurance that threaten equity of
healthcare financing in Canada (Allin, 2008; Law et al., 2013; Marchildon & Allin, 2016;
Martin et al., 2018).
To understand the insurance coverage under the Canadian healthcare system, it is
important to understand “universality” in the Canadian context. Indeed, Bump (2015)
highlights the fact that although the idea of universal healthcare is embraced in many
countries throughout the world, there are still broad questions and lacking detail on the
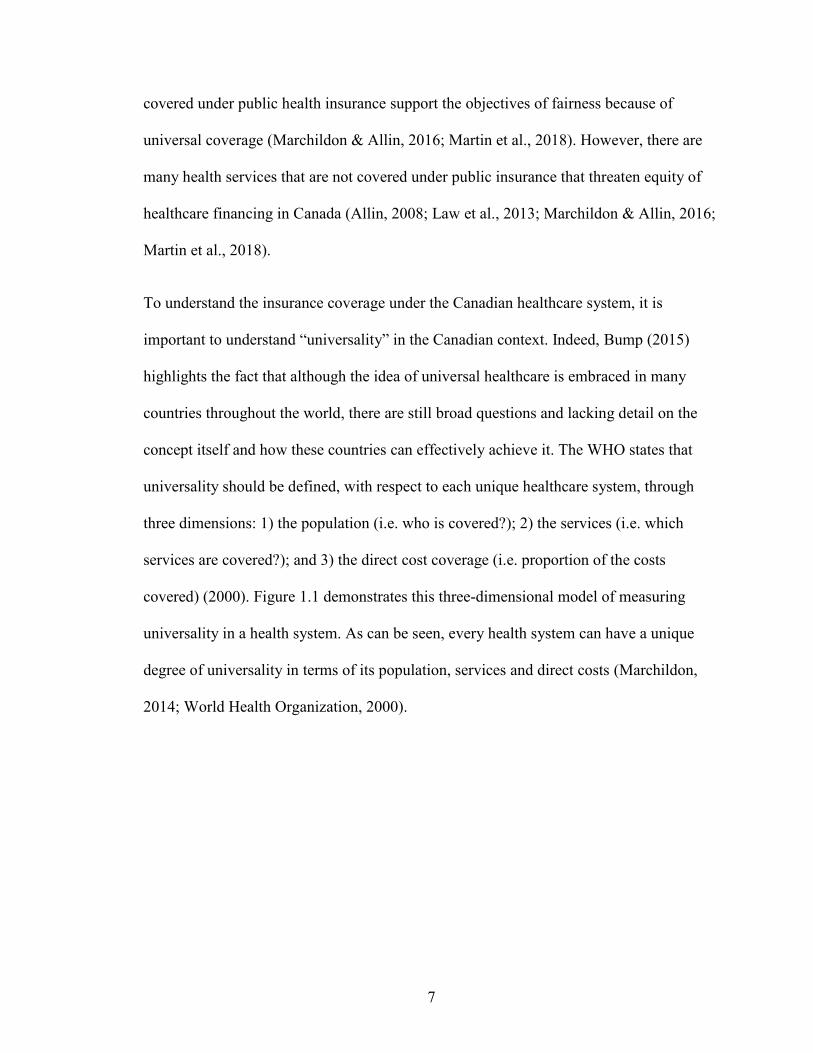
concept itself and how these countries can effectively achieve it. The WHO states that
universality should be defined, with respect to each unique healthcare system, through
three dimensions: 1) the population (i.e. who is covered?); 2) the services (i.e. which
services are covered?); and 3) the direct cost coverage (i.e. proportion of the costs
covered) (2000). Figure 1.1 demonstrates this three-dimensional model of measuring
universality in a health system. As can be seen, every health system can have a unique
degree of universality in terms of its population, services and direct costs (Marchildon,
2014; World Health Organization, 2000).
Page 16
8
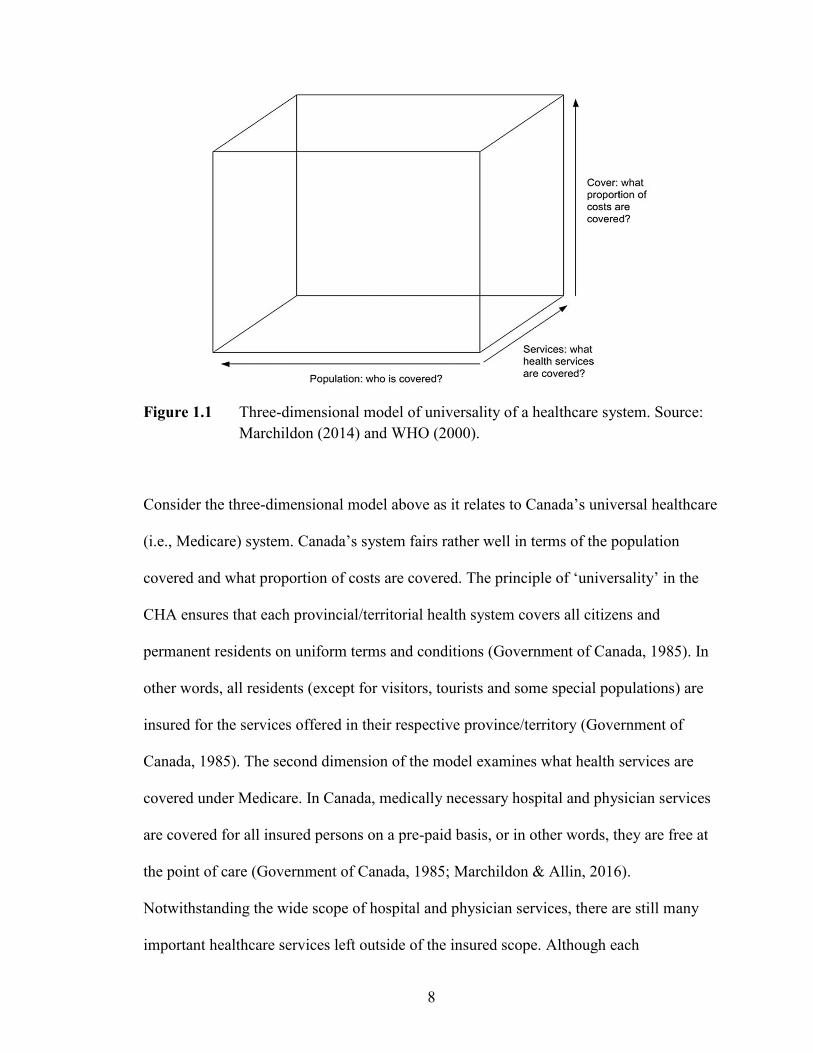
Figure 1.1 Three-dimensional model of universality of a healthcare system. Source:
Marchildon (2014) and WHO (2000).
Consider the three-dimensional model above as it relates to Canada’s universal healthcare
(i.e., Medicare) system. Canada’s system fairs rather well in terms of the population
covered and what proportion of costs are covered. The principle of ‘universality’ in the
CHA ensures that each provincial/territorial health system covers all citizens and
permanent residents on uniform terms and conditions (Government of Canada, 1985). In
other words, all residents (except for visitors, tourists and some special populations) are
insured for the services offered in their respective province/territory (Government of
Canada, 1985). The second dimension of the model examines what health services are
covered under Medicare. In Canada, medically necessary hospital and physician services
are covered for all insured persons on a pre-paid basis, or in other words, they are free at
the point of care (Government of Canada, 1985; Marchildon & Allin, 2016).
Notwithstanding the wide scope of hospital and physician services, there are still many
important healthcare services left outside of the insured scope. Although each
Page 17
9
province/territory has full discretion to cover any range of services they deem fit, there is
some consistency of coverage across the provinces (Allin, 2008). For example, some
provinces cover similar populations for a select number of prescription drugs, although
there is currently no coordinated national pharmacare plan (Allin, 2008; McLeod et al.,
2011). The final dimension of universality refers to what proportion of direct costs are
covered. There is full-financial coverage for hospital and physician services in Canada.
Canada’s Medicare can best be described as ‘narrow’ (because of its coverage is limited
to hospital and physician services), and ‘deep’ (because of the comprehensive full-
financial coverage that is free at the point of care) (Marchildon, 2014). Overall, the
narrow coverage of Canada’s Medicare system means there are several types of important
healthcare services left uncovered, and the burden of financing these services falls on the
individual users of these services. Thus, OOP payments play an important role in the
Canadian healthcare financing and equitable health system financing.
1.3 Objectives and Contributions of This Thesis
The purpose of this thesis is to assess equity in OOP payments for healthcare in Canada.
The specific investigations of this thesis are:
To measure the progressivity of OOPHE in Canada: Specifically, using data from the
national Survey of Household Spending (SHS) from 2010 to 2015, this study aims to
provide one of the first empirical analyses of healthcare financing distribution in Canada.
Progressivity of OOP payments will be measured for Canada as whole, across different
provinces, and between urban and rural Canadian households.
Page 18
10
To measure catastrophic OOPHE by Canadians: Specifically, using data from SHS,
this study aims to assess catastrophic OOPHE from 2010 to 2015 inclusive. The
proportion of households with catastrophic payments will be measured for Canada as
whole, across different provinces, and between urban and rural Canadian households.
This thesis seeks to provide one of the first comprehensive analyses of equity in
healthcare financing and catastrophic effects of OOPHE in Canada over time. Since the
financing of Canada’s healthcare system is shared by the federal and provincial
governments, the results of this paper will provide valuable information to both federal
and provincial policy-makers on enhanced financial protection and promote equity in
healthcare financing in Canada. Although equity in healthcare is a main political
objective in Canada (Law et al., 2013; Martin et al., 2018), to date, a limited number of
empirical studies have analyzed the progressivity of healthcare financing in a given
country over time. Most empirical works on equity in healthcare financing or utilization
focus on specific points in time (see Amaya-Lara, 2016; Hajizadeh & Nghiem, 2011;
McLeod et al., 2011; van Doorslaer et al., 2008), however this study analyzes how equity
in healthcare financing in Canada changes over time. The analysis of healthcare equity
over time allows for observations and the emergence of patterns in healthcare financing
that otherwise would not be possible to distinguish.
1.4 Organization of The Study
This study consists of 6 chapters. Chapter 2 reviews the empirical work on equity in
OOPHE. Chapter 3 explains the methods used in the literature and the current study.
Chapter 4 examines the progressivity of OOPHE in Canada and answer the first research
Page 19
11
objective highlighted above. Chapter 5 examines the catastrophic OOPHE made by
Canadians, which is the second main objective of this thesis. Finally, Chapter 6 discusses
the findings of both investigations and concludes the study.
Page 20
12
CHAPTER 2 LITERATURE REVIEW
The purpose of this chapter is to review the empirical literature on equity in OOPHE. The
first section will review literature and important empirical findings relating to the
progressivity of OOPHE, which will help provide the theoretical basis for the study that
assesses the progressivity of healthcare financing in Canada (Chapter 4). The second
section of this chapter will review and explain key empirical work and their associated
findings relating to catastrophic OOPHE. This section is related to the study on the
assessment of catastrophic OOPHE faced by Canadians (Chapter 5).
2.1 Empirical Work on Progressivity of Out-Of-Pocket Healthcare Payments
There has been considerable attention given to the empirical analysis of equity in
healthcare financing in the past few decades. These empirical studies on equity in
healthcare financing tend to focus on the extent to which healthcare is financed in
accordance with ATP (O’Donnell et al., 2008). Table 2.1 reports a summary of the
empirical work on the progressivity of healthcare financing and, more specifically,
OOPHE. As can be seen, many of the studies conducted on this subject have been
undertaken in Asian and OECD countries. Most of the empirical findings indicate that
OOP payments are a regressive source of healthcare financing.
Page 21
13
Table 2.1. Summary of empirical work on progressivity of OOP payments for healthcare.
Authors Countries
of Study
Financing Sources
Investigated
Main Results
Holahan &
Zedlewski
(1992)
United
States
Employer and employee
contributions to health
insurance, private nongroup
health insurance purchases,
OOP expenses, Medicaid
benefits, uncompensated
care, tax benefits due to the
exemption of employer-paid
health benefits, and taxes
paid to finance Medicare,
Medicaid, and the health
benefit tax exclusion.
This paper assesses the distribution of healthcare spending and financing in the
United States. The results indicate that the distribution of financing is regressive
despite households in higher income deciles spending proportionately more in
health spending than those from the lowest income decile.
Wagstaff et al.
(1992)
10 OECD
Countries
Direct taxes, indirect taxes,
social insurance, private
insurance, OOP payments.
Direct Taxes: Progressive
Indirect Taxes: Mainly Progressive
Social Insurance: Mainly Regressive
Private Insurance: Mainly Regressive
OOP Payments: Especially Regressive
(Rasell et al.
(1994)
United
States
OOP spending, insurance
premiums, and federal, state
and local taxes.
OOP Payments: Regressive
Wagstaff et al.
(1999)
12 OECD
Countries
Direct taxes, indirect taxes,
social insurance, private
insurance, direct payments.
Direct Taxes: Generally Progressive
Indirect Taxes: Generally Progressive
Social Insurance: Generally Progressive
Private Insurance: Regressive
Direct Payments: Regressive
Yu et al.
(2006)
Malaysia OOP payments. OOP Payments: Mildly Progressive
13
Page 22
14
Table 2.1. Continued.
Authors Countries
of Study
Financing Sources
Investigated
Main Results
Yu et al.
(2008)
Malaysia Direct taxes, indirect taxes,
contributions to Employee
Provident Fund and Social
Security Organization,
private insurance and OOP
payments.
Direct Taxes: Progressive
Indirect Taxes: Regressive
Contributions to Employee Provident Fund and Social Security Organization:
Progressive
Private Insurance: Progressive
OOP Payments: Progressive
O’Donnell et
al. (2008)
13 Asian
Countries
Direct taxes, indirect taxes,
social insurance, private
insurance, direct payments.
Direct Taxes: Progressive
Indirect Taxes: Progressive
Social Insurance: Generally Progressive
Private Insurance: Generally Progressive
Direct Payments: Generally Regressive
Hajizadeh and
Connelly
(2010)
Iran Private health insurance
premiums and consumer co-
payments.
Private Health Insurance Premiums: Regressive
Consumer Co-Payments: Progressive
Hajizadeh et
al. (2014)
Australia General taxation, Medicare
Levy payments, Medicare
Levy Surcharge payments
and direct consumer
payments.
General Taxation: Progressive
Medicare Levy Payments: Progressive
Medicare Levy Surcharge Payments: Progressive
Direct Healthcare Payments: Regressive
Molla and Chi
(2017)
Bangladesh OOP payments, private
insurance, social insurance,
and general tax.
OOP Payments: Regressive
Private Insurance: Regressive
Social Insurance: Regressive
General Tax: Regressive
De Mello-
Sampayo and
De Sousa-
Vale (2014)
30 OECD
Countries
Not Applicable This study examined the relationship between health expenditure and health
financing. The results suggest that when healthcare expenditure is controlled by
government, it becomes independent of individual income, which promotes
equity in financing at the individual level.
14
Page 23
15
There are four typical sources of healthcare financing across OECD countries viz., taxes,
private insurance premiums, social insurance contributions and out-of-pocket payments.
The mix of these financing sources varies across countries (Hajizadeh & Connelly, 2010;
Wagstaff et al., 1992, 1999; Yu et al., 2008). Tax-financed healthcare systems (such as in
Denmark, Finland, Ireland and the United Kingdom) tend to be proportional or
progressive, whereas social insurance and private systems (such as in Switzerland and the
United States) are regressive (Wagstaff et al., 1992, 1999). In most countries, OOPHE are
systematically regressive. Portugal and Sweden, both with tax-based healthcare financing
systems, were found to be regressive; notable exceptions to the trends mentioned above
(Wagstaff et al., 1992, 1999). Further analysis of the US healthcare system financing (e.g.
Holahan & Zedlewski, 1992; Rasell et al., 1994) has reinforced the finding that private
healthcare systems tend to be regressive in nature. The primary method of measuring the
progressivity of a health system overall and its component sources is the Kakwani
Progressivity Index (KPI),1 which is explained further in chapter 3.
There have been several recent investigations of equity in healthcare financing for various
Asian countries. Yu et al. (2006, 2008) examined the equity in healthcare financing and
progressivity of OOPHE in Malaysia. The authors found that direct taxes, private
insurance premiums and OOP payments were progressive, and that indirect taxes were
regressive. The finding that OOP payments are progressive is contrary to Wagstaff et al.
(1992) and most other investigations that report the opposite. The authors note that the
most well-off citizens make greater relative payments through all five financing methods
1 It is important to note that the progressivity of individual financing sources of the same health system can
be measured using the KPI, and the weighted average of the KPI for these sources can be used to measure
the overall progressivity of a healthcare system (Wagstaff et al., 1992).
Page 24
16
(direct taxes, social insurance, private insurance premium, indirect taxes and OOP
payments) than the poor, which may have skewed the results towards progressivity.
O’Donnell et al. (2008) investigated healthcare financing in 13 different Asian territories
with economies spanning the entire range of development. They found that direct taxation
is the most progressive form of healthcare financing and this is especially true in low-
income economies. Hajizadeh and Connelly (2010) also provided the first empirical
analyses of healthcare financing in Iran. The findings confirmed that rich households
contribute more to healthcare financing, relative to ATP, than poor households in Iran.
Molla and Chi (2017) reaffirm the impact and burden of inequitable financing of
healthcare in their analysis of Bangladesh’s health system. The authors note that
financing is concentrated among the poor and that all sources of financing were
regressive. The observed effects are mostly due to the system’s reliance on OOPHE.
Additional empirical work has analyzed equity-related concerns in OECD countries. A
paper by Hajizadeh et al. (2014) examined equity in healthcare financing in Australia.
The authors reported that general taxation, Medicare Levy payments and Medicare Levy
Surcharge payments were progressive over the period between 1973 and 2010. Over the
same period, direct payments were found to be regressive.
Some studies, although they do not directly examine equity in healthcare financing, have
analyzed the economic relationship between healthcare expenditure and the various
determinants of health-related expenditure in OECD countries. De Mello-Sampayo and
De Sousa-Vale (2014) examined healthcare expenditures in 30 OECD countries from
1990 to 2009. The study found that healthcare expenditure becomes independent of an
individual’s (or household’s) income when it is mainly financed by the government
Page 25
17
through a public financing scheme, when you control for the typically large dependency
rates in young and elderly citizens and technological advances. In other words, tax-based
public financing schemes for healthcare tend to shift the dependency of healthcare
expenditures away from an individual’s income, which is a component of progressivity.
Overall, studies that have directly investigated equity in healthcare financing indicated
that systems with direct taxation as the principle financing method tend to be progressive,
and systems that rely on OOPHE tend to be regressive in nature. In addition, although
OOP payments were found to be proportional or regressive in high-income countries,
these payments were found to be progressive in low and middle-income countries
(LMICs) (e.g. Hajizadeh & Connelly, 2010; Yu et al., 2008). This may be because more
well-off individuals spend relatively more and receive relatively more healthcare in
LMICs.
2.2 Empirical Work on Catastrophic Out-Of-Pocket Payments for Healthcare
Although some secondary analyses of catastrophic OOPHE were included in some of the
studies discussed above, this section highlights noteworthy empirical work mainly
concerning the catastrophic OOPHE.
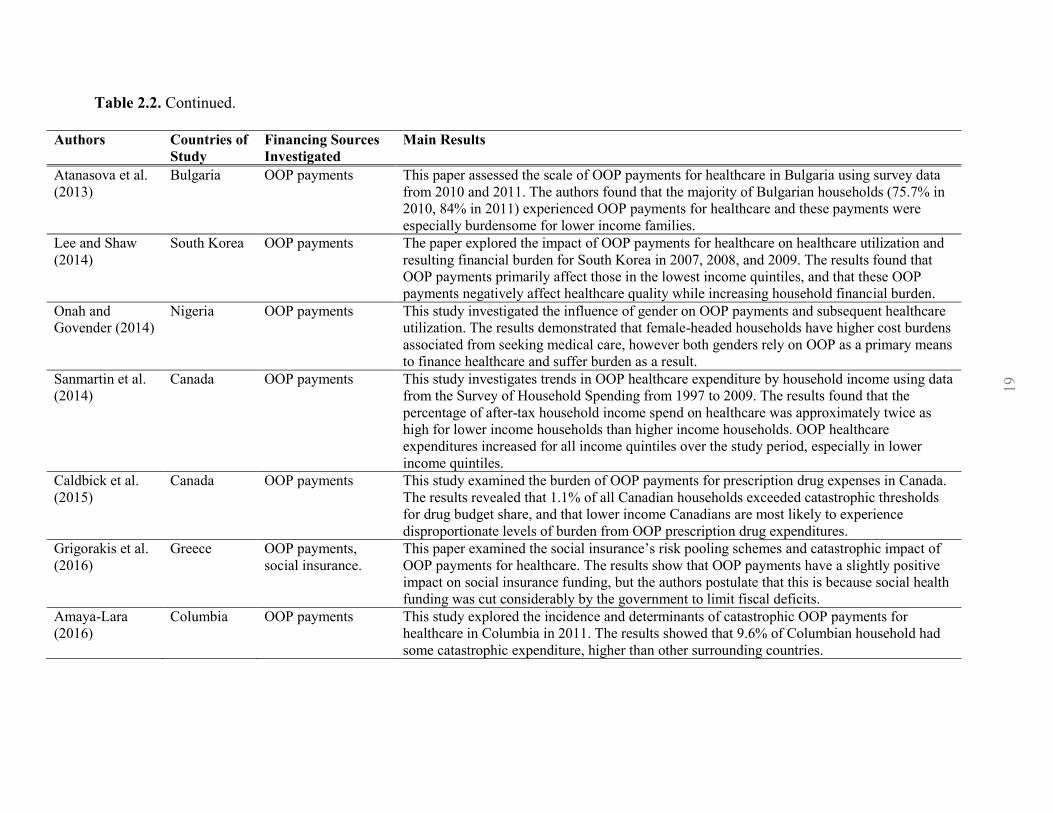
Table 2.2 summarizes the empirical work on catastrophic OOPHE. Much of the empirical
work on catastrophic payments has focused on Asian countries where OOP payments are
a major source of healthcare financing in a number of the Asian countries studied.
Although the OOP payments play less of a role in system financing in OECD countries,
there are some studies that focused on the catastrophic payments of OOP payments in
these countries.
Page 26
18
Table 2.2. Empirical work on catastrophic OOP payments for healthcare.
Authors Countries
of Study
Financing Sources
Investigated
Main Results
Wagstaff and
van Doorslaer
(2003)
Vietnam OOP payments This paper presents work on two different thresholds for measuring catastrophic OOP payments and
associated indices for measuring the intensity of catastrophe in Vietnam between 1993 and 1998. The
authors found that catastrophic OOP payments diminished across the study period in terms of incidence
and intensity, and that any identified poverty impact of OOP payments was primarily due to poor
people becoming even poorer.
van Doorslaer
et al. (2007)
13 Asian
Jurisdictions
Catastrophic
Payments
This paper estimated the distribution and intensity of OOP payments for healthcare in 14 Asian
jurisdictions that account for 81% of the population. The results showed that Bangladesh, China, India,
Nepal and Vietnam use OOP payments as the principle means of healthcare financing and have the
highest incidence of catastrophic payments. In most low- and middle-income countries, the most well-
off households spend proportionately more total household resources on healthcare, reflecting the
poorer household’s inability to finance healthcare services at all.
Somkotra and
Lagrada (2008)
Thailand OOP payments This study sought to examine household OOP payments for healthcare and to measure financial
catastrophe and impoverishing payments made by Thailand household. OOP payments for healthcare
as a share of living standards showed a decreasing trend over the study period. The incidence and
intensity of catastrophic payments decline over the study period.
McLeod et al.
(2011)
Canada OOP payments for
prescription drugs.
This paper examined the financial burden of household OOP payments for prescription drugs in
Canada using data from the 2006 Survey of Household Spending. The results showed senior, social
assistance and general population households had relatively small household budget share dedicated to
prescription drugs, however a small number of households overall suffered catastrophic levels of
financial burden.
Hajizadeh and
Nghiem (2011)
Iran OOP payments This study assessed inequality and determinants of OOP payments and catastrophic expenditure for
hospital services using data from the 2003 Utilization of Health Services Survey in Iran. The results
suggest that catastrophic expenditure primarily affects lower income households, and other factors such
as admission to private hospital, length of stay, and others, increase the likelihood of incurring
catastrophic payments.
Law et al.
(2013)
Canada Private payments This paper assessed the recent growth in private payments made by Canadian households for healthcare
using Survey of Household Spending data from 1998 to 2009. The results showed a 37% increase
($1523 per household) in private health spending over the study period, with most private spending
coming from private insurance premiums, dental services, and prescription drugs.
18
Page 27
19
Table 2.2. Continued.
Authors Countries of
Study
Financing Sources
Investigated
Main Results
Atanasova et al.
(2013)
Bulgaria OOP payments This paper assessed the scale of OOP payments for healthcare in Bulgaria using survey data
from 2010 and 2011. The authors found that the majority of Bulgarian households (75.7% in
2010, 84% in 2011) experienced OOP payments for healthcare and these payments were
especially burdensome for lower income families.
Lee and Shaw
(2014)
South Korea OOP payments The paper explored the impact of OOP payments for healthcare on healthcare utilization and
resulting financial burden for South Korea in 2007, 2008, and 2009. The results found that
OOP payments primarily affect those in the lowest income quintiles, and that these OOP
payments negatively affect healthcare quality while increasing household financial burden.
Onah and
Govender (2014)
Nigeria OOP payments This study investigated the influence of gender on OOP payments and subsequent healthcare
utilization. The results demonstrated that female-headed households have higher cost burdens
associated from seeking medical care, however both genders rely on OOP as a primary means
to finance healthcare and suffer burden as a result.
Sanmartin et al.
(2014)
Canada OOP payments This study investigates trends in OOP healthcare expenditure by household income using data
from the Survey of Household Spending from 1997 to 2009. The results found that the
percentage of after-tax household income spend on healthcare was approximately twice as
high for lower income households than higher income households. OOP healthcare
expenditures increased for all income quintiles over the study period, especially in lower
income quintiles.
Caldbick et al.
(2015)
Canada OOP payments This study examined the burden of OOP payments for prescription drug expenses in Canada.
The results revealed that 1.1% of all Canadian households exceeded catastrophic thresholds
for drug budget share, and that lower income Canadians are most likely to experience
disproportionate levels of burden from OOP prescription drug expenditures.
Grigorakis et al.
(2016)
Greece OOP payments,
social insurance.
This paper examined the social insurance’s risk pooling schemes and catastrophic impact of
OOP payments for healthcare. The results show that OOP payments have a slightly positive
impact on social insurance funding, but the authors postulate that this is because social health
funding was cut considerably by the government to limit fiscal deficits.
Amaya-Lara
(2016)
Columbia OOP payments This study explored the incidence and determinants of catastrophic OOP payments for
healthcare in Columbia in 2011. The results showed that 9.6% of Columbian household had
some catastrophic expenditure, higher than other surrounding countries.
19
Page 28
20
OOPHE and the burden of catastrophic payments for healthcare have received substantial
attention in recent years, and these empirical works have featured countries from all parts
of the world, including Europe, Asia and South America (e.g. Amaya-Lara, 2016;
Atanasova et al., 2013; Grigorakis et al., 2016; Hajizadeh & Nghiem, 2011; Lee & Shaw,
2014; Onah & Govender, 2014; Wagstaff & van Doorslaer, 2003). Many of these
empirical studies use data from cross-sectional national surveys of household or citizen
expenditure to measure catastrophic payments for healthcare. These studies often use data
from one year or a small set of non-consecutive years for comparison (see Amaya-Lara,
2016; Hajizadeh & Nghiem, 2011; McLeod et al., 2011; Tomini et al., 2013; Wagstaff &
van Doorslaer, 2003).
There is no consensus among researchers on a single universal definition of ‘catastrophic’
OOP payments that motivate policy responses from governments or cause distress at the
individual or household level (Amaya-Lara, 2016; Tomini et al., 2013). In fact, several
studies on catastrophic payments for healthcare have used various definitions of
catastrophic thresholds. For example, Wagstaff and van Doorslaer (2003) examined the
fairness of healthcare payments in Vietnam using two different threshold approaches: one
involved the proportion of pre-payment income and the other used ATP (or non-food
expenditure). The authors found that, in both methods of catastrophe measurement, the
intensity and incidence of catastrophic OOPHE was reduced between 1993 and 1998.
Importantly, the authors contend that this finding may be due to the poor people of
Vietnam becoming even poorer, and overall income equality being the major source of
impoverishment, as opposed to hospital and inpatient expenditures being the driving
force. The use of different threshold approaches in Wagstaff and van Doorslaer's (2003)
Page 29
21
work provides a degree of robustness to the findings. A single conservative threshold may
underestimate the prevalence and distribution of catastrophic health expenditures
(McLeod et al., 2011). Similarly, Tomini et al. (2013) utilized multiple thresholds to test
the sensitivity of their findings in their analysis of catastrophic and impoverishing effects
of OOPHE in Albania. The authors used thresholds of 5-25% of total household
expenditures and 5-40% of non-food household expenditures.
Some studies have examined catastrophic and impoverishing healthcare spending in
OECD and high-income countries. Recently, Wagstaff and colleagues (2017a, 2017b)
published two extensive empirical reviews on catastrophic and impoverishing healthcare
spending in as many as 133 countries at all stages of development. The authors reported
that high-income countries tended to have lower proportions of catastrophic payments
affecting their residents than LMICs (Wagstaff et al., 2017a). Furthermore, of those
affected households or residents in high-income countries, catastrophic OOPHE is very
rarely impoverishing, whereas in LMICs, catastrophic OOPHE can also be impoverishing
(Wagstaff et al., 2017b).
Pharmaceutical drugs represent a substantial proportion of OOPHE and this is true for
many OECD countries. Indeed, many European countries including Germany, the United
Kingdom, Spain, and Portugal all had substantial proportions of OOP pharmaceutical
expenditure (Quintal & Lopes, 2016). However, many European countries have enacted
progressive cost-sharing policies in their respective jurisdictions that seek to protect less
well-off families and households from excessive or catastrophic levels of OOP
pharmaceutical expenditure (Carone, Schwierz, & Xavier, 2012).
Page 30
22
There are several studies that have examined financial burden and catastrophic payments
for healthcare by Canadian households. OOP health-related payments per capita increased
from $278 in 1988 to $868 in 2014, a 4.5% annual growth rate (CIHI, 2016). Like other
OECD countries, one of the largest and most publicly criticized potential contributors to
total OOPHE in Canada is prescription drug costs. Although many Canadians across the
country are covered under private health insurance through their employment, there is a
gap of citizens who remain uncovered for these services because of their low-paying,
temporary or seasonal employment status, retirement, or unemployment (Marchildon &
Allin, 2016). As indicated above, this gap represents a considerable burden on those who
are forced to pay for health services OOP. Approximately 10% of Canadians who receive
a prescription have cost-related non-adherence, and this effect is amplified for the
uninsured and low-income Canadians (Law et al., 2012). The impact of not holding
prescription drug coverage (i.e. the threat of OOPHE) disproportionately affects lower-
income Canadians (Marchildon & Allin, 2016).
Some studies specifically have focused on catastrophic OOP payments for pharmaceutical
drugs. Caldbick et al. (2015) examined the burden of OOP pharmaceutical drug expenses
in Canada using the 2009 Survey of Household Spending. Pharmaceutical drugs account
for a large proportion of OOP payments that are catastrophic in nature (Caldbick et al.,
2015; McLeod et al., 2011). The authors used 3%, 6% and 9% of total household
expenditure as the drug budget share and burden measurement thresholds for the study;
3% represented medium burden, 6% was high burden and 9% was catastrophic. They
found that 8.2, 2.6 and 1.1% of the households sampled exceeded the catastrophic
thresholds 3, 6 and 9%, respectively. Consistent with other studies, their results indicated
Page 31
23
there exists an inverse relationship between the burden of OOP pharmaceutical drug
expenditure and household income. In other words, low-income Canadians are most
likely experiencing disproportionate financial burden and they remain more vulnerable
than middle and high-income Canadians. Similar results were observed by McLeod et al.
(2011) in their study on financial burden of household OOP expenditures for prescription
drugs. The authors defined catastrophic drug expenditures as a drug budget share of 10%
or more, and stratified the Canadian population into three sub-populations: senior
households, those households receiving social assistance, and general population
households. The results demonstrated relatively small financial burden for prescription
drug expenditures, with no appreciable interprovincial variation. Both McLeod et al.
(2011) and Caldbick et al. (2015) acknowledged the limitation that some low-income
households that were surveyed about spending may have forgone purchasing needed
prescription drugs to purchase other necessities. Therefore, the results of both studies are
conservative estimates of catastrophic drug expenditures because of cost-related
nonadherence amongst Canadians.
Law et al. (2013) recently examined private healthcare payments among Canadian
households. In 2010, private payments for healthcare (private health insurance premiums
and OOP payments) in Canada were the third highest among OECD countries, despite our
universal healthcare system (Law et al., 2013). With this sentiment in mind, the authors
used Statistics Canada’s SHS data from 1998 to 2009 to assess the incidence and intensity
of growth in private spending across the study period. To our knowledge, this is one of
the few studies to examine growth in private payments for healthcare in Canada using a
time-series analysis of multiple, consecutive years of cross-sectional data. Using 10% of
Page 32
24
annual after-tax income as the catastrophic threshold, the authors found that private
healthcare spending increased by 56% across the study period to 5.2% of the population
and an average of $1523 per household. Admittedly, the authors do not comment on the
consequences of the identified burden of private healthcare expenditures on Canadian
households. Further research and comment on the negative consequences and effects on
lifestyle for Canadians is warranted to fully understand the burden of catastrophic
OOPHE.
In a similar study, Sanmartin and colleagues (2014) examined trends in OOP
expenditures for healthcare services and products in Canada from 1997 to 2009. The
authors aimed to find whether associated growth in OOP expenditures differs by
household income quintiles. The results indicated that OOPHE increased for households
in all income quintiles over the study period, however households in the lowest income
quintile saw the greatest relative increase. This study assessed average household OOP
expenditures by household income quintile and used a percentage threshold of 5% of total
household after-tax income as a representation of “burden”. Although the methods
accomplish the aim of the study, the use of income quintiles limits the study’s
interpretation of the findings. For example, the results indicate that 37% of the lowest
income quintile households had OOPHE greater than 5% of total household income. It is
impossible for the reader to interpret what proportion of that 37% belong to the bottom
half (lowest 10% of the population) of that quintile. Ranking individual households by
income instead of forming arbitrary income groups can improve the applicability and
usefulness of the results. Additionally, the use of 5% of total household after-tax spending
as a threshold to demonstrate “burden” proves useful in the study, but difficult in
Page 33
25
application. The reader of this study may have difficulty comparing the findings of
“burden” in this study to others that have chosen to measure “catastrophic” levels of
OOPHE. Sanmartin et al.'s (2014) study, and others like it, could have confirmed their
results by providing multiple levels and definitions of “burden” and catastrophic”
expenditure to allow their readers to interpret the results for themselves (O’Donnell, et al.,
2008; WHO, 2000).
Overall, these studies demonstrate that those households affected by catastrophic OOPHE
tend to be low-income households, and naturally, this can pose a particularly heavy
socioeconomic burden for these households to bear. In Canada, pharmaceutical drugs
represent a major component of OOPHE because of their inconsistent coverage across
provinces. Like other OECD countries in Europe, Canada lacks comprehensive financial
protection for catastrophic OOPHE, and this is profoundly exhibited in lower-income
Canadian households.
Page 34
26
CHAPTER 3 METHODS
The purpose of this chapter is to review the methods of measurement and assessment of
equity of healthcare finance across the literature. First, methods for assessing
progressivity/regressivity of healthcare payments will be reviewed and explained. This
will provide the methodological basis for the investigation in Chapter 4: Measuring the
progressivity of OOPHE in Canada. Second, methods for measuring catastrophic OOPHE
will be reviewed. This will provide methodological foundation for the second study
presented in Chapter 5: Assessment of catastrophic OPPHE in Canada.
3.1 Measurement of Progressivity of Healthcare Financing
Equity in healthcare financing has received considerable attention over the last three
decades. Over this time, researchers have used many different methods to measure equity
in healthcare in different countries. Earlier research (e.g. Hurst, 1985) has used simplistic
methods of analysis including basic tabulations of income groups in absolute amounts.
This tabulation method in absolute values (instead of proportion of income) rendered it
impossible to assess progressivity (Wagstaff & van Doorslaer, 2000). Other studies (e.g.
Cantor, 1988) calculated equity of health financing system in terms of percentage of
income spent on healthcare payments. Although these studies’ findings are easier to
interpret, one cannot use these results to make comparisons across jurisdictions or
countries, or across time. In other words, one cannot assess whether one country’s
healthcare system is more progressive/regressive than another country by using simplistic
methods (Wagstaff & van Doorslaer, 2000). More recent works examine progressivity of
healthcare financing through techniques originally found in public economics literature,
Page 35
27
which allow for comparability across different jurisdictions and time. This idea was first
popularized in two ground-breaking studies by Wagstaff and colleagues (1992, 1989).
The authors compared equity in the finance of healthcare between several nations using
Kakwani Progressivity Index (KPI) (1977), which is the most commonly used index to
assess progressivity in healthcare finance in the current literature.
3.1.1 The Kakwani Progressivity Index
The KPI was introduced and used to measure the overall progressivity of a tax or
financing scheme by Kakwani (1977). The KPI is used primarily to examine the extent to
which a tax system departs from proportionality (Wagstaff et al., 1992). As a summary
measure of inequality, the KPI can be used to examine changes in progressivity over time.
A tax system is said to be proportional if any given individual pays the same proportion
of their income in tax payments than all other individuals of that population. In other
words, a proportional tax system means members of the taxed population pay taxes
according to their respective ATP and regardless of their individual incomes (O’Donnell
et al., 2008). Assessing departure from proportionality in health system financing is
accomplished by comparing shares of healthcare payments made by proportions of the
population ranked by ATP with their respective individual share of ATP (O’Donnell et
al., 2008). Departure from proportionality can be either progressive or regressive. A
healthcare financing system is defined as progressive (regressive) if better-off individuals
pay proportionately more (less) of their before-tax income towards healthcare payments
than do poorer individuals (O’Donnell et al., 2008; Wagstaff et al., 1992). Importantly,
the KPI can be used to measure the progressivity of individual sources of healthcare
system financing. Additionally, the overall progressivity can be measured by using a
Page 36
28
weighted average of all individual indices (Wagstaff et al., 1992). It is therefore possible,
for example, to have an overall progressive health system that is comprised of more
individually regressive sources of financing than individually progressive sources of
financing. This is because the individual sources use weights that are proportional to their
contribution of total system financing (Wagstaff et al., 1992).
Figure 3.1 The Kakwani Progressivity Index
The KPI is comprised of two curves: the Lorenz curve for pre-tax income and the
concentration curve for healthcare payments (see Figure 3.1). The Lorenz curve
represents the cumulative percentage of income earned by the population of households
ranked in ascending order of pre-tax income. The Lorenz curve is demonstrated in the
figure below as gy(p). Conversely, the concentration curve for health payments represents
the cumulative percentage of health payments by households ranked in ascending order of
Concentration
curve, gh(p)
Lorenz curve,
gy(p)
Cumulative % of Population Ranked by Income
Cu
mu
lative %
of In
com
e and
Health
care Pay
men
ts
Page 37
29
pre-tax income, the same order as the Lorenz curve (O’Donnell et al., 2008; Wagstaff et
al., 1992). The concentration curve enables us to provide statements such as “20% of
health system financing was derived from the poorest 10% of the population” (Hajizadeh
& Connelly, 2010). The concentration curve is shown in the figure below as gh(p).
The most common way to assess departures from proportionality and their relation to the
ATP distribution is Lorenz curve dominance (O’Donnell et al., 2008). If payments for
healthcare in a system are imposed in perfect proportion to income (i.e. healthcare
payments increase [decrease] proportionately with increases [decreases] in income), the
Lorenz curve and health payments concentration curve will overlap and the system is said
to be proportional (O’Donnell et al., 2008; Wagstaff & van Doorslaer, 2000). If
household payments for healthcare rise disproportionately with income, the concentration
curve lies outside of the Lorenz curve. Conversely, if household payments for healthcare
decrease disproportionately with income, the concentration curve lies inside of the Lorenz
curve (O’Donnell et al., 2008; Wagstaff & van Doorslaer, 2000).
The degree of progressivity is directly related to the calculated area between the Lorenz
and healthcare payment concentration curves. More specifically, it is calculated as twice
the area between the concentration curve for healthcare payment and the Lorenz curve for
income (O’Donnell et al., 2008). Therefore, the KPI is defined as:
𝐾𝑃𝐼 = 𝐶ℎ − 𝐺𝑦, (1)
where 𝐶ℎ is the health payments concentration index and 𝐺𝑦 is the Gini coefficient for
pre-tax income (Gerdtham & Sundberg, 1998; Wagstaff et al., 1992).
Page 38
30
The Gini coefficient is defined as twice the area between the Lorenz curve for income and
the line of perfect equality (i.e. the diagonal line in Figure 3.1). The Gini coefficient
ranges between 0 to +1, where +1 means the entire income of a society is concentrated in
the hands of the most well-off individual in the society. The concentration index (C) is
used specifically to measure inequality in health outcomes (e.g. OOPHE). It is calculated
by taking twice the area between the concentration curve for health payments and the line
of perfect equality (Hajizadeh & Connelly, 2010; Hajizadeh et al., 2014). The line of
perfect equality represents a scenario in which each household of the population, ranked
by income, contributes equally to healthcare financing. The C ranges between -1 to +1,
where -1 (+1) means the entire system’s financing is funded by the poorest (richest)
member of the population (Lambert, 1993). The value of zero indicates that all
individuals in the population contribute equally to healthcare system. The values for 𝐾𝑃𝐼
range from -2 (where −2 = −1 − 𝐺𝑦) to +1 (where +1 = 1 − 𝐺𝑦). If a system is
progressive, the KPI is positive (e.g. Figure 2.1). In contrast, if the system is regressive,
the value of the KPI is negative. The value of zero indicates that health payments are
proportional to income and the system is considered proportional (Lambert, 1993;
Wagstaff et al., 1992).
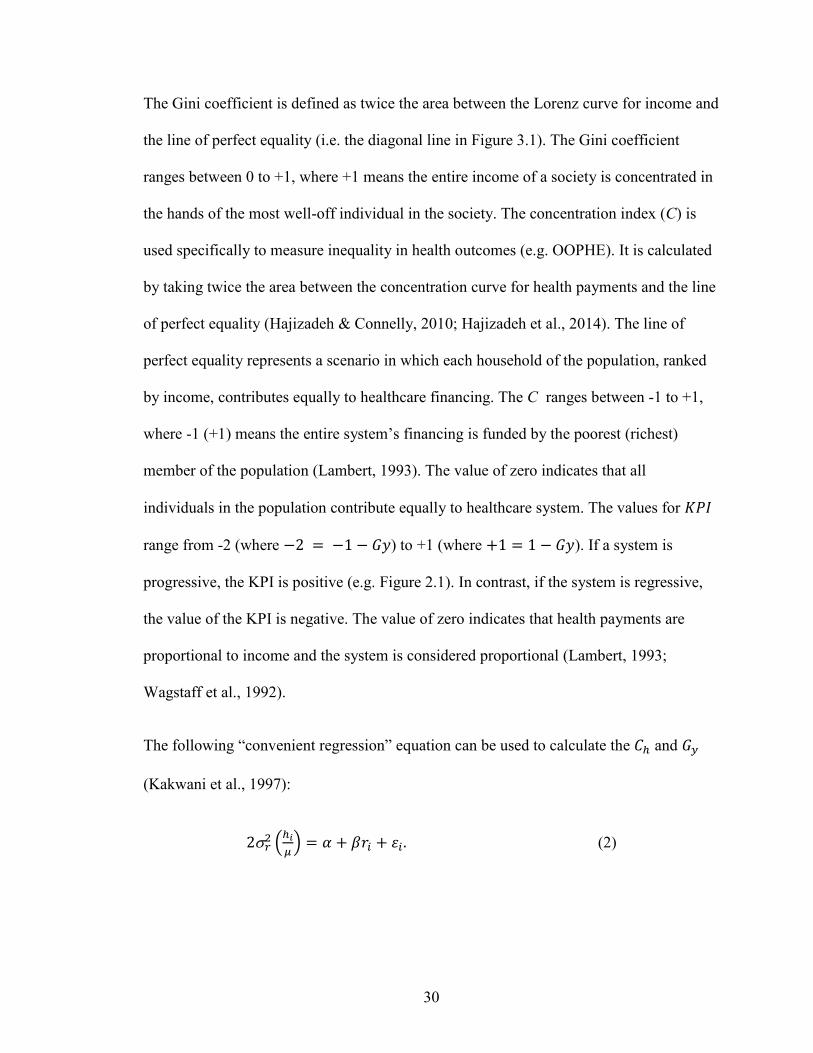
The following “convenient regression” equation can be used to calculate the 𝐶ℎ and 𝐺𝑦
(Kakwani et al., 1997):
2𝑟2 (
ℎ𝑖
𝜇) = 𝛼 + 𝛽𝑟𝑖 + 휀𝑖. (2)
Page 39
31
Where ℎ𝑖is the healthcare spending of individual/household 𝑖, 𝜇 is the mean of healthcare
spending for total population and 𝑟2 is the variance of the fractional rank, 𝑟𝑖. The ordinary
least squares (OLS) estimate of 𝛽 is an estimate of C (O’Donnell et al., 2008).
The KPI can also be measured using the following single-step equation:
2𝜎𝑟2 [
ℎ𝑖
𝜇−
𝑦𝑖
𝜂] = 𝛼 + 𝛿𝑟𝑖 + 𝓊𝑖, (3)
where 𝑦𝑖 is the income of individual/household 𝑖, and is its mean, and the OLS estimate
of is the 𝐾𝑃𝐼 (O’Donnell et al., 2008).
3.2 Measurement of Catastrophic Payments for Out-Of-Pocket Healthcare
Expenditures
Fairness in healthcare finance also involves the idea that households should be protected
against catastrophic OOP medical expenses (WHO, 2000). In fact, equity between high
and low-income populations, specifically protection against financial losses, is a common
challenge for universal healthcare systems (Murray et al., 2000). OOP payments play
prominent roles in various countries (Wagstaff et al., 1992, 1999), including Canada.
Canada’s Medicare system covers “medically necessary” hospital and physician services,
and notwithstanding the many services covered under this directive, there are prominent
and otherwise necessary healthcare services not covered by any public insurance scheme
(Marchildon & Allin, 2016; Martin et al., 2018; Morgan et al., 2015; Morgan & Lee,
2017). The most notable types of healthcare services excluded from Medicare coverage
are prescription drugs, dental services, eyecare services, and non-physician services such
as out-patient rehabilitation (Hajizadeh, 2017; Law et al., 2013; McLeod et al., 2011;
Page 40
32
Morgan et al., 2015). OOPHE have continued to grow in Canada in recent years. Since
the 1990’s, approximately 30% of annual Canadian healthcare spending has been private,
with the remaining proportion attributed to the public sector (CIHI, 2016). OOP spending
represents the largest portion of private healthcare expenditures, accounting for 14.2% of
total healthcare expenditure in 2015 (CIHI, 2016). Although the private-sector
contribution proportion has remained stable, OOPHE have incrementally increased over
time to the level seen today (CIHI, 2016).
It is important to operationally define “catastrophic” to appropriately measure and
compare OOPHE with other empirical studies. The two principle components of
catastrophic payments are total household OOPHE and some measure of household ATP,
typically income, expenditure, or consumption (O’Donnell et al., 2008). Household
income, expenditure, and consumption are all common measures that operationalize the
construct of ATP (O’Donnell et al., 2008). Catastrophic medical spending is typically
defined as exceeding a certain fraction of household ATP (or proxy thereof) in a given
period, usually one year. This approach allows for approximation of the disruptive effect
of health expenditures on material living standards, specifically because large household
expenditures on health must be at the expense of other goods and services (O’Donnell et
al., 2008).
Catastrophic payments can be defined in relation to health payment budget share. This
method is used extensively in the literature. It is appropriate for researchers to include
multiple definitions for catastrophic payments and let the readers interpret the findings for
themselves; this promotes responsible academic transparency (O’Donnell et al., 2008).
When total expenditure is used at the comparator, 10 percent is the common threshold for
Page 41
33
catastrophic payments (Wagstaff & van Doorslaer, 2003). The WHO researchers and
others have used 40% of non-food expenditures (i.e. “capacity to pay”) on healthcare as a
threshold (Mataria et al., 2010; Xu et al., 2003). A consensus on a common or universal
definition of catastrophic payments for healthcare has not been reached in the literature.
There are a few prominent reasons for this. First, there are large differences in the
organizational structure of healthcare systems across countries, including their respective
methods for financing their systems. Many countries use different combinations of direct
or indirect taxes, social insurance, private insurance, user fees and other OOP payments to
finance health for their citizens. Second, countries across the development spectrum have
varying levels of financial resources to finance healthcare. Catastrophic payment
measurements can sometimes be difficult to apply to countries from different levels of
development (Amaya-Lara, 2016; O’Donnell et al., 2008; Tomini et al., 2013). Studies
have included thresholds ranging from 3% of household budget share to 40% of capacity
to pay (see Amaya-Lara, 2016; Caldbick et al., 2015; Mataria et al., 2010; McLeod et al.,
2011; Tomini et al., 2013; Wagstaff & van Doorslaer, 2003; Xu et al., 2003).
Page 42
34
CHAPTER 4 ASSESSING PROGRESSIVITY OF OUT-OF-
POCKET PAYMENTS FOR HEALTHCARE IN
CANADA: 2010-2015
This chapter measures the progressivity of OOPHE in Canada from 2010 to 2015. The
chapter is organized as follows: Section 4.1 introduces healthcare financing system in
Canada, Section 4.2 describes the data and variables used in the study, Section 4.3
describes the methodology and statistical analysis, Section 4.4 presents the results, and
Section 4.5 concludes the chapter.
4.1 Introduction
Although not named explicitly in legislation, this principle of healthcare equity is an
important component of the Canadian universal healthcare system. The CHA states that
the primary objective of healthcare policy in the country is “… to facilitate reasonable
access to health services without financial or other barriers” (Government of Canada,
1985, p. 5). It is worth noting that although Canada’s health system is built on the
principle of equity of financing and utilization, and for all citizens to have access on the
same terms and conditions (Government of Canada, 1985; Romanow, 2002), the current
health system is highly decentralized. Indeed, the federal government has limited, but
significant authority to set policy and regulation on some national healthcare standards;
however, it is the provincial governments that have the primary responsibility to
determine how healthcare services are delivered in their respective jurisdictions
(Marchildon & Allin, 2016). Through an agreement governed by the CHA, Canada
Page 43
35
achieves a loose form of a ‘single universal healthcare system’, this is a national public
health insurance program achieved through the interconnecting of 13 independent
provincial and territorial healthcare systems.
The current governance of Canadian health system provides both the provincial and
federal governments with different responsibilities regarding the financing and delivery of
care. The federal government is responsible for the monitoring and enforcement of the
CHA, the exclusive delivery and financing of health services for special populations,
including Indigenous peoples, military personnel, and prisoners of federal jails and
correctional facilities (Romanow, 2002). The provincial governments are responsible for
the delivery of healthcare services and the remuneration of their providers in their
respective jurisdictions, and they have enacted legislation to address such responsibilities.
Provincial governments are responsible for the negotiation of fee schedules for physician
remuneration with provincial medical associations, and the determination of which
services are “medically necessary” and therefore covered through public insurance
(Romanow, 2002).
Canada’s universal healthcare system (or Medicare) can be described through three
factors: the population it covers, the services it covers, and the proportion of costs
covered (WHO, 2010). First, in terms of population coverage, all residents of Canada
(except for visitors, tourists, and those who receive healthcare through the federal
government) are insured for the services offered in their respective provinces or territories
(Government of Canada, 1985). Second, Medicare covers all medically necessary hospital
and physician services for all insured persons. The scope of medical necessity, and thus
which services are covered, is determined by each provincial government independently.
Page 44
36
Notwithstanding the extensive amount of health services covered under the umbrella of
hospital and physician services, there are still many important health services that remain
uncovered. Finally, Medicare offers full financial coverage at the point of care to all
insured persons (Marchildon, 2014). Overall, Canadian Medicare covers a relatively
small proportion of healthcare services, but offers comprehensive financial coverage to
those insured (Marchildon, 2014). The responsibility to finance healthcare services that
are left outside the scope of Medicare falls to the users of those services through private
payments, including OOP expenditures and private insurance (Marchildon, 2014;
Marchildon & Allin, 2016; Romanow, 2002). The private financing of necessary
healthcare services represents the greatest opportunity for the inequitable distribution of
healthcare financing, especially for those Canadian households with limited ATP
(Marchildon, 2014; Marchildon & Allin, 2016; Martin et al., 2018).
Unfairness and inequitable distribution of health system contributions represents a
troubling problem for Canadians. CIHI found that healthcare expenditure contributions
from the public and private sectors (healthcare expenditures by households and private
insurance companies) in Canada represent around 70% and 30% of total annual health
expenditures respectively (CIHI, 2016). OOP spending by Canadian households
represents the largest portion of private healthcare expenditures and accounted for 14.2%
of total healthcare expenditure in 2015 (CIHI, 2016). Private expenditures mostly cover
services that are not covered by the public insurance, such as pharmaceutical drugs,
dental care, eyecare, and non-physician services such as out-patient physiotherapy or
chiropractic care (Hajizadeh, 2017).
Page 45
37
Notwithstanding the benefit of Canada’s universal healthcare system, it is unclear how
equitable OOPHE are for Canadians. Although equity in healthcare is considered an
important policy objective, relatively few empirical studies have examined equity in
healthcare financing in Canada. More specifically, the extent to which healthcare in
Canada is financed according to ATP is unknown. Thus, this chapter measures the extent
of progressivity OOPHE in Canada and across its provinces over the period between 2010
and 2015.
4.2 Data
The confidential master files of the SHS conducted by Statistics Canada were used to
measure the progressivity of OOPHE in Canada. The SHS is an active annual survey that
obtains detailed information about household spending and is collected annually in the 10
Canadian provinces. The SHS typically collects information on the amounts of food,
transportation, clothing, shelter, healthcare and other expenditures to better understand
household spending in Canada. Statistics Canada uses a stratified two-stage sampling
design for the SHS, where the first stage is a sample of geographic clusters and the next
are a sample of the dwellings within each cluster (Statistics Canada, 2017). Data from the
SHS for the purposes of this analysis was available from 1998 to 2015, however there
have been some changes to the SHS that affect its comparability over time. Specifically,
starting from the SHS 2010, an interview and expense diary were introduced to collect
household expenditures. These changes to the collection methodology limit their
comparability to versions before 2009 (Government of Canada, 2009). In fact, Statistics
Canada cautions users of these data about the comparability regarding the dataset break
Page 46
38
(Statistics Canada, 2012)2. In response to this break in the dataset, many otherwise usable
years of SHS data were omitted from this analysis. Specifically, the datasets from 1998-
2009 were not used because of the changes in SHS data collection starting in 2010. The
datasets from 2010-2015 were used to analyze trends in the progressivity of OOPHE in
this chapter. These years are the most recent, available iterations of the SHS after the
change in survey methodology. Table 4.1 shows the number of observations from each
SHS across the study period.
Table 4.1. Number of households sampled in each SHS in Canada from 2010 to 2015.
Year of
Survey
Sample size
(number of households)
2010 9,062
2011 7,661
2012 3,828
2013 4,048
2014 3,758
2015 5,010
Total 33,367
The SHS provides household-level information on private healthcare spending through
both private insurance premiums and direct OOPHE. Payments for private insurance
premiums were excluded from this study. The target population of the SHS is the
population of Canada’s 10 provinces and excludes residents of institutions and members
of the Canadian Forces, as well as those living on Indian reserves (Statistics Canada,
2017), overall collection exclusions account for 2.5% of the population. Total household
2 Separate sensitivity analyses were conducted with the data from 1998 to 2009 to verify this comparability
caution. The two sets of data, before and after the dataset break were verified as incompatible. These
calculations are included in Appendix 1.
Page 47
39
current consumption and direct OOPHE were provided by the SHS. Observations with
missing values in any of these variables were excluded in the calculations. All analyses
were performed in STATA (StataCorp. 2015. Stata Statistical Software: Release 14.
College Station, TX: StataCorp LP.).
4.3 Methods
The assessment of progressivity of OOPHE is based in the principle that healthcare
payments should be distributed according to ATP. This study used the Kakwani
Progressivity Index (KPI) to measure the extent to which OOPHE are related to a given
household’s ATP.
Household consumption from the SHS was used as a proxy for ATP in the estimation of
the KPIs reported in this chapter. This is because the income of households is more
volatile than their consumption; although household income can vary, household
consumption tends to remain steady over time (Hajizadeh et al., 2014; O’Donnell et al.,
2008). In addition, the income of households tend to be under-reported in surveys,
whereas household consumption tends to be reported more precisely (Deaton & Grosh,
2000; Xu et al., 2003). The direct OOPHE, which exclude other private expenditure such
as private insurance payments, were used in the estimation of KPIs.
Household consumption and healthcare expenditure have been equivalized to take into
account differences in household size, ensuring proper comparison (Hajizadeh et al.,
2014; O’Donnell et al., 2008). There is no universally accepted method for determining
equivalence scales. Thus, similar to the OECD publications (e.g., OECD, 2008, 2011), the
square root scale, which divides household consumption/ direct OOPHE by the square
Page 48
40
root of household size, was used to equivalize household consumption/ direct OOPHE.
The KPIs were calculated for the total sample, by each individual province, and by urban
and rural residential regions. Rural residential regions were defined as population centres
with less than 30,000 people, and all other regions with lower population density. Urban
residential regions were defined as population centres with 30,000 people or more
(Statistics Canada, 2017). All analyses utilized a sample weight provided by Statistics
Canada to ensure that the results are representative of the Canadian population.
To measure statistically significant trends in the KPIs over time, the following time-series
regression analysis was used:
𝐾𝑃𝐼𝑡 = 𝛼0 + 𝛼1𝑡𝑡, (1)
where 𝐾𝑃𝐼𝑡 is KPI at time 𝑡, 𝑡𝑡 indicates time 𝑡 and 𝛼1 is the coefficient on time-series
analysis. Should this coefficient be statistically significant, a positive value indicates an
increasing trend in progressivity over time, whereas a negative value indicates a
decreasing trend.
4.4 Results
4.4.1 Progressivity Analysis for Total Sample
Table 4.2 reports the Gini coefficients, the Cs and the KPIs for OOPHE in Canada from
2010 to 2015. According to the table, there are negligible differences and no discernable
trend between for the Gini coefficients, while the Cs show a slight decreasing trend
(Trend coefficient=-0.011, P-value: 0.005). The KPI is negative in all years of the survey,
indicating regressivity of OOPHE throughout the study period. The time-series regression
Page 49
41
results indicated that there was a statistically significant decrease in the KPI (i.e. increase
in regressivity) from 2010 to 2015 (Trend coefficient=-0.0174, P-value: 0.036). It is
worth nothing that the largest difference in KPIs came between the 2014 and 2015 survey
years.
Table 4.2. The Gini coefficients, Cs, and KPIs for OOP healthcare payments in
Canada from 2010 to 2015.
Survey
Year
Gini Coefficients
(95% CI)
Concentration
Indices (95% CI)
Kakwani Progressivity
Indices (95% CI)
2010 0.399 (0.393 to 0.405) 0.281 (0.300 to 0.262) -0.118 (-0.082 to -0.154)
2011 0.388 (0.383 to 0.393) 0.261 (0.279 to 0.243) -0.127 (-0.092 to -0.162)
2012 0.395 (0.387 to 0.403) 0.259 (0.285 to 0.233) -0.136 (-0.092 to -0.180)
2013 0.396 (0.388 to 0.404) 0.258 (0.295 to 0.221) -0.138 (-0.057 to -0.219)
2014 0.389 (0.381 to 0.397) 0.239 (0.267 to 0.211) -0.151 (-0.106 to -0.196)
2015 0.442 (0.433 to 0.451) 0.217 (0.241 to 0.193) -0.225 (-0.179 to -0.271)
Trend
coefficients
(P-value)
0.006 (0.230) -0.011 (0.005) -0.0174 (0.036)
Note: CI=confidence interval
Figure 4.1 reports the KPIs for OOPHE in Canada. As mentioned, the KPIs, relative to
2010 as a base index, demonstrated a significant decrease over time. These findings
indicated that the regressivity of OOPHE became increasingly more regressive from 2010
to 2015. This decreasing trend began as marginal annual decreases and grew in absolute
size through the end of the study period, including the largest decrease being observed
between the 2014 and 2015 survey years.
Page 50
42
Figure 4.1. The KPIs for OOPHE in Canada from 2010 to 2015.
4.4.2 Progressivity Analysis by Province
Table 4.3 reports the KPIs for OOPHE from 2010 to 2015 by province. As reported in the
table, every KPI was negative, suggesting that OOPHE were a regressive source of
healthcare financing in all provinces from 2010 to 2015. The provinces Newfoundland
and Labrador, Prince Edward Island, Saskatchewan, Manitoba and Nova Scotia had the
lowest average KPIs for the study period, indicating the higher levels of regressivity
compared to the other provinces. Conversely, Alberta, Ontario, Quebec, and British
Columbia had the highest average KPIs for the study period, indicating lower levels of
regressivity. The time trend analyses indicated that there were no discernable trends in
regressivity for all provinces. Figure 4.2 illustrates the trends in the KPIs over time across
the 10 provinces.
-0.250
-0.200
-0.150
-0.100
-0.050
0.000
2010 2011 2012 2013 2014 2015
The
KP
I
Page 51
43
Figure 4.2. The KPIs for OOPHE in Canada by province from 2010 to 2015.
-0.300
-0.250
-0.200
-0.150
-0.100
-0.050
0.000
2010 2011 2012 2013 2014 2015
The
KP
I
Newfoundland and Labrador Prince Edward Island Nova Scotia
New Brunswick Quebec Ontario
Manitoba Saskatchewan Alberta
British Columbia
Page 52
44
Table 4.3. The KPIs (95% CI) for OOPHE by Canadian province from 2010 to 2015.
Survey Year NL PE NS NB QC
2010 -0.139 (-0.087 to -
0.191)
-0.187 (-0.11 to -
0.264)
-0.195 (-0.141 to -
0.249)
-0.120 (-0.05 to -
0.190)
-0.112 (-0.062 to -
0.162)
2011 -0.170 (-0.116 to -
0.224)
-0.113 (-0.019 to -
0.207)
-0.161 (-0.087 to -
0.235)
-0.153 (-0.08 to -
0.226)
-0.128 (-0.072 to -
0.184)
2012 -0.212 (-0.131 to -
0.293)
-0.269 (-0.135 to -
0.403)
-0.096 (0.040 to -
0.231)
-0.177 (-0.098 to -
0.256)
-0.115 (-0.043 to -
0.187)
2013 -0.205 (-0.112 to -
0.298)
-0.149 (0.067 to -
0.365)
-0.153 (-0.071 to -
0.235)
-0.174 (-0.066 to -
0.282)
-0.109 (-0.042 to -
0.176)
2014 -0.188 (-0.092 to -
0.284)
-0.198 (-0.105 to -
0.291)
-0.202 (-0.099 to -
0.305)
-0.156 (-0.063 to -
0.249)
-0.110 (-0.039 to -
0.181)
2015 -0.122 (0.011 to -
0.255)
-0.121 (0.026 to -
0.268)
-0.165 (-0.081 to -
0.249)
-0.155 (-0.077 to -
0.233)
-0.176 (-0.123 to -
0.229)
Trend coefficients (P-value) -0.001 (0.916) 0.006 (0.734) -0.001 (0.936) -0.005 (0.341) -0.007 (0.273)
Survey Year ON MB SK AB BC
2010 -0.118 (-0.049 to -
0.187)
-0.173 (-0.112 to -
0.234)
-0.223 (-0.147 to -
0.299)
-0.110 (0.011 to -
0.231)
-0.071 (0.030 to -
0.173)
2011 -0.118 (-0.043 to -
0.193)
-0.153 (-0.08 to -
0.226)
-0.113 (-0.015 to -
0.211)
-0.089 (-0.013 to -
0.166)
-0.141 (-0.062 to -
0.220)
2012 -0.099 (-0.001 to -
0.198)
-0.110 (-0.021 to -
0.199)
-0.155 (-0.05 to -
0.260)
-0.077 (0.051 to -
0.204)
-0.218 (-0.105 to -
0.331)
2013 -0.124 (0.051 to -
0.299)
-0.131 (-0.05 to -
0.212)
-0.193 (-0.09 to -
0.296)
-0.126 (-0.014 to -
0.238)
-0.169 (-0.048 to -
0.290)
2014 -0.171 (-0.073 to -
0.269)
-0.159 (-0.018 to -
0.300)
-0.161 (-0.079 to -
0.243)
-0.150 (-0.067 to -
0.233)
-0.162 (-0.034 to -
0.290)
2015 -0.074 (0.038 to -
0.185)
-0.227 (-0.154 to -
0.300)
-0.134 (-0.031 to -
0.237)
-0.123 (-0.022 to -
0.224)
-0.119 (-0.025 to -
0.213)
Trend coefficients (P-value) 0.001 (0.910) -0.009 (0.417) 0.008 (0.492) -0.008 (0.209) -0.002 (0.6)
Note: Note: NL=Newfoundland, PE=Prince Edward Island, NS=Nova Scotia, NB=New Brunswick, QC=Quebec, ON=Ontario, MB=Manitoba,
SK=Saskatchewan, AB=Alberta, BC=British Columbia; CI=confidence interval
44
Page 53
45
4.4.3 Progressivity Analysis by Urban and Rural Regions
Table 4.4. reports the Gini coefficients, the Cs, and the KPIs for OOPHE from 2010 to
2015 by urban and rural regions of the country. Figure 4.3 illustrates the KPI trends for
both the urban and rural populations during the same period. According to the table, the
KPIs are negative for every year of the study in both urban and rural regions, indicating
regressivity of OOPHE from 2010 to 2015 regardless of urban or rural residential
location. The average KPI was lower for rural regions than urban regions from 2010 to
2015. This means that OOPHE in rural areas were more regressive on average than in
urban areas. The KPI trends for both urban (Trend coefficient=-0.004, P-value=0.284)
and rural (Trend coefficient=-0.002, P-value=0.896) regions do not suggest statistically
significant change in the KPI values over the study period.
Figure 4.3. The KPIs for OOPHE in Canada by urban and rural regions from 2010 to
2015.
-0.25
-0.2
-0.15
-0.1
-0.05
0
2010 2011 2012 2013 2014 2015
Th
e K
PI
Urban Rural
Page 54
46
Table 4.4. The Gini coefficients, Cs, and KPIs for OOPHE in Canada from 2010 to
2015 by urban and rural regions.
Survey
Year
Gini Coefficients
(95% CI)
Concentration Index
(95% CI) KPI (95% CI)
Urban
2010 0.396 (0.403 to 0.389) 0.283 (0.307 to 0.259) -0.113 (-0.073 to -0.153)
2011 0.39 (0.396 to 0.384) 0.271 (0.293 to 0.249) -0.119 (-0.076 to -0.162)
2012 0.392 (0.402 to 0.382) 0.283 (0.316 to 0.25) -0.11 (-0.06 to -0.16)
2013 0.393 (0.403 to 0.383) 0.245 (0.276 to 0.214) -0.148 (-0.097 to -0.199)
2014 0.393 (0.403 to 0.383) 0.254 (0.29 to 0.218) -0.139 (-0.084 to -0.194)
2015 0.387 (0.394 to 0.38) 0.264 (0.293 to 0.235) -0.123 (-0.067 to -0.179)
Trend
coefficients
(P-value)
-0.001 (0.197) -0.005 (0.173) -0.004 (0.284)
Rural
2010 0.399 (0.408 to 0.39) 0.273 (0.306 to 0.24) -0.126 (-0.043 to -0.209)
2011 0.377 (0.384 to 0.37) 0.242 (0.273 to 0.211) -0.136 (-0.082 to -0.19)
2012 0.402 (0.413 to 0.391) 0.183 (0.226 to 0.14) -0.219 (-0.127 to -0.311)
2013 0.403 (0.419 to 0.387) 0.319 (0.412 to 0.226) -0.084 (0.21 to -0.378)
2014 0.367 (0.378 to 0.356) 0.204 (0.245 to 0.163) -0.162 (-0.088 to -0.236)
2015 0.411 (0.423 to 0.399) 0.262 (0.299 to 0.225) -0.149 (-0.081 to -0.217)
Trend
coefficients
(P-value)
0.001 (0.856) -0.01 (0.946) -0.002 (0.896)
4.5 Concluding Remarks
This study aimed to measure the progressivity of OOPHE in Canada from 2010 to 2015.
Progressivity was measured for the total sample, by province, and by urban/rural
residential location. The total sample results indicated that OOPHE were regressive in
Canada from 2010 to 2015. This finding is consistent with other investigations of similar
OECD countries, which found that OOP payments tend to be regressive for jurisdictions
Page 55
47
with high-income economies (Hajizadeh et al., 2014; O’Donnell et al., 2008; Wagstaff et
al., 1992, 1999). There was a statistically significant decrease in the KPIs over time.
The provincial analyses indicated that OOPHE were regressive source of funding in all
provinces over the period studied. The provinces of Newfoundland and Labrador, Prince
Edward Island, Saskatchewan, Manitoba and Nova Scotia were found to have the lowest
average KPIs for the study period, whereas Alberta, Ontario, Quebec, and British
Columbia have the highest average KPIs. According to the 2011 Canadian Census,
Ontario, Quebec, Alberta, and British Columbia have the highest urban proportions of
their respective populations compared to the other provinces (Statistics Canada, 2011).
Although OOP payments were found to be regressive in all provinces throughout the
study period, these four provinces that had the highest urban population proportions also
had the lowest levels of regressivity. Conversely, Saskatchewan, Newfoundland, and
Prince Edward Island, which had the highest levels of regressivity of OOPHE, had
comparatively lower urban population proportions.
The urban and rural analyses demonstrated that OOPHE were regressive in urban and
rural residential regions, indicating that OOPHE were regressive in Canada regardless of
urban or rural residential location. The average KPI was lower for rural regions than
urban regions for the study period, indicating higher regressivity for OOPHE for rural
households than urban households. The time trends analysis suggested that there are no
significant changes in regressivity over time in rural and urban areas. Rural households
tend to have poorer social determinants of health and socio-economic indicators than their
urban counterparts (Ontario Ministry of Health and Long-Term Care, 2011; Romanow,
Page 56
48
2002), and these differences could account for the different levels of regressivity for
OOPHE for urban and rural regions of Canada.
Although this study found a statistically significant change in the regressivity over time
for the total sample, it did not find any significant changes for any of the stratified
analyses. Since the estimated values of KPI in the stratified samples did not indicate any
changes in the progressivity of OOPHE, it may be that between-group (across the
provinces and rural vs urban) variations in OOPHE contributed to the increasing trend in
the regressivity of OOPHE in Canada as whole. In other words, the proportional
contribution of residents of poor provinces (or rural areas) for the overall OOPHE may
have increased over time. This, in turn, led to the overall decrease in the regressivity of
the OOPHE in Canada.
Page 57
49
CHAPTER 5 ASSESSING CATASTROPHIC OUT-OF-POCKET
PAYMENTS FOR HEALTHCARE IN CANADA:
2010-2015
This chapter assesses catastrophic OOPHE made by Canadian households from 2010 to
2015. The chapter is organized as follows: Section 5.1 introduces the issue, Section 5.2
describes the data and variables used in the study, Section 5.3 describes the methods,
Section 5.4 presents the results, and Section 5.5 concludes the chapter.
5.1 Introduction
The equitable distribution of healthcare is an important political objective of many
governments throughout the world (Wagstaff et al., 1989, 1992). Fairness in healthcare
financial contribution, specifically protection against financial losses, is a common
challenge for universal healthcare systems (WHO, 2000, 2010). The unpredictable nature
of household OOPHE contributes to this universal challenge (Murray et al., 2000;
Wagstaff & van Doorslaer, 2000).
Healthcare payments can be unfair should households incur large OOP expenses (for
instance, prescription drug costs for cancer treatment) at the point of care that are not
covered under any insurance or pre-payment scheme. Households with a low-level ATP
are less like likely to be covered by private insurance than households that are more well
off financially (WHO, 2010), and are more likely to suffer devastating OOP payments as
a result. Minimizing OOP payments and relying mostly on insurance or pre-payment
schemes, while featuring progressive or proportionate payments, with respect to income,
Page 58
50
through a tax-based healthcare financing system can lead to equitable and effective
financing of a health system (WHO, 2000, 2010).
Inequitable distribution of healthcare finance contributions represents a troubling problem
for Canadians. The Canadian Institute of Health Information (CIHI) found that healthcare
expenditure contributions from the public and private sectors (i.e., healthcare
expenditures by households and private insurance companies) represent around a 70-30%
split of total annual health expenditures respectively (CIHI, 2016). OOP spending by
Canadian households represents the largest portion of private healthcare expenditures and
accounted for 14.2% of total healthcare expenditure in 2015 (CIHI, 2016).
Notwithstanding the benefit of Canada’s universal healthcare system, it is unclear what
kinds of OOPHE become catastrophic and which Canadians are most affected. Although
equity is considered an important policy objective of the Canadian healthcare system,
relatively few empirical studies have examined equity in healthcare financing in Canada.
More specifically, the incidence of catastrophic OOPHE in Canada has not been explored
in great detail. The purpose of this study is to measure the catastrophic OOPHE by
Canadians and assess which Canadians are incurring these catastrophic payments for
healthcare.
5.2 Data
The annual SHS datasets from 2010 to 2015 were used to investigate the incidence of
catastrophic OOPHE in Canada. Table 4.1 in Chapter 4 shows the number of households
surveyed across the study period. The overall sample consists of 33,367 Canadian
Page 59
51
households over 6 years. A time-trend analysis was performed similar to the one
completed in Chapter 4.
The SHS is an active survey that obtains detailed information about household spending
and is collected annually in the 10 Canadian provinces. The SHS typically collects
information across many categories of household expenditures including food,
transportation, clothing, shelter, healthcare and other expenditures to better understand
the spending habits of Canadian households. The variables total household current
consumption and direct OOPHE were provided by the SHS. Observations with missing
values in any of these variables were excluded in the calculations. Budget share was
calculated as the total household OOPHE divided by the total household current
consumption. All analyses were performed in STATA (StataCorp. 2015. Stata Statistical
Software: Release 14. College Station, TX: StataCorp LP.)
5.3 Methods
A consensus on a common or universal definition of catastrophic payments for healthcare
has not been reached in the literature. Studies have included thresholds ranging from 3%
of household budget share to 40% of capacity to pay (see Amaya-Lara, 2016; Caldbick et
al., 2015; Mataria et al., 2010; McLeod et al., 2011; Tomini et al., 2013; Wagstaff & van
Doorslaer, 2003; Xu et al., 2003). The WHO researchers and others have used 40% of
non-food expenditures (i.e. “capacity to pay”) on healthcare as a threshold (Mataria et al.,
2010; Xu et al., 2003), other studies used 10% budget share as a threshold for catastrophic
payments (Wagstaff & van Doorslaer, 2003). Canadian studies that have undertaken
investigations into equity in healthcare and pharmaceutical financing tend to use
Page 60
52
thresholds between 3% and 10% of household budget share. Furthermore, Statistics
Canada and other government agencies typically use 5% of household disposable income
as a threshold representing burden of OOP expenditures (Health Canada, 2011; Sanmartin
et al., 2014).
Although previous studies defined catastrophic health expenditure in different ways, it is
generally accepted that 10% of household consumption is the most accurate indicator of
catastrophic burden in households among developed countries (O’Donnell et al., 2008;
Wagstaff & van Doorslaer, 2003).
This study used budget share of health payments as a definition for catastrophic level of
OOPHE. Specifically, “catastrophic” OOPE are when an individual household’s budget
share exceeds a predetermined threshold. This study defined a catastrophic level of
financial burden as when household OOPHE reached 10 % of total current household
consumption. This threshold was deemed to be most representative of Canada’s economy
as a high-income. The proportion of households that exceeded this threshold was
calculated and the average household OOPHE for these household was computed.
Household consumption and household OOPHE have been equivalized to take into
account differences in household size, ensuring proper comparison (Hajizadeh et al.,
2014; O’Donnell et al., 2008). Similar to the OECD publications (e.g., OECD, 2008,
2011), the square root scale was used to equivalize household consumption and
household OOPHE.
Descriptive statistical analyses were performed to estimate the incidence of catastrophic
OOPHE in Canada as whole, by province and by urban/rural region. The catastrophic
Page 61
53
OOPHE were decomposed by type of catastrophic OOP payments: eyecare,
pharmaceutical drugs, dental goods and services, physician services, non-physician
services, and all other healthcare goods and services. All analyses utilized a sample
weight provided by Statistics Canada to ensure that the results are representative of the
respective population in Canada.
5.4 Results
5.4.1 Out-of-Pocket Health Expenditures for Canadians
Table 5.1 reports the mean equivalized OOPHE for the total and urban and rural
populations from 2010 to 2015. The time trend coefficients were also included in the
table.
Table 5.1. Mean equivalized OOPHE (C$) for total sample, urban and rural
households in Canada from 2010-2015
Survey Year Canada Urban Rural
Mean (SD) Mean (SD) Mean (SD)
2010 2928 (4625) 2981 (4688) 2750 (4404)
2011 2826 (3928) 2734 (3809) 3172 (4335)
2012 2767 (3900) 2778 (3993) 2730 (3572)
2013 2891 (5819) 2680 (3773) 3621 (10051)
2014 2669 (3956) 2647 (4143) 2737 (3311)
2015 2887 (4143) 2884 (4225) 2896 (3818)
Trend coefficients (P-value) -15.771 (0.555) -24.115 (0.490) 9.029 (0.929)
Note: SD=Standard Deviation
As reported in Table 5.1, the mean equivalized OOPHE for the total sample and urban
households dropped slightly over the first two years (from $2928 in 2010 to $2767 in 2012
for the total sample and from $2981 in 2010 to $2778 in 2012 for urban households) before
rising and leveling off over the reminder of the study period ($2887 in 2015 for the total
Page 62
54
sample, $2884 in 2015 for urban households). On average, the mean equivalized OOPHE
for rural households was higher than the urban or total sample populations from 2010 to
2015; rural households rose only slightly over the same period (from $2750 to $2896).
The trend analyses did not suggest significant trend in mean OOPHE in Canada and in
urban and rural regions separately over the study period.
Table 5.2 reports the mean equivalized OOPHE for each province from 2010 to 2015,
with the associated time trend coefficients results.
Table 5.2. Mean equivalized OOPHE (C$) by province in Canada from 2010 to 2015.
Survey Year NL PE NS NB QC
Mean (SD) Mean (SD) Mean (SD) Mean (SD) Mean (SD)
2010 2133 (2719) 2254 (2635) 2198 (2767) 2453 (4146) 2921 (3647)
2011 2148 (2429) 2601 (2888) 2557 (3822) 2325 (3400) 2582 (3063)
2012 1955 (2289) 2319 (2567) 2123 (2976) 2551 (3359) 2652 (3390)
2013 2323 (3015) 2589 (3618) 2406 (3026) 2156 (2910) 2740 (3429)
2014 1970 (2398) 2238 (2317) 1885 (2367) 2063 (2739) 2433 (3122)
2015 2163 (3795) 2163 (2425) 2299 (3020) 2157 (2875) 2803 (3031)
Trend coefficients
(P-value)
-0.457
(0.991)
-36.357
(0.481)
-35.086
(0.590)
-76.029
(0.090)
-27.114
(0.570)
Survey Year ON MB SK AB BC
Mean (SD) Mean (SD) Mean (SD) Mean (SD) Mean (SD)
2010 2731 (4168) 2569 (3461) 2714 (3980) 3283 (5526) 3704 (7020)
2011 2925 (4123) 2662 (3679) 2810 (4680) 2934 (4297) 3256 (4664)
2012 2701 (3627) 2375 (2888) 2507 (3332) 3073 (5678) 3408 (4477)
2013 3087 (8331) 2444 (3403) 2315 (3079) 2844 (3905) 3280 (4432)
2014 2589 (3478) 2829 (4232) 2733 (3245) 3183 (3913) 3274 (6569)
2015 2766 (4365) 2507 (3469) 3145 (4538) 3313 (4750) 3461 (5258)
Trend coefficients
(P-value)
-12.771
(0.800) 7.429 (0.873)
49.486
(0.525)
19.086
(0.721)
-36.826
(0.430)
Note: NL=Newfoundland, PE=Prince Edward Island, NS=Nova Scotia, NB=New Brunswick,
QC=Quebec, ON=Ontario, MB=Manitoba, SK=Saskatchewan, AB=Alberta, BC=British
Columbia; SD=Standard Deviation
Page 63
55
As reported in Table 5.2, the results did not indicate significant trends in mean
equivalized OOPHE for any specific province over the study period. In general, mean
OOPHE grow in the provinces as one moves from east to west across the country, with
British Columbia ($3461 in 2015) and Alberta ($3313 in 2015) having the highest mean
equivalized OOPHE and Newfoundland ($2163 in 2015) generally having the lowest.
5.4.2 Incidence of Catastrophic Out-of-Pocket Health Expenditures in Canada
Table 5.3 reports the proportion of households reaching the catastrophic threshold of 10%
of total current household consumption in Canada and by urban and rural regions from
2010 to 2015. Time trend coefficients were reported on the bottom of the table.
Table 5.3. Proportion of households reaching the 10% catastrophic level of OOPHE
in Canada from 2010 to 2015.
Survey Year
Canada Urban Rural
Proportion
(SD)
Proportion
(SD)
Proportion
(SD)
2010 0.07 (0.26) 0.07 (0.25) 0.09 (0.28)
2011 0.07 (0.25) 0.06 (0.23) 0.10 (0.30)
2012 0.05 (0.22) 0.05 (0.21) 0.07 (0.26)
2013 0.06 (0.24) 0.06 (0.23) 0.08 (0.27)
2014 0.06 (0.24) 0.06 (0.23) 0.07 (0.26)
2015 0.06 (0.25) 0.06 (0.23) 0.09 (0.29)
Trend coefficients (P-value) -0.001 (0.508) -0.001 (0.554) -0.002 (0.568)
From the table, there were no considerable changes in proportions of households with
catastrophic OOPHE for any of the three highlighted populations throughout the study
period. These results indicated that 5-7% of Canadian households affected by catastrophic
OOPHE over the study period. The proportion of households affected by catastrophic
Page 64
56
OOPHE was higher in rural households (7-10%) than urban households (5-7%) over the
period studied. The time series regression results did not suggest a significant trend in the
incidence of catastrophic OOPHE in Canada from 2010 to 2015. These trends are
demonstrated visually in Figure 5.1 below. The figure shows there is a substantial
difference between the proportion of rural households affected by catastrophic OOPHE
compared to the other study populations.
Figure 5.1. Proportion of households that reached the 10% catastrophic OOPHE
threshold for Canada, urban, and rural populations from 2010 to 2015.
Table 5.4 reports the proportion of households reaching the 10% catastrophic threshold
by province for 2010 to 2015. There are no considerable changes in the proportion of
household face catastrophic OOPHE in any of the provinces over the study period. As
one moves from east to west across the country, the proportion of households affected by
catastrophic OOPHE generally increases, with Newfoundland having the lowest and
British Columbia being the highest.
0
0.02
0.04
0.06
0.08
0.1
0.12
2010 2011 2012 2013 2014 2015
Pro
po
rtio
n o
f H
ouse
ho
lds
Total Sample Urban Rural
Page 65
57
Table 5.4. Proportion of households that reached the 10% catastrophic OOPHE
threshold in Canada by province from 2010 to 2015.
Survey Year
NL PE NS NB QC
Proportion
(SD)
Proportion
(SD)
Proportion
(SD)
Proportion
(SD)
Proportion
(SD)
2010 0.06 (0.23) 0.08 (0.27) 0.05 (0.23) 0.07 (0.26) 0.08 (0.28)
2011 0.05 (0.22) 0.09 (0.28) 0.08 (0.27) 0.07 (0.25) 0.08 (0.26)
2012 0.05 (0.21) 0.04 (0.19) 0.03 (0.18) 0.07 (0.26) 0.07 (0.26)
2013 0.05 (0.23) 0.09 (0.29) 0.07 (0.26) 0.08 (0.27) 0.07 (0.25)
2014 0.03 (0.18) 0.04 (0.19) 0.06 (0.24) 0.05 (0.22) 0.06 (0.23)
2015 0.05 (0.22) 0.04 (0.21) 0.06 (0.24) 0.05 (0.21) 0.09 (0.29)
Trend coefficients
(P-value)
-0.002
(0.439)
-0.007
(0.244)
0.000
(0.991)
-0.005
(0.175)
-0.001
(0.802)
Survey Year
ON MB SK AB BC
Proportion
(SD)
Proportion
(SD)
Proportion
(SD)
Proportion
(SD)
Proportion
(SD)
2010 0.06 (0.23) 0.09 (0.29) 0.1 (0.31) 0.06 (0.24) 0.11 (0.31)
2011 0.05 (0.22) 0.09 (0.29) 0.06 (0.25) 0.05 (0.21) 0.09 (0.29)
2012 0.03 (0.16) 0.05 (0.22) 0.05 (0.23) 0.05 (0.22) 0.08 (0.27)
2013 0.05 (0.22) 0.05 (0.21) 0.07 (0.26) 0.03 (0.18) 0.11 (0.31)
2014 0.06 (0.23) 0.07 (0.26) 0.07 (0.26) 0.06 (0.24) 0.09 (0.29)
2015 0.05 (0.21) 0.07 (0.25) 0.06 (0.24) 0.05 (0.22) 0.08 (0.27)
Trend coefficients
(P-value)
0.000
(0.998)
-0.005
(0.373)
-0.005
(0.29)
-0.001
(0.733)
-0.003
(0.358)
Note: NL=Newfoundland, PE=Prince Edward Island, NS=Nova Scotia, NB=New Brunswick,
QC=Quebec, ON=Ontario, MB=Manitoba, SK=Saskatchewan, AB=Alberta, BC=British
Columbia; SD=Standard Deviation
Figure 5.2 illustrates the proportion of households that had catastrophic OOPHE broken
down by Province from 2010 to 2015. There are a number of small fluctuations over the
study period, however there were no significant trends identified in any of the provinces.
The highest proportion of households that suffered catastrophic OOPHE during the study
period was 11% for British Columbia in 2013. The lowest proportion was 3% in
Newfoundland in 2014.
Page 66
58
Figure 5.2. Proportion of households that reached the 10% catastrophic OOPHE
threshold by province from 2010 to 2015.
5.4.4 Decomposition of Catastrophic Out-of-Pocket Healthcare Expenditures
Table 5.5 reports the mean equivalized catastrophic OOPHE for six different types of
OOPHE from 2010 to 2015, and the associated time trend coefficients results.
Pharmaceutical drugs and dental services were consistently the highest contributors to the
mean equivalized catastrophic OOPHE categories across the study period, whereas OOP
physician services was consistently the lowest category contributing to the mean
equivalized catastrophic OOPHE. There were no statistically significant changes in the
contribution of any of the OOP payment categories over time.
0
0.02
0.04
0.06
0.08
0.1
0.12
0.14
0.16
2010 2011 2012 2013 2014 2015
Pro
po
rtio
n o
f H
ouse
ho
lds
wit
h C
atas
tro
phic
OO
PH
E
Newfoundland and Labrador Prince Edward Island Nova Scotia
New Brunswick Quebec Ontario
Manitoba Saskatchewan Alberta
British Columbia
Page 67
59
Table 5.5. Mean equivalized catastrophic OOPHE (C$) by payment type in Canada
from 2010 to 2015.
Survey
Year Eyecare
Pharmaceutical
Drugs Dental Physician
Non-
physician Other
Mean (SD) Mean (SD) Mean (SD) Mean (SD) Mean (SD) Mean (SD)
2010 422 (883) 4082 (5738) 1277 (2616) 114 (815) 612 (2099) 660 (3498)
2011 374 (760) 3763 (3896) 1489 (3324) 185 (1196) 436 (1338) 643 (2524)
2012 341 (631) 3335 (3792) 1687 (2633) 307 (1734) 626 (2432) 766 (3313)
2013 700 (1787) 5973 (18091) 1374 (1854) 109 (590) 351 (1562) 910 (3917)
2014 707 (1535) 3194 (3099) 1635 (2818) 114 (677) 735 (4827) 447 (3283)
2015 645 (1064) 3025 (3059) 1623 (2903) 258 (1653) 586 (1847) 748 (3818)
Trend
coefficients
(P-value)
70.657
(0.070) -124.40 (0.684) 53 (0.200)
8.826
(0.712)
14.057
(0.721)
-0.114
(0.998)
Figure 5.3 demonstrates the proportion of mean catastrophic OOPHE by healthcare OOP
payment type for the years 2010 to 2015. From the figure, it is clear that Pharmaceutical
drugs and dental services represent the largest proportions of mean catastrophic OOPHE.
Specifically, pharmaceutical drugs represented 44-63% and dental services represented
between 15-24% of total mean equivalized catastrophic OOPHE from 2010 to 2015
respectively.
Page 68
60
Figure 5.3. Proportion of mean equivalized catastrophic OOPHE (%) by healthcare
payment type in Canada from 2010 to 2015.
Figures 5.4 and 5.5 highlight the proportion of mean equivalized OOPHE by OOP
healthcare payment type for urban and rural regions respectively. Eyecare (12-16%),
dental (22-25%), and non-physician services (8-10%) represented higher proportions of
mean equivalized OOPHE in urban households than rural households. The contribution of
pharmaceutical drugs to mean OOPHE was proportionately higher in in rural households
(54-68%) than urban households (45-52%). There was no discernable difference between
urban and rural households in the physician and other OOP categories.
0.0
20.0
40.0
60.0
80.0
100.0
2010 2011 2012 2013 2014 2015
Pro
po
rtio
n o
f M
ean C
atas
tro
phic
OO
PH
E
Eyecare Pharmaceutical Drugs Dental Physician Non-physician Other
Page 69
61
Figure 5.4. Proportion of mean equivalized catastrophic OOPHE (%) by healthcare
payment type for urban households in Canada from 2010 to 2015.
Figure 5.5. Proportion of mean equivalized catastrophic OOPHE (%) by healthcare
payment type for rural households in Canada from 2010 to 2015.
0.0
20.0
40.0
60.0
80.0
100.0
2010 2011 2012 2013 2014 2015
Pro
po
rtio
n o
f M
ean C
atas
tro
phic
OO
PH
E
Eyecare Pharmaceutical Drugs Dental Physician Non-physician Other
0.0
20.0
40.0
60.0
80.0
100.0
2010 2011 2012 2013 2014 2015
Pro
po
rtio
n o
f M
ean C
atas
tro
phic
OO
PH
E
Eyecare Pharmaceutical Drugs Dental Physician Non-physician Other
Page 70
62
5.5 Concluding Remarks
This study assessed catastrophic OOPHE (as measured by reaching the 10% of household
total household current consumption) made by Canadians from 2010 to 2015.
Catastrophic OOPHE were measured for Canada as whole, by province, by urban/rural
residential location. The catastrophic OOPHE also decomposed by type of catastrophic
OOP payments.
The results suggested that the mean OOPHE dropped slightly over the first two years
before rising and leveling off over the reminder of the study period. There was no
significant trend in mean OOPHE from 2010 to 2015. These findings are not generally
consistent with other investigations of OOPHE in Canada, which found that OOPHE
increased from 1997 to 2009 (Sanmartin et al., 2014). There were also no significant
trends in mean OOPHE for any specific province over the study period. Approximately,
mean OOPHE grow in the provinces as one moves from east to west across the country,
with British Columbia and Alberta having the highest mean OOPHE and Newfoundland
having the lowest. There were also no significant trends in mean OOPHE in urban and
rural regions over the study period.
The proportion of households that incurred catastrophic OOPHE was 5-7% in Canada as
whole, 5-7% for urban households, and 7-10% for rural households. The proportion of
households affected by catastrophic OOPHE was higher for rural households than urban
households. These findings are generally expected given the differences between urban
and rural households in terms of socioeconomic and social determinants of health
(Ontario Ministry of Health and Long-Term Care [OMHLTC], 2011; Romanow, 2002).
Page 71
63
Rural households tend to have lower average household income and ultimately lower
abilities to afford healthcare services not covered by public insurance (OMHLTC, 2011).
Poorer health status, poorer health behaviours, and decreased utilization of healthcare
services are all associated more strongly with rural households than their urban
counterparts (Sibley & Weiner, 2011). These factors can lead to lower health status in
rural compared to urban households, which ultimately lead to higher healthcare need in
rural areas. The higher utilization of healthcare services when coupled with a reduced
ability to finance these services can lead to catastrophic OOPHE.
Pharmaceutical drugs (44-63%) and dental services (15-24%) were the most prominent
categories that contributed to the mean equivalized catastrophic OOPHE in Canada.
Eyecare, dental, and non-physician services contributed more to the mean catastrophic
OOPHE among urban households than rural households. Pharmaceutical drugs were
contributed proportionately more to the mean catastrophic OOPHE in rural households
(54-68%) than urban households (45-52%).
As mentioned in the methods Section, Canadian studies used thresholds of 3-10%
household budget share to examine catastrophic healthcare and pharmaceutical drug
payments. This study used the generally accepted threshold of 10% of the current
household consumption (budget share) in the developed countries to assess the
catastrophic OOPHE. Additional analyses were also conducted using thresholds of 3%
and 5% of total current household consumption. These results are reported in Appendix 2.
Using the 5% threshold suggest that 18-22% of Canadian households incurring
catastrophic OOPHE between 2010 and 2015. When the lowers threshold of 3% was used
34-38% of Canadian households faced catastrophic OOPHE. The different thresholds
Page 72
64
provided qualitatively the same trend results as the main threshold of 10%. In other
words, neither the 3% threshold (Trend coefficient=-0.003, P-value=0.448) nor the 5%
threshold (Trend coefficient=-0.005, P-value=0.118) did not highlight any significant
change in the proportion of catastrophic OOPHE over the study period.
Page 73
65
CHAPTER 6 DISCUSSION AND CONCLUSIONS
This thesis contains two cross-sectional analyses of equity in healthcare financing, with
particular regard for OOPHE made by Canadians. The first empirical analysis assessed
the progressivity of OOPHE by Canadian households from 2010 to 2015, while the
second analysis examined mean OOPHE and proportion of households affected by
catastrophic OOPHE by Canadians over the same period. This chapter discusses and
concludes the results of these two empirical studies.
The results from the first empirical analysis of progressivity of OOPHE indicated that
OOPHE were regressive in Canada from 2010 to 2015. In other words, more well-off
Canadians pay proportionately less than their less well-off counterparts in OOP payments
to finance their respective healthcare needs. Contrary to Canada’s healthcare financing
mandate, Canadian households do not finance healthcare through OOP payments based
on their ATP. From 2010 to 2015, the regressivity increased significantly in Canada. The
finding of regressivity across the study period is consistent with other investigations of
similar OECD countries, which found that OOP payments tend to be regressive for
jurisdictions with high-income economies (Hajizadeh et al., 2014; O’Donnell et al., 2008;
Wagstaff et al., 1992, 1999). OOPHE in Canada from 2010 to 2015 (-0.118 to -0.225)
were found to be more regressive than direct payments for healthcare in Australia in
2003-04 (-0.0975) and 2009-10 (-0.0535) (Hajizadeh et al., 2014). OOPHE in Canada
were also more regressive than total OOP payments in Portugal in 2010-11 (-0.074)
(Quintal & Lopes, 2016), but not quite as regressive as in Kenya in 2006-07 (-0.31)
(Munge & Briggs, 2014). Although analyses of progressivity of healthcare financing in
other OECD countries is now dated in comparison, the regressivity of OOPHE in Canada
Page 74
66
were found to be generally similar to those levels found in Denmark, Finland, France,
Netherlands, Sweden, and Switzerland (Wagstaff et al., 1999). Comparison between these
findings should be taken with caution because of the differences in study dates. With
consistently regressive OOPHE and significant growth in regressivity in recent years,
these findings are concerning. The WHO (2000, 2010) has reported that OOPHE act as a
barrier to accessing different types of healthcare. These findings suggest that care that
falls outside of “medically necessary” hospital and physician services is inequitably
financed by lower income Canadian households compared to more well-off households.
Access to prescription drugs, dental care, and eyecare will reasonably be affected by
those Canadians who cannot afford these services.
When analyzed by provinces, the results indicated that OOPHE were regressive in every
province for every year of the study period. In other words, OOPHE were regressive in
Canada regardless of province. Prince Edward Island, Newfoundland and Labrador,
Saskatchewan, and Nova Scotia had the lowest average KPIs (and therefore highest
average regressivity) for the study period, indicating the higher levels of regressivity
compared to the other provinces. Conversely, Alberta, Ontario, Quebec, and British
Columbia showed the highest average KPIs (and therefore lowest average regressivity)
amongst the provinces. There were no statistically significant trends in the regressivity of
OOPHE for all provinces over the study period. The relatively close values of regressivity
across the individual provinces is an interesting finding in its own right. Provinces have
full discretion to enact public policy regarding coverage of healthcare goods and services
outside of those covered under Medicare (Law et al., 2013). For example, in the absence
of a national pharmacare plan, a province may choose to cover a certain sub-population
Page 75
67
for certain drugs. Daw and Morgan (2012) conducted a national review of provincial
pharmacare policies and found coverage for seniors to be varied across the provinces,
while several provinces enacted age-irrelevant catastrophic income-based coverage. It
appears that regardless of individual discretion of enact equitable public policy or the
creation of income-based coverage, OOPHE remains regressive in every province.
OOPHE were found to be regressive source of funding in Canada regardless of urban and
rural residential location from 2010 to 2015. The average KPI was lower for rural regions
than urban regions for the study period, indicating higher regressivity for OOPHE for
rural households than urban households. Interestingly, the four provinces that had the
lowest (highest) levels of regressivity were also the provinces that have the highest
(lowest) urban populations proportions. It is possible that higher proportion of rural
residents in these provinces could have a negative effect on the progressivity of OOPHE
in these provinces because rural households tend to have poorer social determinants of
health and socio-economic indicators than their urban counterparts (OMHLTC, 2011;
Romanow, 2002).
Since the estimated values of KPI in the provincial and urban/rural samples did not
indicate any significant changes in the progressivity of OOPHE, it may be that between-
group (across the provinces and rural vs urban) variations in OOPHE contributed to the
finding of an increasing trend in the regressivity of OOPHE in Canada as whole, but not
in individual provinces or urban/rural regions. Taken together, the results suggest that the
proportional contribution of residents of poor provinces (or rural areas) may be increasing
in comparison to the more well-off provinces.
Page 76
68
The second empirical study examined catastrophic OOPHE made by Canadians from
2010 to 2015. This study found that the mean OOPHE dropped slightly over the first two
years before rising and leveling off over the reminder of the study period. There was no
significant trend in mean OOPHE over the study period. These findings are not generally
consistent with other investigations of OOPHE in Canada, which found that OOPHE
increased from 1997 to 2009 (Sanmartin et al., 2014) and growth in private payments for
healthcare was mainly driven from dental services and pharmaceutical drugs (Law et al.,
2013).
Although there were no significant trends in the mean OOPHE for any specific province
over the study period, the results highlighted a variation in the mean OOPHE across
provinces with British Columbia and Alberta having the highest mean equivalized
OOPHE and Newfoundland having the lowest. Using a threshold of 10% of current total
household consumption as an indication of catastrophic healthcare spending the study
suggested that 5-7% of households in Canada faced catastrophic OOPHE over the study
period. There was no significant trend in the proportion of households affected by
catastrophic OOPHE over the study period.
Although both urban and rural households suffer very similar levels of mean catastrophic
OOPHE from 2010 to 2015, rural households were found to have a consistently higher
proportion of households affected by catastrophic OOPHE than urban households. Rural
Canadian households tend to have lower total household income and any OOPHE would
therefore represent a higher proportion of a given rural household’s disposable income
(Caldbick et al., 2015; Sanmartin et al., 2014). The results also suggested a variation in
the proportion of households affected by catastrophic OOPHE across provinces. The
Page 77
69
highest proportion of households that suffered catastrophic OOPHE during the study
period was 11% for British Columbia in 2013. The lowest proportion was 3% in
Newfoundland in 2014.
The decomposition of mean catastrophic OOPHE were into six different categories of
healthcare OOP payment showed that pharmaceutical drugs and dental services
represented the largest proportion of the mean OOPHE for Canadian households
compared to the other categories. The contribution of eyecare, dental, and non-physician
services to the mean OOPHE were higher in urban than rural households. Conversely, the
contribution of pharmaceutical drugs to the mean OOPHE were higher for rural
households than urban households. These findings are also consistent with previous
empirical studies that have highlighted the burden of pharmaceutical drugs and dental
services to Canadian households in the form of catastrophic OOPHE (Caldbick et al.,
2015; Law et al., 2013; McLeod et al., 2011). Pharmaceutical drug coverage is a major
source of public scrutiny among politicians and policy makers in Canada. Prescription
drugs are inconsistently covered under patchworks of public insurance coverage that, as
the current study and others have shown, represent a major source of inequity of
healthcare financing that disproportionately affects those Canadians from poorer
households (Caldbick et al., 2015; Law et al., 2013; McLeod et al., 2011). Although
different provinces have individually attempted to extend coverage to certain
subpopulations within their jurisdictions (Caldbick et al., 2015; McLeod et al., 2011),
catastrophic OOPHE related to pharmaceutical drugs expenses have continued to rise.
The results of this study have important implications for policymakers at the federal and
provincial levels. The regressivity of OOPHE at the national and provincial levels provide
Page 78
70
evidence in support of policy reform that enhances financial risk protection for
Canadians. Since catastrophic OOPHE primarily affect low-income and rural Canadian
households, policies to enhance risk protection among these specific population (e.g. the
expansion of government-subsidized health insurance for non-Medicare services) are
required to improve equity in healthcare financing in Canada.
The empirical studies in this thesis have certain limitations. First, both empirical chapters
utilized six years of data from the SHS because the data before 2010 is not comparable to
the recent available SHSs. The trend analyses findings would have been more robust if
there were more comparable SHSs. Second, the Canadian territories (Yukon, Northwest
Territories, and Nunavut) were excluded from the SHS 2010 to 2014, thus the two studies
in this thesis do not examine progressivity and catastrophic payments of OOPHE in the
territories. The results of this thesis can be expanded to the territories in the future studies
as the SHS began to collect information from the Canadian territories starting from SHS
2015. Third, it is worth restating that this study focused on OOPHE only. Future, studies
could be expanded to look at the equity in other healthcare funding sources such as health
insurance, general tax payments and etc.
This thesis contributes one piece of evidence to a growing body of literature on healthcare
equity in Canada. Since equity in healthcare financing is one part of this body of
literature, this study should be combined with studies on equity in healthcare utilization
for the country and individual provinces in order to provide a complete picture of equity
in healthcare in Canada.
Page 79
71
References
Allin, S. (2008). Does Equity in Healthcare Use Vary across Canadian Provinces?
Healthc Policy, 3(4), 83–99.
Amaya-Lara, J. L. (2016). Catastrophic expenditure due to out-of-pocket health payments
and its determinants in Colombian households. International Journal for Equity in
Health, 15(1), 1–11.
Atanasova, E., Pavlova, M., Moutafova, E., Rechel, B., & Groot, W. (2013). Out-of-
pocket payments for health care services in Bulgaria: Financial burden and barrier to
access. European Journal of Public Health, 23(6), 916–922.
Bump, J. B. (2015). The Long Road to Universal Health Coverage: Historical Analysis of
Early Decisions in Germany, the United Kingdom, and the United States. Health
Systems & Reform, 1(1), 28–38.
Caldbick, S., Wu, X., Lynch, T., Al-Khatib, N., Andkhoie, M., & Farag, M. (2015). The
financial burden of out of pocket prescription drug expenses in Canada.
International Journal of Health Economics and Management, 15(3), 329–338.
Canadian Institute for Health Information. (2016). National Health Expenditure Trends ,
1975 to 2016. Canadian Institute for Health Information Report (Vol. 36).
Cantor, J. (1988). The burden of financing health care in the United States. Baltimore:
John Hopkins School of Hygiene and Public Health.
Carone, G., Schwierz, C., & Xavier, A. (2012). Cost-containment policies in public
pharmaceutical spending in the EU. Economic and Financial Affairs.
Culyer, A. J., & Wagstaff, A. (1993). Equity and equality in health and health care.
Journal of Health Economics, 12(4), 431–457.
Page 80
72
Daw, J. R., & Morgan, S. G. (2012). Stitching the gaps in the Canadian public drug
coverage patchwork? A review of provincial pharmacare policy changes from 2000
to 2010. Health Policy, 104(1), 19–26.
De Mello-Sampayo, F., & De Sousa-Vale, S. (2014). Financing health care expenditure in
the OECD countries: Evidence from a heterogeneous, cross-sectional dependent
panel. Panoeconomicus, 61(2), 207–225.
Deaton, A., & Grosh, M. E. (2000). Designing Household Survey Questionnaire for
Developing Countries. Designing Household Survey Questionnaires for developing
countries: Lessons from fifteen years of LSMS experience.
Gerdtham, U. G., & Sundberg, G. (1998). Redistributive effects of Swedish health care
finance. International Journal of Health Planning and Management, 13(4), 289–
306.
Government of Canada. Constitution Act, 1867 (1867). Canada. Retrieved from
http://laws.justice.gc.ca/eng/Const/Const_index.html
Government of Canada. Canada Health Act: R.S.C., 1985, c. C-6, Government of Canada
§ (1985). Canada. Retrieved from http://laws-lois.justice.gc.ca/eng/acts/C-6/page-
1.html
Government of Canada SC. (2009). Survey of household spending (SHS). Ottawa,
Ontario: Statistics Canada.
Grigorakis, N., Floros, C., Tsangari, H., & Tsoukatos, E. (2016). Out of pocket payments
and social health insurance for private hospital care: Evidence from Greece. Health
Policy, 120(8), 948–959.
Hajizadeh, M. (2017). Does socioeconomic status affect lengthy wait time in Canada?
Evidence from Canadian Community Health Surveys. European Journal of Health
Page 81
73
Economics, 19(3), 369-383.
Hajizadeh, M., & Connelly, L. B. (2010). Equity of health care financing in Iran: the
effect of extending health insurance to the uninsured. Oxford Development Studies,
38(4), 461–476.
Hajizadeh, M., Connelly, L. B., & Butler, J. R. G. (2014). Health policy and equity of
health care financing in australia: 1973-2010. Review of Income and Wealth.
Hajizadeh, M., & Nghiem, H. S. (2011). Out-of-pocket expenditures for hospital care in
Iran: Who is at risk of incurring catastrophic payments? International Journal of
Health Care Finance and Economics, 11(4), 267–285.
Health Canada. (2011). Healthy Canadians 2010 - A Federal Report on Comparable
Health Indicators. Ottawa, Ontario.
Holahan, J., & Zedlewski, S. (1992). Who pays for health care in the United States?
Implications for health system reform. Inquiry, 29(2), 231–248.
Hurst, J. W. (1985). Financing Health Services in the United States, Canada and Britain:
Nuffield/Leverhulme Fellowship Report. London: King Edward’s Hospital Fund for
London.
Kakwani, N. C. (1977). Measurement of Tax Progressivity: An International Comparison.
The Economic Journal The Economic Journal, 87(87), 7–80.
Kakwani, N., Wagstaff, A., & van Doorslaer, E. (1997). Socioeconomic inequalities in
health: Measurement, computation, and statistical inference. Journal of
Econometrics, 77(1), 87–103.
Lambert, P. J. (1993). The distribution and redistribution of income: A mathematical
analysis. Manchester: Manchester University Press.
Law, M. R., Cheng, L., Dhalla, I. A., Heard, D., & Morgan, S. G. (2012). The effect of
Page 82
74
cost on adherence to prescription medications in Canada. CMAJ, 184(3), 297–302.
Law, M. R., Daw, J. R., Cheng, L., & Morgan, S. G. (2013). Growth in private payments
for health care by Canadian households. Health Policy, 110(2–3), 141–146.
Lee, A., & Morgan, S. (2017). Cost-related nonadherence to prescribed medicines among
older Canadians in 2014: a cross-sectional analysis of a telephone survey. CMAJ
Open, 5(1), E40–E44.
Lee, W. Y., & Shaw, I. (2014). The Impact of Out-of-Pocket Payments on Health Care
Inequity: The Case of National Health Insurance in South Korea. International
Journal of Environmental Research and Public Health, 11(7), 7304–7318.
Marchildon, G. P. (2014). The three dimensions of universal Medicare in Canada.
Canadian Public Administration, 57(3), 362–382.
Marchildon, G. P., & Allin, S. (2016). The Public-Private Mix in the Delivery of Health-
Care Services: Its Relevance for Lower-Income Canadians. Global Social Welfare,
3(3), 161–170.
Martin, D., Miller, A. P., Quesnel-Vallée, A., Caron, N. R., Vissandjée, B., &
Marchildon, G. P. (2018). Canada’s universal health-care system: achieving its
potential. The Lancet, 391, 1718–1735.
Mataria, A., Raad, F., Abu-Zaineh, M., & Donaldson, C. (2010). Catastrophic healthcare
payments and impoverishment in the occupied palestinian territory. Applied Health
Economics and Health Policy, 8(6), 393–405.
McGrail, K. (2007). Medicare Financing and Redistribution in British Columbia, 1992
and 2002. Healthcare Policy/Politiques de Sante, 2(4), 123–137.
McLachlan, G., & Maynard, A. (1982). The public/private mix in health care: the
relevance and effects of change. In G. McLachan & A. Maynard (Eds.), The
Page 83
75
Public/Private Mix in Health Care: the Relevance and Effects of Change (p. 565).
London: Nuffield Provincial Hospitals Trust.
McLeod, L., Bereza, B. G., Shim, M., & Grootendorst, P. (2011). Financial burden of
household out-of-pocket expenditures for prescription drugs: cross-sectional analysis
based on national survey data. Open Medicine : A Peer-Reviewed, Independent,
Open-Access Journal, 5(1), e1-9.
Molla, A. A., & Chi, C. (2017). Who pays for healthcare in Bangladesh? An analysis of
progressivity in health systems financing. International Journal for Equity in Health,
16(1), 167.
Mooney, G. H. (2003). Economics, Medicine and Health Care (3rd editon). Financial
Times Prentice Hall.
Morgan, S. G., Law, M., Daw, J. R., Abraham, L., & Martin, D. (2015). Estimated cost of
universal public coverage of prescription drugs in Canada. CMAJ, 187(7), 491–497.
Morgan, S. G., & Lee, A. (2017). Cost-related non-adherence to prescribed medicines
among older adults: A cross-sectional analysis of a survey in 11 developed countries.
BMJ Open, 7(1).
Munge, K., & Briggs, A. H. (2014). The progressivity of health-care financing in Kenya.
Health Policy and Planning, 29(7), 912–920.
Murray, C. J. L., Knaul, F., Musgrove, P., Xu, K., & Kawabata, K. (2000). Defining and
measuring fairness in financial contribution to the health system (GPE Discussion
Paper Series No. 24).
O’Donnell, O., Doorslaer, E. van, Wagstaff, A., & Lindelow, M. (2008). Analyzing
Health Equity Using Household Survey Data: A Guide to Techniques and Their
Implementation. The World Bank.
Page 84
76
O’Donnell, O., van Doorslaer, E., Rannan-Eliya, R. P., Somanathan, A., Adhikari, S. R.,
Akkazieva, B., … Zhao, Y. (2008). Who pays for health care in Asia? Journal of
Health Economics, 27(2), 460–475.
OECD. (2008). Growing Unequal?: Income Distribution and Poverty in OECD
Countries. (OECD, Ed.), Distribution. The Organisation for Economic Cooperation
and Development Publishing.
OECD. (2011). Divided We Stand - Special Focus: Inequality in Emerging Economies
(EE’s). Divided We Stand: Why Inequality Keeps Rising, 47–82.
Onah, M. N., & Govender, V. (2014). Out-of-pocket payments, health care access and
utilisation in south-eastern Nigeria: A gender perspective. PLoS ONE, 9(4).
Ontario Ministry of Health and Long-Term Care. (2011). Rural and Northern Health
Care Report. Retrieved from
http://www.health.gov.on.ca/en/public/programs/ruralnorthern/report.aspx
Quintal, C., & Lopes, J. (2016). Equity in health care financing in Portugal: Findings
from the Household Budget Survey 2010/2011. Health Economics, Policy and Law.
Rasell, E., Bernstein, J., & Tang, K. (1994). The impact of health care financing on
family budgets. Int J Health Serv, 24(4), 691–714.
Romanow, R. (2002). Building on Values: The Future of Health Care in Canada.
Commission on the Future of Health Care in Canada.
Sanmartin, C., Hennessy, D., Lu, Y., & Law, M. R. (2014). Trends in out-of-pocket
health care expenditures in Canada, by household income, 1997 to 2009. Health
Reports, 25(4), 13–17.
Sibley, L. M., & Weiner, J. P. (2011). An evaluation of access to health care services
along the rural-urban continuum in Canada. BMC Health Services Research, 11:12.
Page 85
77
Somkotra, T., & Lagrada, L. P. (2008). Payments for health care and its effect on
catastrophe and impoverishment: Experience from the transition to Universal
Coverage in Thailand. Social Science and Medicine, 67(12), 2027–2035.
Statistics Canada. (2011). Population, urban and rural, by province and territory (Canada)
[Table]. Ottawa, Ontario: Statistics Canada. Retrieved from
https://www.statcan.gc.ca/tables-tableaux/sum-som/l01/cst01/demo62a-eng.htm
Statistics Canada. (2012). Note of Users of Data from the 2010 Survey of Household
Spending. Statistics Canada. Retrieved from
https://www150.statcan.gc.ca/n1/en/pub/62f0026m/62f0026m2012002-
eng.pdf?st=8vXhgdBE
Statistics Canada. (2017). User Guide for the Survey of Household Spending, 2016.
Household Expenditures Research Paper Series.
Tomini, S. M., Packard, T. G., & Tomini, F. (2013). Catastrophic and impoverishing
effects of out-of-pocket payments for health care in Albania: Evidence from Albania
Living Standards Measurement Surveys 2002, 2005 and 2008. Health Policy and
Planning, 28(4), 419–428.
Van Doorslaer, E., Clarke, P., Savage, E., & Hall, J. (2008). Horizontal inequities in
Australia’s mixed public/private health care system. Health Policy, 86(1), 97–108.
Van Doorslaer, E., O’Donnell, O., Rannan-Eliya, R. P., Somanathan, A., Adhikari, S. R.,
Garg, C. C., … Zhao, Y. (2007). Catastrophic payments for health care in Asia.
Health Economics, 16(11), 1159–1184.
Wagstaff, A., Flores, G., Hsu, J., Smitz, M. F., Chepynoga, K., Buisman, L. R., …
Eozenou, P. (2017). Progress on catastrophic health spending in 133 countries: A
retrospective observational study. The Lancet Global Health, 6(2), PE169-E179
Page 86
78
Wagstaff, A., Flores, G., Smitz, M. F., Hsu, J., Chepynoga, K., & Eozenou, P. (2017).
Progress on impoverishing health spending in 122 countries: A retrospective
observational study. The Lancet Global Health, 6(2), PE180-E192.
Wagstaff, A., & van Doorslaer, E. (2003). Catastrophe and impoverishment in paying for
health care: With applications to Vietnam 1993-1998. Health Economics, 12(11),
921–934.
Wagstaff, A., & Van Doorslaer, E. (2000). Equity in health care finance and delivery. In
Handbook of Health Economics (Vol. 1, pp. 1803–1857).
Wagstaff, A., van Doorslaer, E., Calonge, S., Christiansen, T., Gerfin, M., Gottschalk, P.,
… Nolan, B. (1992). Equity in the finance of health care: some international
comparisons. Journal of Health Economics, 11, 361–387.
Wagstaff, A., van Doorslaer, E., & Paci, P. (1989). Equity in the finance and delivery of
health care: Some tentative cross-country comparisons. Oxford Review of Economic
Policy, 5(1), 89–112.
Wagstaff, A., Van Doorslaer, E., Van Der Burg, H., Calonge, S., Christiansen, T., Citoni,
G., .. Winkelhake, O. (1999). Equity in the finance of health care: Some further
international comparisons. Journal of Health Economics, 18(3):263-90.
WHO. (2010). Health Systems Financing: The path to universal coverage. The World
Health Report, 1–128.
World Health Organization. (2000). The World Health Report 2000 - Health Systems:
Improving performance. Bulletin of the World Health Organization (Vol. 78).
Xu, K., Evans, D. B., Kawabata, K., Zeramdini, R., Klavus, J., & Murray, C. J. L. (2003).
Household catastrophic health expenditure: A multicountry analysis. Lancet,
362(9378), 111–117.
Page 87
79
Yu, C. P., Whynes, D. K., & Sach, T. H. (2006). Assessing progressivity of out-of-pocket
payment: With illustration to Malaysia. International Journal of Health Planning
and Management, 21(3), 193–210.
Yu, C. P., Whynes, D. K., & Sach, T. H. (2008). Equity in health care financing: The case
of Malaysia. International Journal for Equity in Health, 7(1), 15.
Page 88
80
APPENDIX 1 – The Gini Coefficients, Cs, and KPIs for OOPHE from 1998 to 2015
Survey
Year
Gini Coefficients
(SE)
Concentration
Indices (SE)
Kakwani Progressivity
Indices (SE)
1998 0.4120 (-0.0019) 0.3250 (-0.00685) -0.086 (-0.0129)
1999 0.4090 (-0.00157) 0.3370 (-0.00675) -0.073 (-0.0152)
2000 0.4140 (-0.00194) 0.3110 (-0.00649) -0.103 (-0.0111)
2001 0.4150 (-0.00193) 0.3190 (-0.00624) -0.096 (-0.0115)
2002 0.4170 (-0.002) 0.3380 (-0.00814) -0.079 (-0.0172)
2003 0.4210 (-0.00175) 0.3340 (-0.0066) -0.087 (-0.0134)
2004 0.4250 (-0.00212) 0.3360 (-0.00677) -0.089 (-0.0137)
2005 0.4210 (-0.00193) 0.3310 (-0.00676) -0.090 (-0.0121)
2006 0.4270 (-0.00211) 0.3490 (-0.00748) -0.078 (-0.0139)
2007 0.4190 (-0.00208) 0.3170 (-0.00668) -0.102 (-0.0115)
2008 0.4230 (-0.00293) 0.3390 (-0.0114) -0.084 (-0.0245)
2009 0.4200 (-0.00255) 0.3410 (-0.00861) -0.080 (-0.0168)
2010 0.3990 (-0.00285) 0.2810 (-0.00984) -0.118 (-0.0183)
2011 0.3880 (-0.00256) 0.2610 (-0.00933) -0.127 (-0.0181)
2012 0.3950 (-0.00386) 0.2590 (-0.0133) -0.136 (-0.0226)
2013 0.3960 (-0.00426) 0.2580 (-0.0191) -0.138 (-0.0414)
2014 0.3890 (-0.004) 0.2390 (-0.0144) -0.151 (-0.0231)
2015 0.4420 (-0.00454) 0.2170 (-0.0122) -0.225 (-0.0237)
Trend coefficients Coefficients P-value
1998 to 2009 0.0001 0.905
2010 to 2015 -0.0174 0.036
Note: SE=Standard Error
Page 89
81
APPENDIX 2 – Catastrophic OOPHE analyses for the 5% and 3% of total current
household consumption thresholds
Survey Year
Proportion of
Households
Reaching 10%
Catastrophic
Threshold
Proportion of
Households
Reaching 5%
Catastrophic
Threshold
Proportion of
Households
Reaching 3%
Catastrophic
Threshold
2010 0.073 0.222 0.384
2011 0.065 0.205 0.372
2012 0.052 0.179 0.368
2013 0.063 0.198 0.359
2014 0.062 0.202 0.343
2015 0.064 0.200 0.367
Trend coefficients (P-
value) -0.001 (0.508) -0.003 (0.448) -0.005 (0.118)