Page 1
Global Journal of Agricultural Research
Vol.9, No4, pp.1-24, 2021
Print ISSN: 2053-5805(Print),
Online ISSN: 2053-5813(Online)
1 ECRTD-UK-https://www.eajournals.org/ https://doi.org/10.37745/gjar.2013
ASSESSING RISK PERCEPTION AND DETERMINANTS OF BRANDING AS A RISK
MITIGATION TOOL AMONG RICE PRODUCERS IN GHANA
Edinam Fred Degboe
St. Francis College of Education, Hohoe, Ghana
Nicholas Oppong Mensah,
University of Energy and Natural Resources, Department of Agricultural Economics
Agribusiness and Extension, Sunyani, Ghana
Jeffery Kofi Asare
University of Energy and Natural Resources, Department of Agricultural Economics
Agribusiness and Extension, Sunyani, Ghana
Tekuni Nakuja
University of Energy and Natural Resources, Department of Agricultural Economics
Agribusiness and Extension, Sunyani, Ghana
Frank Osei Tutu
University of Energy and Natural Resources, Department of Agricultural Economics
Agribusiness and Extension, Sunyani, Ghana
ABSTRACT: Rice is remains an important crop in Africa, which serves as food for a large
percentage Africa’s population and has the potential to help reduce poverty and alleviate food
insecurity. Educating farmers to increase competitiveness via branding will help mitigate risk
and increase farmers income. This study accesses risk perception and analyse branding as a risk
mitigation tool among rice producers in the Volta Region of Ghana. The study relied on a
structured question to elicit response from 395 rice producers via convenience and purposive
sampling. Ordinary least square (OLS) was used to analyse effect of branding on local rice
producer’s risk and factor analysis was used to examine perception of risk faced by rice
producers. Branding was found to decrease producers risk whiles variety in prices and type of
rice produced increases producers risk. Hence the study recommends that effective branding can
be used as a risk mitigation tool for rice farmers.
KEY WORDS: branding, risk mitigation, risk perception, OLS regression, factor analysis
INTRODUCTION
Agriculture is the most risk sensitive venture globally (African Development Bank, 2016).The
risk in agriculture is even higher in developing countries, especially in Africa due to the effects
Page 2
Global Journal of Agricultural Research
Vol.9, No4, pp.1-24, 2021
Print ISSN: 2053-5805(Print),
Online ISSN: 2053-5813(Online)
2 ECRTD-UK-https://www.eajournals.org/ https://doi.org/10.37745/gjar.2013
of climate change and the sector’s over dependence on rain-fed agriculture (Oppong-Kyeremeh
and Bannor2018). Due to low productivity, industrialization and adverse human activities, it is
not surprising that climate change has become a significant threat to the future agriculture and
agribusiness. Studies reveal that, crop yield declines can be attributed to climate change, which
is a major source of production risk (Adnan et al., 2020), this has placed immense strain on
national and global food security (Tong et al., 2019; Lobell et al., 2011). Apparently, rice
producers who face these risk, also have to deal with competition of imported rice which has
contributed to the dwindling domestic demand of local rice supplies (MoFA 2018; IFFPRI , 2020)
(refer to figure 2). Agricultural risk can be classified into five forms namely: environmental,
production, marketing, financial and human capital risk (Adnan et al., 2020).Besides, other
sources of risk in agriculture are pests and diseases, extreme weather conditions and occurrences
of natural disasters (Ullah et al. 2015; McNeil et al., 2015; Rizwan et al., 2020). The incapacity
of the producer to estimate input prices as well as the selling prices of agricultural goods is
referred to as market risk (Harariková, 2018). Farmers are confronted with numerous risks.
However majority of these hazards are unknown to smallholder farmers prior to the start of the
farming season, but they are expected based on their perceptions and previous experiences (Mgale
and Yunxian, 2021).
Agriculture remains the backbone of Ghana’s economy via its employment and GDP contribution
(Arthur et al., 2011; Anang et al., 2020) Nonetheless, the sector is characterized by small holder
farmers that are saddled with many constraints preventing them from effectively increasing their
participation in markets. These include insecure rights to land, inadequate access to quality inputs,
credit access, and minimal support from extension, research services, and high cost of transaction
caused by poor rural infrastructure (FAO 2012).
According to Tomlins et al. (2005), rice has been described as one of the essential foods in many
nations in West Africa.Tomlins et al., (2005) further reveals that, rice functions as an essential
and accessible food for indigenous Ghanaians. Hence, if well managed, the sector has the
tendency of providing employment chances particularly in the local towns, consequently easing
the socio-economic pressure in the big cities. Government of Ghana has put in place various plans
and policies in order to augment rice cultivation and supplies in the country (FAO, 2006).
The National Rice Development Strategy (NRDS) was announced in 2008 to increase local rice
cultivation by one hundred percent so as to reduce the adverse effect imported rice possess on
Ghana’s economy. In spite of the government efforts to double rice cultivation in the country,
buyer desire for locally produced rice still remains discouraging (Alhassan et al., 2015).However
it is worth noting that rice has the second per capita consumption among cereals in Ghana. Besides
due to rapid increase in urban population, per capita consumption of rice is expected to rise from
24 kilograms per person to 68 kilograms per person (MOFA, 2015; Kwofie et al., 2016; Ehiakpor
et al., 2017). Surprisingly, only 35% of locally produced rice is consumed in the country while
Page 3
Global Journal of Agricultural Research
Vol.9, No4, pp.1-24, 2021
Print ISSN: 2053-5805(Print),
Online ISSN: 2053-5813(Online)
3 ECRTD-UK-https://www.eajournals.org/ https://doi.org/10.37745/gjar.2013
65% of the countries rice consumption is met by imported rice(Boansi and Favour 2015). This
gives glaring evidence that consumers do not prefer locally produced rice. The questions arise,
why is demand for local rice still low and what possible risk does farmers face when their rice is
not purchased by consumers? According to Andam et al., (2019) local rice sold on the market is
segmented into, namely: branded and unbranded rice. Branded rice is supplied by relatively large-
scale companies which are sold super markets and mini marts for very good prices. This shows
that small scale farmers who produce local rice can make sales when they brand their rice.
However they lack the knowledge and expertise to brand their rice. A study by Quarshie and
Fraser indicates that 88% of rice farmers are unable to adopt modern technologies. This shows
that the average small scale farmer might not brand his rice. Thus, it predisposes farmers to great
risk of selling at low prices or eventually experiencing postharvest losses which has immense
effect on their profitability. Alemu (2019) revealed that in developed countries actors in
commodity value chains utilize effective branding in marketing agricultural products and
strengthening competiveness in the market. On the other hand, farmers and other important value
chain actors in Africa has scant knowledge on branding tools, thus branding as an agricultural
marketing tool is underutilized. Consequently branding as a risk mitigation tool has also not been
utilized. Against this backdrop, it necessitates a research on branding in agriculture. Specifically
study bridges the gap between rice production and rice branding as a risk mitigation tool for small
scale farmers in a developing country, Ghana. The study aims to bring to light the relevance of
branding to rice farmers and aid them understanding why branding can help them reduce these
risk and augment sales and profit. Moreover policy makers can rely on this study to redirect tailor
made policies and resources to educate farmers about branding. Several studies have investigated
how farmers deal with risk (Fahad et al., 2018; Ahmad et al., 2019; Rizwan et al., 2020; Mgale
and Yunxian 2021). However to the best of author’s knowledge no empirical study has examined
branding as a risk mitigation tool for rice farmers. Above and beyond, this leaves a significant
research gap which this study seeks to fill.To address this lacuna, the objective of this paper is in
twofold: 1.To determines risk perception of rice producers, 2. To analyse the effect of
determinants of branding on producers risk. Besides
LITERATURE REVIEW
Brief Overview of Rice Production in Ghana
OryzaGlaberima and Oryza sativa are the two main rice varieties grown in Ghana.Rain-fed,
irrigated paddies, upland, lowland, deep water, and tidal wetlands are the six main habitats in
which rice is grown. Formal records of certified seed production disclosed that authorized seed
production over the past years has been dominated by three varieties: Jasmine 85, GR 18, and
Togo Marshall (recording 91 percent of certified seed production) (Ragasaet al., 2013). Rice
production accounts for roughly 19 percent of total cereal production in Ghana. Between 2000
and 2010, the number of hectares used for rice production increased from 0.09 to 0.16 million
hectares, with productivity ranging from 1.7 to 2.7 tons per hectare (FAOSTAT, 2017).
Page 4
Global Journal of Agricultural Research
Vol.9, No4, pp.1-24, 2021
Print ISSN: 2053-5805(Print),
Online ISSN: 2053-5813(Online)
4 ECRTD-UK-https://www.eajournals.org/ https://doi.org/10.37745/gjar.2013
Furthermore production increased over 100% between 2007 and 2010, rising from 185,000 tons
in 2007 to 491,600 tons in 2010with a mean annual growth rate of about 15% between 2005 and
2010 despite a drop in production in 2007, from 237,000 tons in 2005 to 185,000 tons in 2007
(SRID, 2011).Consequently, production increased in 2019 to about 963,000 tons. Since then,
there has been an estimated annual growth of 6.9 percent per annum in rice production across the
country (IFPRI, 2020). Although there has been considerable increase in production, domestic
rice supply and consumption is still low, this calls for attention and research on the contributing
factors of low local rice supplies in the country. Figure 1 and 2 respectively show production of
rice and yields in Ghana from 2009-2019 and Domestic rice supply in Ghana and their sources
between 2012-2018
Figure 1: Production of rice and yields in Ghana from 2009-2019
Source:MoFA-IFPRI Market Brief No. 2 | April 2020
Available at: https://doi.org/10.2499/p15738coll2.133697
Page 5
Global Journal of Agricultural Research
Vol.9, No4, pp.1-24, 2021
Print ISSN: 2053-5805(Print),
Online ISSN: 2053-5813(Online)
5 ECRTD-UK-https://www.eajournals.org/ https://doi.org/10.37745/gjar.2013
Figure 2: Domestic rice supply in Ghana and their sources 2012-2018
Source:MoFA-IFPRI Market Brief No. 2 | April 2020
Available at:https://doi.org/10.2499/p15738coll2.133697
The concept of Branding
Branding is by far one of the most significant modules of marketing. It is a term used to define
the name, description and design of a product that is being offered for sale. (Ikporah, 2012).
Perreault and McCarthy (2002) see branding as the use of a name, term, symbol or design or a
blend of these to recognize a product. In addition, it is the use of a unique name and mark on a
product to distinguish it from related ones. Arens (2002) identifies branding as a basic
differentiation device for all products. It comprises name, words, symbols, or designs that identify
the product and its source and differentiates it from competing products.A robust brandbrings
value to the consumer and therefore is expected to build financial value to the company
over time. Thus, the brand is an intangible financial asset for the business that controls
it(Bobby et al., 2019).
Agricultural risk
Agriculture is a highly riskyventure mostly due to its high dependence on rain fed production. A
review of literature reveals that agriculture risk has been discussed and grouped into different
types. Economic Research Service (2018) reported on production risk, which involves occurrence
of droughts, flood, tornados, other weather-related risks and pest and diseases. Broll, Welzel, and
Page 6
Global Journal of Agricultural Research
Vol.9, No4, pp.1-24, 2021
Print ISSN: 2053-5805(Print),
Online ISSN: 2053-5813(Online)
6 ECRTD-UK-https://www.eajournals.org/ https://doi.org/10.37745/gjar.2013
Pong Wong (2013) revealed other types in agriculture such as price and supply risk. Other studies
gave insight on market and economic risks which include risks related to buying and selling an
agricultural product on the market, such as market price fluctuation. Generally agricultural risk
can be classified into five forms namely: environmental, production, marketing, financial and
human capital risk, all other risk are embedded in these types of risk which has been outlined.
(Adnan et al., 2020). In this study we assess farmers risk perception of institutional risk, price and
production risk and political related risk.
Risk mitigation
The possible deviation between expected and actual outcomes is what is known as risk.. There
are several risks and uncertainties in agriculture which can be diverse. These agricultural related
risks predispose farmers, especially rice producers to several challenges such lack of ready
market. Hence, it is dependent on the farmers to find innovative ways to mitigate these risks. Risk
management for an individual farmer entails determining the best mix of activities with
unpredictable outcomes and varying amounts of expected returns (Aimin, 2010). According to
Holzmann and Jorgensen (2001) risk management strategies can be classified into three. These
are risk reduction (involves reducing the probability that an uncertain event that can affect the
farmers welfare negatively occurs), mitigation (deals with reduction of the negative effects on
this farmer’s welfare once it occurs) and coping (entails dealing with the event once it has
happened and usually means reducing consumption). Nonetheless, Amevenku (2019) argues that
diversification should be used as a mitigation strategy. More so (Mensah et al., 2017, 2021) also
argue that agricultural insurance can be used as a means to mitigate and transfer risk. No study
has used branding as a risk mitigation strategy. Hence this study seeks to investigate how branding
can be used to mitigate risk.
MATERIALS AND METHODS
Study area
The study was conducted in Hohoe Municipality in the VoltaRegion of Ghana. The Hohoe
municipality is one of the largest municipalities in Volta Region of Ghana. In 2014 the
municipality had a population of about 187,028, 84, with majority (87%) of the population
residing in rural areas. The municipality is characterized by rice farmers with most of them mainly
into subsistence farming (Oseiet al., (2015). A high numberof the residents are involved in
commodity value chain activities such as production, wholesaling, retailing and petty trading
(Ghana statistical service, 2010)
Page 7
Global Journal of Agricultural Research
Vol.9, No4, pp.1-24, 2021
Print ISSN: 2053-5805(Print),
Online ISSN: 2053-5813(Online)
7 ECRTD-UK-https://www.eajournals.org/ https://doi.org/10.37745/gjar.2013
Figure 3: Map of the study area
Source: Authors construct, with ArcMap
Sampling procedure and sample size
The study's respondents were chosen via convenient sampling approach. This non probability
sampling technique was used because respondents for the study were accessible and available
(Sedgwick 2013). Volta region was purposely selected because of the intensity of local rice
production in the area (Jarhet.al., 2020).In addition Hohoe, Lolobi and Akpafu were purposively
selected from the Hohoe Municipality, these areas were chosen due to the high presence of rice
value chain actors, especially producers (Kwarteng et al., 2003). In total we conveniently selected
400 rice producers in the study area. However out of the 400 questionnaires sent on the field 5
questionnaires were not completed leaving 395 questionnaires for cleaning, coding, data entry
and analysis. In reference to central limit theory a sample size greater than or equal to 30 is
accurate enough for a standard normal deviation (Mensah, et al., 2020), indicating that the sample
size is appropriate for the statistical analysis. Responses were elicited through questionnaire
Page 8
Global Journal of Agricultural Research
Vol.9, No4, pp.1-24, 2021
Print ISSN: 2053-5805(Print),
Online ISSN: 2053-5813(Online)
8 ECRTD-UK-https://www.eajournals.org/ https://doi.org/10.37745/gjar.2013
administration and focused group discussions, with key informants and experienced rice
producers. Before questionnaire administration commenced, pretesting was done in order to fine
tune the questionnaire for final data collection. Further reconnaissance study was made to
introduce respondents to the concept of branding and risk mitigation; this gave depth of
understanding to respondents, which made them further appreciate the concept of branding. A
period of one month was used for data collection, commencing from 5th may 2020 to 5th June
2020. A team of data collection experts were trained to translate English to the producers’ local
dialect, (Ewe) so that farmers would really understand questions posed from the questionnaire.
Lastly, data was coded and entered into Microsoft Excel 19 whiles Stata 15 software was used
for analysing the data.
Method of Data Analysis
Descriptive statistics presented in (frequencies and percentages) were used to analyse socio
economic characteristics of producers as well as brand of rice produced and producers perception
of risk. To achieve the objective of risk perception among rice producers, they were asked to rank
several questions on perception which was measured via the use of a five point likert scale which
ranges from (1= extremely agree, 2=agree, 3= neutral, 4= disagree and 5=extremely disagree).
Rizwan et al., (2020) employed a similar technique. Factor analysis was further employed to
extract the main risk factors local rice producer face (See tables A1-A5 for specific details). In
addition, this study used ordinary least squares regression to estimate the relationship between
branding and risk of producers. The ordinary least squares (OLS) regression has been adopted by
several studies (Sefcik and Thompson, 1986; Adjasi and Osei, 2007; Uadiale, 2010; Ajayi and
Oke, 2012; Antwi et al., 2013; Verter and Bečvářová, 2016) and was hence adopted in this study.
The OLS model for risk of producers is specified as;
RiskPro = β0
+ β1
Brandi + β2
Varpxi + β3
Expi + β4
Protypei + β5
Loci + β6
Inci + β7
Educi + εi
Where;
RiskPro = producer’s risk
Brand = branding of local rice
Varpx= Variety in prices of local rice
Exp= Work experience of producers
Protype= Type of local rice produced
Loc = Location
Varsold = Variety of local rice retailed
Educ = Education
Inc = Income
Age = Age
Employ = Employment Status
HHsize= Household size
Page 9
Global Journal of Agricultural Research
Vol.9, No4, pp.1-24, 2021
Print ISSN: 2053-5805(Print),
Online ISSN: 2053-5813(Online)
9 ECRTD-UK-https://www.eajournals.org/ https://doi.org/10.37745/gjar.2013
𝑖 = individual observation
β = the parameters to be estimated
ε = Error term
Table 1: Description of variables used for analysis Variable Description Measurement A prior
expectation
Relevant literature
Socio demographic
factors
Education Number of year spent in school Continuous + Buabeng (2015)
Experience Years of experience in rice
production
Continuous + Rizwanet al., (2020)
Location 1= Hohoe
2=Apkafu
3=Lolobi
Categorical - Buabeng (2015)
Income
Income in Ghana cedis Continuous -/+ Buabeng (2015)
Branding factors
Type of rice
produced
1=Jasmine
2=Togo Marshal
3= Agra-Cri
4=Gino
Categorical -/+ Bannor et al., (2017)
Branding Do you brand your rice
1=Yes
0= No
Dummy -/+ Anholt (2007)
Srinivasan (2018)
Variety in prices Are there varieties in prices with
respect to rice brand?
1=Yes 0= No
Dummy -/+ Gunawan et al.,(2019)
Source: field survey, 2020
Table 2:Summery statistics for risk perception variables used for factor analysis Variable Mean Std. dev Minimum Maximum
Variability in Price 1.37 0.5056 1 3
Interest rate 1.37 0.4852 1 2
Excess rainfall 1.54 0.7577 1 4
Deficit in rainfall 1.45 0.6093 1 4
Pest and diseases 1.47 0.8221 1 5
Changes in Technology 1.31 0.5449 1 3
Competition 2.22 0.9596 1 5
Low demand for product 2.15 0.9468 1 5
Political situation 2.27 0.8391 1 4
Government laws 1.4 0.6816 1 4
Hired labour 2.14 0.8411 1 4
Source: field survey,2020
Page 10
Global Journal of Agricultural Research
Vol.9, No4, pp.1-24, 2021
Print ISSN: 2053-5805(Print),
Online ISSN: 2053-5813(Online)
10 ECRTD-UK-https://www.eajournals.org/ https://doi.org/10.37745/gjar.2013
Table 3: Summery statistics for entire sample
Variable Mean Std. dev Minimum Maximum
Gender 1.44 0.499 0 1
Age 32.45 12.761 25 65
Household number 4.521 3.131 1 10
Education level 7.157895 0.725 3 16
Income 31381.42 126984.6 500 10000
Religion 2.10 0.402 1 4
Marital status 1.94 0.499 1 3
Location 1.83 0.233 1 3
Branding 1.93 0.410 0 1
Variety in prices 1.76 0.718 0 1
Experience 5.231 3.626 1 15
Type rice of produced 1.81 0.321 1 2
Source: field
survey,2020
RESULTS AND DISCUSSIONS
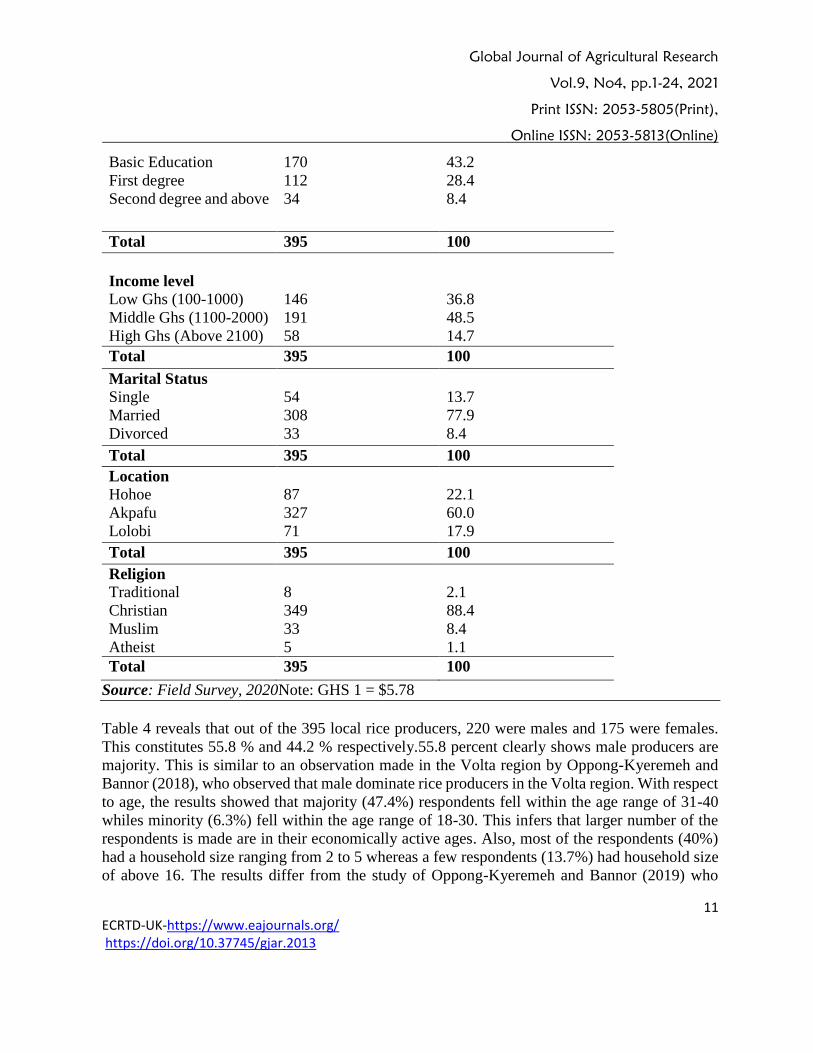
Table 4: Demographic and Socio-economic Characteristics of Local Rice Producers
Variables Frequency(N=395) Percentage (100%)
Sex
Male 220 55.8
Female 175 44.2
Total 395 100
Age
18-30 25 6.3
31-40 187 47.4
41-50 146 36.8
51 and above 37 9.5
Total 395 100
Household size
2-5 158 40.0
6-10 154 38.9
11-15 29 7.4
16 and above 54 13.7
Total 395 100
Education
No basic education 79 20
Page 11
Global Journal of Agricultural Research
Vol.9, No4, pp.1-24, 2021
Print ISSN: 2053-5805(Print),
Online ISSN: 2053-5813(Online)
11 ECRTD-UK-https://www.eajournals.org/ https://doi.org/10.37745/gjar.2013
Basic Education 170 43.2
First degree 112 28.4
Second degree and above 34 8.4
Total 395 100
Income level
Low Ghs (100-1000) 146 36.8
Middle Ghs (1100-2000) 191 48.5
High Ghs (Above 2100) 58 14.7
Total 395 100
Marital Status
Single 54 13.7
Married 308 77.9
Divorced 33 8.4
Total 395 100
Location
Hohoe 87 22.1
Akpafu 327 60.0
Lolobi 71 17.9
Total 395 100
Religion
Traditional 8 2.1
Christian 349 88.4
Muslim 33 8.4
Atheist 5 1.1
Total 395 100
Source: Field Survey, 2020Note: GHS 1 = $5.78
Table 4 reveals that out of the 395 local rice producers, 220 were males and 175 were females.
This constitutes 55.8 % and 44.2 % respectively.55.8 percent clearly shows male producers are
majority. This is similar to an observation made in the Volta region by Oppong-Kyeremeh and
Bannor (2018), who observed that male dominate rice producers in the Volta region. With respect
to age, the results showed that majority (47.4%) respondents fell within the age range of 31-40
whiles minority (6.3%) fell within the age range of 18-30. This infers that larger number of the
respondents is made are in their economically active ages. Also, most of the respondents (40%)
had a household size ranging from 2 to 5 whereas a few respondents (13.7%) had household size
of above 16. The results differ from the study of Oppong-Kyeremeh and Bannor (2019) who
Page 12
Global Journal of Agricultural Research
Vol.9, No4, pp.1-24, 2021
Print ISSN: 2053-5805(Print),
Online ISSN: 2053-5813(Online)
12 ECRTD-UK-https://www.eajournals.org/ https://doi.org/10.37745/gjar.2013
observed a mean household size of six, among rice producing households. Also, a greater number
(43.2%) of the local rice producers had their basic education; whereas a minority (8.4%) had a
second degree. This implies that majority of respondents have formal education, hence when if
they are educated about branding they will understand and utilize the concept to improve their
rice production business. The results correlate with (Ojo et al., 2020). Most respondents (48.5%)
were middle-income earners (Ghs1100-2000; $190.46-346.30) whiles a small number (14.7%)
were high income earners (above Ghs 2100; $ 363.61) as shown in the table 4.0. In furtherance
many of the local rice producers that were sampled lived in Akpafu and most of the local rice
producers were Christians.
Table 5: Brand of rice produced by farmers in the study area
Brand Frequency(N) Percentage (%)
Jasmine 100 25.3
Togo Marshal 200 50.5
AGRA-CRI 33 8.4
Gino 62 15.8
Total 395 100
Source: Field Survey, 2020
Table 5 shows that there is a preponderance of the Togo Marshall variety over all varieties of rice
produced by farmers in the Hohoe Municipality. The farmers explained that they cultivate Togo
Marshal’s rice because the rice variety is relatively high yielding and can withstand bad weather
such as deficiency of rain and its high resistant to pests and diseases. This is followed by Jasmine
rice (25.3%), AGRA-CRI 8.4 (%) and then the improved long grain rice, Gino (15.8%).
Perception of risk faced by local rice producers
Descriptive statistics (percentages and frequencies were used to analyse producers perception on
risk. In addition, following the studies of (Iqbala 2017; Opoku et al., 2020; Mensah et al., 2021)
factor analysis was employed to extract the main risk factors local rice producers face (See tables
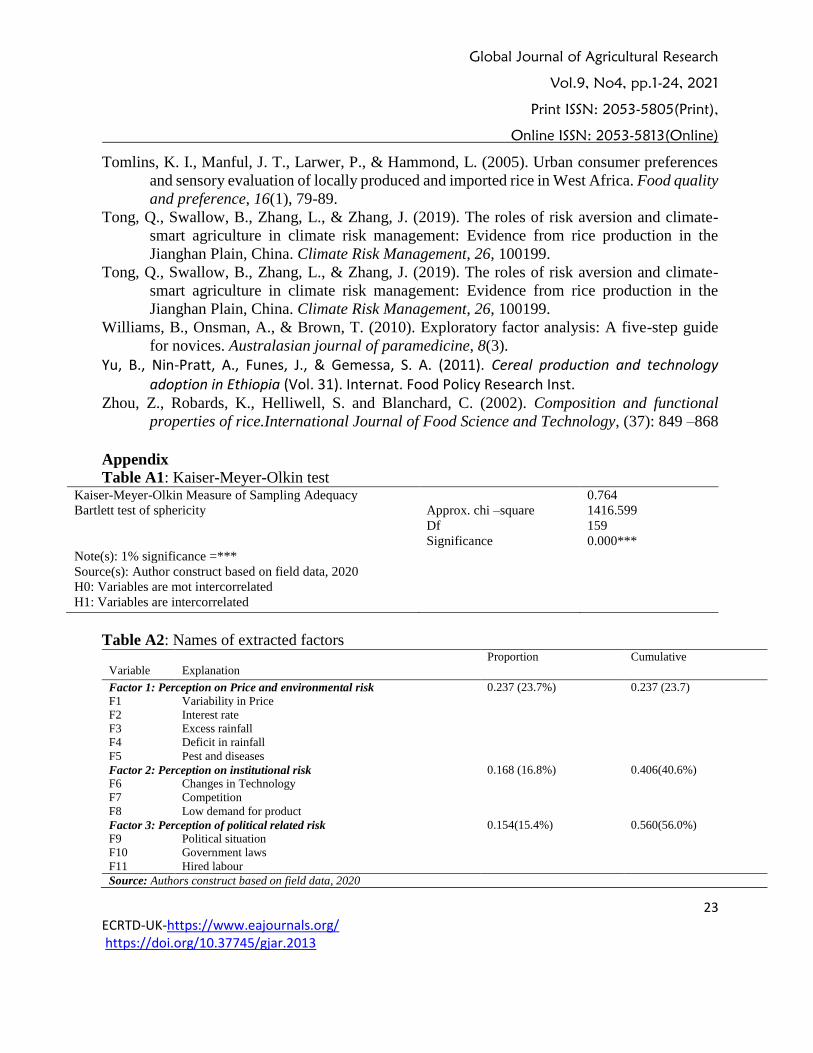
A1-A5 for more specific details). Also Cronbach’s alpha was computed to access if the eleven
items which were summed to create risk perception score of producers, formed a reliable scale.
Specifically the Cronbach’s alpha value computed was 0.88 (refer to tables A4 for more specific
details).This shows that the items form a scale of reasonable internal consistency reliability. Three
main factors namely (perception on price and production risk, perception on institutional risk and
perception of political related risk) were extracted using the cutoff point of 0.60for factor loadings
(refer to table A3 for more specific details). Williams et al., (2010) and Stevens (2002) indicated
that items with factor loading of at least 0.40 are acceptable; besides other empirical studies
(Opoku et al., 2020; Mensah et al., 2021) used 0.60 as cut of point. Hence the use of 0.60 in this
study is adequate.
Page 13
Global Journal of Agricultural Research
Vol.9, No4, pp.1-24, 2021
Print ISSN: 2053-5805(Print),
Online ISSN: 2053-5813(Online)
13 ECRTD-UK-https://www.eajournals.org/ https://doi.org/10.37745/gjar.2013
Table (6): Perception of risk faced by local rice producers
Variable
Explanation
Extremely
agree
Agree
Neutral
Disagree
Extremely
disagree
Perception on price and production risk
F1 Variability in prices increase risk 188(47.5) 88(22.1) 99(25.3) 12(3.2) 8(1.1)
F2 High interest rate increase risk 125(31.6) 157(38.9) 88(22.1) 21(5.3) 4(1.1)
F3 Excess rainfall increases risk 63 (15.8) 108(27.5) 129(32.6) 62(15.8) 33(8.4)
F4 Deficit in rainfall increase risk 270(68.4) 117(29.5) 4(1.1) 2(0.55) 2(0.55)
F5 Pest and diseases increase risk 262(66.3) 91(23.2) 26 (6.3) 8(2.1) 8(2.1)
Perception on institutional risk
F6 Changes in Technology increase risk 259(65.3) 116(29.5) 4(1.1) 4(1.1) 12(3.2)
F7 Competition among producers increase risk 287(72.6) 92(23.2) 8(2.1) 4(1.1) 4(1.1)
F8 Low demand for product increase risk 175(44.2) 183(46.3) 17(4.2) 8(2.1) 12(3.2)
Perception of political related risk
F9 Political situation (instability) increases risk 126(31.6) 71(17.9) 97(24.2) 92(23.2) 9(3.2)
F10 Government laws (policy) increases risk 79(20.0) 104(26.3) 104(26.3) 100(25.3) 8(2.1)
F11 Strict Labour laws increase risk
263(66.3) 112(28.4) 12(3.2) 4(1.1) 4(1.1)
Source: Field Survey, 2020
Perception on price and production risk Analysis of results from table (6) indicates 188 rice producers extremely agreed to the risk
perception “Variability in prices increase risk price increase risk” whiles only 8 rice producers
indicated extremely disagree to the said statement. This suggests that majority of the respondents
are in agreement. If the price of rice varies, it poses a great risk to local rice producers, because
the rice varieties they produce are usually processed with traditional methods and are less desired.
It corresponds to a study by Chaudhary et al., (2015) who found price risks as one of main sources
of risk for farmers in Northern Ghana. Results revealed that 157 farmers (38.9%) agreed to the
perception of high interest rate posing a great risk to farmers whiles only 4 rice producers (1.1%)
of the respondents extremely disagreed. High interest rate connotes high payment of loans or
credit by farmers, which can reduce their profit and restrain them from producing at competitive
price, hence posing a negative risk on rice producers. Similarly, Hardaker (2004) noted that
financial risk occurs when there are unexpected changes or increase in the interest rate on loans.
He further revealed that farmers may face risk of inaccessibility of loans or high interest rates.
Also results from table shows that 129 rice producers were neutral about the question. “Excess
rainfall increase risk” whereas 33 rice producers disagreed. A plausible reason is that, rice
production thrives in waterlogged conditions, and in Africa especially Ghana where rice
production is rain fed (Oppong-Kyeremeh and Bannor 2018), farmers are uncertain if excess
rainfall poses a risk to rice production, when rice needs higher amounts of rainfall to thrive.
Nonetheless, a few farmers were of the view that excess rainfall can be a risk to rice production.
This is in contrast with an observation made by Mahmood et al. (2012) who specified that increase
in rainfall pattern has negative impact on rice productivity. Furthermore, (270) of the producers
indicated deficit in rainfall is a risk to their rice production venture whiles (2) farmers extremely
disagreed. Deficit in rainfall can be detrimental to rice producers because; generally every plant
Page 14
Global Journal of Agricultural Research
Vol.9, No4, pp.1-24, 2021
Print ISSN: 2053-5805(Print),
Online ISSN: 2053-5813(Online)
14 ECRTD-UK-https://www.eajournals.org/ https://doi.org/10.37745/gjar.2013
requires some amount of water to be able to grow well, however rice needs water in higher
amounts because it thrives on relatively high amount of water, hence if there is deficit in rainfall,
rice may not be able to survive. In Ghana where rice production is mostly rainfed, deficit in
rainfall easily affects production. The results match with the findings of(Subash and Gangwar,
2014), which is in agreement with this perception. With the statement “Pest and diseases increase
risk,” 262 farmers extremely agreed, but 8 farmers disagreed. The results correlate with the study
of (Choudhary et al., 2015). Similarly Kouame and Komenan (2012) ranked this type of risk
among the top two sources of risk in agriculture.
Perception on institutional risk
With respect to institutional risk faced by rice farmers, analysis from table (6) indicates that 259
rice producers (65.3%) indicated they extremely agree to the perception “changes in technology
increases risk “whereas 4 farmers were neutral. In contrast Several studies (Yu et al., 2011;
Barrett, 2007; Diao and Hazell, 2004) have shown that agricultural technology adoption does not
only reduce the level of poverty but also benefits farmers in terms of generating output market
for crop producers. However, in developing countries, it is very difficult to get access to improved
technology due to the unavailability of funds for peasant rice producers. This poses a challenge
to the local famers as they are unable to compete with the imported rice brands given the
technological changes. Moreover, a colossal number (287) of farmers extremely agreed to the
statement “Competition among producers increase risk” whiles four (4) farmers extremely
disagreed. Producers of local rice are often faced with strong competitive forces especially from
their affluent peers and commercial farmers who are financially capable to invest and use new
methods to process rice. Thus, the local rice producers who are relatively small scale and
financially constrained become fragile to compete. Equally Bannor 2017 maintained that
commercial farmers are making efforts to produce aromatic rice that can meet the standard of
imported rice (Bannor et al., 2017). This will eventually increase competition among local
producers and small holder rice farmers who are financially constrained(Salami et al., 2010). The
results reveals that46.3 percent of the farmers agreed low demand for products increases risk
whiles only 2.1% percent disagreed. Likewise Tanng, (2006) noted that, demand for products is
likely to vary amongst consumers due to economic related issues and difference in preference.
This may be attributed to failure on the part of the producer to communicate with customers
making demand for the product more unstable, thus reduction in demand can increase risk (Tang,
2006).
Perception of political related risk
Table (6) reveals that (31.6%) of rice producers selected “extremely agree “to the statement
“Political situation (instability) increases risk” whiles just a few (3.2%) disagreed. Moreover 104
of the respondents representing 2.3% to agree to the statement “Government laws (policy)
increases risk” whereas 8 respondents representing 2.1 percent extremely disagreed. The results
are in tandem with a report by Economic Research Service, (2018a, para. 6). Their report revealed
Page 15
Global Journal of Agricultural Research
Vol.9, No4, pp.1-24, 2021
Print ISSN: 2053-5805(Print),
Online ISSN: 2053-5813(Online)
15 ECRTD-UK-https://www.eajournals.org/ https://doi.org/10.37745/gjar.2013
that government law/policy and political related risk includes unexpected changes in laws and
agricultural policies, such as environmental regulation. This type of risk can result from
“uncertainties emanating from government actions, such as tax laws, regulations for use of
chemicals, rules guiding animal waste disposal, and payment of income support. Lastly 263
producers extremely agreed to hire labour risk whiles 4 farmers disagree and 4 farmers extremely
disagree. Increase in labour cost increases cost of production, this increases farmers risk of
maximizing profit against budget constraints.
Table 7:The Effect of Branding on Producers risk in the Local Rice Industry in Hohoe
Municipality Variable Risk
Socio demographic factors
Experience 0.08
-0.0932
Income -0.1388
-0.155
Education -0.0786
-0.1983
Location 0.0323
-0.1823
Branding variables
Branding -0.7988***
-0.207
Variety in prices 0.5946*
-0.3427
Type rice of produced 0.2110**
-0.0984
_cons 1.8632**
-0.7571
R2 0.3977
N 59
Standard errors in parentheses*p< 0.10, **p< 0.05, ***p< 0.01
Source: Field Survey,2020
Page 16
Global Journal of Agricultural Research
Vol.9, No4, pp.1-24, 2021
Print ISSN: 2053-5805(Print),
Online ISSN: 2053-5813(Online)
16 ECRTD-UK-https://www.eajournals.org/ https://doi.org/10.37745/gjar.2013
From Table (7) the coefficient of branding is negative and statistically significant at 1%, this
implies that branding of local rice reduces the perceived risk of farmers. This is indicative as
many producers do not brand their harvested rice, thereby predisposing them to several risks such
as risk of low sales and low prices. With regards to this finding, farmers were of the view that
branding help reduce risk. Farmer one, an experienced rice farmer opined that” nowadays
consumers are relatively younger and prefer well packaged aromatic rice. This makes branding
a core element in marketing and if only we can brand our locally produced rice we will make
desirable sales”
Similarly farmer two was of the view that “Modern day buyers are very selective when it comes
to rice brands, usually people who buy rice prefer attractive and convenient packaging. For this
reason, I think that if we are able to package our rice to the standards required by these buyers,
we will increase sales drastically”. Market research reveals that locally produced rice are
categorized into two types, branded and unbranded. The branded rice are usually produced by
commercial farmers in larger quantities, which contains are the characteristics preferred by
consumers, but are sold for higher prices in supermarkets, malls and through well-organized
distribution channels (Andam et al., 2019), on the other hand unbranded local rice which
dominates the market are processed using traditional methods (Ayeduvor 2018).Similar to the
results, Anholt (2007) emphasized that producers who do not advance a competitive brand will
find it tough to win their shares of the world’s consumer market . Also Fournier and Srinivasan
(2018) argue that a powerful brand entices new buyers, retain present customers and also helps
lessen risk by reassuring broader stock ownership and reducing variability and volatility in future
cash flows of producers. Variation in prices also has a positive and significant relationship with
producers’ risk. This shows that price variation increases local rice producers’ risk. A possible
reason might be that there are different types of rice on the market which commands different
prices. More so, it is worth noting that the brands that command relatively higher prices are well
branded rice compared to those that are locally produced which are not adequately branded.
Hence, local rice producers face the risk of being affected by price variation, since their rice will
not receive higher prices in the market. Farmers indicated that, “consumers are willing to pay
good prices for well branded rice on the market, but when it comes to locally produced rice
consumers are reluctant to pay, although local rice has goodtaste , they spend time wash and
remove particles from the rice , which waste their time when cooking. Thus preferencefor well
polished, branded and package rice is becomes a good choice, because it saves them extra time
of cooking.” As a result of this consumers would prefer other brands than locally produced brands
this makes price of both products vary. Likewise Gunawan et al., (2019) revealed that, the
seasonality and perishability nature of agricultural products has significant effects on their price.
Furthermore, the type of local rice produced also has a positive relationship with producer’s risk.
This implies that, if local producers produce the rice variety which is desired by the retailers and
consumers it reduces their risk of purchase, whereas the production of less desired varieties
increases risks of low sales or low prices. Farmers indicated that “The type of rice we produce is
Page 17
Global Journal of Agricultural Research
Vol.9, No4, pp.1-24, 2021
Print ISSN: 2053-5805(Print),
Online ISSN: 2053-5813(Online)
17 ECRTD-UK-https://www.eajournals.org/ https://doi.org/10.37745/gjar.2013
aromatic but our traditional ways of processingis seriously affecting us, however we do not have
adequate financial capacity to invest into new technology and machinery. Although branding is
good our financial constraints usually hinder us, hence we ar forced to reduce our prices. Equally
Bannor et al., (2017) noted that, due to consumers increasing demand of aromatic rice, efforts are
continuously being made by commercial rice producers in Ghana to produce aromatic rice that
can meet the standard of imported rice. Nevertheless, income, education, experience and location
have no significant relationship with producers’ risk. This contradicts the finding of Buabeng
(2015) who found education, location and income to have a positive impact on producer’s risk.
CONCLUSIONS
The study examines determinants of branding as a risk mitigation tool among rice producers in
the Hohoe municipality of Volta region of Ghana. Majority of rice producers attained at least
basic education. The study revealed that a larger number a little above half, (50.5%) of rice
producers produced Togo Marshal Rice due to its disease resistance and high yielding nature.
Moreover, responses emanating from the study with respect to responses of risk perception show
that rice farmers are aware of risks they face and they have adequate knowledge on risk
perception. The study found that branding has a major effect on production of local rice in the
Hohoe municipality. Thus, it helps to reduce the risk involved in the production of local rice
whereas variety in prices and type of rice produced increases producers risk.
Recommendations
The negative perception on risk is suggestive that insurance companies should strengthen
measures to educate rice producers about agricultural insurance to enable them adopt it so they
can transfer the numerous risks they face. The study further recommends that farmers should be
sensitised and educated about branding this will help them gain competitive advantage in the
market. Also, since they are aware of various risks they should adopt insurance packages such as
flexa insurance and business interruption insurance to minimize their risks. In addition producers
of local rice should embrace improvement in packaging and branding of their produce to help
them in mitigating most of the risks they face. The study also recommends that producers should
adopt vigorous advertisement of the rice they produce.
Acknowledgement
Authors are grateful to rice farmers in Hohoe municipality of Volta Region, for dedicating their
time and availing their selves for questionnaire administration. Also great thanks to Mr Kofi
Gyawu Sarfo of Aberdeen University and Mr Asomah Shadrack of University of Energy and
Natural Resources for proofreading and critical review of the paper. Your comments shaped and
improved the paper immensely.
Page 18
Global Journal of Agricultural Research
Vol.9, No4, pp.1-24, 2021
Print ISSN: 2053-5805(Print),
Online ISSN: 2053-5813(Online)
18 ECRTD-UK-https://www.eajournals.org/ https://doi.org/10.37745/gjar.2013
References Adnan, K. M., Ying, L., Ayoub, Z., Sarker, S. A., Menhas, R., Chen, F., & Yu, M. M. (2020).
Risk management strategies to cope catastrophic risks in agriculture: the case of contract
farming, diversification and precautionary savings. Agriculture, 10(8), 351.
Adu-Kwarteng, E., Ellis, W. O., Oduro, I., & Manful, J. T. (2003). Rice grain quality: a
comparison of local varieties with new varieties under study in Ghana. Food Control,
14(7), 507-514.
African Development Bank (AfDB). (2016). Feed Africa: Strategy for Agricultural
Transformation in Africa, 2016–2025.
Ahmad, D., Afzal, M., & Rauf, A. (2019). Analysis of wheat farmers’ risk perceptions and attitudes: evidence from Punjab, Pakistan. Natural Hazards, 95(3), 845-861.
Aimin, H. (2010). Uncertainty, risk aversion and risk management in agriculture. Agriculture and
agricultural science procedia, 1, 152-156.
Alemu, G. M. (2019). Strategic use of branding for competitiveness: the rationale for branding and marketing agricultural products of African countries. Journal of Fair Trade, 1(2), 6-13.
Alhassan, H., Frimpong, T., & Mohammed, A. S. (2015). Do Ghanaian rural consumers prefer
imported rice to local rice? Evidence from Akuapem North Municipality. Applied
Research Journal, 1 (3): 24, 34.
Amevenku, F. K., Kuwornu, J. K., Seini, A. W., Osei-Asare, Y. B., & Anim-Somuah, H. (2019).
Livelihood vulnerabilities and diversification of fishing households in Ghana.
Development in Practice, 29(7), 867-
881.https://doi.org/10.1080/09614524.2019.1636933 Anang, B. T., Bäckman, S., & Sipiläinen, T. (2020). Adoption and income effects of agricultural
extension in northern Ghana. Scientific African, 7,
e00219.https://doi.org/10.1016/j.sciaf.2019.e00219 Andam, K. S., Ragasa, C., Asante, S., & Amewu, S. (2019). Can local products compete against
imports in West Africa? Supply-and demand-side perspectives on chicken, rice, and tilapia in Accra, Ghana (Vol. 1821). Intl Food Policy Res Inst.
Anderson-Cook, C. M. (2006). Quantitative Risk Management: Concepts, Techniques, and Tools.
Alexander J. McNeil, Rudiger Frey, and Paul Embrechts. Journal of the American
Statistical Association, 101, 1731-1732
Anholt, S. (2007). Competitive identity, policy and practice. A Development Education Review,
4, 3-13.
Arens, William F. Contemporary advertising. Tata McGraw-Hill Education, 2002.
Arthur, R., Baidoo, M. F., & Antwi, E. (2011). Biogas as a potential renewable energy source: A
Ghanaian case study. Renewable Energy, 36(5), 1510-1516.
Ayeduvor, S. (2018). Assessing quality attributes that drive preference and consumption of local
rice in Ghana (Vol. 48). Intl Food Policy Res Inst.
Page 19
Global Journal of Agricultural Research
Vol.9, No4, pp.1-24, 2021
Print ISSN: 2053-5805(Print),
Online ISSN: 2053-5813(Online)
19 ECRTD-UK-https://www.eajournals.org/ https://doi.org/10.37745/gjar.2013
Bannor, R. K., Oppong-Kyeremeh, H., &Adjei-Addo, E. (2017). Improving the income of small
scale rice producers through outgrower scheme in the volta region of Ghana. Indian
Journal of Economics and Development, 13(2a), 584-590.
Barrett, C. B. (2010). Smallholder market participation: Concepts and evidence from eastern and southern Africa. Food security in Africa
Begg, J. E., & Turner, N. C. (1976). Crop water deficits. Advances in agronomy, 28, 161-217. Boansi, D., & Favour, R. M. (2015). Why the persistent increase in Ghana’s rice imports?
Prescriptions for future rice policy. Asian Journal of Agricultural Extension, Economics & Sociology, 1-21.
Bobby, J.C., Mark L.F., (2019). The Financial Value of Brand.
Boyer, J. S., & McPherson, H. G. (1975). Physiology of water deficits in cereal crops. In Advances in Agronomy (Vol. 27, pp. 1-23). Academic Press.
Breen, B., Hennessy, T., Donnellan, T., & Hanrahan, K. (2013). Tools and polices for agricultural
risk management.
Chaudhary, A., & Kastner, T. (2016). Land use biodiversity impacts embodied in international
food trade. Global Environmental Change, 38, 195-204.
Cunningham, M. S. (1967). The major dimensions of perceived risk. Risk taking and information
handling in consumer behavior.
Dapaah Opoku, P., Bannor, R.K. and Oppong-Kyeremeh, H. (2020), "Examining the willingness
to produce organic vegetables in the Bono and Ahafo regions of Ghana", International
Journal of Social Economics, Vol. 47 No. 5, pp. 619-641. https://doi.org/10.1108/IJSE-
12-2019-0723
Diabat, A., Govindan, K., & Panicker, V. V. (2012). Supply chain risk management and its mitigation in a food industry. International Journal of Production Research, 50(11), 3039-3050.
Diao, X., and Hazell, P. (2004). Exploring market opportunities for African smallholders. Technical report, International Food Policy Research Institute (IFPRI)
E. M. Kwofie, M. Ngadi, and A. Mainoo, “Local rice parboiling and its energy dynamics in
Ghana,” Energy for Sustainable Development, vol. 34, pp. 10–19, 2016.
Fahad, S., Wang, J., Khan, A. A., Ullah, A., Ali, U., Hossain, M. S., ... & Bilal, A. (2018). Evaluation of farmers' attitude and perception toward production risk: Lessons from Khyber Pakhtunkhwa Province, Pakistan. Human and Ecological Risk Assessment: An International Journal, 24(6), 1710-1722.
Fournier, S. and Srinivasan, S., 2018. Branding and the risk management imperative. Marketing
Intelligence Review, 10(1), pp.10-17.
Girdžiūtė, L. (2012). Risks in agriculture and their assessment methods. In Proc. Annual 18th
International Scientific Conference Research for Rural Development (pp. 197-202).
Page 20
Global Journal of Agricultural Research
Vol.9, No4, pp.1-24, 2021
Print ISSN: 2053-5805(Print),
Online ISSN: 2053-5813(Online)
20 ECRTD-UK-https://www.eajournals.org/ https://doi.org/10.37745/gjar.2013
Gunawan, E., Kuwornu, J.K.M., Datta, A. and Nguyen, L.T. (2019), "Factors influencing
farmers’ use of the warehouse receipt system in Indonesia", Agricultural Finance Review,
Vol. 79 No. 4, pp. 537-563. https://doi.org/10.1108/AFR-11-2018-0099
Hazell, P., & Diao, X. (2004). Exploring market opportunities for African smallholders. In 2020 Africa Conference Brief (Vol. 6).
Holzmann, R., & Jørgensen, S. (2001). Social risk management: A new conceptual framework
for social protection, and beyond. International Tax and Public Finance, 8(4), 529-
556.https://doi.org/10.1126/science.1204531 Harčariková, M. (2018). Managing price risk in the corn market using option strategies. Acta
Universitatis Agriculturae et Silviculturae Mendelianae Brunensis, 66(3), 767-779. Ikporah, E. N. (2012). Branding strategy for effective agricultural marketing in Nigeria. MBA
Thesis.
International Food Policy Research Institute (IFPRI). 2020. Ghana's rice market. MoFA-IFPRI Market Brief 2. Washington, DC: International Food Policy Research Institute (IFPRI). https://doi.org/10.2499/p15738coll2.133697
Iqbala, M. A. (2017). Risk perceptions and management strategies of rice growing households:
Evidence from a developing country. J. Appl. Environ. Biol. Sci, 7(3), 15-26.
Itani, T., Tamaki, M., Arai, E., & Horino, T. (2002). Distribution of amylose, nitrogen, and
minerals in rice kernels with various characters. Journal of Agricultural and Food
Chemistry, 50(19), 5326-5332.https://doi.org/10.1021/jf020073x Jarh, A. K., Asiedu, S. Y., Azaglo, J. O., & Lavoe, R. (2020). ASSESSMENT OF QUALITY OF
PARBOILED JASMINE AND TOGO MARSHALL RICE GROWN IN THE HOHOE
MUNICIPALITY OF VOLTA REGION, GHANA. European Journal of Social Sciences
Studies, 5(4).http://dx.doi.org/10.46827/ejsss.v5i4.898 Kahan, D. (2013). Market-oriented farming: An overview. Food and Agriculture Organization of
the United Nations.
Keller, K.L. and Lehmann, D.R. (2006). Brands and branding: Research findings and future
priorities. Marketing science, 25(6), pp.740-759.
Kothari, C.R., (2004). Research methodology: Methods and techniques. New Age International
Kotler, P. et al. (1999).Principles of Marketing, 2nd Edition, Europe: Prentice Hall.
Kouame, E. B., & Komenan, A. (2012). Risk preferences and demand for insurance under price uncertainty: An experimental approach for cocoa farmers in Côte d’Ivoire. ILO Microinsurance Innovation Facility Research Paper, 13.
Lebel, L., Lebel, P., Chitmanat, C., Uppanunchai, A., &Apirumanekul, C. (2018). Managing the
risks from the water-related impacts of extreme weather and uncertain climate change on
inland aquaculture in Northern Thailand. Water International, 43(2), 257-
280.https://doi.org/10.1080/02508060.2017.1416446
Page 21
Global Journal of Agricultural Research
Vol.9, No4, pp.1-24, 2021
Print ISSN: 2053-5805(Print),
Online ISSN: 2053-5813(Online)
21 ECRTD-UK-https://www.eajournals.org/ https://doi.org/10.37745/gjar.2013
Lobell, D. B., Schlenker, W., & Costa-Roberts, J. (2011). Climate trends and global crop
production since 1980. Science, 333(6042), 616-
620.https://doi.org/10.1126/science.1204531 Manley, B., & Watt, R. (2009). Forestry insurance, risk pooling and risk minimisation options.
Ministry of Agriculture and Forestry.
Mensah, N. O. (2017). Risk perception and agricultural insurance development strategy for
cashew crop farmers in the Brong-Ahafo region of Ghana (Doctoral dissertation).
Mensah, N.O., Amrago, E.C., Asare, J.K., Donkor, A., Tutu, F.O. and Ansah, E.O. (2021),
"Perception and willingness to contribute towards food banking in the Ashanti Region of
Ghana", International Journal of Social Economics, Vol. ahead-of-print No. ahead-of-
print. https://doi.org/10.1108/IJSE-08-2020-0576
Mensah, N.O., Amrago, E.C., Mensah, E.T.D., Asare, J.K. and Anang, S.A. (2021), "Prospects,
determinants and profitability of aquaculture insurance among fish farmers in the Eastern
Region of Ghana", World Journal of Science, Technology and Sustainable Development,
Vol. ahead-of-print No. ahead-of-print. https://doi.org/10.1108/WJSTSD-02-2021-0018
Mensah, N.O., Twintoh, J.J., Amrago, E.C., Donkor, A. and Anang, S.A. (2021), "Forestry
insurance preference among tree growers in the Ashanti Region of Ghana: a tobit and
multi-nomial regression approach", Managerial Finance, Vol. ahead-of-print No. ahead-
of-print. https://doi.org/10.1108/MF-10-2020-0535
Mitchell, V. (1998), "A role for consumer risk perceptions in grocery retailing", British Food
Journal, Vol. 100 No. 4, pp. 171-183. https://doi.org/10.1108/00070709810207856
Mgale, Y. J., & Yunxian, Y. (2021). Price risk perceptions and adoption of management strategies
by smallholder rice farmers in Mbeya region, Tanzania. Cogent Food & Agriculture, 7(1),
1919370.
MoFA-IFPRI Market Brief No. 2 | April 2020:https://www.ifpri.org/publication/ghanas-rice-market (Accessed on 01/ 05/ 2021)https://doi.org/10.2499/p15738coll2.133697
MOFA (Ministry of Food and Agriculture), Agriculture in Ghana. Facts and figures (2014).
Statistics, Research and Information Directorate (SRID), MoFA, Accra, 2015.
Nwanze, K.F, Mohapatra, S., Kermawa, P., Keya, S. and BruceOliver, S. (2006). Perspective:
Rice development in sub-Saharan Africa. Journal of the Science of Food and Agriculture
(86):675 –677
Ojo, T. O., Ogundeji, A. A., Babu, S. C., & Alimi, T. (2020). Estimating financing gaps in rice
production in Southwestern Nigeria. Journal of Economic Structures, 9(1),
12.https://doi.org/10.1186/s40008-020-0190-y Oppong-Kyeremeh, H., & Bannor, R. K. (2018). Off-Farm Job as Climate Change Adaptation
Strategy for Small Scale Rice Producers in the Volta Region of Ghana. Journal of Energy
and Natural Resource Management (JENRM), 1(2).
Oppong-Kyeremeh, H., Creppy, P., & Bannor, R. K. (2019). Marketing outlets choice modelling
for commercialisation analysis of smallholder rice producers in Ghana. International
Journal of Value Chain Management, 10(2), 162-179.
Page 22
Global Journal of Agricultural Research
Vol.9, No4, pp.1-24, 2021
Print ISSN: 2053-5805(Print),
Online ISSN: 2053-5813(Online)
22 ECRTD-UK-https://www.eajournals.org/ https://doi.org/10.37745/gjar.2013
Perreault, W. D., & McCarthy, E. J. (2002). Basic marketing: A global managerial approach.
McGraw-Hill/Irwin.
Pingali, P. L. (1997). From subsistence to commercial production systems: The transformation of Asian agriculture. American journal of Agricultural economics, 79(2), 628-634.
Quarshie and Fraser 2021: Ghana’s rice farmers need finance for new technologies, but banks
don’t trust them: https://theconversation.com/ghanas-rice-farmers-need-finance-for-
new-technologies-but-banks-dont-trust-them-167924 (Assessed on 21/10/2021)
Pingali, P. L., & Rosegrant, M. W. (1995). Agricultural commercialization and diversification: processes and policies. Food policy, 20(3), 171-185.
Ragasa, C., Dankyi, A., Acheampong, P., Wiredu, A.N., Chapoto, A., Asamoah, M. and Tripp,
R., 2013. Patterns of adoption of improved rice technologies in Ghana. International Food
Policy Research Institute Working Paper, 35, pp.6-8.
Rizwan, M., Ping, Q., Saboor, A., Ahmed, U. I., Zhang, D., Deyi, Z., & Teng, L. (2020).
Measuring rice farmers’ risk perceptions and attitude: Evidence from Pakistan. Human
and Ecological Risk Assessment: An International Journal, 26(7), 1832-1847.
Velandia, M., Rejesus, R. M., Knight, T. O., & Sherrick, B. J. (2009). Factors affecting farmers'
utilization of agricultural risk management tools: the case of crop insurance, forward
contracting, and spreading sales. Journal of agricultural and applied economics, 41(1),
107-123.
Salami, A., Kamara, A. B., & Brixiova, Z. (2010). Smallholder agriculture in East Africa: Trends, constraints and opportunities. Tunis: African Development Bank.
Schaffnit-Chatterjee, C., Schneider, S., Peter, M., & Mayer, T. (2010). Risk management in agriculture. Deutsche Bank Reseach. Sept.
Sedem Ehiakpor, D., Apumbora, J., Danso-Abbeam, G., & Adzawla, W. (2017). Households’ preference for local rice in the Upper East region, Ghana. Advances in Agriculture, 2017.
Sedgwick, P. (2013). Convenience sampling. Bmj, 347.
Sefcik, S. E., & Thompson, R. (1986). An approach to statistical inference in cross-sectional
models with security abnormal returns as dependent variable. Journal of Accounting
Research, 316-334.
Social protection, and beyond. International Tax and public Finance 8:529-556.
Stevens, J. P. (2002). Applied multivariate statistics for the social sciences. Mahwah, USA:
Lawrence Erlbaum Associates.
Stevens, J. P. (2012). Applied multivariate statistics for the social sciences. Routledge. Subash, N., & Gangwar, B. (2014). Statistical analysis of Indian rainfall and rice productivity
anomalies over the last decades. International Journal of Climatology, 34(7), 2378-2392.
Tang, C. S. (2006). Perspectives in supply chain risk management. International journal of
production economics, 103(2), 451-488.
Tangermann, S. (2011). Risk management in agriculture and the future of the EU’s Common
Agricultural Policy. Issue paper, 34.
Page 23
Global Journal of Agricultural Research
Vol.9, No4, pp.1-24, 2021
Print ISSN: 2053-5805(Print),
Online ISSN: 2053-5813(Online)
23 ECRTD-UK-https://www.eajournals.org/ https://doi.org/10.37745/gjar.2013
Tomlins, K. I., Manful, J. T., Larwer, P., & Hammond, L. (2005). Urban consumer preferences
and sensory evaluation of locally produced and imported rice in West Africa. Food quality
and preference, 16(1), 79-89.
Tong, Q., Swallow, B., Zhang, L., & Zhang, J. (2019). The roles of risk aversion and climate-
smart agriculture in climate risk management: Evidence from rice production in the
Jianghan Plain, China. Climate Risk Management, 26, 100199.
Tong, Q., Swallow, B., Zhang, L., & Zhang, J. (2019). The roles of risk aversion and climate-
smart agriculture in climate risk management: Evidence from rice production in the
Jianghan Plain, China. Climate Risk Management, 26, 100199.
Williams, B., Onsman, A., & Brown, T. (2010). Exploratory factor analysis: A five-step guide
for novices. Australasian journal of paramedicine, 8(3).
Yu, B., Nin-Pratt, A., Funes, J., & Gemessa, S. A. (2011). Cereal production and technology adoption in Ethiopia (Vol. 31). Internat. Food Policy Research Inst.
Zhou, Z., Robards, K., Helliwell, S. and Blanchard, C. (2002). Composition and functional
properties of rice.International Journal of Food Science and Technology, (37): 849 –868
Appendix
Table A1: Kaiser-Meyer-Olkin test Kaiser-Meyer-Olkin Measure of Sampling Adequacy 0.764
Bartlett test of sphericity Approx. chi –square 1416.599
Df 159
Significance 0.000***
Note(s): 1% significance =***
Source(s): Author construct based on field data, 2020
H0: Variables are mot intercorrelated
H1: Variables are intercorrelated
Table A2: Names of extracted factors
Variable
Explanation
Proportion Cumulative
Factor 1: Perception on Price and environmental risk 0.237 (23.7%) 0.237 (23.7)
F1 Variability in Price
F2 Interest rate
F3 Excess rainfall
F4 Deficit in rainfall
F5 Pest and diseases
Factor 2: Perception on institutional risk 0.168 (16.8%) 0.406(40.6%)
F6 Changes in Technology
F7 Competition
F8 Low demand for product
Factor 3: Perception of political related risk 0.154(15.4%) 0.560(56.0%)
F9 Political situation
F10 Government laws
F11 Hired labour
Source: Authors construct based on field data, 2020
Page 24
Global Journal of Agricultural Research
Vol.9, No4, pp.1-24, 2021
Print ISSN: 2053-5805(Print),
Online ISSN: 2053-5813(Online)
24 ECRTD-UK-https://www.eajournals.org/ https://doi.org/10.37745/gjar.2013
Table A3: Rotated factor loadings Factor components
Variable Factor 1 Factor 2 Factor 3
F1 0.790
F2 0.903
F3 0.827
F4 0.911
F5 0.709
F6 0.772
F7 0.806
F8 0.910
F9 0.818
F10 0.848
F11 0.637
Source(s): field data, 2020
Note(s): Using 0.60 as cut off point , the rotation matrix was used to name the factors
Table A4: Scale of reliability coefficient Risk perception Number of items Cronbach’s alpha
Perception on Price and environmental risk 5 0.84
Perception on institutional risk 3 0.87
Perception of political related risk 3 0.82
Total 0.88
Source(s): field data, 2020