Florida International University FIU Digital Commons FIU Electronic eses and Dissertations University Graduate School 7-10-2012 Assessing Sustainability of Sanitation Technologies Recommended for Rural Seings: A Case Study of Morogoro District, Tanzania Amour Seleman Florida International University, asele001@fiu.edu DOI: 10.25148/etd.FI12080612 Follow this and additional works at: hp://digitalcommons.fiu.edu/etd is work is brought to you for free and open access by the University Graduate School at FIU Digital Commons. It has been accepted for inclusion in FIU Electronic eses and Dissertations by an authorized administrator of FIU Digital Commons. For more information, please contact dcc@fiu.edu. Recommended Citation Seleman, Amour, "Assessing Sustainability of Sanitation Technologies Recommended for Rural Seings: A Case Study of Morogoro District, Tanzania" (2012). FIU Electronic eses and Dissertations. 690. hp://digitalcommons.fiu.edu/etd/690
Transcript
Florida International UniversityFIU Digital Commons
FIU Electronic Theses and Dissertations University Graduate School
7-10-2012
Assessing Sustainability of Sanitation TechnologiesRecommended for Rural Settings: A Case Study ofMorogoro District, TanzaniaAmour SelemanFlorida International University, [email protected]
DOI: 10.25148/etd.FI12080612Follow this and additional works at: http://digitalcommons.fiu.edu/etd
This work is brought to you for free and open access by the University Graduate School at FIU Digital Commons. It has been accepted for inclusion inFIU Electronic Theses and Dissertations by an authorized administrator of FIU Digital Commons. For more information, please contact [email protected].
Recommended CitationSeleman, Amour, "Assessing Sustainability of Sanitation Technologies Recommended for Rural Settings: A Case Study of MorogoroDistrict, Tanzania" (2012). FIU Electronic Theses and Dissertations. 690.http://digitalcommons.fiu.edu/etd/690
ASSESSING SUSTAINABILITY OF SANITATION TECHNOLOGIES
RECOMMENDED FOR RURAL SETTINGS: A CASE STUDY OF MOROGORO
DISTRICT, TANZANIA.
A thesis submitted in partial fulfillment of the
requirements for the degree of
MASTER OF SCIENCE
in
ENVIRONMENTAL STUDIES
by
Amour Seleman
2012
ii
To: Dean Kenneth Furton College of Arts and Sciences This thesis, written by Amour Seleman, and entitled Assessing Sustainability of Sanitation Technologies Recommended for Rural Settings: A Case Study of Morogoro District, Tanzania having been approved in respect to style and intellectual content is referred to you for judgment. We have read this thesis and recommend that it be approved.
______________________________________________
Raymond Scattone
_____________________________________________
Krishnaswamy Jayachandran
______________________________________________
Mahadev Bhat, Major Professor
Date of Defense: July 10, 2012 The thesis of Amour Seleman is approved.
______________________________________________ Dean Kenneth Furton
College of Arts and Sciences
_____________________________________________ Dean Lakshmi N. Reddi University Graduate School
Florida International University, 2012
iii
DEDICATION
I dedicate this thesis to my wife Shamila Mwanga and my children Sheila, Fadhila and
Fadhili in appreciation for all of their love, encouragement and patience.
iv
ACKNOWLEDGMENTS
I sincerely would like to thank my major professor, Dr. Mahadev Bhat, for his
guidance, advice and direction for the development of this work, and for my entire
academic program. I am very grateful to Dr. Krishnaswamy Jayachandran who in
addition to serving on my thesis committee provided me with valuable support
throughout my graduate program. I am also grateful to my committee member, Dr.
Raymond Scattone, for his insight and helpful advice.
I also acknowledge the United States Agency for International Development
(USAID) for granting me the scholarship and funding of this research. I’m indebted to
Kimberlee LeBlanc and Specioza Machume, the coordinators of the USAID Leadership
and Innovation Training Program. I am grateful to Dr. Maria Donoso, Dr. Elizabeth
Anderson, Vivienne Abbott, Dolores Dominguez and Ana Lemos for their assistance
through the Global Water for Sustainability Program (GLOWS) of the Florida
International University.
I would also like to thank all those who participated in this study either as sources
of information or data collection assistant, national sanitation and hygiene experts, staff at
Morogoro District, and the people of Changa, Fulwe, Kalundwa, Kinole and Mkuyuni
villages. Special thanks goes to Ally Msopa who helped with organizing the data
collection activity in the district.
Finally, I sincerely appreciate my parents Ahmad Seleman and Tusekile Matipula
for their love and prayers. I also extend my appreciation to the faculty, staff and all my
friends at FIU, who have been a source of inspiration throughout my stay here in Miami.
v
ABSTRACT OF THE THESIS
ASSESSING SUSTAINABILITY OF SANITATION TECHNOLOGIES
RECOMMENDED FOR RURAL SETTINGS: A CASE STUDY OF MOROGORO
DISTRICT, TANZANIA.
by
Amour Seleman
Florida International University, 2012
Miami, Florida
Professor Mahadev Bhat, Major Professor
The objectives of this study were to: assess the sanitation conditions and
sustainability of sanitation technologies, using a comprehensive framework of
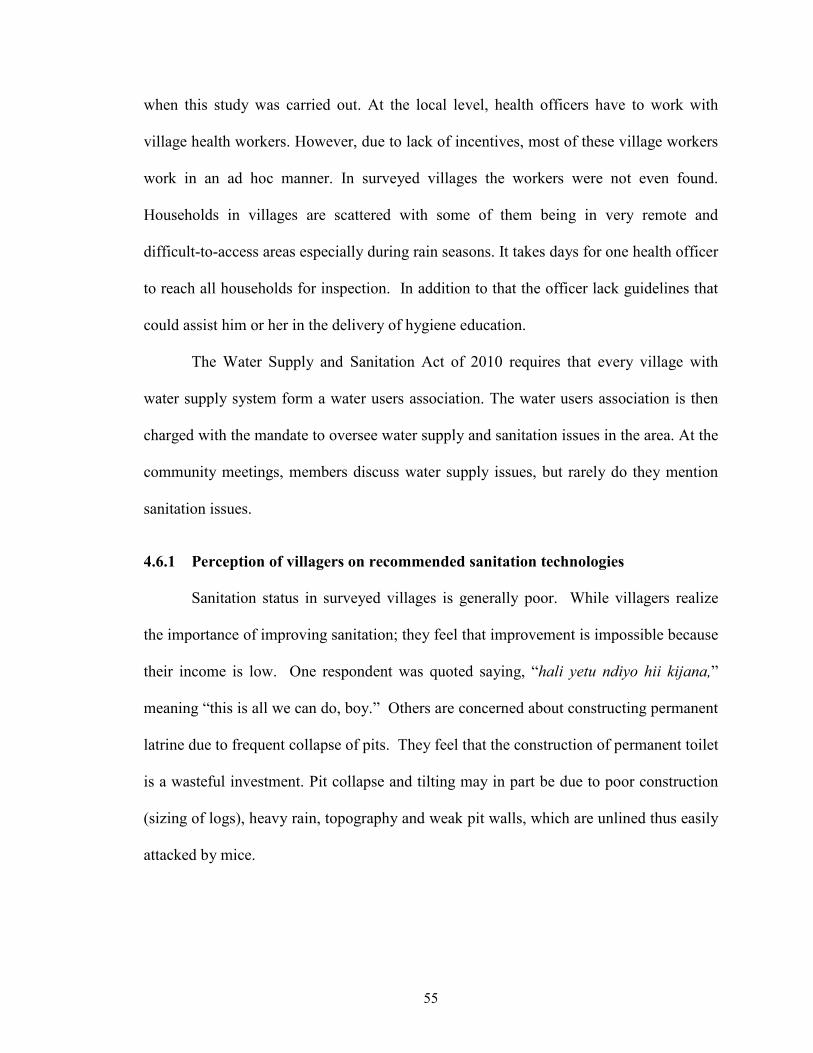
sustainability indicators. A survey of 500 households and focus group discussions of 40
key informants were conducted in five villages. Ninety-six percent of the households had
toilets, with only 9.4% having improved toilets. A strong relationship existed between the
percent of sanitation coverage and the diarrhea incidence rates. Education and family
wealth were the two significant determinants of sanitation coverage. On the basis of the
sustainable development index, SanPlat and VIP latrine were the top two probable
sustainable technologies. Variation did exist in the rankings of sanitation technologies
across the study villages. Improvement in sanitation in rural Tanzania requires education
of people about its health benefits, proper training, and extension of rural health workers.
vi
TABLE OF CONTENTS CHAPTER PAGE
1.0 INTRODUCTION ................................................................................................... 1 1.1 Brief Background ................................................................................................. 1 1.2 Sanitation in Tanzania .......................................................................................... 1 1.3 Statement of the Problem ..................................................................................... 3 1.4 Objectives ............................................................................................................. 5 1.5 Significance of the Study ..................................................................................... 5
2.0 LITERATURE REVIEW ........................................................................................ 7
2.1 Introduction .......................................................................................................... 7 2.2 Foundation of Sanitation Practices ....................................................................... 7 2.3 Sanitation Systems ............................................................................................... 8 2.4 Demand for Sanitation Facilities .......................................................................... 9 2.5 Importance of Improving Sanitation .................................................................. 10 2.6 Interaction Between Sanitation, Hygiene and Water Supply ............................. 11 2.7 Monitoring Access to Improved sanitation ........................................................ 11 2.8 Access to Safe Drinking Water .......................................................................... 12 2.9 Theoretical Framework ...................................................................................... 12 2.9.1 Adoption of Appropriate Technology ................................................................ 12 2.9.2 Sustainability of Technology ............................................................................. 14 2.9.3 Sustainability of Sanitation Technologies .......................................................... 14 2.9.4 Sustainability of Sanitation Technologies in Tanzania ...................................... 16 2.9.5 Selection of Sustainable Sanitation Technologies ............................................. 16
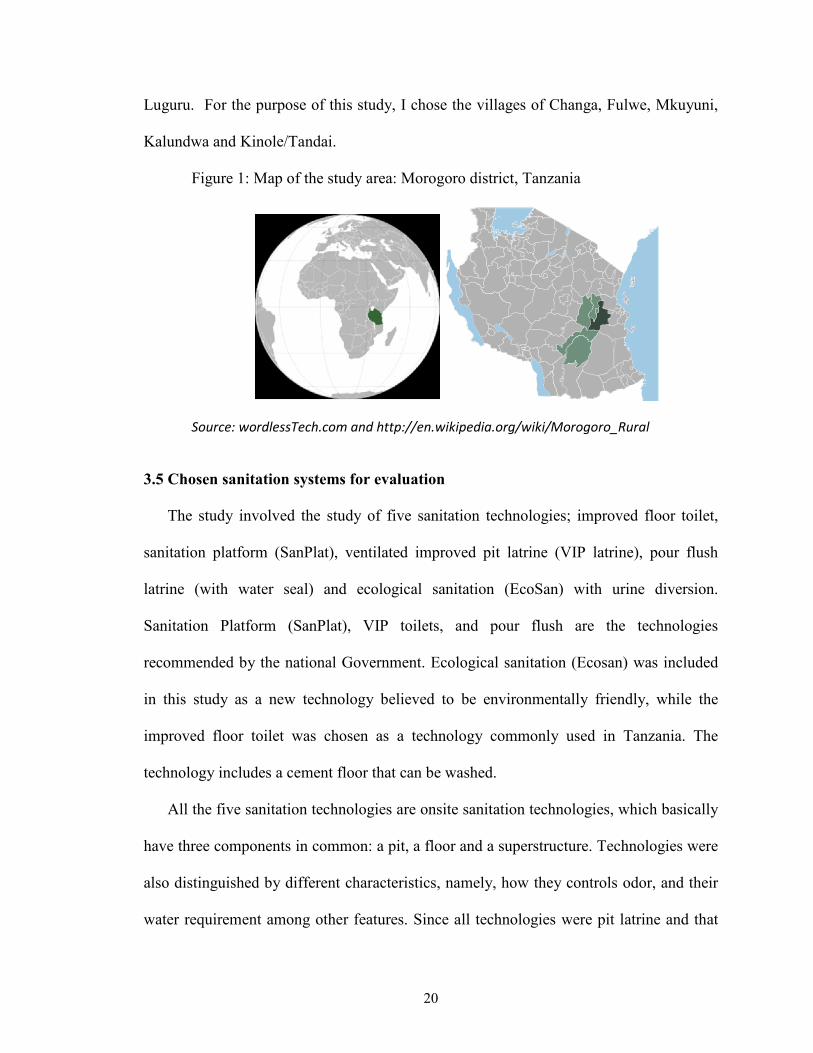
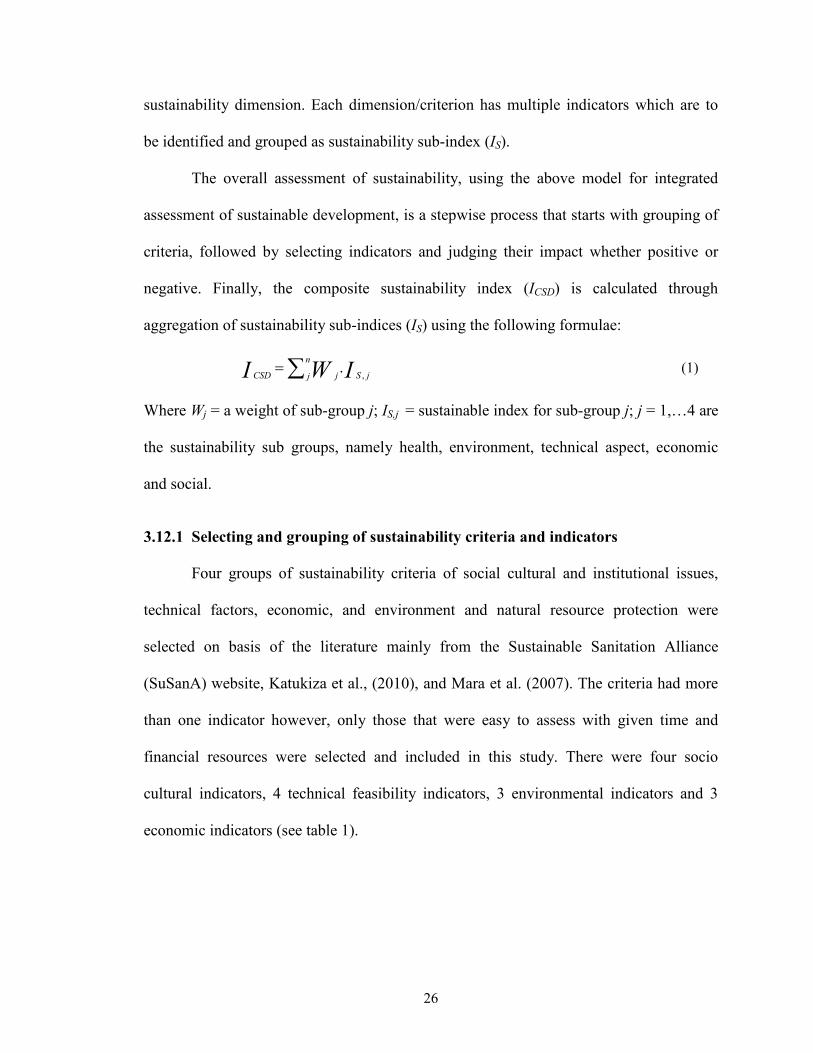
3.1 Introduction ........................................................................................................ 18 3.2 Research Questions ............................................................................................. 18 3.3 Hypotheses ......................................................................................................... 18 3.4 Study Area .......................................................................................................... 19 3.5 Chosen Sanitation Systems for Evaluation ........................................................ 20 3.6 Sampling Criteria ............................................................................................... 21 3.7 Subject Recruitment and Sample Size ............................................................... 22 3.8 Ethical Issues ...................................................................................................... 22 3.9 Study Design ...................................................................................................... 23 3.10 Household Survey .............................................................................................. 23 3.11 Assessing Socioeconomic Characteristics ......................................................... 25 3.12 Sustainability Assessment and Ranking of Technologies .................................. 25 3.12.1 Selecting and Grouping of Sustainability Criteria and Indicators...................... 26 3.12.2 Ascertaining Impact of Indicators ...................................................................... 27 3.12.3 Indicator Values ................................................................................................. 28 3.12.4 Weights of Indicators ......................................................................................... 28 3.12.5 Weights of Sustainability Criteria ...................................................................... 30 3.12.6 Checking Consistency of the Pair-Wise Matrix ................................................. 32
vii
3.12.7 Normalization of Indicators ............................................................................... 34 3.12.8 Calculation of Composite Sustainable Development Index ............................... 34
4.0 RESULTS AND DISCUSION .............................................................................. 36
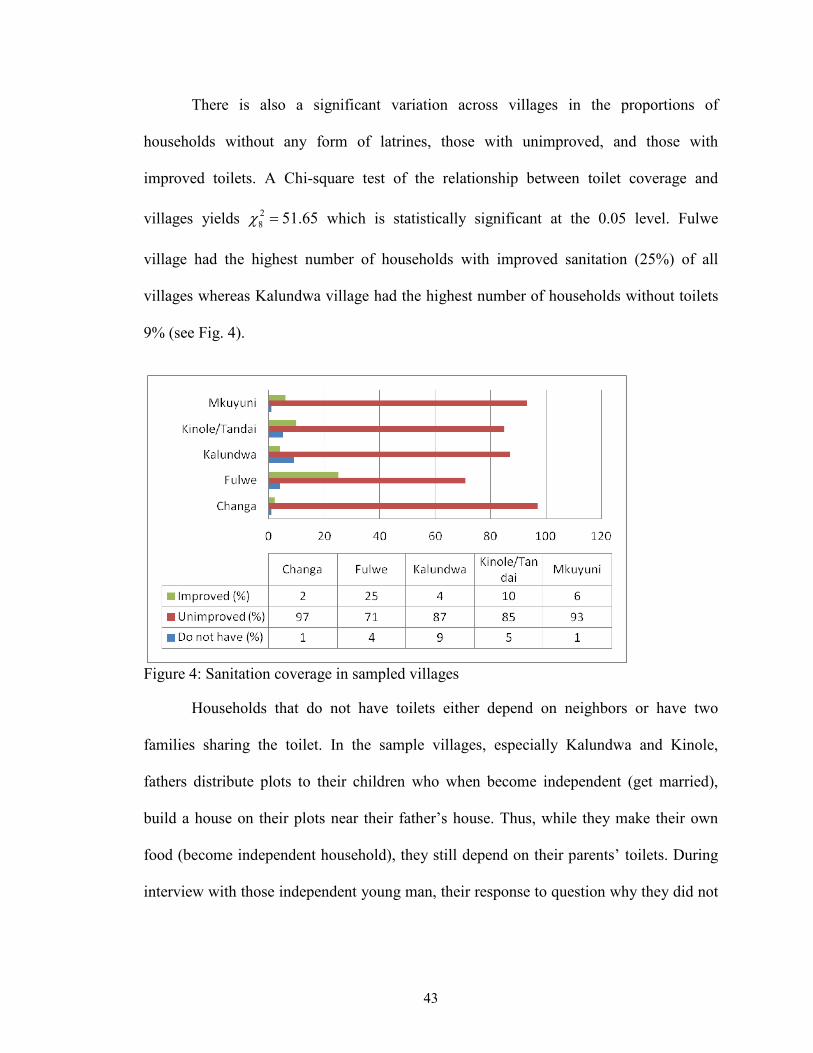
4.1 Introduction ........................................................................................................ 36 4.2 Sample Characteristics ....................................................................................... 36 4.2.1 Demographics..................................................................................................... 36 4.2.2 Education Level.................................................................................................. 38 4.2.3 Socioeconomic Characteristics .......................................................................... 39 4.2.4 Household income and Occupation.................................................................... 41 4.3 Sanitation Status ................................................................................................. 42 4.3.1 Socioeconomic Status and Use of Improved Sanitation .................................... 44 4.3.2 Education Level and Use of Improved Sanitation ............................................. 45 4.3.3 Problems Associated with Existing Sanitation Technologies ............................ 45 4.3.4 Sanitation and Diseases Occurrence .................................................................. 46 4.4 Access to Safe water Supply .............................................................................. 48 4.4.1 Water Supply and Health ................................................................................... 50 4.4.2 Water Supply and Diseases Incidences .............................................................. 51 4.4.3 Hygiene Practices ............................................................................................... 52 4.5 Environmental Characteristics ........................................................................... 52 4.6 Social and institutional aspects .......................................................................... 54 4.6.1 Perception of Villagers on Recommended Sanitation Technologies ................. 55 4.7 Sustainability of Technologies ........................................................................... 61 4.7.1 Ranking of Technologies Using (ICSD) ............................................................... 63
5.0 CONCLUSIONS AND RECOMENDATION ...................................................... 69
5.1 Existing Sanitation Conditions and the Associated Problems ........................... 69 5.2 Factors Influencing Adoption of Alternative Sanitation Technologies ............. 70 5.3 Sustainability of Sanitation Technologies and Final Ranking ........................... 71
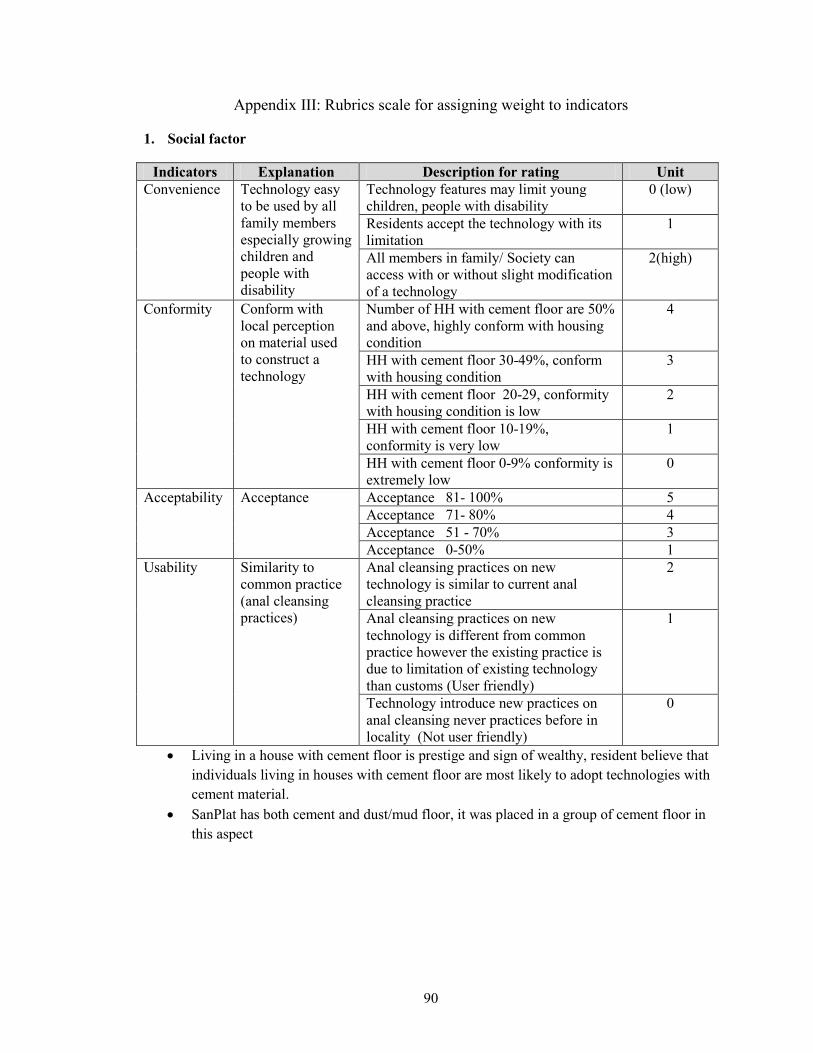
Usability Similarity to common practice (anal cleansing practices)
Anal cleansing practices on new technology is similar to current anal cleansing practice
2
Anal cleansing practices on new technology is different from common practice however the existing practice is due to limitation of existing technology than customs (User friendly)
1
Technology introduce new practices on anal cleansing never practices before in locality (Not user friendly)
0
30
3.12.5 Weights of sustainability criteria
The sustainability sub-index (IS) is obtained by multiplying the weight of criteria
and the normalized value of indicators. Normalization of indicators is discussed in the
next sub-section. Weights of criteria can be obtained from environmental impact
assessment or through pair-wise comparison of factors/criteria through the analytical
hierarchy process (Saaty, 1980; Krajnc and Glavic, 2004). In the study area however,
environmental impact of sanitation technologies is yet to be determined, and therefore,
weights were obtained through pair-wise comparison of criteria. Eight national sanitation
stakeholders working in the areas of environment, health and water supply were used to
perform ranking of criteria in a pair-wise fashion.
In a pair-wise comparison, two factors are compared at once by answering the
question that which of the two criteria, i and j, is more important than the other with
respect to the sustainability of sanitation technologies. Krajnc and Glavic (2004) used a
factor scale from 1 to 9 in order to express the judges’ preference intensity. That is, a
value of 1 indicated the equal preference between i and j. A value of 9 indicated that the
preference for criterion i is nine times greater than the preference for criterion j. With
this comparison method, if criterion i is, say, 5 times less preferred to j, then the judges
would have to assign a reciprocal value of 1/5. Such a pair-wise comparison results in an
(n X n) matrix. In our study, the judges found the above factor scale confusing, and
therefore, we were forced to first use a linear and simpler factor scale of -10 to +10. On
this scale, the value 0 indicates equal importance between two criteria while a preference
of 10 indicates one factor is 10 times more important than the other. This scale was
chosen to make it easier for judges to rank factors the same below and above the diagonal
31
without having to invert the value. After we obtained the initial comparison, we retained
only the positive numbers and re-scaled the factor scale of 0 – 10 to 1 – 11. The re-
scaling does not affect the original order of preference. This operation left all the
diagonal cells with number 1 (meaning equal preference between each i and j). Also, it
left each cell with a negative value on the original comparison empty. For each empty
cell (i,j), we used the reciprocal value of its diagonal cell (j,i). The end result of the above
operation is a pair-wise matrix with appropriate properties necessary for further matrix-
manipulation as explained below. For instance, if we had kept the original linear factor
scale, mathematically it would have been impossible to keep the order of the hierarchical
process. When we added the values of the cells of each column, the positive and negative
numbers would have canceled each other out fully or partially.
Each judge performed ranking independently. Personal judgment by experts
would result into inconsistency of comparison. A mathematical test was conducted to
check the consistency, which is explained in the next section. A consistency ratio of 0.1
was considered as acceptable upper limit (Saaty and Vargas, 2001., Krajnc and Glavic,
2004). The ranks given by eight judges were combined by finding the average of each
rank in a cell (Table 3).
In table 3 the factor “social” represents social cultural and institutional factors;
“technical” stands for technical feasibility of a technology; “environmental” stands for
environmental and natural resource protection; and, “affordability” means economic and
financial aspects of the technology.
32
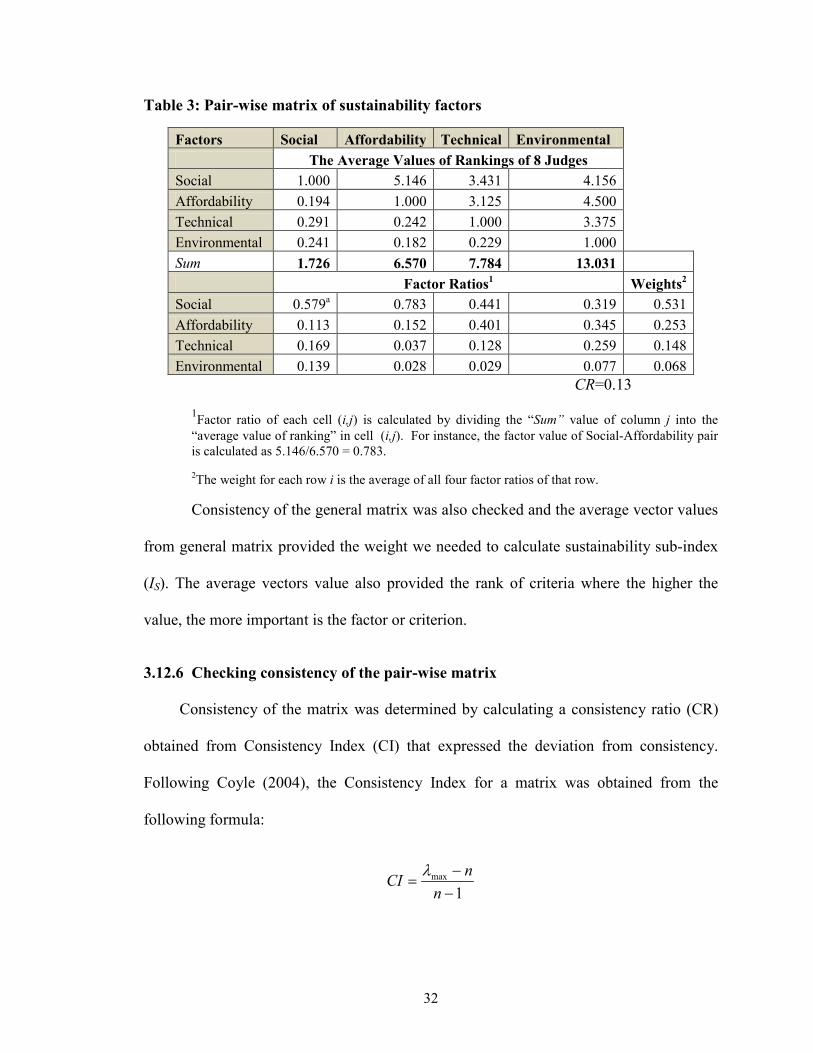
Table 3: Pair-wise matrix of sustainability factors
Factors Social Affordability Technical Environmental The Average Values of Rankings of 8 Judges Social 1.000 5.146 3.431 4.156 Affordability 0.194 1.000 3.125 4.500 Technical 0.291 0.242 1.000 3.375 Environmental 0.241 0.182 0.229 1.000 Sum 1.726 6.570 7.784 13.031 Factor Ratios1 Weights2
1Factor ratio of each cell (i,j) is calculated by dividing the “Sum” value of column j into the “average value of ranking” in cell (i,j). For instance, the factor value of Social-Affordability pair is calculated as 5.146/6.570 = 0.783.
2The weight for each row i is the average of all four factor ratios of that row.
Consistency of the general matrix was also checked and the average vector values
from general matrix provided the weight we needed to calculate sustainability sub-index
(IS). The average vectors value also provided the rank of criteria where the higher the
value, the more important is the factor or criterion.
3.12.6 Checking consistency of the pair-wise matrix
Consistency of the matrix was determined by calculating a consistency ratio (CR)
obtained from Consistency Index (CI) that expressed the deviation from consistency.
Following Coyle (2004), the Consistency Index for a matrix was obtained from the
following formula:
1max
−−
=n
nCI λ
33
Where n is the number of criteria in the comparison matrix, and maxλ is an estimate of the
Eigen value of the comparison matrix. If the comparison matrix is not perfectly
consistent, maxλ will be greater than the order of the matrix, n (Saaty and Vargas, 2001).
In order to compute maxλ , first the Eigenvector needed to obtain by multiplying together
the entries in each row of the matrix and then taking the nth root of that product. The nth
roots of all four rows were summed and that sum was used to normalize the eigenvector
elements to add to 1.00. The new eigenvector was obtained by multiplying on the matrix
of judgments by the eigenvector. The above computation yielded a CI value of 0.12.
The CI was then compared to the corresponding random consistency indices (RI)
described by Saaty and Vargas (2001) in which the upper row is the order of the random
matrix, and the lower is the corresponding index of consistency for random judgments
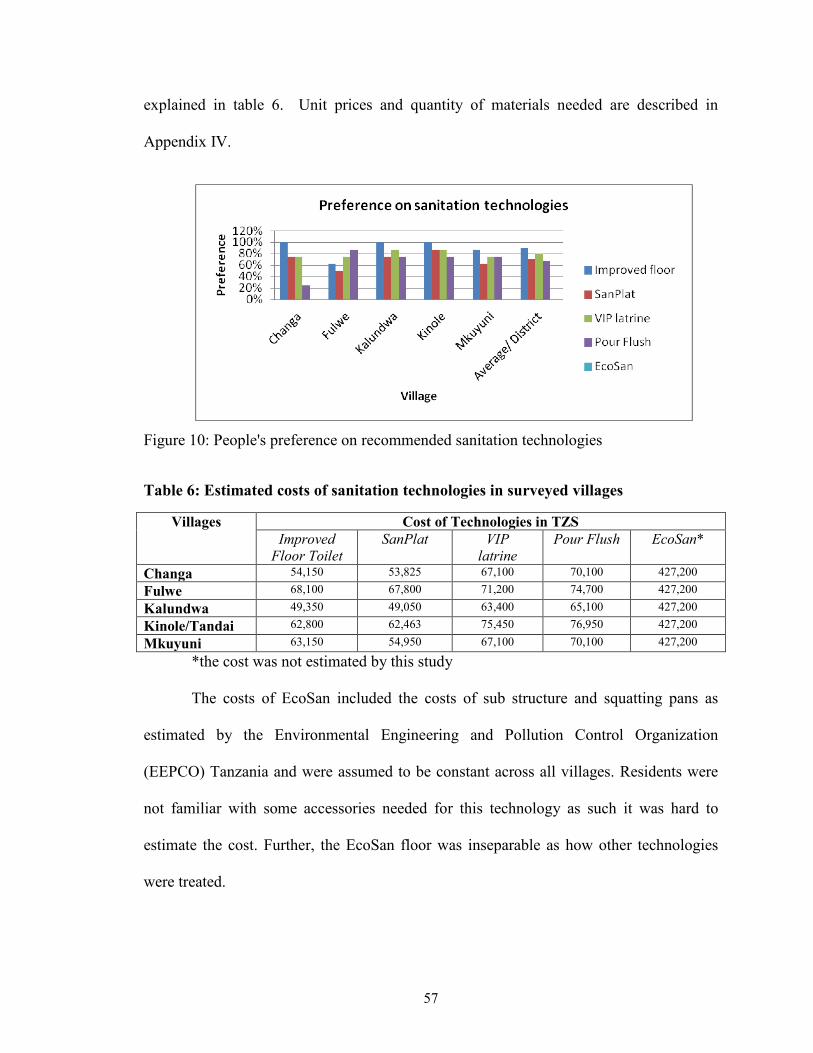
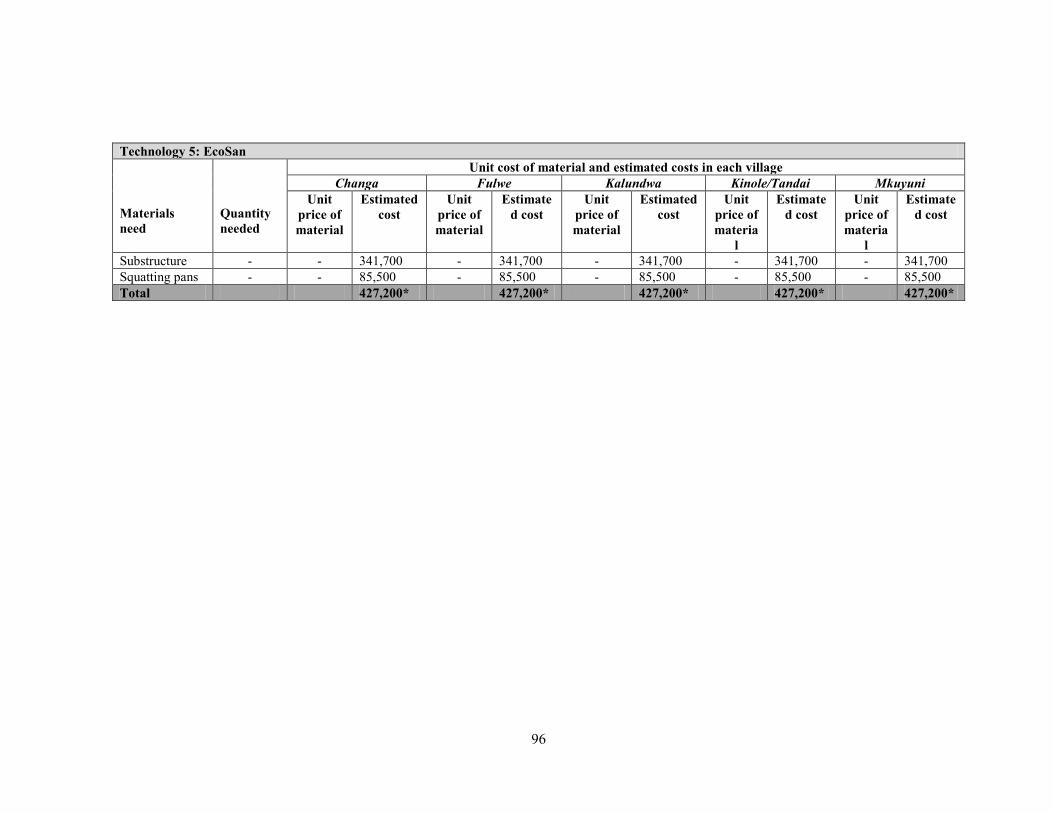
The costs of EcoSan included the costs of sub structure and squatting pans as
estimated by the Environmental Engineering and Pollution Control Organization
(EEPCO) Tanzania and were assumed to be constant across all villages. Residents were
not familiar with some accessories needed for this technology as such it was hard to
estimate the cost. Further, the EcoSan floor was inseparable as how other technologies
were treated.
58
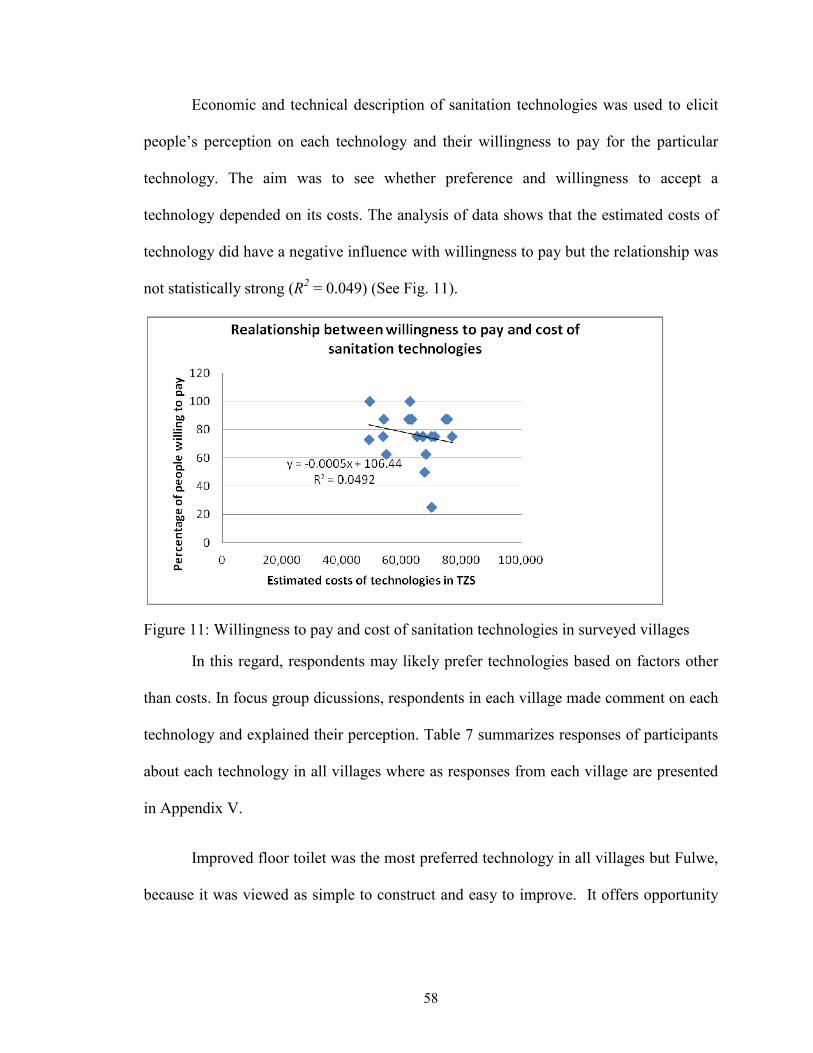
Economic and technical description of sanitation technologies was used to elicit
people’s perception on each technology and their willingness to pay for the particular
technology. The aim was to see whether preference and willingness to accept a
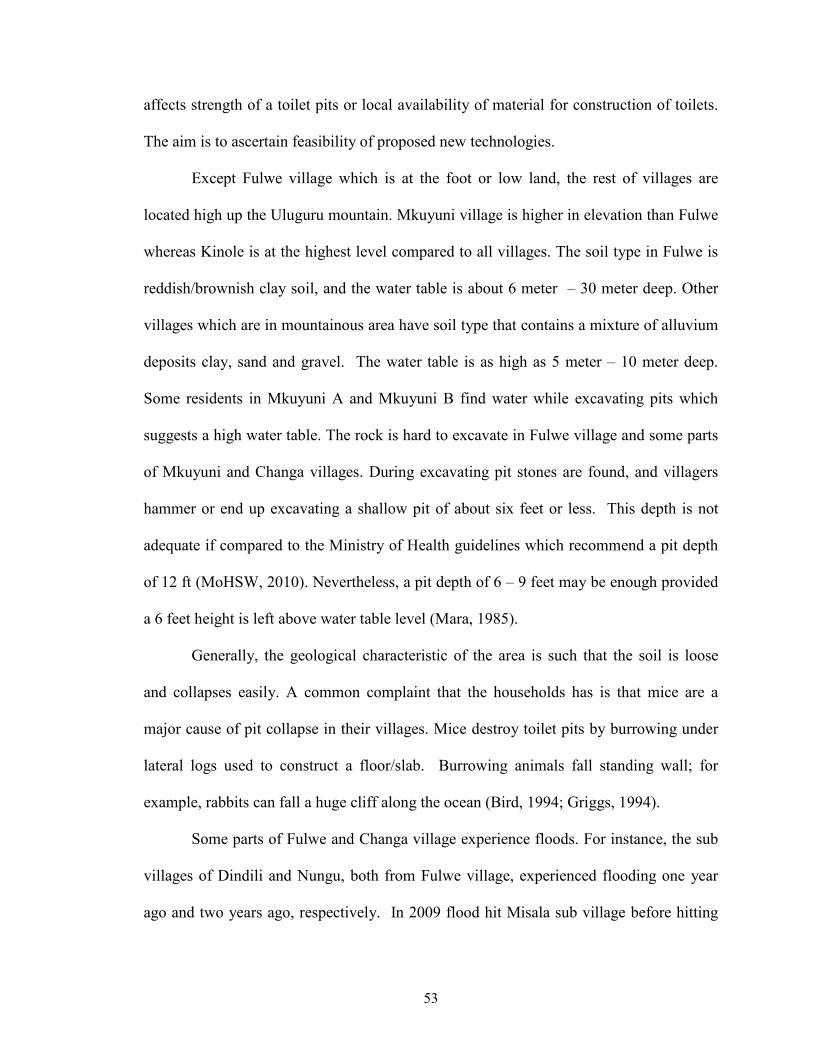
technology depended on its costs. The analysis of data shows that the estimated costs of
technology did have a negative influence with willingness to pay but the relationship was
not statistically strong (R2 = 0.049) (See Fig. 11).
Figure 11: Willingness to pay and cost of sanitation technologies in surveyed villages
In this regard, respondents may likely prefer technologies based on factors other
than costs. In focus group dicussions, respondents in each village made comment on each
technology and explained their perception. Table 7 summarizes responses of participants
about each technology in all villages where as responses from each village are presented
in Appendix V.
Improved floor toilet was the most preferred technology in all villages but Fulwe,
because it was viewed as simple to construct and easy to improve. It offers opportunity
59
for improvement like installing squatting pan or vent pipe. Participants also thought that
improved floor toilet does not induce dependence on external knowledge on construction
of toilets because local artisans who build main house can also be used to build a toilet
without special training. The technology however, is not popular in Fulwe due to its
disadvantages, such as smell and size of pit hole.
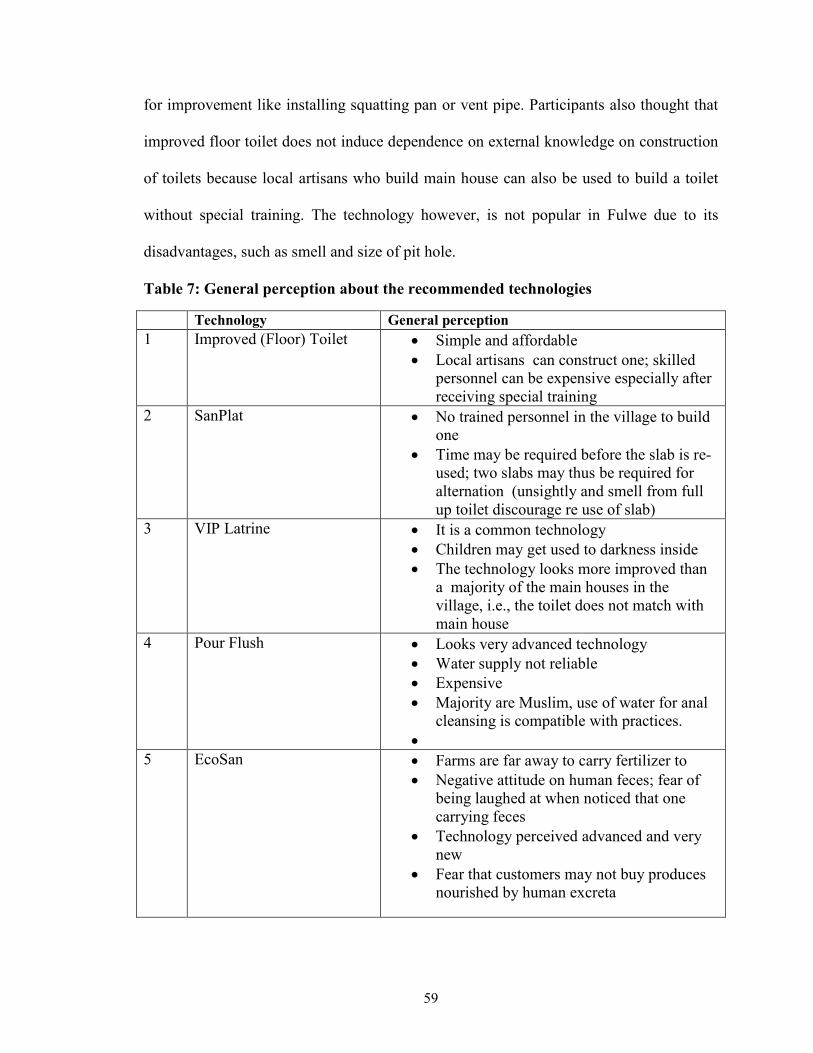
Table 7: General perception about the recommended technologies
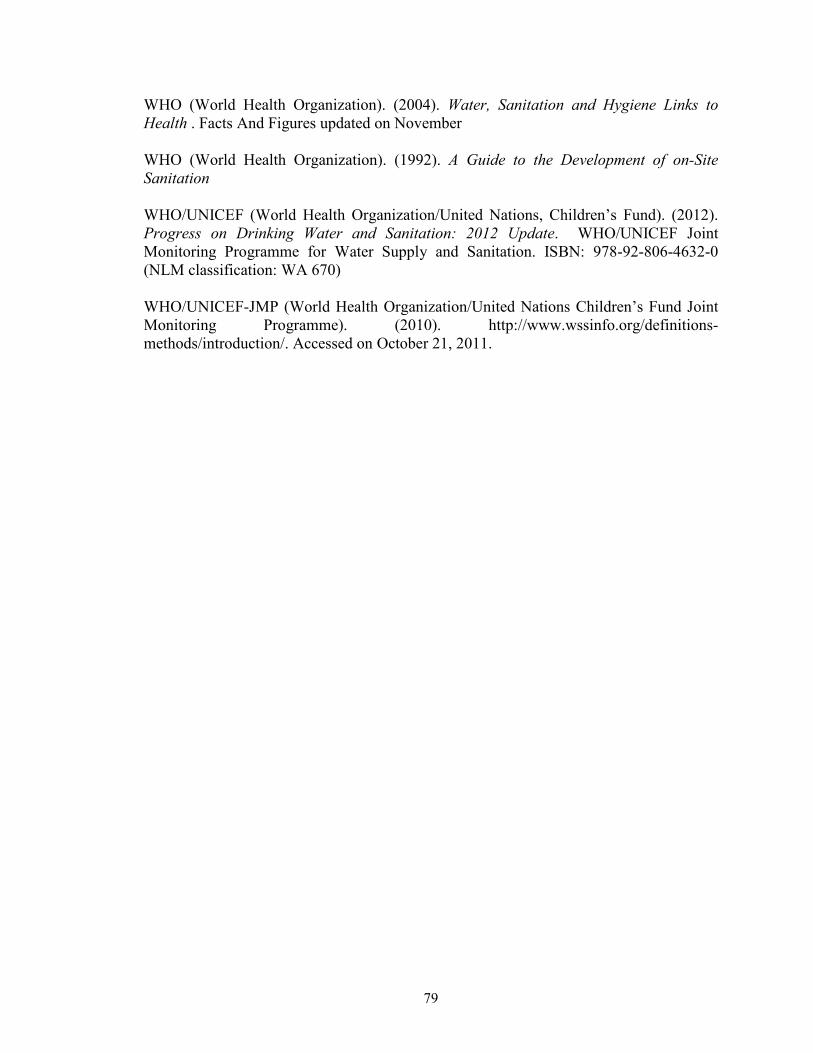
Technology General perception 1 Improved (Floor) Toilet • Simple and affordable
• Local artisans can construct one; skilled personnel can be expensive especially after receiving special training
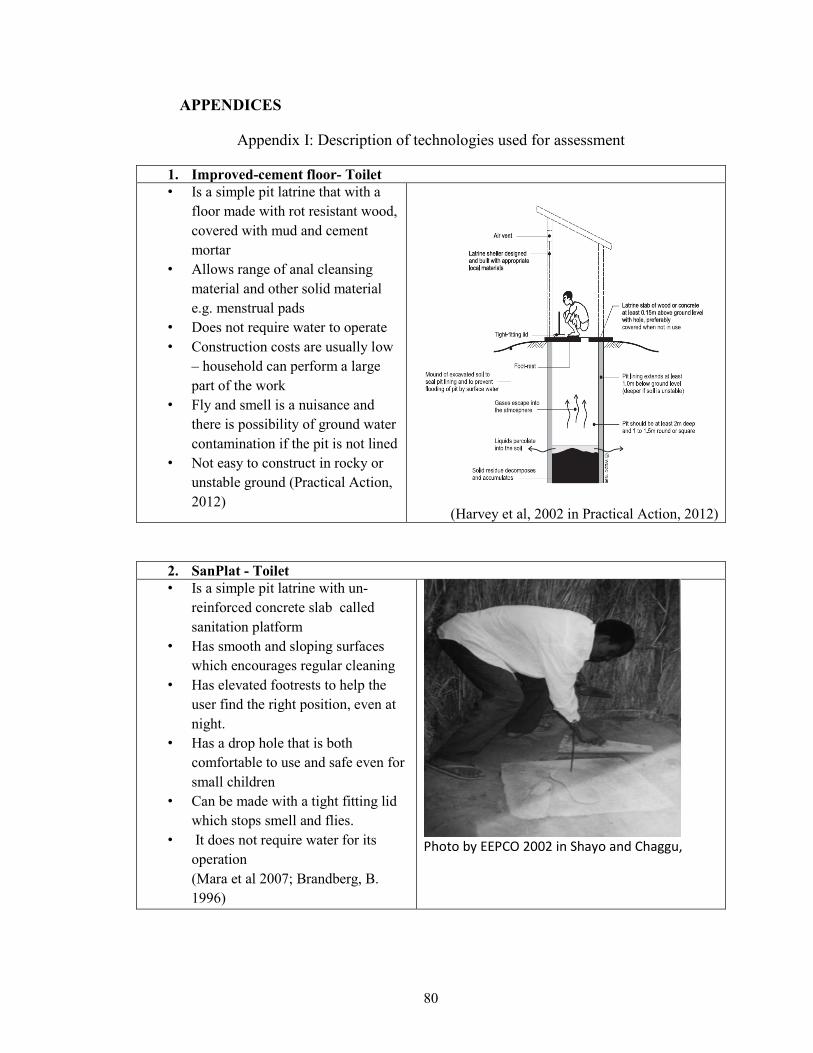
2 SanPlat • No trained personnel in the village to build one
• Time may be required before the slab is re-used; two slabs may thus be required for alternation (unsightly and smell from full up toilet discourage re use of slab)
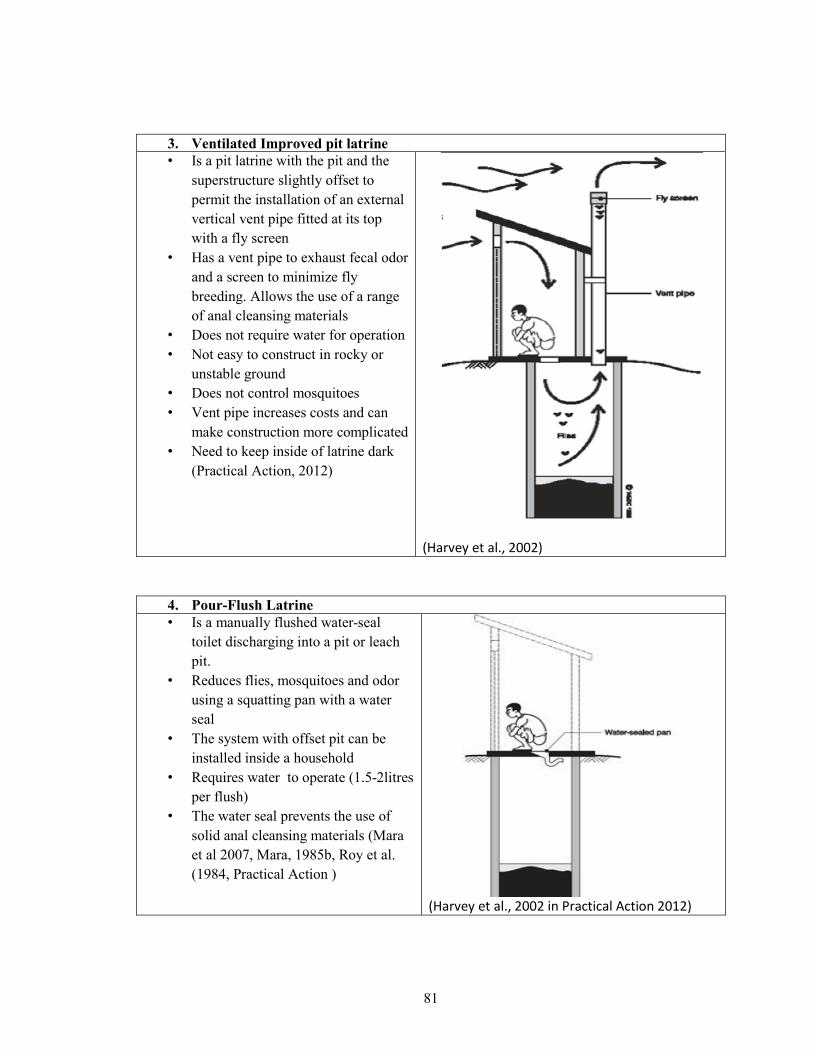
3 VIP Latrine • It is a common technology • Children may get used to darkness inside • The technology looks more improved than
a majority of the main houses in the village, i.e., the toilet does not match with main house
4 Pour Flush • Looks very advanced technology • Water supply not reliable • Expensive • Majority are Muslim, use of water for anal
cleansing is compatible with practices. •
5 EcoSan • Farms are far away to carry fertilizer to • Negative attitude on human feces; fear of
being laughed at when noticed that one carrying feces
• Technology perceived advanced and very new
• Fear that customers may not buy produces nourished by human excreta
60
Kalundwa village has limited access to water supply yet residents preferred pour
flush toilet. The main reasons were that residents viewed other technologies as inferior
and that they did not want to opt for an inferior technology. Further the village has
limited access to safe water supply, and therefore, choosing a technology that requires
water supply was seen as a way to pressurize government to supply more and safer
drinking water to their village.
SanPlat technology was simple and was the cheapest technology among all
technologies in all villages. The technology however wasn’t much preferred for it
required trained artisans. Their experience was that trained artisan frequently left their
villages or had standardized cost that may be hard to bargain by the majority of people in
the village. Local artisans were trained at Fulwe village in 2005. During this survey
however none of the trained artisan was found. The trained artisans either left the village
or changed carrier. Residents were hesitant to accept the idea of re-using the Sanplat
slab. Several of the households expressed that they would need more time before they
uninstalled a full pit and installed a new one. The smell and unsightly situation of a full
pit may be discouraging.
Villagers did not prefer ecological sanitation or EcoSan. The technology was seen
as a complex and expensive, and the fertilizer it provided was not required at the time
being. While residents planted banana trees in abandoned toilet pits, they did not want to
eat those bananas themselves but sold them. Another limitation of adopting EcoSan was
that farms are very far away from the villages they live and as such carrying
excreta/fertilizer may be required, an idea that didn’t sound socially acceptable to them.
61
4.7 Sustainability of technologies
Residents have preference on certain types of sanitation options. The physical
environment and other factors however may limit the use of the sanitation technology of
their choice. For instance, the pour flush toilet may be preferred by villagers, but the fact
that water may be in short supply in that particular village may limit its adoption. Some
residents may also like to construct an Ecosan but the unavailability of material locally or
skills may hinder its feasibility. The villagers nevertheless have to use one of the
improved sanitation technologies in order to improve their health and social well being. A
balance has to be sought to assist communities to choose ‘appropriate’ sanitation
technology that is compatible with their financial ability and willingness to pay, social
compatibility, physical environmental characteristics, and the characteristics of
technology. The following sustainability assessment is one of the ways to determine
what that appropriate technology would be for each village.
This study assessed sustainability of technologies by calculating composite
sustainable development index (ICSD). The calculation was accomplished on an excel
spread sheet as illustrated in Appendix VI. The calculation of ICSD took into consideration
the weights of the four criteria: social factor, affordability, technical feasibility, and
environmental factor. Experts working in the area of sanitation, hygiene and water supply
ranked the factors in a pair-wise comparison.
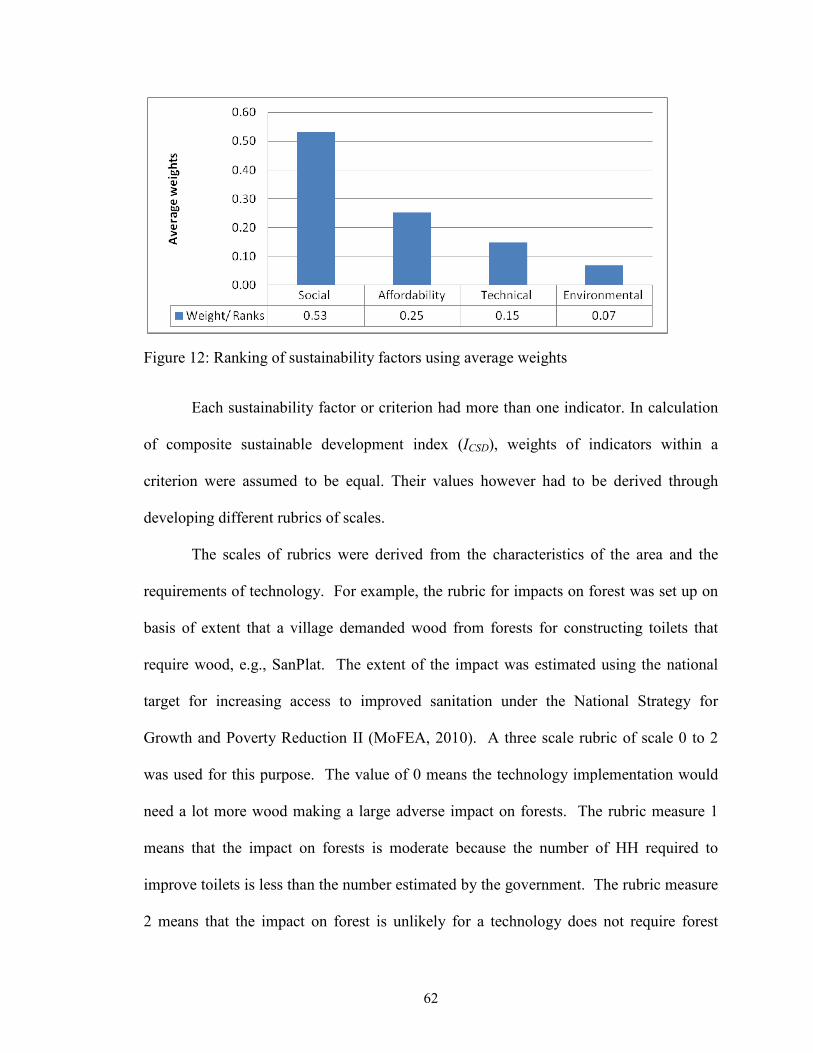
Using average weights from the pair-wise comparison matrix, (refer table 3), the
factors can be ranked as seen in Fig. 12. Social factors were ranked the highest while
environmental factors were ranked the least.
62
Figure 12: Ranking of sustainability factors using average weights
Each sustainability factor or criterion had more than one indicator. In calculation
of composite sustainable development index (ICSD), weights of indicators within a
criterion were assumed to be equal. Their values however had to be derived through
developing different rubrics of scales.
The scales of rubrics were derived from the characteristics of the area and the
requirements of technology. For example, the rubric for impacts on forest was set up on
basis of extent that a village demanded wood from forests for constructing toilets that
require wood, e.g., SanPlat. The extent of the impact was estimated using the national
target for increasing access to improved sanitation under the National Strategy for
Growth and Poverty Reduction II (MoFEA, 2010). A three scale rubric of scale 0 to 2
was used for this purpose. The value of 0 means the technology implementation would
need a lot more wood making a large adverse impact on forests. The rubric measure 1
means that the impact on forests is moderate because the number of HH required to
improve toilets is less than the number estimated by the government. The rubric measure
2 means that the impact on forest is unlikely for a technology does not require forest
63
instead uses concrete slabs (for example, VIP latrine). The government is planning to
increase the current level of access to improved sanitation of 23% of HH to the national
target of 35% by 2015 (MoFEA, 2010). Some survey villages already had more than
23% coverage; for example, Fulwe village had a coverage of 25%. Therefore, the forest
impact value for this village would be 2, meaning a low impact on its forests because the
number of HH that require improved toilets is lower. Some villages had coverage less
than the national baseline coverage of 23%; for example, Changa village had a coverage
of 2%. In this case if toilets that use woods are adopted, the impact will be the highest
and would receive an impact value of 0. Similar rubric was developed for other
indicators and are presented in Appendix III.
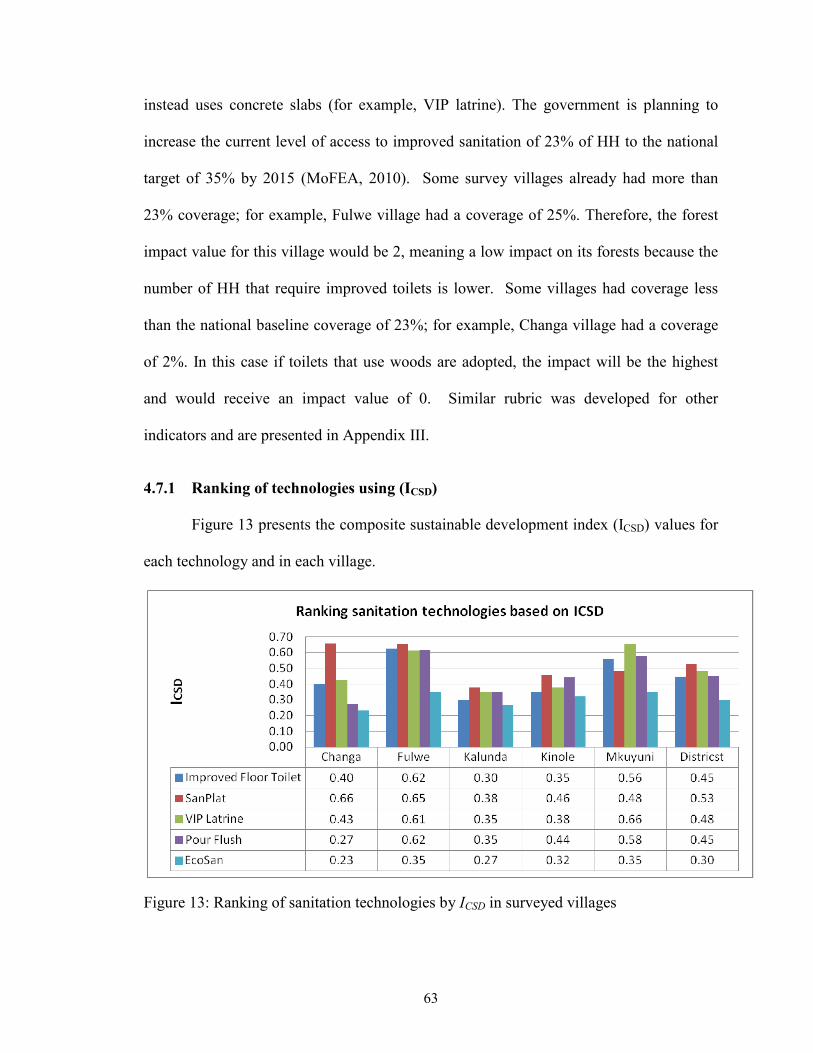
4.7.1 Ranking of technologies using (ICSD)
Figure 13 presents the composite sustainable development index (ICSD) values for
each technology and in each village.
Figure 13: Ranking of sanitation technologies by ICSD in surveyed villages
64
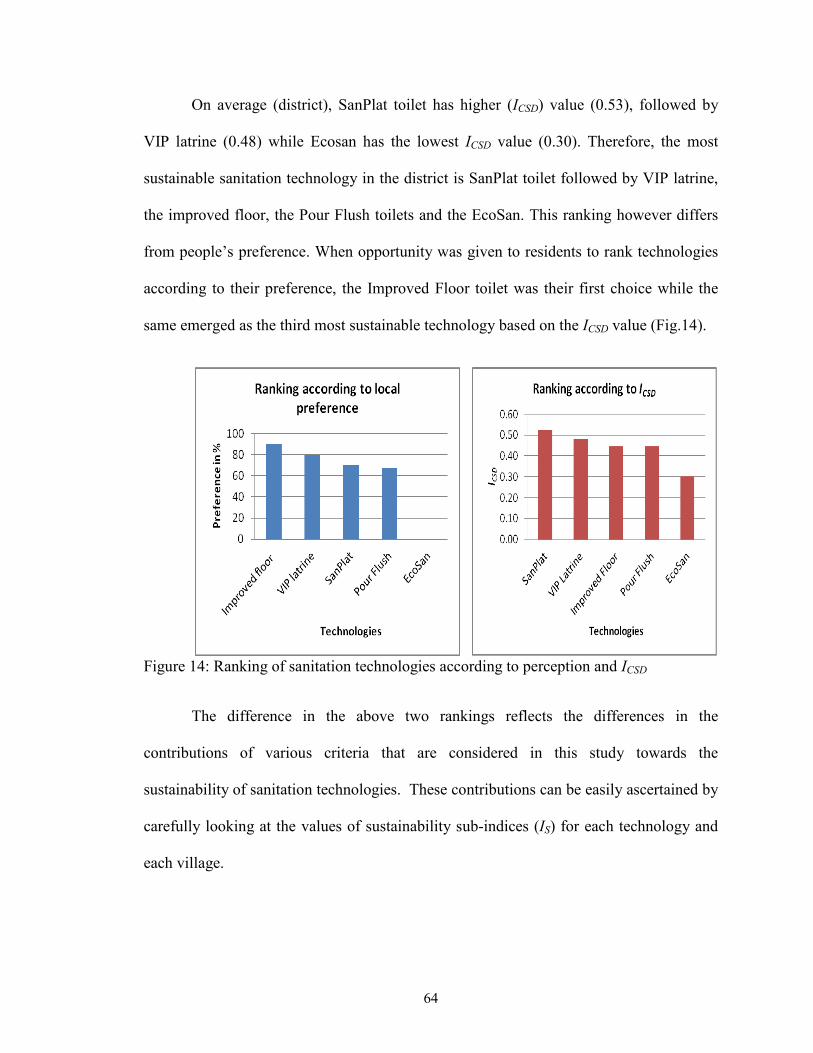
On average (district), SanPlat toilet has higher (ICSD) value (0.53), followed by
VIP latrine (0.48) while Ecosan has the lowest ICSD value (0.30). Therefore, the most
sustainable sanitation technology in the district is SanPlat toilet followed by VIP latrine,
the improved floor, the Pour Flush toilets and the EcoSan. This ranking however differs
from people’s preference. When opportunity was given to residents to rank technologies
according to their preference, the Improved Floor toilet was their first choice while the
same emerged as the third most sustainable technology based on the ICSD value (Fig.14).
Figure 14: Ranking of sanitation technologies according to perception and ICSD
The difference in the above two rankings reflects the differences in the
contributions of various criteria that are considered in this study towards the
sustainability of sanitation technologies. These contributions can be easily ascertained by
carefully looking at the values of sustainability sub-indices (IS) for each technology and
each village.
65
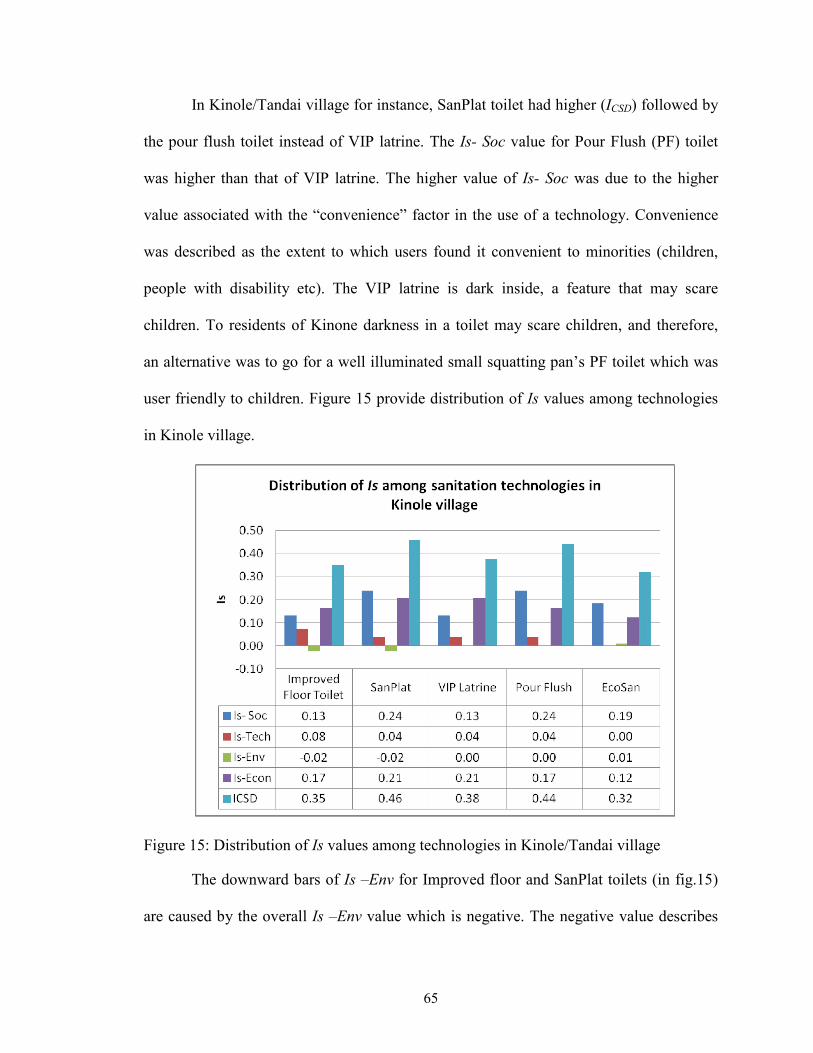
In Kinole/Tandai village for instance, SanPlat toilet had higher (ICSD) followed by
the pour flush toilet instead of VIP latrine. The Is- Soc value for Pour Flush (PF) toilet
was higher than that of VIP latrine. The higher value of Is- Soc was due to the higher
value associated with the “convenience” factor in the use of a technology. Convenience
was described as the extent to which users found it convenient to minorities (children,
people with disability etc). The VIP latrine is dark inside, a feature that may scare
children. To residents of Kinone darkness in a toilet may scare children, and therefore,
an alternative was to go for a well illuminated small squatting pan’s PF toilet which was
user friendly to children. Figure 15 provide distribution of Is values among technologies
in Kinole village.
Figure 15: Distribution of Is values among technologies in Kinole/Tandai village
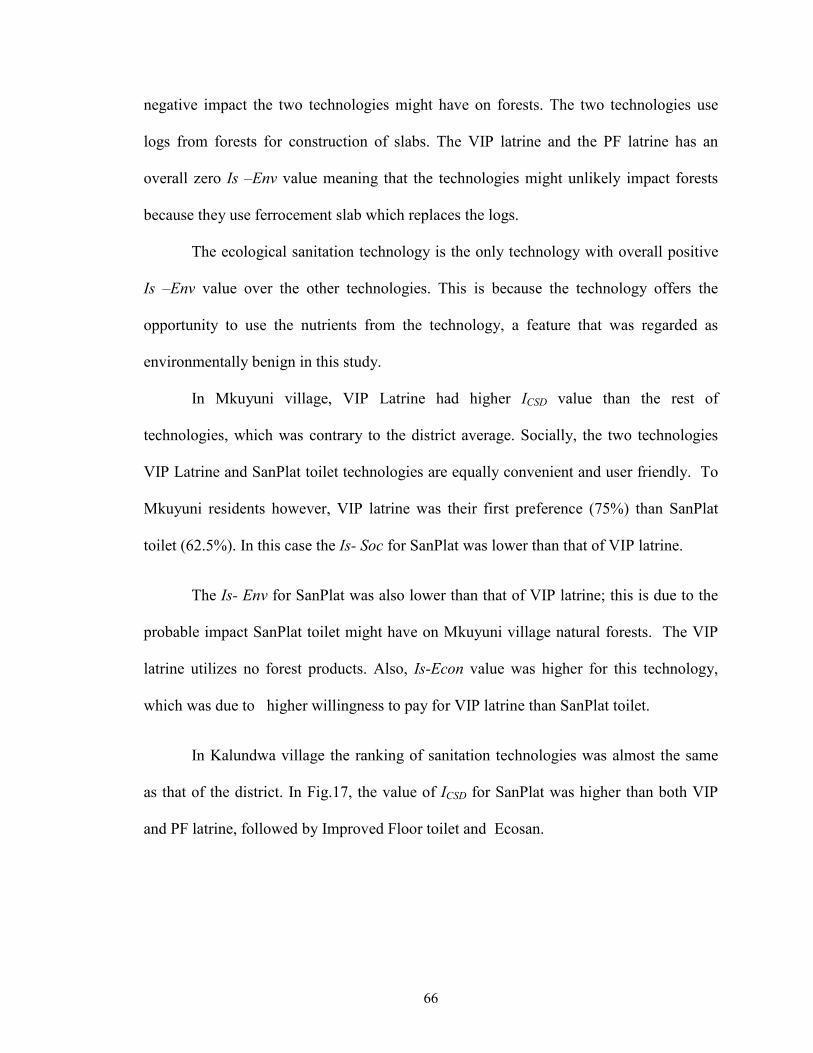
The downward bars of Is –Env for Improved floor and SanPlat toilets (in fig.15)
are caused by the overall Is –Env value which is negative. The negative value describes
66
negative impact the two technologies might have on forests. The two technologies use
logs from forests for construction of slabs. The VIP latrine and the PF latrine has an
overall zero Is –Env value meaning that the technologies might unlikely impact forests
because they use ferrocement slab which replaces the logs.
The ecological sanitation technology is the only technology with overall positive
Is –Env value over the other technologies. This is because the technology offers the
opportunity to use the nutrients from the technology, a feature that was regarded as
environmentally benign in this study.
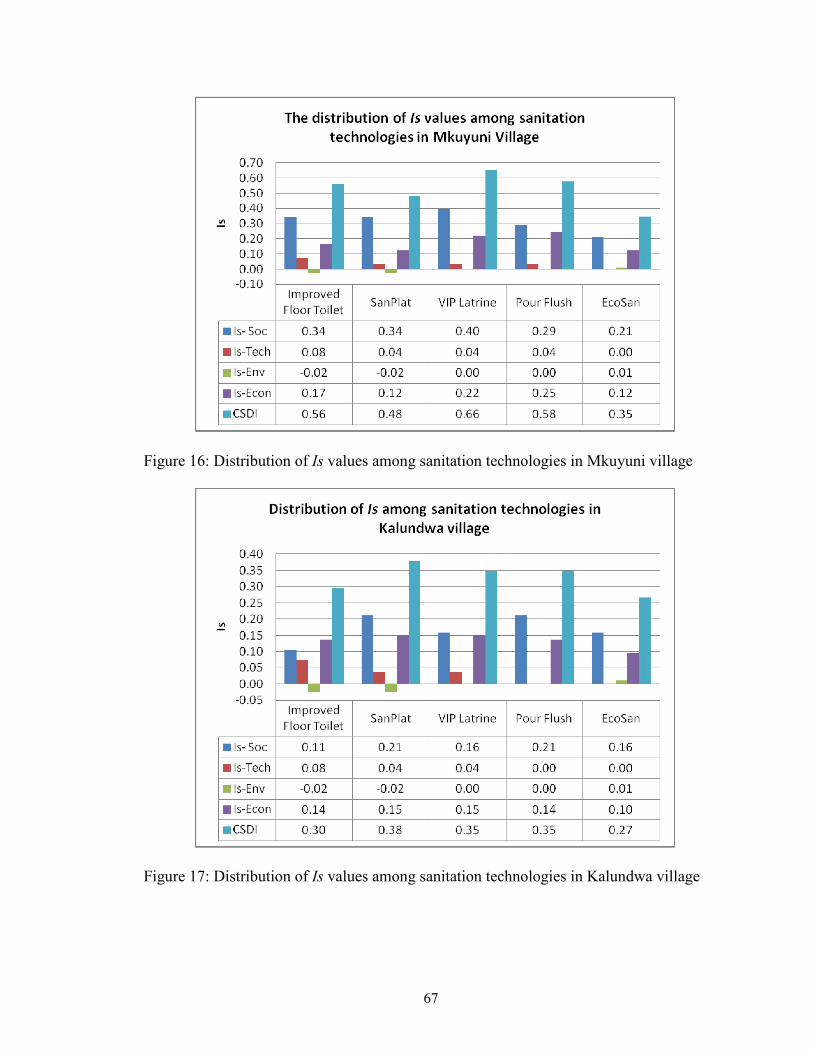
In Mkuyuni village, VIP Latrine had higher ICSD value than the rest of
technologies, which was contrary to the district average. Socially, the two technologies
VIP Latrine and SanPlat toilet technologies are equally convenient and user friendly. To
Mkuyuni residents however, VIP latrine was their first preference (75%) than SanPlat
toilet (62.5%). In this case the Is- Soc for SanPlat was lower than that of VIP latrine.
The Is- Env for SanPlat was also lower than that of VIP latrine; this is due to the
probable impact SanPlat toilet might have on Mkuyuni village natural forests. The VIP
latrine utilizes no forest products. Also, Is-Econ value was higher for this technology,
which was due to higher willingness to pay for VIP latrine than SanPlat toilet.
In Kalundwa village the ranking of sanitation technologies was almost the same
as that of the district. In Fig.17, the value of ICSD for SanPlat was higher than both VIP
and PF latrine, followed by Improved Floor toilet and Ecosan.
67
Figure 16: Distribution of Is values among sanitation technologies in Mkuyuni village
Figure 17: Distribution of Is values among sanitation technologies in Kalundwa village
68
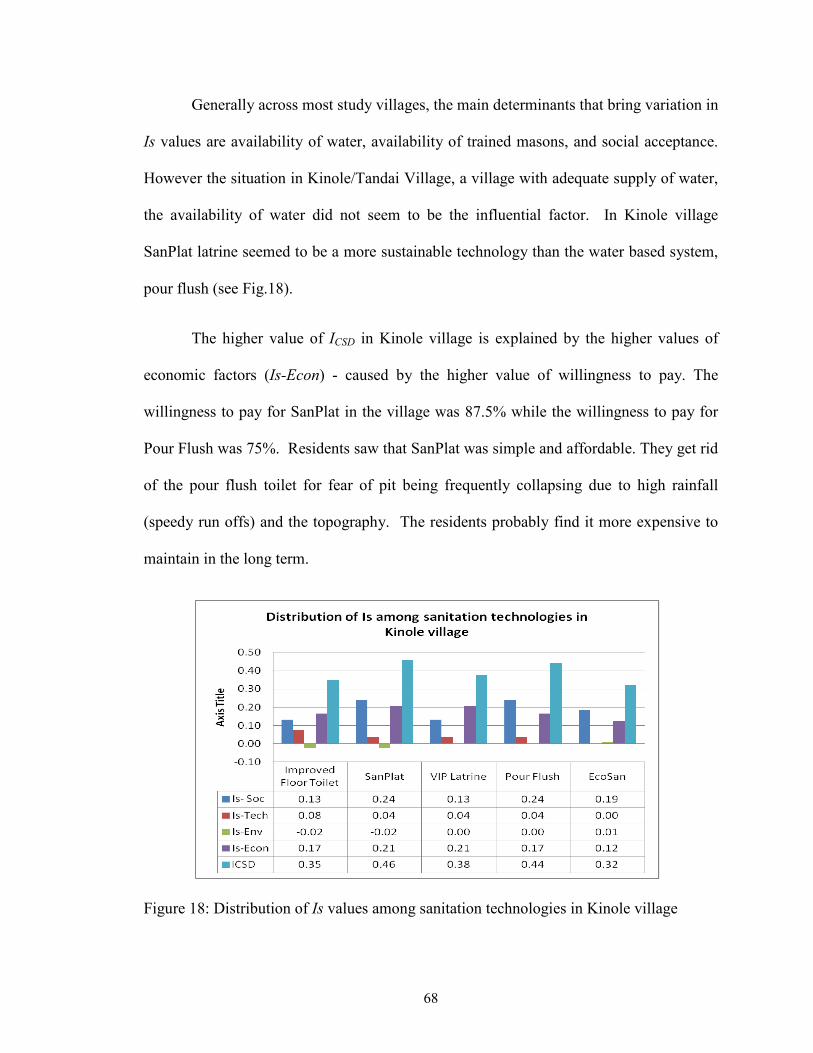
Generally across most study villages, the main determinants that bring variation in
Is values are availability of water, availability of trained masons, and social acceptance.
However the situation in Kinole/Tandai Village, a village with adequate supply of water,
the availability of water did not seem to be the influential factor. In Kinole village
SanPlat latrine seemed to be a more sustainable technology than the water based system,
pour flush (see Fig.18).
The higher value of ICSD in Kinole village is explained by the higher values of
economic factors (Is-Econ) - caused by the higher value of willingness to pay. The
willingness to pay for SanPlat in the village was 87.5% while the willingness to pay for
Pour Flush was 75%. Residents saw that SanPlat was simple and affordable. They get rid
of the pour flush toilet for fear of pit being frequently collapsing due to high rainfall
(speedy run offs) and the topography. The residents probably find it more expensive to
maintain in the long term.
Figure 18: Distribution of Is values among sanitation technologies in Kinole village
69
5.0 CONCLUSIONS AND RECOMENDATION
The Rural Tanzania is known for reliance on poor sanitation technologies. Past
studies have found strong relationship between poor sanitation and high morbidity and
mortality, especially sanitation-related diseases like diarrhea. The national strategy for
growth and poverty reduction has set targets for increasing improved sanitation services,
but these targets remain far from being achieved. There has been no systematic study to
understand the technical and socio-economic reasons people are slow to adopt improved
sanitation technologies. The aim of this study was to assess the sustainability of
sanitation technologies in rural Tanzania, based on a case study of Morogoro District.
Specifically, the research assessed the existing sanitation conditions and the associated
health, environmental and socio-economic problems in the study area. The study then
made an attempt to determine the physical-environmental characteristics and socio-
economic and institutional factors influencing the adoption of alternative sanitation
technologies. Further, the study applied a comprehensive framework of sustainability
indicators to rank sanitation technologies based on established sustainability criteria.
5.1 Existing sanitation conditions and the associated problems
Sanitation status in the study area is generally poor; toilets are constructed with
temporary materials. They have a mud floor, lack hand washing facilities and a
mechanism for controlling odor and flies thus compromising environmental health.
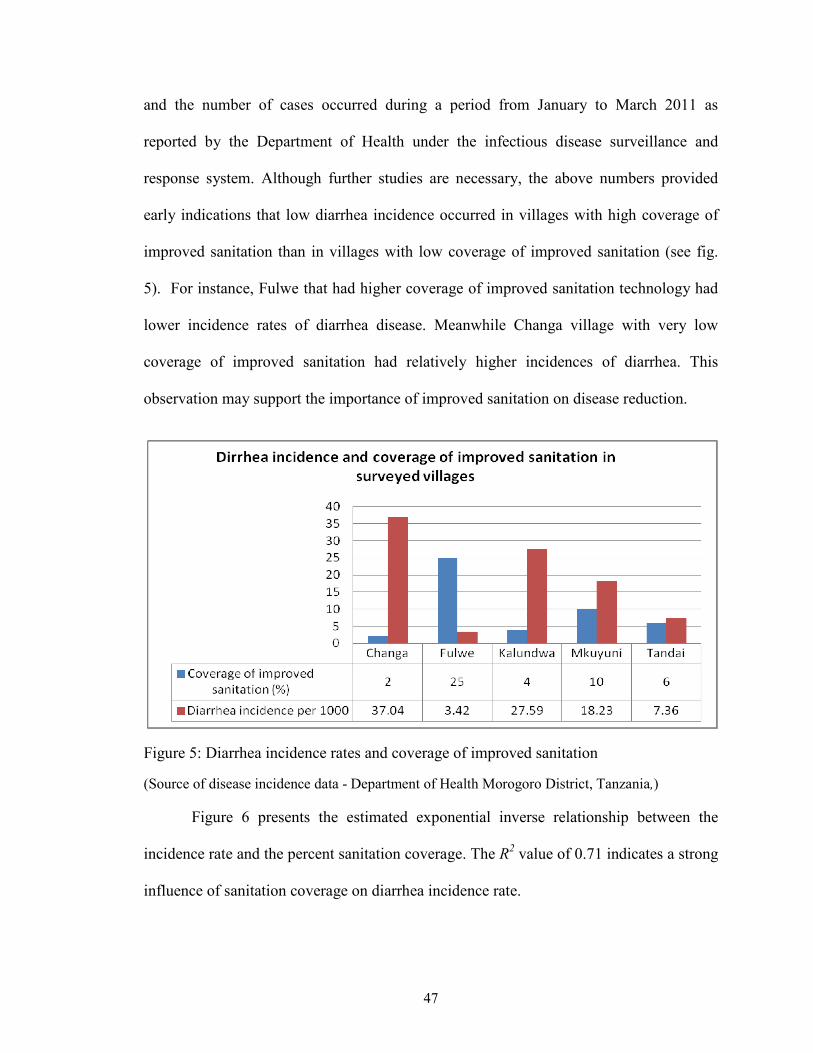
Incidence of diarrhea is high in villages with low coverage of improved sanitation.
Socio-cultural lifestyle of people compounded with habitual behavior and low education
level result into reliance on poor sanitation facilities and hygiene practices. In a study
70
conducted in Dar es salaam, Tanzania, habitual behavior was also seen as a barrier to
adoption of improved sanitation technologies (Chaggu et al., 2002).
Proportion of households with improved toilets (9.4%) is lower than national level
(23%). Since the national estimate is used to set target, these villages are likely to remain
behind other villages by 2015. Further, sanitation coverage in the rural area is likely to
lag behind coverage in urban areas in general because the initial sanitation target itself is
set lower in rural areas than in urban areas. As documented in the National Strategy for
Growth and Reduction of Poverty (NSGRP II), 2010 to 2015, the target is to increase the
number of households using improved toilets from 23 percent in rural areas and 27
percent in urban areas in 2010 to 35 percent rural areas and 45 percent urban areas in
2015 (MoFEA, 2010). Demand for sanitation are even higher in rural areas given their
higher number and limited access to health services, more effort are needed to improve
access to sanitation in rural areas.
5.2 Factors influencing adoption of alternative sanitation technologies
Limited access to adequate quantities of water may not limit the adoption of water
based technologies. There is adequate supply of water in Kinole than in Fulwe village,
yet residents in Kinole prefer SanPlat than Pour Flush due to other reasons. Access to
water was limited at Fulwe village yet PF toilet was a most preferred technology and as
well a sustainable technology than non water based technology like VIP latrine. This
indicate that selection of technology appropriate to an area has to consider social
characteristics of the locality especially preferences.
71
This study finds that in places where water table is higher, soil is loose and
gravelly, and burrowing animals are dominant, residents excavate shallow pits, which
provide poor sanitation service. Toilets in these villages lack cement floor and exposed to
outside weather (speedy run of, heavy rain and sloppy land) leading to their frequent
collapse. This calls for education on pit strengthening techniques and proper location in
order to protect both public health and the environment.
5.3 Sustainability of sanitation technologies and final ranking
The study results indicate that physical, socio-cultural, economic and institutional
characteristics of the area favor introduction and adoption of recommended new
sanitation technologies to a certain extent. Local characteristics determined the extent to
which one technology could be regarded most sustainable than the other. Factors like lack
of trained personnel, water table level, awareness about the available technology,
institutional framework at lower level are some of the area that determine sustainability
of a sanitation technology in a given locality.
On basis of composite sustainable development index (ICSD), the proposed
sanitation technologies may be sustainable in the order of most sustainable to least
Pour flush toilet, and (5) EcoSan. The ranking differs from people’s preferences, the
observation that signifies the importance of community participation in decision making.
Identification of most appropriate and sustainable sanitation technology paves a
way for technology improvement in rural Tanzania. The most sustainable technology
may be first introduced on a pilot basis and ensuring effective local participation. The
72
two way feedback mechanism that will facilitate redesign and improvement of the
technology to a level that meets demands of users is critical. Based on the study results,
we draw the following policy recommendations:
1. Residents have to be educated on health benefits of impervious floor. Impervious
floor is important even though main house does not have one (cement floor).
2. Education on low cost techniques for pit lining has to be provided to avoid
frequent pit collapse.
3. People have to be educated on risk and benefit associated with reuse of squatting
slab and nutrients from toilets. When one knows the benefit, he or she may find a
way to achieve it. For instance, during this study, we observed many local
modifications of pour flush system, which aimed at reducing the amount of water
for flushing.
4. Residents have to be informed of the available sanitation options given the
physical environment characteristics of their area.
5. Hand washing facilities were rare but people use water stored as washers to wash
their hands without soap. Further research may be required to assess whether
washing hand with soap using water stored as washer may render hands free from
fecal contamination.
6. The system that oversees sanitation need to be strengthened to ensure adequate
consultation for villagers on proper sanitation technologies and hygiene practices.
This goes together with continuous monitoring of progress in access to improved
sanitation, sanitation-related communication and training. Such progress must be
documented in important district and national reports.
73
7. The model for assessing sustainability of sanitation technologies by aggregating
different criteria (socio, economic, environmental and health) and indicators is
effective in assessing sustainability of sanitation technologies.
8. While village or district level comprehensive (aggregate) indicators may be useful
in ranking multiple technologies, it is important to look into constituent or sub-
component indicator values for specific village or technology in order to
understand the effect or significance of extreme factors. Such extreme factors
shed light on the need for specific policies promoting sanitation improvement
(e.g., education, government incentives, etc.).
9. Ward health officer and other staff working in the area of sanitation and hygiene
should be exposed to available low cost improved sanitation technologies and
innovative community participatory approaches. This is an important strategic
area in human and institution capacity development and may help rural Tanzania
meet its national targets for sanitation and hygiene in a timely fashion.
74
REFERENCES
Basu, S. and Weil, D.N. (1998). Appropriate technology and growth. Quarterly Journal of Economics 113 (4), 1025–1054. Bird, C.F.E (1994. Cliff Hazard and Coastal Management. In Coastal Hazards, Perception, Susceptibility and Mitigation, Finkl W.C. Jr. (Editor). The coastal Education and Research Foundation (CERF). Charlottesville, Virginia, and Fortd Lauderdale, Florida pp. 299-309 Brandberg, B. (1996). New Strategies for Community-based Sustainable Sanitation Programmes Using SanPlats and the New SanPlat Moulds, revised edition. SBI Consulting and Supplies, Mbabane, Swaziland (SanPlat details are given at www. sanplat.com). Chaggu, E., Mashauri, D., Buuren, J., Sanders, W. and Lettinga, G. (2002). Excreta Disposal in Dar-es Salaam. Environmental management, 30(5), 0609-0620 Checkley, W., Gilman, R.H., Black, R.E., Epstein, L.D., Cabrera, L., Sterling, C.R. and Moulton, L.H. (2004). Effect of water and sanitation on childhood health in a poor Peruvian peri-urban community. The Lancet, 363(9403), pp. 112-118. Cleavan, F. and Toner, A. (2006).The evolution of community water governance in Uchira, Tanzania: The implications for equality of access, sustainability and effectiveness. Natural Resources Forum; . 30(3). p207-218, DOI: 10.1111/j.1477-8947.2006.00115.x Crang, M. and Cook, I. (2007). Doing ethnographies, Sage Diwan, R and Livingston, D. (1979). Alternative Development Strategies and Appropriate Technology: Science Policy for an Equitable World Order, Pergamon Press. New York. Dzwairo, B., Hoko, Z., Love, D. and Guzha, E. (2006). Assessment of the impacts of pit latrines on groundwater quality in rural areas: A case study from Marondera district, Zimbabwe. Physics and Chemistry of the Earth, Parts A/B/C, 31(15-16), 779-788 Eisenberg, J. N., Scott, J. C., Porco, T. (2007). Integrating disease control strategies: Balancing water sanitation and hygiene interventions to reduce diarrheal disease burden (plus letter and reply). Am. J. Public Health, 97 (5), 846–852. Global Alliance for Community Development; Accessed on 4/30/2012 shttp://www.thegacd.org/Our%20Programs/Health/Health.html
Geoff, C. (2004). The Analytic Hierarchy Process (AHP). Practical Strategy. Open Access Material. AHP. Pearson Education Limited Griggs B.G. (1994). California’s Coastal hazards. In Coastal Hazards, Perception, Susceptibility and Mitigation. Finkl W.C Jr. (Editor). The coastal Education and Research Foundation (CERF). Charlottesville, Virginia, and Fortd Lauderdale, Florida pp. 1- 15 Hall, B. (1978). Mtu ni Afya. Tanzania's Health Campaign. Clearinghouse, Washington, DC, USA. Harvey, P.A., Baghri, S. and Reed, R.A. (2002). Emergency Sanitation: Assessment and programme design. WEDC, Loughborough University, UK. Hoko, Z. and Hertle, J. (2006). An evaluation of the sustainability of a rural water rehabilitation project in Zimbabwe. Phys. Chem. Earth, 31. 699-706 Howard, G. and Bartram, J. (2003). Domestic water quantity, service level and health. World Health Organisation, Geneva International water and sanitation centre (IRC). (2012). http://washhelpdesk.wordpress.com /2010/11/25/ differences-between-on-site-sanitation-and-off-site-sanitaton-zimbabwe/. Accessed on 5/6/2012 Igulu, S.B. (2010). Household factors contributing to recurrent episodes of acute diarrhoea in children under the age of five years in Kinondoni- Tanzania. Master’s Thesis. Lund University Jensen, P.K., Phuc, D.P., Dalsgaard, A., Konradsen, F. (2005). Successful sanitation promotion must recognize the use of latrine wastes in agriculture – the example of Vietnam. Bull. WHO 83, 873–874. Jequier, N. and Blanc, G. (1983). The World of Appropriate Technologv A Qualitative Analysis. Development Centre of the Organization for Economic Co-operation and Development, Paris. P. 6. Kabongo, I. and Charles, K., (2008). Pit Latrines & their Impact on Groundwater in Small Towns in Uganda A case of Bugiri Town Council Katukiza, A. Y., Ronteltap, M., Oleja, A., Niwagaba, C. B., Kansiime, F. & Lens, P. N. L. (2010). Selection of sustainable sanitation technologies for urban slums -- A case of Bwaise III in Kampala, Uganda. Science of The Total Environment, 409, 52-62. Knappett P.S.K., Escamilla, V., Layton, A., McKay, L.D., Emch, M., Williams, D.E., Huq, R., Alam, J., Farhana,L., Mailloux, B.J., Ferguson, A., Sayler, G.S., Ahmed, K.M.,
76
van Geen, A., (2011). Impact of population and latrines on fecal contamination of ponds in rural Bangladesh. Science of The Total Environment, 409(17), 3174-3182 Krajnc, D. and Glavič, P. (2005). A model for integrated assessment of sustainable development. Resources, Conservation and Recycling, 43(2), 189-208 Kvarnström E., Bracken, P., Ysunza, A., Kärrman, E., Finsson, A. and Saywell, D. (2004). Sustainability Criteria in Sanitation Planning, 30th WEDC International Conference, Vientiane, Lao PDR. Lahiri, S. and Chanthaphone, S. ( 2003). Water, sanitation and hygiene, a situation analysis paper for Lao PDR. Int. J. Environ. Health Res., S110-S117. http://www.who.int/mediacentre/factsheets/fs330/en/index.html accessed on 2/25/2012 Leone, T., Coast, E., Randall, S., (2009). Did you sleep here last night? The impact of the household definition in sample surveys: A Tanzanian case study. Presentation at British Society for Population Studies annual conference, September 9–11, Brighton, England. Lockwood, H., Smits, S., Schouten, T., Moriarty, P. (2010). Providing Sustainable Water Services at Scale. International Symposium on Rural Water Services, Kampala 13th to 15th April, 2010 Loetscher, T. and J. Keller. (2002). A decision support system for selecting sanitation systems in developing countries. Socio-economic planning sciences, 36(4), 267-290 Lyimo, C.W, Shayo, R, Lyimo T.J, (2008). Community Awareness on Microbial Water Pollution and Its Effects on Health Development in Urban Tanzania: A Case Study of Tabata and Kiwalani Wards in Ilala District in Dar es Salaam Region. Tanzania Journal of Development Studies 8(2) Lynch, J. and Kaplan, G.A. (2000). Socioeconomic position. In: Berkman LF, Kawachi I, eds. Social Epidemiology. New York: Oxford University Press. Pp 13–35 Los, B. and Timmer, P. (2005). The ‘appropriate technology’ explanation of productivity growth: An empirical approach. Journal of Development Economics 77, 517–531. Mara, D., Drangert, J., Anh N., Tonderski, A., Gulyas, H., Tonderski, K. (2007). Selection of sustainable sanitation arrangements. Water Policy 9:305–18 MDC (Morogoro Distric Council) 2011. District Socio-economic Profile, 2011. Malisie, F. A. (2008). Sustainability Assessment on Sanitation Systems for Low Income Urban Areas in Indonesia. PhD Dissertation, Hamburg University of Technology (TUHH)
77
Mara, D. D. (1985). The Design of Ventilated Improved Pit Latrines. TAG Technical Note No. 13. The World Bank, Washington, DC (available at www.leeds.ac.uk/civil/ceri/ water/tphe/ publicat/watsan/watsan.html). Mara, D. D. (1985b). The Design of Pour-Flush Latrines. TAG Technical Note No. 15. The World Bank, Washington, DC (available at www.personal.leeds.ac.uk /~cen6ddm/ wbreports.html). McCubbin, N. C., (2007). Determinants of sustainability in rural sanitation: Village level factors influencing sustained latrine uptake. March 2007 progress report, prepared for WaterAid Tanzania Ministry of Health and Social Welfare (2009). Sanitation and hygiene Policy - Draft. Dar es salaam Ministry of Health and Social Welfare (2010). Latrine Options And Construction Guide-Draft Ministry of Finance and Economic Affairs (MoFEA) [Tanzania]. (2010). National Strategy for Growth and Reduction of Poverty ( NSGRP) II. ISBN: 978-9987-08101-1. Available online at Website: www.povertymonitoring.go.tz; www.mof.go.tz; www.tanzania.go.tz Morgan, P. R. & Mara, D. D. (1982). Ventilated Improved Pit Latrines: Recent Developments in Zimbabwe. Technical Paper No. 3. The World Bank, Washington, DC (available at www-wds.worldbank.org/servlet/WDSContentServer/WDSP/IB/ 2000/09/14/000178830_98101904151810/Rendered/PDF/multi_page.pdf). Mtungila, J. and Chipofya, V. (2009). Issues and challenges of providing adequate sanitation to people living on the shore of Lake Malawi: Case of Monkey Bay, Malawi. Desal, 248(1-3), 338-343 Murphy, H. M., McBean, E. A., and Farahbakhsh, K. (2009). Appropriate technology – A comprehensive approach for water and sanitation in the developing world. Technology in Society, 31(2), 158-167. National Bureau of Statistics (NBS), 2010. Tanzania Demographic and Health Survey (TDHS). Dar es Salaam, Tanzania: NBS and ICF Macro. Nelson, K. L., and Murray, A. (2008). Sanitation for unserved populations: Technologies, implementation challenges, and opportunities. Annual Review of Environment and Resources, 33, 119-119-151. Parente, S.L., Prescott, E.C. (1994). Barriers to technology adoption and development. Journal of Political Economy 102 (2), 298–321.
Practical Action, 2012. Types Of Toilet And Their Suitability. The Schumacher Centre for Technology and Development, Bourton on Dunsmore, Rugby, Warwickshire, CV23 9QZ, UK www.practicalaction.org Roy, A. K., Chatterjee, P. K., Gupta, K. N., Khare, S. T., Rau, B. B. & Singh, R. S. (1984). Manual on the Design, Construction and Maintenance of Low-cost Pour-flush Waterseal Latrines. TAG Technical Note No. 10. The World Bank, Washington, DC (available at http://www wds.worldbank.org/servlet/ WDSContentServer/ WDSP/IB/ 2000/03/03/000178830_ 98101903445485/Rendered/PDF/multi0page.pdf). Saaty, T.L. (1980). Analytical Hierarchy Process: Planning, Priority Setting, Resource Allocation. NewYork: McGraw-Hill; Saaty, T. L. and Vargas G. L. (2001). Models, Methods, Concepts & Applications of the Analytic Hierarchy Process. Boston: Kluwer Academic Publishers Sustainable Sanitation Alliance (2011). What is sustainable sanitation? . Sustainable Sanitation Alliance. http://www.susana.org/lang-en/intro. Accessed on October 21, 2011. Thomas J.C, Weber, D.J. (2001). Epidemiologic Methods for the Study of Infectious Diseases. New York, NY: Oxford University Press, 2001. ISBN 0-19-512112-0 UN (United Nations). (2010). The Millennium Development Goals Report. United Nations, New York UN-WWAP (United Nations World Water Development Programme). (2006). The United Nations World Water Development Report 2: 'Water, a shared responsibility'. Paris and France, UNESCO and Berghahn Books UN (United Nations). (2010). The Millennium Development Goals Report. United Nations, New York Whittington, D., 2011. Pricing Water and Sanitation Services., 79-95 The U.S Bureau of Democracy, Human Rights, and Labor, (2009). International Religious Freedom, 2009 report. Accessed on 07/24/2012 at http://www.state.gov/j/drl/rls/irf/2009/127259.htm. Van der Vleuten-Balkema, A. (2003). Sustainable Wastewater Treatment – Developing a Methodology and Selecting Promising Systems. PhD Thesis. The Netherlands WHO (World Health Organization). (2012). Diarrhoeal disease. Facts And Figures updated on August 2009. Available at http:// www.who. int/ mediacentre /factsheets /fs330/ en/ index.html
WHO (World Health Organization). (2004). Water, Sanitation and Hygiene Links to Health . Facts And Figures updated on November WHO (World Health Organization). (1992). A Guide to the Development of on-Site Sanitation WHO/UNICEF (World Health Organization/United Nations, Children’s Fund). (2012). Progress on Drinking Water and Sanitation: 2012 Update. WHO/UNICEF Joint Monitoring Programme for Water Supply and Sanitation. ISBN: 978-92-806-4632-0 (NLM classification: WA 670) WHO/UNICEF-JMP (World Health Organization/United Nations Children’s Fund Joint Monitoring Programme). (2010). http://www.wssinfo.org/definitions-methods/introduction/. Accessed on October 21, 2011.
Usability Similarity to common practice (anal cleansing practices)
Anal cleansing practices on new technology is similar to current anal cleansing practice
2
Anal cleansing practices on new technology is different from common practice however the existing practice is due to limitation of existing technology than customs (User friendly)
1
Technology introduce new practices on anal cleansing never practices before in locality (Not user friendly)
0
• Living in a house with cement floor is prestige and sign of wealthy, resident believe that individuals living in houses with cement floor are most likely to adopt technologies with cement material.
• SanPlat has both cement and dust/mud floor, it was placed in a group of cement floor in this aspect
91
2. Technical/ Technology and operation:
Indicators Explanation Description Unit Material availability
Availability of material locally for making a floor
Require material available 1 (Available)
Required material not available 0 (Unavailable)
Local labor - (Use of local competence for construction and maintenance)
Availability of required local labor to undertake technical work
Trained artisan required and available Or Trained artisan not necessary for construct of a facility
1=good (Available)
Trained artisan required but not available
0=bad (Unavailable)
Fresh water requirement
Water availability as required by technology
Water supply required to run technology and access is adequate (at least at intermediate level to more than 58.7% of HH Or System does not require water supply for operation except for hygiene
1=good (Adequate)
Water supply required for running a technology and the access is slow i.e. less than 58.7% of HH access safe and clean water at intermediate level
0= bad (Inadequate)
92
3. Environmental protection and Natural resource use
Indicators Explanation Description Unit Negative impact on Environment
Impact on natural forestry (Rubric developed as described in section 4.8)
Impact on forest is unlikely, because the technology use concrete slab instead of wood
2
Minimal impact on forest. Demand for toilets that would require wood is lower than national target
1
Impact on forest may be high. Demand for improved toilets that require wood is higher than estimated by the national target
0
Pollution risk to underground and surface water
Discharge from technology may result into pollution of underground and surface water
Pit required, ground water table level high and some HH use shallow well, river, spring or pond as source of water supply Or Leach pit required, gravel and clayed soil (Infiltration rate likely to be high) yet some HH use shallow well, river, spring or pond as source of water supply
(High)=0, worse
Pit required, ground water table level low but HH use shallow well, river, spring or pond as source of water supply
(Likely)=1, bad
Pit not required or Whole village supplied by deep well or tap supplied gravity or treatment plant
(Unlikely)=2, good
Nutrient recovery
Potential for recovery of nutrient from technology
Nutrients can be recovered and there is a demand
3
Nutrients can be recovered but resident does not require
2
Nutrients recovery is limited 1 • *Estimated proportion of HH with improved sanitation in rural is 23% (NBS 2010) • Improved floor toilet and SanPlat do not need a household to construct new one-excavate
new pit. Due to lack of baseline data however, the assumption was made that HH will construct new ones. An estimate of 23% coverage of improved sanitation was used to determine rubric. The width of pit latrine was not known as such was infeasible to ascertain whether ferrocement slab used here for estimation of cost will fit on the existing pit, hence assumption was made also that a household will require to excavate a new pit.
• Environmental impact on forest was estimated based on proportional of people who would require a proposed technology with assumption that, villagers will have to build new ones and use local natural forest as source of logs for the slab/floor.
93
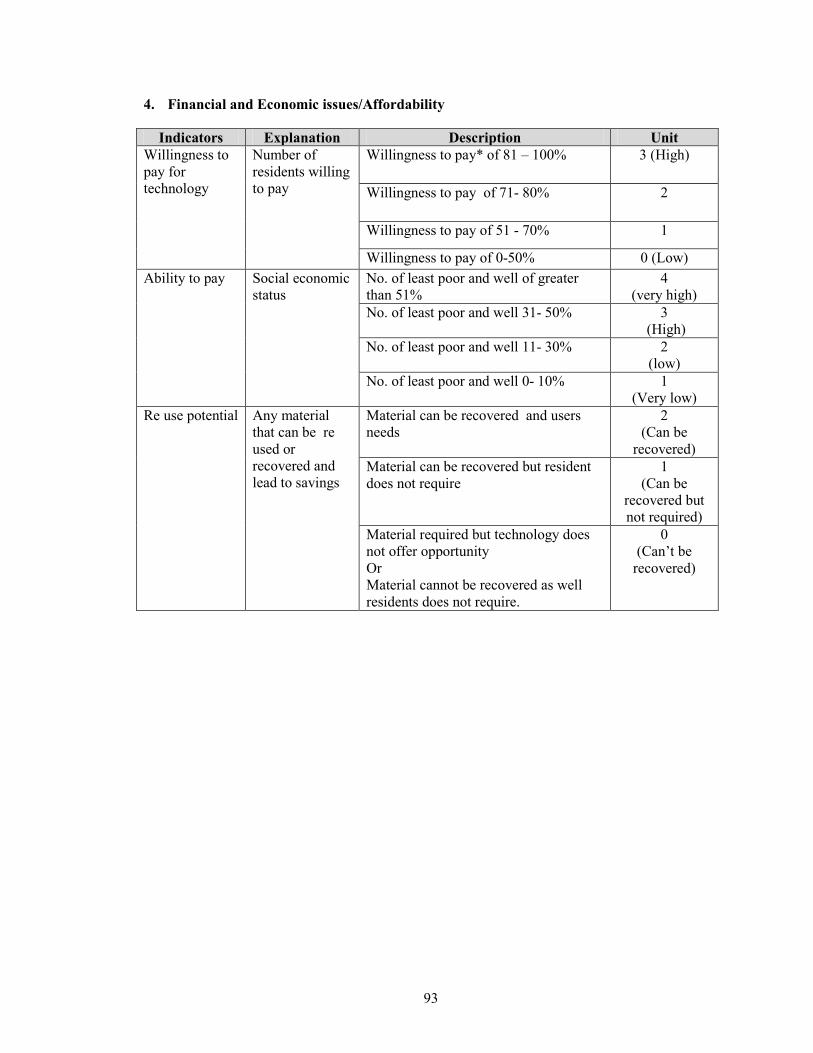
4. Financial and Economic issues/Affordability
Indicators Explanation Description Unit Willingness to pay for technology
Number of residents willing to pay
Willingness to pay* of 81 – 100% 3 (High)
Willingness to pay of 71- 80% 2
Willingness to pay of 51 - 70% 1
Willingness to pay of 0-50% 0 (Low) Ability to pay Social economic
status No. of least poor and well of greater than 51%
4 (very high)
No. of least poor and well 31- 50% 3 (High)
No. of least poor and well 11- 30% 2 (low)
No. of least poor and well 0- 10% 1 (Very low)
Re use potential Any material that can be re used or recovered and lead to savings
Material can be recovered and users needs
2 (Can be
recovered) Material can be recovered but resident does not require
1 (Can be
recovered but not required)
Material required but technology does not offer opportunity Or Material cannot be recovered as well residents does not require.
0 (Can’t be
recovered)
94
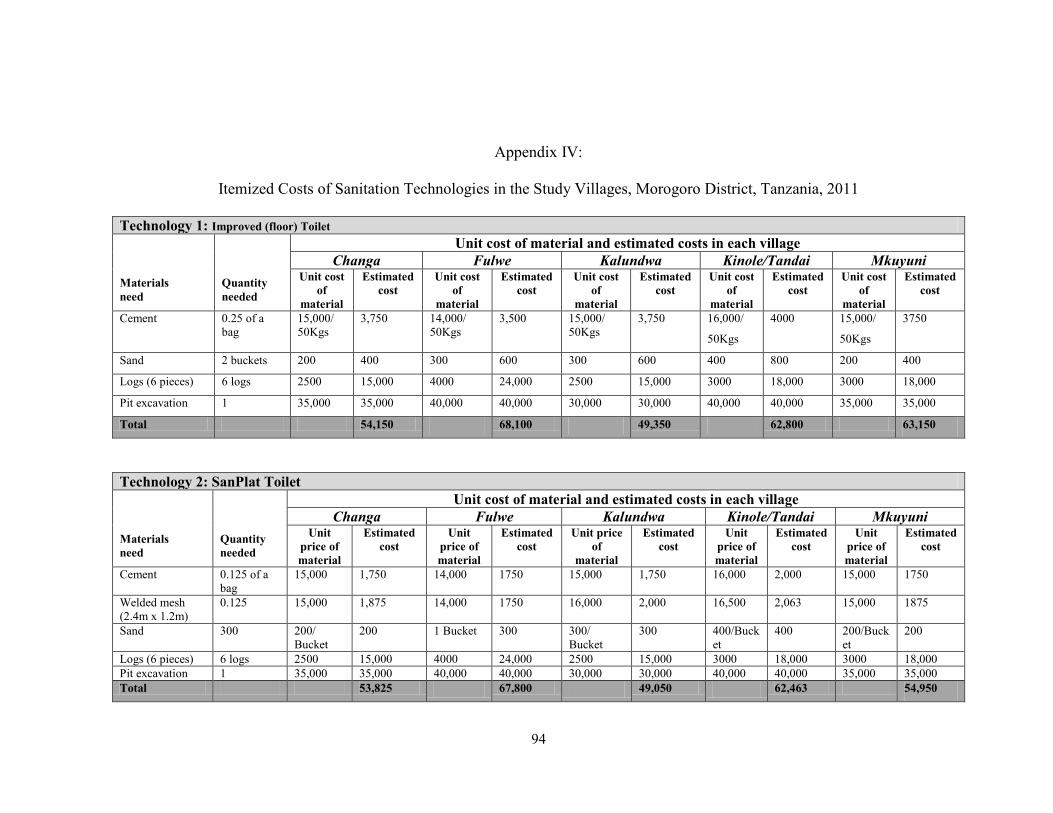
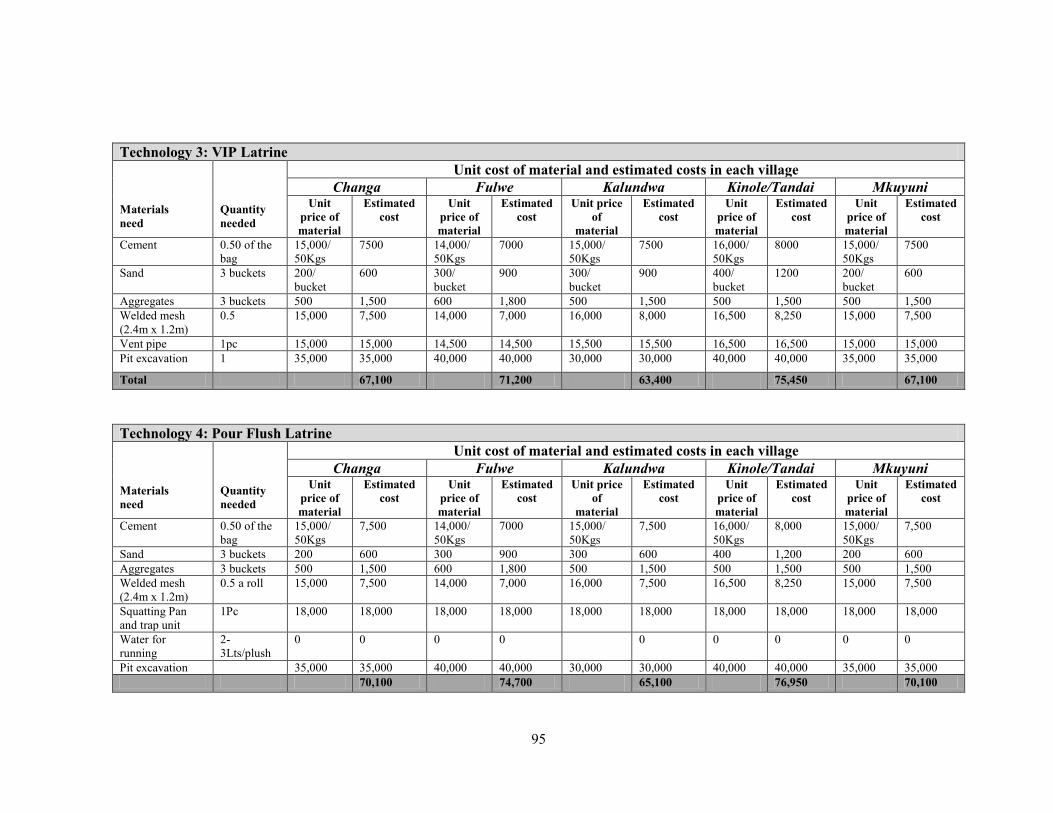
Appendix IV:
Itemized Costs of Sanitation Technologies in the Study Villages, Morogoro District, Tanzania, 2011
Technology 1: Improved (floor) Toilet Materials need
Quantity needed
Unit cost of material and estimated costs in each village Changa Fulwe Kalundwa Kinole/Tandai Mkuyuni
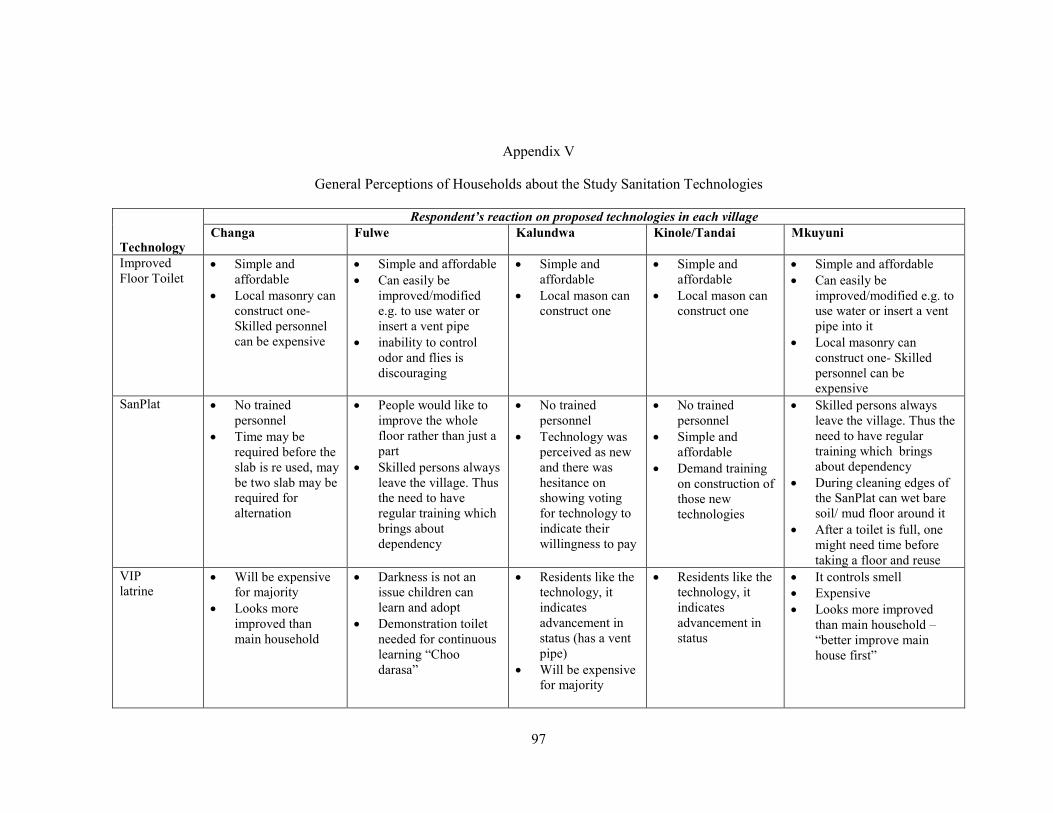
General Perceptions of Households about the Study Sanitation Technologies
Technology
Respondent’s reaction on proposed technologies in each village Changa Fulwe Kalundwa Kinole/Tandai Mkuyuni
Improved Floor Toilet
• Simple and affordable
• Local masonry can construct one- Skilled personnel can be expensive
• Simple and affordable • Can easily be
improved/modified e.g. to use water or insert a vent pipe
• inability to control odor and flies is discouraging
• Simple and affordable
• Local mason can construct one
• Simple and affordable
• Local mason can construct one
• Simple and affordable • Can easily be
improved/modified e.g. to use water or insert a vent pipe into it
• Local masonry can construct one- Skilled personnel can be expensive
SanPlat • No trained personnel
• Time may be required before the slab is re used, may be two slab may be required for alternation
• People would like to improve the whole floor rather than just a part
• Skilled persons always leave the village. Thus the need to have regular training which brings about dependency
• No trained personnel
• Technology was perceived as new and there was hesitance on showing voting for technology to indicate their willingness to pay
• No trained personnel
• Simple and affordable
• Demand training on construction of those new technologies
• Skilled persons always leave the village. Thus the need to have regular training which brings about dependency
• During cleaning edges of the SanPlat can wet bare soil/ mud floor around it
• After a toilet is full, one might need time before taking a floor and reuse
VIP latrine
• Will be expensive for majority
• Looks more improved than main household
• Darkness is not an issue children can learn and adopt
• Demonstration toilet needed for continuous learning “Choo darasa”
• Residents like the technology, it indicates advancement in status (has a vent pipe)
• Will be expensive for majority
• Residents like the technology, it indicates advancement in status
• It controls smell • Expensive • Looks more improved
than main household – “better improve main house first”
98
Pour Flush • Water supply not reliable
• Expensive • Majority are
Muslim, use water for anal cleansing.
• Local modification are always made to reduce water use: High slope and addition of oil
• Use it when taking shower
• Sanitary pads treated as normal waste
• When educated, user find means to meet objective
• Majority are Muslim, use water for anal cleansing
• Water supply not reliable but residents felt that choosing the technology will help influence the government to supply water in their village
• Expensive to majority
• Access to water high, but resident afraid of frequent pit collapse due to high rainfall, run off and topography
• Pit may collapse since water is allowed in the pit
• Water supply is not a problem
• Expensive • Girls use non disposable
sanitary pads • Majority are Muslim, use
water for anal cleansing
EcoSan • Farms are far away to carry fertilizer to
• Negative attitude to human faeces- Fear of being laughed at when noticed that he is carrying feaces
• Technology perceived advanced and very new
• Technically infeasible need skilled personnel to construct and care to maintain
• Cleansing aside is not an issue because people do so to avoid wetting mud floor
• The land is still fertile- no need of human fertilizer
• Lack of market when customer figure out that human manure was used as fertilizer
• Handling of urine frequently is unsightly
• Pilot EcoSan was abandoned at Fulwe Primary School.
• Farms are far away to carry fertilizer to. Farms were across the river where they were forced to leave during villagization
• Negative attitude on handling human faeces
• One can even stop excavating new and change to another place if during excavation he discovers sign of decomposed.
• Farms for maize and paddy are far away compared to fruit plots.
• People fear that if used in pineapples people would not buy or may be easy to construct diarhoea for fruits are eaten raw
• Negative attitude on handling human faeces
• Area is mountainous, there might be a problem when the toilet of a neighbor from higher elevation collapses due to heavy rain and runoff
• Technical skills is needed can be more expensive
• Urine and excreta are filthy, one cannot eat food stuff fertilized by those
99
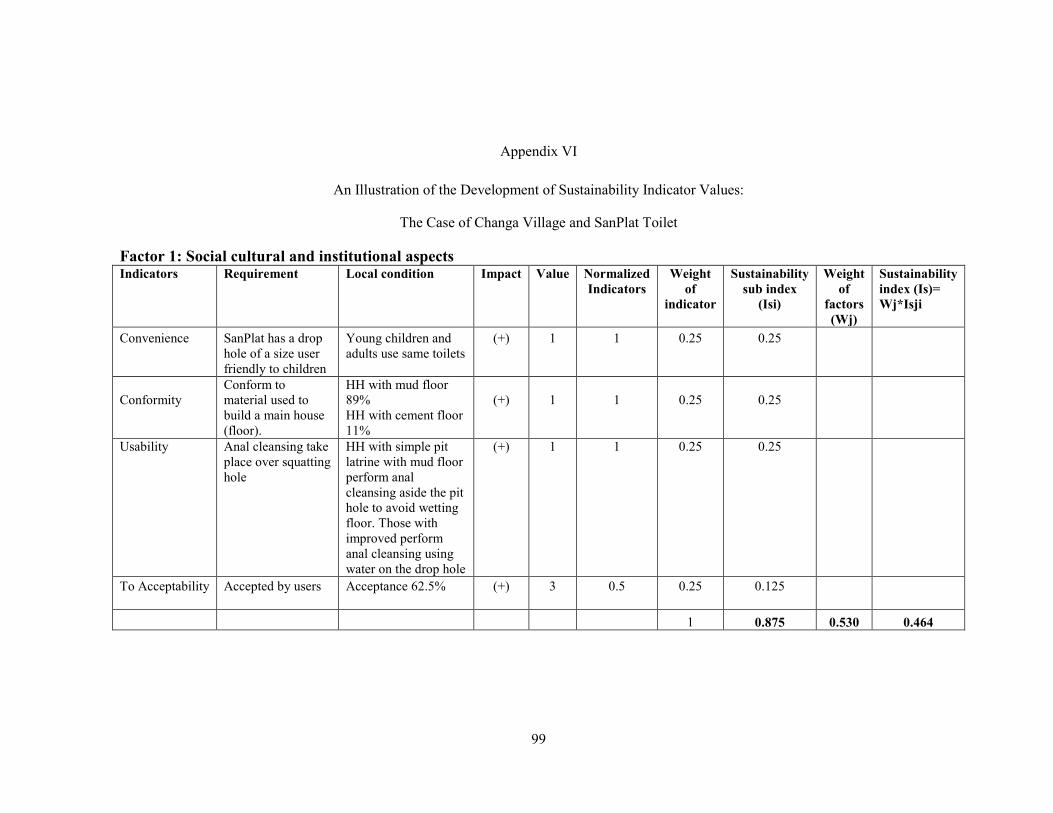
Appendix VI
An Illustration of the Development of Sustainability Indicator Values:
The Case of Changa Village and SanPlat Toilet
Factor 1: Social cultural and institutional aspects Indicators Requirement Local condition Impact Value Normalized
Indicators Weight
of indicator
Sustainability sub index
(Isi)
Weight of
factors (Wj)
Sustainability index (Is)= Wj*Isji
Convenience
SanPlat has a drop hole of a size user friendly to children
Young children and adults use same toilets
(+)
1
1
0.25
0.25
Conformity
Conform to material used to build a main house (floor).
HH with mud floor 89% HH with cement floor 11%
(+)
1
1
0.25
0.25
Usability
Anal cleansing take place over squatting hole
HH with simple pit latrine with mud floor perform anal cleansing aside the pit hole to avoid wetting floor. Those with improved perform anal cleansing using water on the drop hole
(+)
1
1
0.25
0.25
To Acceptability
Accepted by users
Acceptance 62.5%
(+)
3
0.5
0.25
0.125
1 0.875 0.530 0.464
100
Factor 2: Technology and operation- technical feasibility Indicators
Requirement
Local condition
Impact
Value
Normalized Indicators
Weight of
indicator
Sustainability sub index
(Isi)
Weight of
factors (Wj)
Sustainability index (Is)= Wj*Isji
Availability of material locally
Hardwood poles with a diameter not less than 100 mm required
2.84 Km2 is natural forest and 9.92KM2 is a village reserved forest
(+)
1
1
0.25
0.25
Local labor/skills
Trained artisan required
Local artisans available but not trained
(-)
0
1
0.25
0.25
Fresh water need for operation and hygiene
Minimum requirement per person per day
Basic access (5-30Min is spent to fetch water from collection point; shallow wells 49%, deep well 44%, river 7%)
(-)
1
0
0.25
0
Compatibility
All kinds of anal cleansing material can be used (Solid or water)
Residents use water for anal cleansing
(+)
1
1
0.25
0.25
1 0.25 0.150 0.038
101
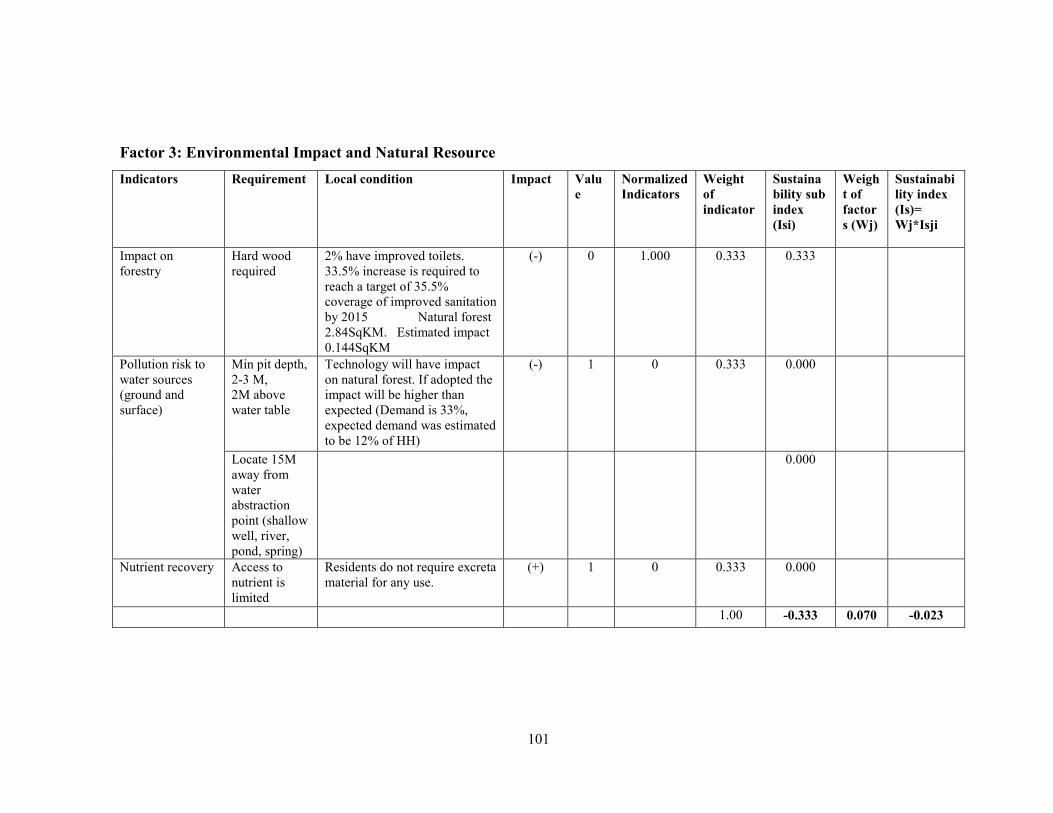
Factor 3: Environmental Impact and Natural Resource Indicators
Requirement
Local condition
Impact
Value
Normalized Indicators
Weight of indicator
Sustainability sub index (Isi)
Weight of factors (Wj)
Sustainability index (Is)= Wj*Isji
Impact on forestry
Hard wood required
2% have improved toilets. 33.5% increase is required to reach a target of 35.5% coverage of improved sanitation by 2015 Natural forest 2.84SqKM. Estimated impact 0.144SqKM
(-)
0
1.000
0.333
0.333
Pollution risk to water sources (ground and surface)
Min pit depth, 2-3 M, 2M above water table
Technology will have impact on natural forest. If adopted the impact will be higher than expected (Demand is 33%, expected demand was estimated to be 12% of HH)
(-) 1 0 0.333 0.000
Locate 15M away from water abstraction point (shallow well, river, pond, spring)
0.000
Nutrient recovery Access to nutrient is limited
Residents do not require excreta material for any use.
(+) 1 0 0.333 0.000
1.00 -0.333 0.070 -0.023
102
Factor 4: Economic and Financial-affordability
Indicators Requirement Local condition Impact Value
Normalized
Indicators
Weight of indicator
Sustainability sub
index (Isi)
Weight of
factors (Wj)
Sustainability index (Is)= Wj*Isji
Willingness to pay
TZS 53,825 for improving floor and pit excavation
Willing to pay 75% of FGD participants
(+) 2 1 0.3 0.330
Ability to pay for capital cost
Capital cost TZS 54,150
Number of least poor and well off 35%
(+) 3 0.667 0.3 0.220
Material recovery or re use
SanPlat slab can be re used
Users can save 3,825 for a reused Sanplat slab in new toilet yet not willing to re use


![Water,Sanitation,andHygieneServiceAvailabilityatRural ... · inadequate water supply and sanitation [3]. Inadequate drinking water, sanitation, and hygiene in nonhousehold settings,](https://static.documents.pub/doc/80x56/5e81efd69f9e151ba6551f5b/watersanitationandhygieneserviceavailabilityatrural-inadequate-water-supply.jpg)


