Assessing the Applicability of Digital Image Correlation (DIC) Technique in Tensile Testing of Fabric Composites by Brian P. Justusson, David M. Spagnuolo, and Jian H. Yu ARL-TR-6343 February 2013 Approved for public release; distribution unlimited.
Transcript
Assessing the Applicability of Digital Image Correlation
(DIC) Technique in Tensile Testing of Fabric Composites
by Brian P. Justusson, David M. Spagnuolo, and Jian H. Yu
ARL-TR-6343 February 2013
Approved for public release; distribution unlimited.
NOTICES
Disclaimers
The findings in this report are not to be construed as an official Department of the Army position
unless so designated by other authorized documents.
Citation of manufacturer’s or trade names does not constitute an official endorsement or
approval of the use thereof.
Destroy this report when it is no longer needed. Do not return it to the originator.
Army Research Laboratory Aberdeen Proving Ground, MD 21005
ARL-TR-6343 February 2013
Assessing the Applicability of Digital Image Correlation
(DIC) Technique in Tensile Testing of Fabric Composites
Brian P. Justusson, David M. Spagnuolo, and Jian H. Yu
Weapons and Materials Research Directorate, ARL
Approved for public release; distribution unlimited.
ii
REPORT DOCUMENTATION PAGE Form Approved
OMB No. 0704-0188 Public reporting burden for this collection of information is estimated to average 1 hour per response, including the time for reviewing instructions, searching existing data sources, gathering and maintaining the
data needed, and completing and reviewing the collection information. Send comments regarding this burden estimate or any other aspect of this collection of information, including suggestions for reducing the
burden, to Department of Defense, Washington Headquarters Services, Directorate for Information Operations and Reports (0704-0188), 1215 Jefferson Davis Highway, Suite 1204, Arlington, VA 22202-4302.
Respondents should be aware that notwithstanding any other provision of law, no person shall be subject to any penalty for failing to comply with a collection of information if it does not display a currently
valid OMB control number.
PLEASE DO NOT RETURN YOUR FORM TO THE ABOVE ADDRESS.
1. REPORT DATE (DD-MM-YYYY)
February 2013
2. REPORT TYPE
Final
3. DATES COVERED (From - To)
November 2012 4. TITLE AND SUBTITLE
Assessing the Applicability of Digital Image Correlation (DIC) Technique in
Tensile Testing of Fabric Composites
5a. CONTRACT NUMBER
5b. GRANT NUMBER
5c. PROGRAM ELEMENT NUMBER
6. AUTHOR(S)
Brian P. Justusson, David M. Spagnuolo, and Jian H. Yu
5d. PROJECT NUMBER
H84 5e. TASK NUMBER
5f. WORK UNIT NUMBER
7. PERFORMING ORGANIZATION NAME(S) AND ADDRESS(ES)
U.S. Army Research Laboratory
ATTN: RDRL-WWM-B
Aberdeen Proving Ground, MD 21005
8. PERFORMING ORGANIZATION REPORT NUMBER
ARL-TR-6343
9. SPONSORING/MONITORING AGENCY NAME(S) AND ADDRESS(ES)
10. SPONSOR/MONITOR'S ACRONYM(S)
11. SPONSOR/MONITOR'S REPORT NUMBER(S)
12. DISTRIBUTION/AVAILABILITY STATEMENT
Approved for public release; distribution unlimited. 13. SUPPLEMENTARY NOTES
14. ABSTRACT
Performing mechanical characterization of novel structural materials and accounting for the types of failures observed and the
heterogeneous nature of fiber-reinforced composites (FRCs) require non-contact strain measurements such as Digital Image
Correlation (DIC), a photogrammetric technique that relies on a series of digital images taken during mechanical testing to
calculate displacement within a local field. This work assesses the applicability of DIC in determining strains in thick fabric
composites by examining two different engineering strain measurement methods available in DIC: (1) the average strain of the
full strain field of the tensile specimen and (2) the strain between two gauge points. The results indicate that the difference
between the two strain measurement methods is minimal until near the point of failure. However, the full strain fields of the
front and back surfaces of the tensile specimen differed significantly during the initial loading. The usage of a single camera
DIC system that records only one side of specimen does not accurately capturing bending behavior in the specimen and may
inaccurately report the mechanical properties. The DIC technique has to be applied properly in mechanical testing to assure
compliance with American Society for Testing and Materials (ASTM) testing methods and other test standards.
15. SUBJECT TERMS
Textile composites, mechanical characterization, digital image correlation
2.3 Determination of Mechanical Properties .........................................................................3
3. Results and Discussion 4
3.1 Global Results .................................................................................................................4
3.1.1 Results of the Average over the Surface .............................................................4
3.1.2 Results of the Line Strain Calculations ...............................................................9
3.1.3 Comparison Line Strain and Average Strain .....................................................11
3.2 Implication of Results ...................................................................................................12
4. Conclusions 14
5. References 16
Distribution List 17
iv
List of Figures
Figure 1. Front and back images recorded by the Photron SA.1 cameras. .....................................3
Figure 2. Stress-strain response of three S2 glass samples. ............................................................6
Figure 3. Results of tensile testing for sample 6 of the S2 glass showing corrected bending. .......7
Figure 4. The progression of strain on the bag side of the tensile sample. .....................................8
Figure 5. The progression of strain on the tool side of the tensile sample. ....................................8
Figure 6. Results of the tensile testing of the basalt fiber composites. ...........................................9
Figure 7. The progression of strain in an S2 glass sample using the single line strain.................11
Figure 8. A comparison in the stress strain response of the average strain (a) and line strain (b) measures showing nearly identical behavior. .....................................................................12
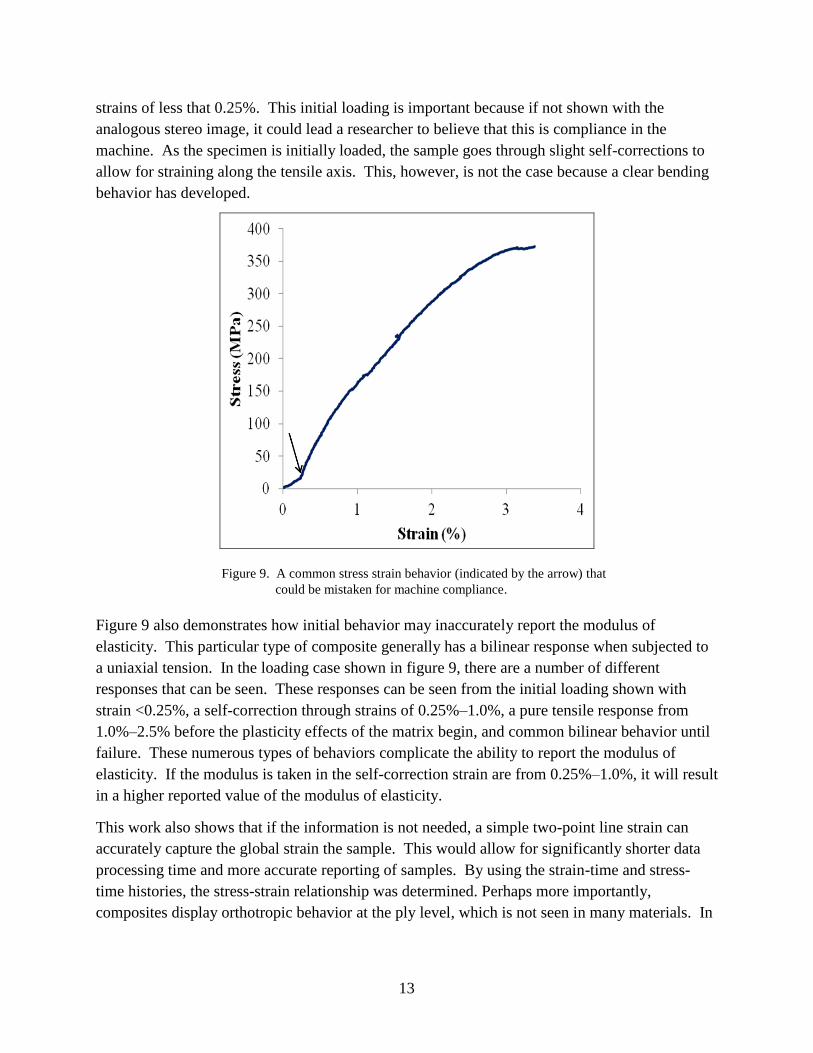
Figure 9. A common stress strain behavior (indicated by the arrow) that could be mistaken for machine compliance. ..........................................................................................................13
List of Tables
Table 1. The results of tensile testing for the S2 glass sample. ......................................................5
Table 2. The results of tensile testing for the basalt sample. ..........................................................5
Table 3. Line strain results for the S2 glass samples. ...................................................................10
Table 4. Line strain results for basalt samples. .............................................................................10
1
1. Introduction
Before novel structural materials can be implemented in military applications, extensive
mechanical characterization studies are needed. As such, mechanical testing is used heavily in
determining the performance of a variety of materials. A traditional mechanical characterization
consists of simple tensile/compressive and shear loading using American Society for Testing and
Materials (ASTM) standards. Perhaps the most widely used test is the tensile test, which is
described in great detail in the ASTM standards. Using a quasi-static strain rate of 0.0001/s, the
static response of the material can be characterized. The test specimen can be conformed to one
of two ways per ASTM specifications: (1) D3039 allows for extraction into long slender samples
in which tabs are adhered to the surface (1); (2) D638-03 allows for the so-called “dog bone”
sample, which is widely used for metallic structures materials (2).
ASTM specification D3039 is the preferred testing technique for composite specimen because it
mitigates the circumstances that may lead to damage propagation that starts at the grips and
propagates to the gauge section and may result in non-uniform failures. It is important to note
that D638-03 is not recommended for oriented continuous fiber-reinforced plastics.
Strain determination has been performed in a variety of ways, with varying results. One way of
calculating the engineering strain* is to use the crosshead displacement. However, this technique
does not account for compliance in the machine. Another technique employs an extensometer.
This technique works well in materials that show a distinct necking behavior, as the
extensometer must be removed prior to failure to prevent damage of the extensometer. In
materials that show linear-elastic behavior with little to no plasticity, such as that of laminated
composite materials, the point where removal of the extensometer is not clear.
The final technique that has been extensively used is the strain gauge. The strain gauge allows
for a localized measurement of strain, but it is not ideal in composite materials because the strain
can vary on the surface as a result of the composite manufacturing. The location dependency of
the strain gauges is noted by Tan et al. (3), where a difference in measured strain is observed
depending on the strain gauge location.
Because of the types of failures observed and the heterogeneous nature of fiber-reinforced
composites (FRCs), non-contact strain measurements are needed to fully characterize the
progression of failure in a sample. Two techniques have been developed to address this need.
The first technique is a laser extensometer (4), which is a non-contact variant of the
extensometer. The use of a laser extensometer has been shown to be repeatable and reliable in a
number of uses including the work of Tourlonias et al. (5). While this eliminates the need to stop
*Referred to as “strain” hereafter, unless indicated otherwise.
2
the test and remove the hardware, its measurements are limited to engineering strain. The
newest technique is the Digital Image Correlation (DIC) method (6). The DIC methodology
allows for strain measurements similar to both the use of strain gauges and extensometer, but
without making contact with the test specimen.
In this study, the goal is to understand the limitations of DIC as it relates to a commonly used test
and identify any issues that might arise during data analysis that could lead to improper use of
the method.
2. Experiment/Calculations
2.1 Sample Preparation
In this investigation, two types of material systems were analyzed. One is a basalt fabric from
BGF, a 24 ounce per square yard (oz/sq. yd), 5x5 plain weave. The other was S-2 glass, also
from BGF and was a 24 oz/sq. yd 5x5 plain weave. The same matrix, SC-15 epoxy from
Applied Poleramic, Inc., was used for both composites. SC-15 is a two-phase toughened epoxy
cycloaliphatic amine resin that is widely used for vacuum assisted resin transfer molding process
(VARTM)/Scrimp processing.
The fibers were oriented in a plain woven fabric (orthogonally oriented). Eight plies of fabric
were laminated in a stacking sequence of a quasi-isotropic layup ([0/90/+45/–45]4s). The fabric
pre-forms were infused with matrix using a VARTM. After infusion, the sample was cured in an
oven.
After curing, specimens were extracted from the panel from the flow and vacuum sections of the
composite using water jet cutting. The flow section of the panel is located on the entry side of
the vacuum bag where the epoxy was introduced to the fabric. The vacuum section is located at
the opposite end of the vacuum bag. These composite panels were cut into 1 in x 12 in specimens
per ASTM D3039. To distinguish the two surfaces on the specimen, the front surface is called
the bag side, the surface that was not in contact with the tooling table, and the back surface is
called the tool side, the surface that was in contact with the tooling table during curing.
Tabs were attached to the specimens using a two-part Armstrong A2 epoxy-resin. The tabs were
allowed to cure for 24 h in a clamp prior to testing to allow for complete hardening of the
adhesive.
2.2 Tensile Testing
The random speckle pattern was applied using a single spray paint of either black (on white
surfaces) or yellow on (black surfaces) to create the necessary contrast on the surface of the
material. A base coat was not applied to surfaces. This allows for the visualization of localized
3
strain of the specimen during testing. The specimens were tested using an Instron 1125 Tensile
Tester. The test was displacement controlled at a rate of 2 mm/min. The data acquisition card
(DAC) recorded the load and displacement of the sample at a rate of 10 Hz. The still images of
the sample were recorded using a pair of Photron SA.1 cameras running at a frame rate of 60 fps.
The cameras were mounted such that the focal point was at the same height on the sample, but
on opposite surfaces of the test specimen. The resolution was set to 900 × 256 pixels, which
allowed for over 400 s of recording. To ease the data analysis, every 60th frame was used to
determine the strain at every second of the test. The samples images are shown in figure 1.
a. Front surface (Bag side)
b. Back surface (Tool side)
Figure 1. Front and back images recorded by the Photron SA.1 cameras.
2.3 Determination of Mechanical Properties
The strain was determined using Aramis Photogrammetric Software distributed by GOM (7).
The area of the tensile sample was masked off accordingly and a facet size of 13 was used with a
step size of 7. The strain was then determined for both surfaces. The first strain measurements
were the average strain of the full engineering strain field on the specimen excluding the edge
4
effects. The second measure was a line strain (engineering strain), which was determined by the
change of distance between two gauge points (shown later in figure 7).
The load-time history was recorded by the Instron and the results of the photogrammetric
analysis reported the strain-time history. The stress was calculated by dividing the recorded load
by the average area based on the averages of three measurements for the thickness and width. A
MATLAB code was used to interpolate the points to give the total stress-strain history of the
material.
The modulus of elasticity was determined by using a linear fit between the strains of 0.5%–2.0%.
The ultimate tensile strength was determined by taking the maximum of the stress strain curve in
each case.
3. Results and Discussion
3.1 Global Results
The S2 glass fiber composites had on average a higher ultimate tensile strength (UTS). The
average UTS for the samples was approximately 361.63±8.37 MPa for the S2 glass composites
and 318.51±6.77 MPa for the basalt fibers. On average, the S2 glass composite had a higher
modulus of elasticity of 12.94±0.84 GPa, whereas the basalt composite’s modulus was
11.70±1.44 GPa. The basalt composite generally had higher failure strains than the S2 glass.
The following subsections discuss the differences between the two techniques, first with a
discussion from the average over the surface followed by the results of the testing using the
reported line strain and finally with a comparison of the two methods. All global failures are
tensile failures that occurred in the gauge section.
3.1.1 Results of the Average over the Surface
The average strain was calculated in the ARAMIS software by taking the average of an area of
interest. The area of interest was selected to not include edge effects where the error becomes
significantly larger. The results are shown in table 1 for the S2 composite and table 2 for the
basalt composite. For both of the testing samples, the UTSs are very similar and differ by less
than 10% between the maximum and minimal values. The average UTS for the S2 composite
was 361.63±8.37 MPa and 318.51±6.77 MPa for the basalt composite.
5
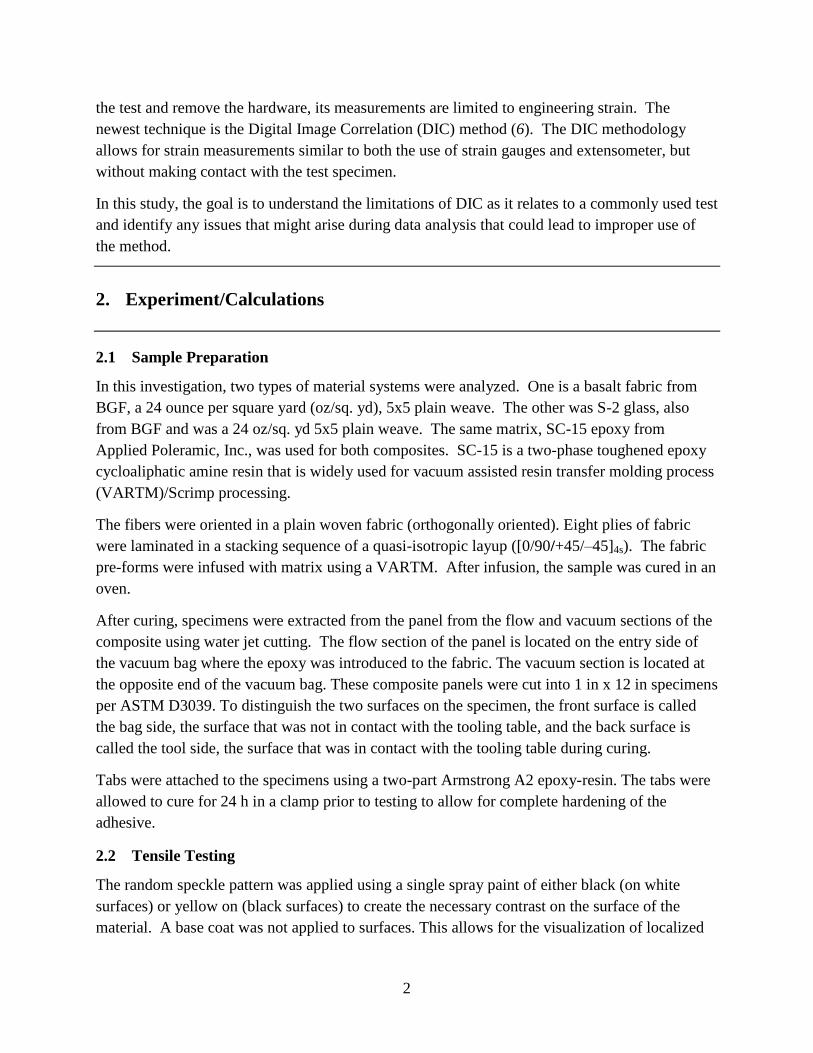
Table 1. The results of tensile testing for the S2 glass sample.
Sample UTS (MPa) Average (Bag) (GPA) Average (Tool) (GPa) Average (GPa)
1 365.20 12.14 13.38 12.76 ± 0.44
2 352.29 13.88 11.92 12.90 ± 0.69
3 351.26 14.04 12.20 13.12 ± 0.45
4 365.23 13.18 13.39 13.29 ± 0.07
5 362.83 11.72 13.56 12.64 ± 0.65
6 372.96 12.96 12.95 12.95 ± 0.004
AVERAGE 12.94 ± 0.84
Table 2. The results of tensile testing for the basalt sample.
Sample UTS (MPa) Average (Bag) (GPA) Average (Tool) (GPa) Average (GPa)
1 323.88 10.63 13.39 12.01± 1.95
2 312.66 10.87 12.08 11.48± 0.86
3 317.31 10.57 12.71 11.64± 1.51
4 323.96 11.23 12.32 11.78± 0.77
5 308.63 10.20 12.42 11.31± 1.57
6 324.65 10.54 13.41 11.97± 1.96
AVERAGE 11.71 ± 0.1.44
Of particular interest is the difference in modulus of elasticity as determined through the
analysis. For this work, the difference between the bag (front surface) and tool (back surface)
side averages differ by 1–2 GPa (>10%) in some cases (only three cases are less than 10%). This
is because the response is a result of bending during testing. When examining the stress strain
results of the S2 glass sample shown in figure 2, one side shows a very clear initial compressive
behavior, while the other side shows a tensile behavior. As the material is continuously loaded,
the sample corrects the alignment issue and results in a more linear response. This, however,
may not be the same modulus as shown by samples 1–6 (see table 1). In the case of
samples 1–3, it is clear that modulus of elasticity is different on opposite sides as shown by the
intersecting curves (figure 2).
6
Figure 2. Stress-strain response of three S2 glass samples.
This type of behavior is not always seen in the samples as shown by sample 3 in figure 2.
Figure 2 shows a sample that demonstrated a clear initial bending that is self-corrected during
testing. After approximately 0.75% strain, the curves show the same behavior. Also of note are
the deviations from pure linear behavior around 175 and 240 MPa. This jump occurs because of
a local failure of the tabs that results in a change of loading, which allows a brief relaxation in
the specimen. This problem is unique to ASTM D3039 and should be sufficiently addressed
with the proper adhesive in the future.
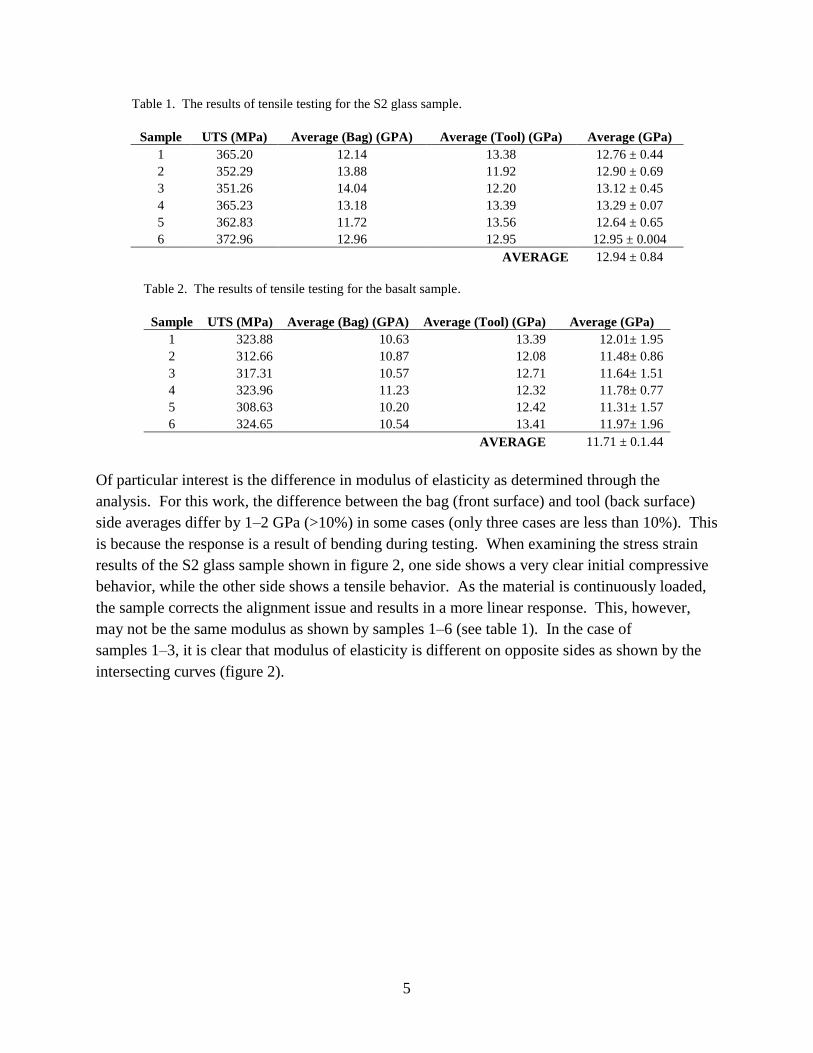
When examining the tensile failure results shown in figure 3, it is clear that bending has
occurred, though as the test continues, the sample self-corrects to a tensile loading. This is very
noticeable in the DIC strain fields when comparing the front and back surfaces tensile strains of
the same specimen. Figures 4 and 5 are full field strains images at stress intervals of 25, 100,
and 300 MPa, showing how the strain progresses through the material.
7
Figure 3. Results of tensile testing for sample 6 of the S2 glass showing corrected bending.
When the specimen experiences a stress of 25 MPa as shown in figures 4a and 5a, the strain field
shows the tool side (back surface) of the specimen is under full tension (figure 4a), while the
strain field of the bag side (front surface) of the specimen in figure 4a shows a compressive
strain. The strains indicate the back side of the specimen is under compression due to bending of
the specimen. This trend continues at 100 MPa and is completely self-corrected by 200 MPa.
However, the magnitude of the tensile strain on the tool side of the specimen is higher than the
bag side of the specimen. At 300 MPa, as shown in figures 4d and 5d, the samples have nearly
identical strain fields. This indicates that the sample has self-corrected and is only straining
along the tensile axis.
8
a. 25 MPa b. 100 MPa c. 200 MPa d. 300 MPa
Figure 4. The progression of strain on the bag side of the tensile sample.
a. 25 MPa b. 100 MPa c. 200 MPa d. 300 MPa
Figure 5. The progression of strain on the tool side of the tensile sample.
9
The results of the tensile testing for the basalt fibers are shown in table 2. From this, we see that
the modulus of elasticity is clearly different depending on which side is reported. The difference
between to the two sides could differ by as much as 30% in some cases. The case where bending
was minimized in sample 4, there is still a difference in the reported modulus. This effect
follows the same behavior reported previously with the S2 glass.
The results of the tensile testing for three samples are shown in figure 6. From this figure, it is
clear that there can be a wide variety of bending behaviors observed. For example, sample 5
shows a large amount of bending characterized by a tensile and compressive surface, whereas
samples 3 and 4 show significantly less. This is also reflected in the reported modulus values
shown in table 1.
Figure 6. Results of the tensile testing of the basalt fiber composites.
3.1.2 Results of the Line Strain Calculations
The results of the line strain measurements are shown in tables 3 and 4. The average modulus of
elasticity for the S2 glass composite was 12.84±0.84 GPa , while the average for the basalt fibers
was 11.68±1.42 GPa. As shown in table 4, the line strain also captures the initial bending in the
basalt fibers. This behavior, much like the average measures, shows that there can be significant
differences in the reported mechanical behavior depending on which side is used.
10
Table 3. Line strain results for the S2 glass samples.
Sample UTS (MPa) Line (Bag) (GPA) Line (Tool) (GPa) Average (GPa)
1 365.20 12.19 13.34 12.77
2 352.29 13.97 11.94 12.96
3 351.26 13.76 12.18 12.97
4 365.23 12.88 13.32 13.10
5 362.83 11.50 13.37 12.44
6 372.96 12.76 12.83 12.80
AVERAGE 12.84 ± 0.84
Table 4. Line strain results for basalt samples.
Sample UTS (MPa) Line (Bag) (GPA) Line (Tool) (GPa) Average (GPa)
1 323.88 10.62 13.48 12.05
2 312.66 10.84 11.90 11.37
3 317.31 10.71 12.53 11.62
4 323.96 11.24 12.38 11.81
5 308.63 10.22 12.41 11.32
6 324.65 10.42 13.40 11.91
AVERAGE 11.68 ± 1.42
Figure 7 shows the same sample that was shown in figure 4. In this figure, the two points are
identified that were used to calculate the line strain of the samples. In addition, the measured
nominal length, L, is reported along with the change in length, dL. This allows for the reporting
of strain described by the following equation:
ε=dL/L (1)
Comparing figures 7 and 4, both figures show similar results. For example, at a stress of
25 MPa, the line strain shows a clear compressive strain, which is characteristic of the inner
radius of a bending sample. This same type of behavior was observed with figure 4a. As the
material strains further at a stress of 100 MPa, it is clear that the compressive strains are no
longer recorded and that tensile stress is now being observed. This tensile strain continues to
accumulate at 200 and 300 MPa until failure. The line strain technique is able to clearly capture
many of the details that were observed with the average strain measure.
11
a. 25 MPa b. 100 MPa c. 200 MPa d. 300 MPa
Figure 7. The progression of strain in an S2 glass sample using the single line strain.
3.1.3 Comparison Line Strain and Average Strain
When comparing the modulus of elasticity for the line strains with the average strains shown in
tables 1 and 3 for S2 glass or tables 2 and 4 for the basalt fibers, it is clear that the measures are
comparable within the margin of error. For example, in the average strain, the modulus of
elasticity is 12.94±0.84 GPa while it is 12.84±0.84 GPa in the line strain. Similarly, for the
basalt fibers with an average strain measure, the modulus of elasticity was 11.70±1.44 GPa while
it was 11.68±1.42 GPa with the strain measure for the line strain. These results indicate that
there is no significant difference between the two measurements.
Figure 8 shows a comparison between the stress strain response using the line strain and the
average strain. It is clear from the figure that the two strain measures are nearly identical. Of
particular note, many of the features have been captured in both of the figures. For example, the
relaxation in the sample after tab failure is captured in stress strain samples. The only major
difference is the failure strain measure. This is because when the sample fails, the final strain is
based on an elongation instead of local strains. Since the elongation is quite large at failure, the
sample shows an artificially large strain. In comparison, at failure with the average strain, a
relaxation can be seen in the material, which gives a more accurate failure strain measure.
12
(a) (b)
Figure 8. A comparison in the stress strain response of the average strain (a) and line strain (b) measures showing
nearly identical behavior.
However, the average strain measure has an advantage over line strain technique. While the
measures produce the same results, the amount of information obtained from the testing is much
different. This is best demonstrated by analyzing the strain fields shown in figure 4. Figure 4
shows a sample that has been strained; however, it is clear that there appears to be a periodicity
to the strain field. This is because the strain fields are able to accurately capture some of the
architectural effects of the heterogeneous material. Local areas of high strain could demonstrate
how matrix cracks begin to form or arrest depending on the behavior of the material.
3.2 Implication of Results
The bending behavior is an important observation when reporting results of tensile testing. To
begin with, as per ASTM D3039, bending must be minimized. The specification requires that if
bending is minimal (<5%), then the strains from the front and back surface can be averaged to
give the global response. In the current work, there were two cameras positioned to record the
strains on both surfaces. Upon averaging the stress-strain histories from both surfaces, the result
showed that the net loading on specimen was under tension (figure 3). With a single camera DIC
system, this correction and not possible, but it is also not possible to determine the exact cause of
the bending. In the ASTM specification, bending is measured by the use of strain gauges;
however, the strain gauges offer only local, point wise data and not the entire strain fields within
the high heterogeneous material.
This is best exemplified by the schematic shown in figure 9, which shows a common stress strain
behavior determined from a tensile test. Of particular interest is the initial loading shown at
13
strains of less that 0.25%. This initial loading is important because if not shown with the
analogous stereo image, it could lead a researcher to believe that this is compliance in the
machine. As the specimen is initially loaded, the sample goes through slight self-corrections to
allow for straining along the tensile axis. This, however, is not the case because a clear bending
behavior has developed.
Figure 9. A common stress strain behavior (indicated by the arrow) that
could be mistaken for machine compliance.
Figure 9 also demonstrates how initial behavior may inaccurately report the modulus of
elasticity. This particular type of composite generally has a bilinear response when subjected to
a uniaxial tension. In the loading case shown in figure 9, there are a number of different
responses that can be seen. These responses can be seen from the initial loading shown with
strain <0.25%, a self-correction through strains of 0.25%–1.0%, a pure tensile response from
1.0%–2.5% before the plasticity effects of the matrix begin, and common bilinear behavior until
failure. These numerous types of behaviors complicate the ability to report the modulus of
elasticity. If the modulus is taken in the self-correction strain are from 0.25%–1.0%, it will result
in a higher reported value of the modulus of elasticity.
This work also shows that if the information is not needed, a simple two-point line strain can
accurately capture the global strain the sample. This would allow for significantly shorter data
processing time and more accurate reporting of samples. By using the strain-time and stress-
time histories, the stress-strain relationship was determined. Perhaps more importantly,
composites display orthotropic behavior at the ply level, which is not seen in many materials. In
14
order to accurately describe the behavior, classical lamination theory (CLT) is commonly used
(8). Derived with plane stress configurations, the equation is shown below:
(2)
where,
N is an applied force/length
M is an applied moment/length
A is an extensional matrix
B is a bending-twisting coupling matrix
D is the bending matrix
ε is the strain
k is the curvature
From CLT, if a composite is symmetric, the B matrix is zeros, and therefore, an applied force
will not result in a curvature or bending. As it relates to this study, an axial force would not
result in bending of the samples. If the material layup is asymmetric, then an applied axial force
would result in a bending. The implication of these findings is that by using a single camera DIC
on only one surface of the material, information can be lost or overlooked about the mechanical
performance of the material. This can therefore result in overestimating the mechanical
properties such as modulus of elasticity and failure strain since the strains are a combination of
extensional and bending forces. When the material is only being imaged on one side, it is not
possible to determine if the amount of bending is within the ASTM D3039 specification to quote
a modulus of elasticity. As discussed earlier, if the material deviates from the desired layup, it
may result in bending-twisting coupling effect. This would behavior would be observed in the
DIC strain fields and is an important factor in determining if the material is laid up correctly.
With a pair of cameras, it is quite possible to determine the lay-up during the testing and the
flaws in the fabrication.
4. Conclusions
Laminated plain woven S2 and basalt fiber composites were tested per ASTM D3039
specifications to failure. Failure was observed to be tensile failure in all samples. The strain in
the samples was measured using two non-contact methods, which are different variations of the
DIC technique. The first is a traditional random speckle pattern applied to the sample, and the
second is two gauge points separated by a known distance. The two points was used because it
15
was believed to give accurate results in terms of mechanical response without obstructing the
view of the material. Additionally, this technique reduces the computational time to process the
results and would be useful in large datasets. Both techniques show similar behavior in the
stress-strain response up until failure.
At failure, the samples show a deviation that is a result of the chosen technique. The sample
with the two points shows a larger strain as a result of calculation of the strain. Since the speckle
technique is calculating local strain fields, relaxation in the sample is observed after failure, thus,
a lower strain is measured.
The traditional random speckle pattern also has the advantage of showing an architectural
dependence on localized strain fields. Since the material is heterogeneous (made of epoxy and
fibers), areas of localized strain exist, which lead to the first reported failure or matrix cracking.
These matrix cracks can be observed through the strain fields of DIC with minimal filtering or no
filtering at all. When comparing the strain fields of the sample to the architecture, the strain
fields show a clear architectural dependence. This dependence ultimately allows one to observe
a clear progression of failure on a surface and allows for further detailed information to be used
for validation of finite element modeling.
The mechanical testing differed from ASTM D3039 since strain was measured
photogrammetrically instead of using three strain gauges. While traditional DIC application is
performed on a single surface, this work involved two cameras on opposite sides of the
specimen’s surfaces. Through this work, it was shown that the samples may undergo bending
characterized by equal compressive and tensile strains developing on the front and back surfaces.
The application of the DIC technique has to be used with caution in mechanical testing.
Application of a single camera during testing will not accurately capture the modulus of
elasticity and may result inaccurate reporting of mechanical properties. When using the DIC
method for quasi-static tensile testing, it is recommended to use two cameras to record data for
both front and back of the test specimen, especially for thick specimen with anisotropic
mechanical properties.
16
5. References
1. International, ASTM. D 3039/D 3039M. Standard Test Method for Tensile Properties of
Polymer Matrix Composite Materials. West Conshonhocken : ASTM International.
2. D 638-03. Standard Test Method for Tensile Properties of Plastics. West Conshohocken,
PA : ASTM International.
3. Tan, P.; Tong, L.; Steven, G. P.; Ishikakwa, T. Behavior of 3D orthogonal woven CFRP
composites Part I. Experimental Investigation. s.l. : Composites Part A: Applied Science and
Manufacturing 2000, 31, 259–271.
4. Hercher, Michael. Non-Contact Lateral Displacement Sensor and Extensometer System.
4,872,751 United States, October 10, 1989.
5. Tourlonias, M.; Bueno, M. A.; Bigue, L.; Durand, B.; Renner, M. Contactless Optical
Extensometer for Textile Materials. Society for Experimental Mechanics 2005, 45 (5), 420–
426, DOI: 10.1007/BF02427989.
6. Sutton, M. A.; Wolters, W. J.; Peters, W. H.; Ranson, W. F.; McNeill. S. R. Determination
of Displacements Using an Improved Digital Correlation Method. Image and Vision


![Wireless - Carleton CollegeNew Digital Image New Digital Image New Digital Image New Digital Image Now: WiFi [802.11] • Initially conceived to replace coaxial cables and remove the](https://static.documents.pub/doc/80x56/5f0c30747e708231d4342e49/wireless-carleton-college-new-digital-image-new-digital-image-new-digital-image.jpg)


