Owen P. Hall, Jr., P.E., Ph.D. Owen P. Hall, Jr., P.E., Ph.D. Pepperdine University Pepperdine University CART Conference CART Conference May, 2012 May, 2012 San Diego, CA San Diego, CA Assessing the Asymmetric Information Associated with the Equity Market: A CART Based Decision Rule Analysis
Transcript
Owen P. Hall, Jr., P.E., Ph.D.Owen P. Hall, Jr., P.E., Ph.D.
Pepperdine UniversityPepperdine University
CART ConferenceCART Conference
May, 2012May, 2012
San Diego, CASan Diego, CA
Assessing the Asymmetric Information Associated with the Equity Market:
A CART Based Decision Rule Analysis
Presentation AgendaPresentation Agenda
OverviewOverview Problem StatementProblem Statement Results AnalysisResults Analysis ConclusionsConclusions
Problem StatementProblem Statement
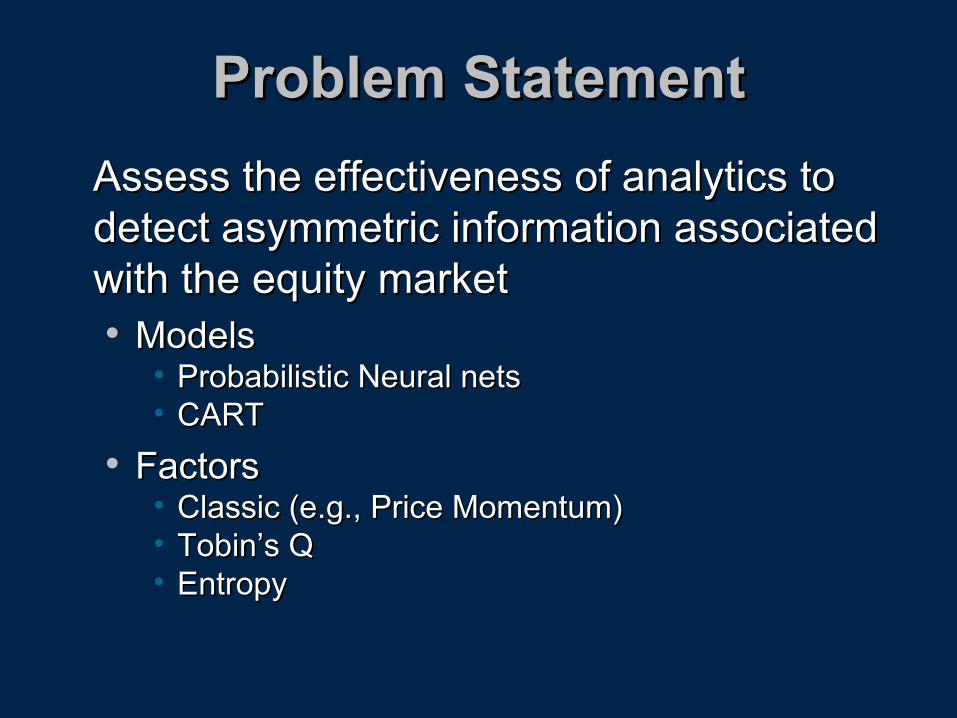
Assess the effectiveness of analytics to Assess the effectiveness of analytics to detect asymmetric information associated detect asymmetric information associated with the equity marketwith the equity market ModelsModels
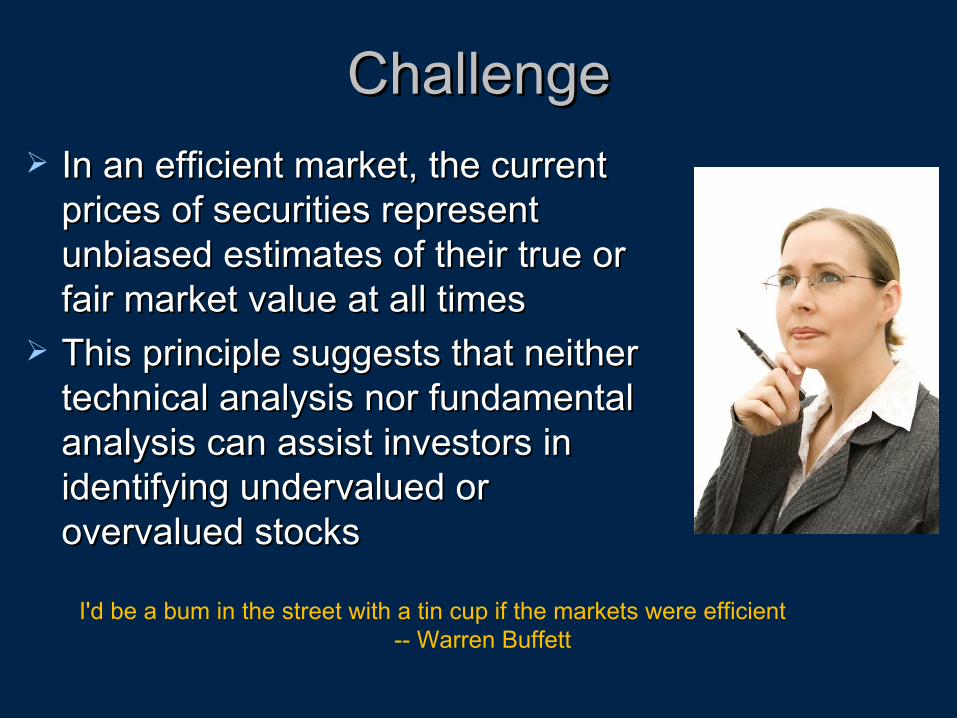
ChallengeChallenge In an efficient market, the current In an efficient market, the current
prices of securities represent prices of securities represent unbiased estimates of their true or unbiased estimates of their true or fairfair market value at all timesmarket value at all times
This principle suggests that neither This principle suggests that neither technical analysis nor fundamental technical analysis nor fundamental analysis can assist investors in analysis can assist investors in identifying undervalued or identifying undervalued or overvalued stocksovervalued stocks
I'd be a bum in the street with a tin cup if the markets were efficient -- Warren Buffett
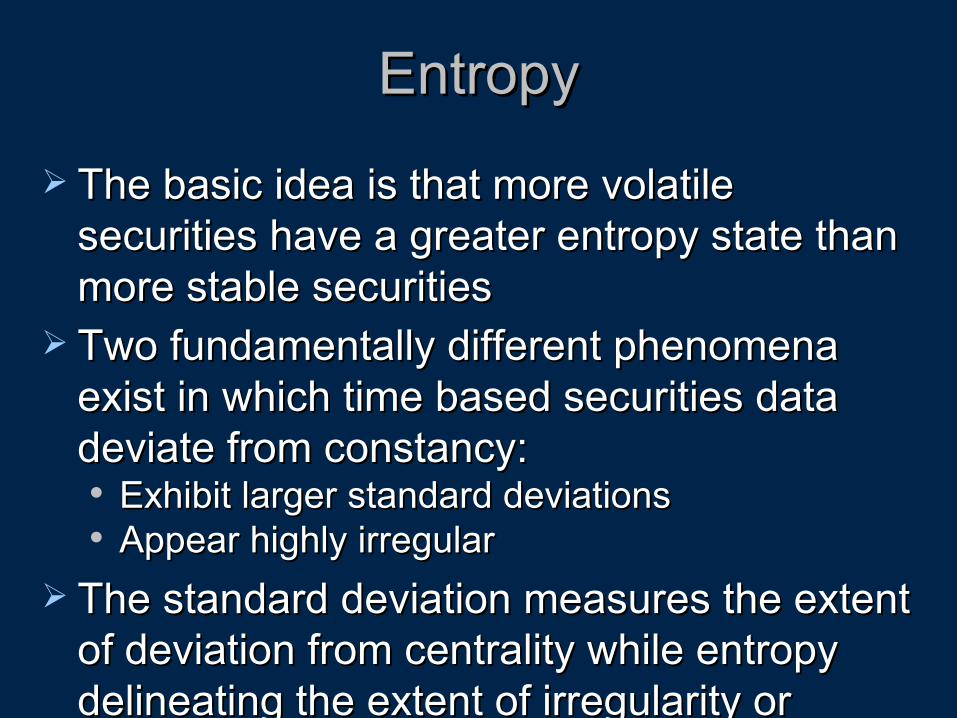
The basic idea is that more volatile The basic idea is that more volatile securities have a greater entropy state than securities have a greater entropy state than more stable securities more stable securities
Two fundamentally different phenomena Two fundamentally different phenomena exist in which time based securities data exist in which time based securities data deviate from constancy:deviate from constancy: Exhibit larger standard deviationsExhibit larger standard deviations Appear highly irregularAppear highly irregular
The standard deviation measures the extent The standard deviation measures the extent of deviation from centrality while entropy of deviation from centrality while entropy delineating the extent of irregularity or delineating the extent of irregularity or complexity of the data setcomplexity of the data set
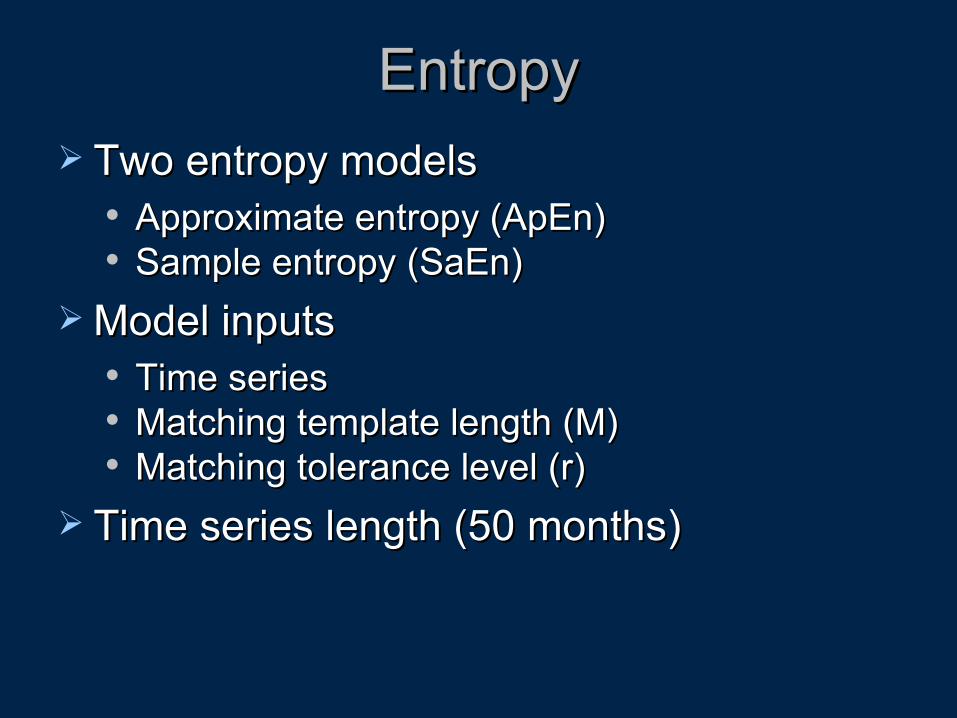
EntropyEntropy Two entropy modelsTwo entropy models
Model inputsModel inputs Time seriesTime series Matching template length (M)Matching template length (M) Matching tolerance level (r)Matching tolerance level (r)
Time series length (50 months)Time series length (50 months)
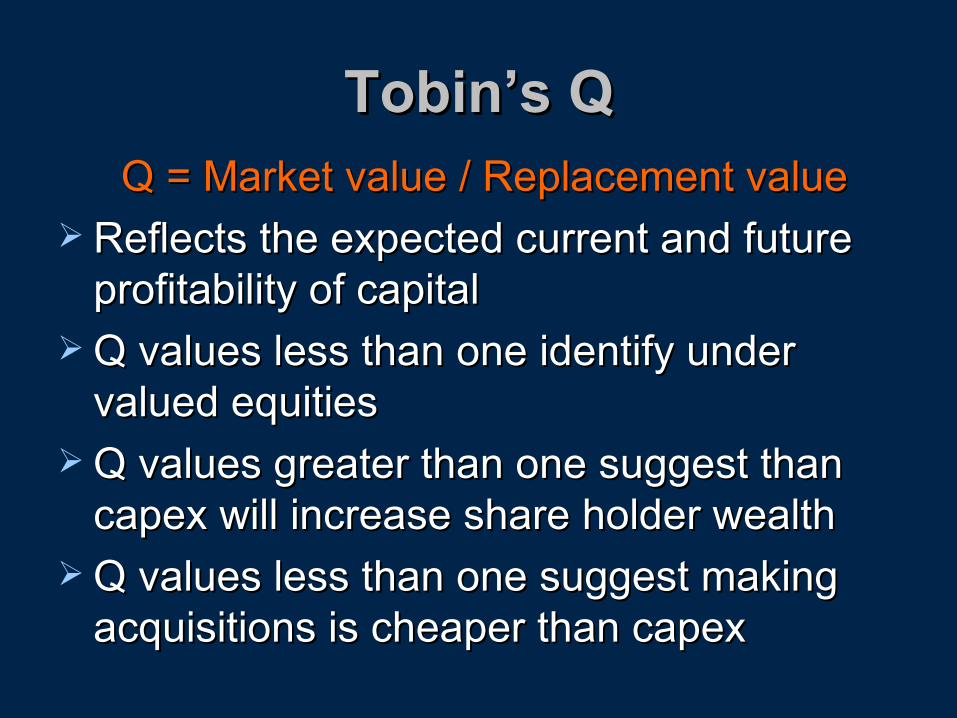
Tobin’s QTobin’s Q Q = Market value / Replacement valueQ = Market value / Replacement value
Reflects the expected current and future Reflects the expected current and future profitability of capital profitability of capital
Q values less than one identify under Q values less than one identify under valued equitiesvalued equities
Q values greater than one suggest than Q values greater than one suggest than capex will increase share holder wealthcapex will increase share holder wealth
Q values less than one suggest making Q values less than one suggest making acquisitions is cheaper than capexacquisitions is cheaper than capex
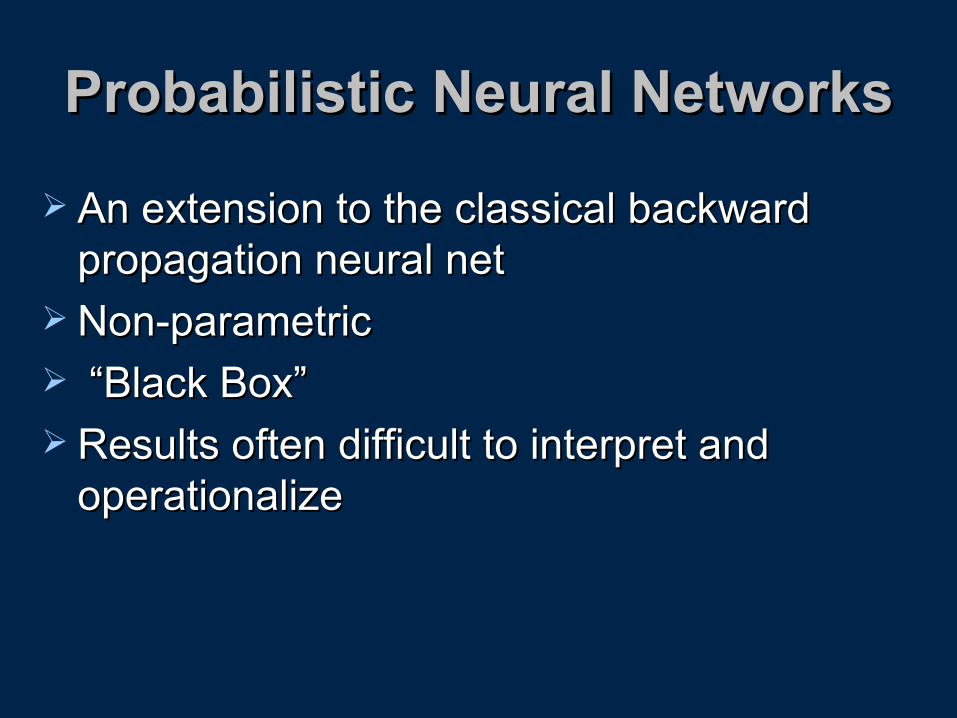
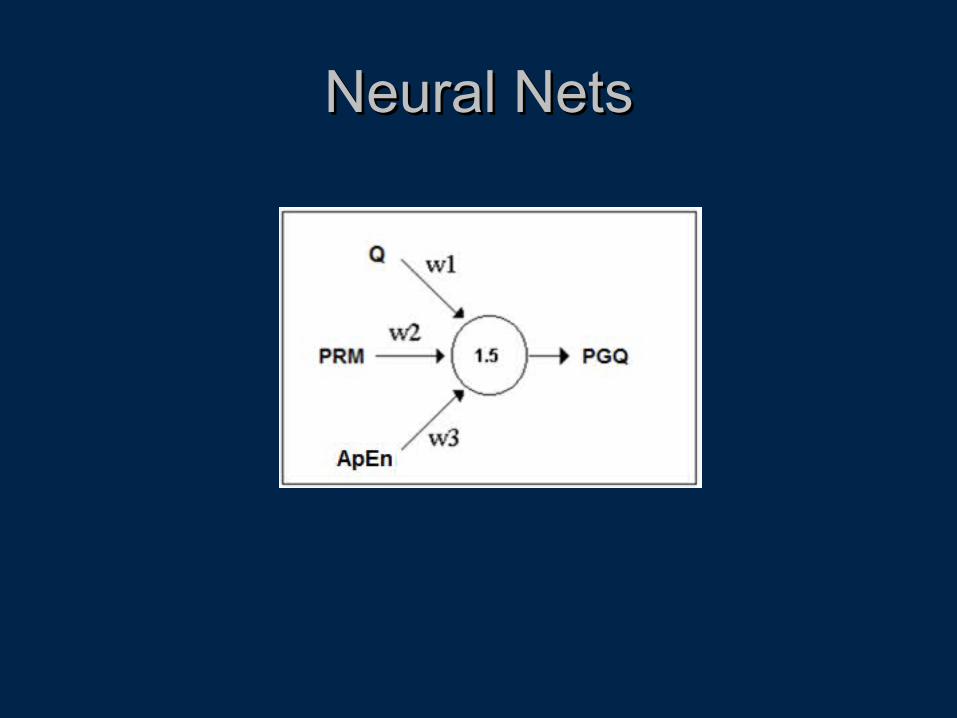
An extension to the classical backward An extension to the classical backward propagation neural netpropagation neural net
Non-parametricNon-parametric “ “Black Box”Black Box” Results often difficult to interpret and Results often difficult to interpret and
operationalizeoperationalize
Neural NetsNeural Nets
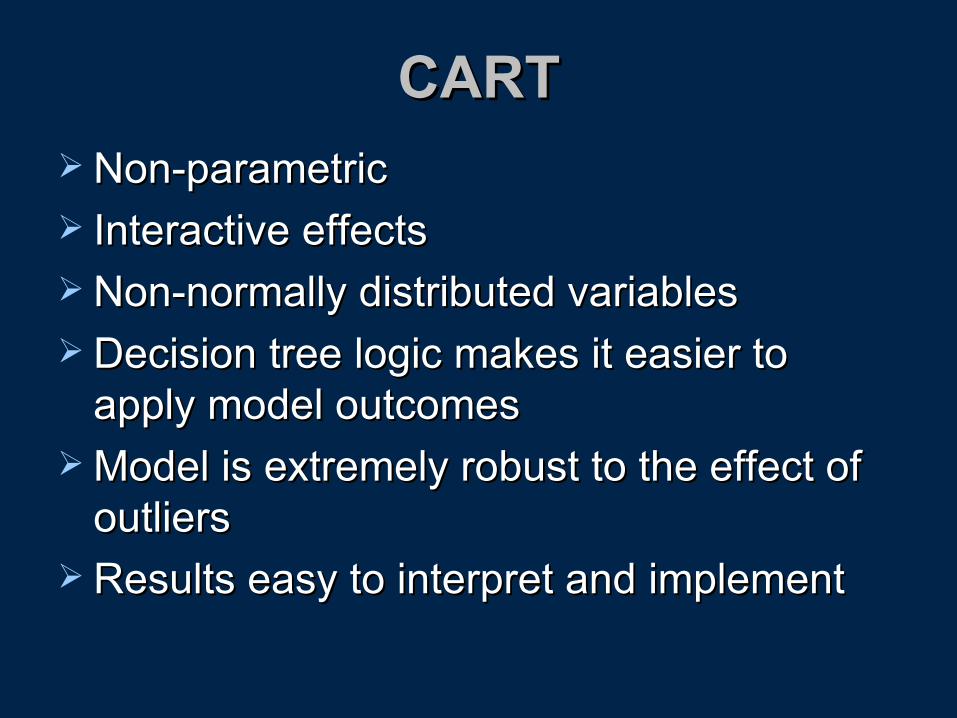
CARTCART Non-parametricNon-parametric Interactive effectsInteractive effects Non-normally distributed variablesNon-normally distributed variables Decision tree logic makes it easier to Decision tree logic makes it easier to
apply model outcomesapply model outcomes Model is extremely robust to the effect of Model is extremely robust to the effect of
outliersoutliers Results easy to interpret and implementResults easy to interpret and implement
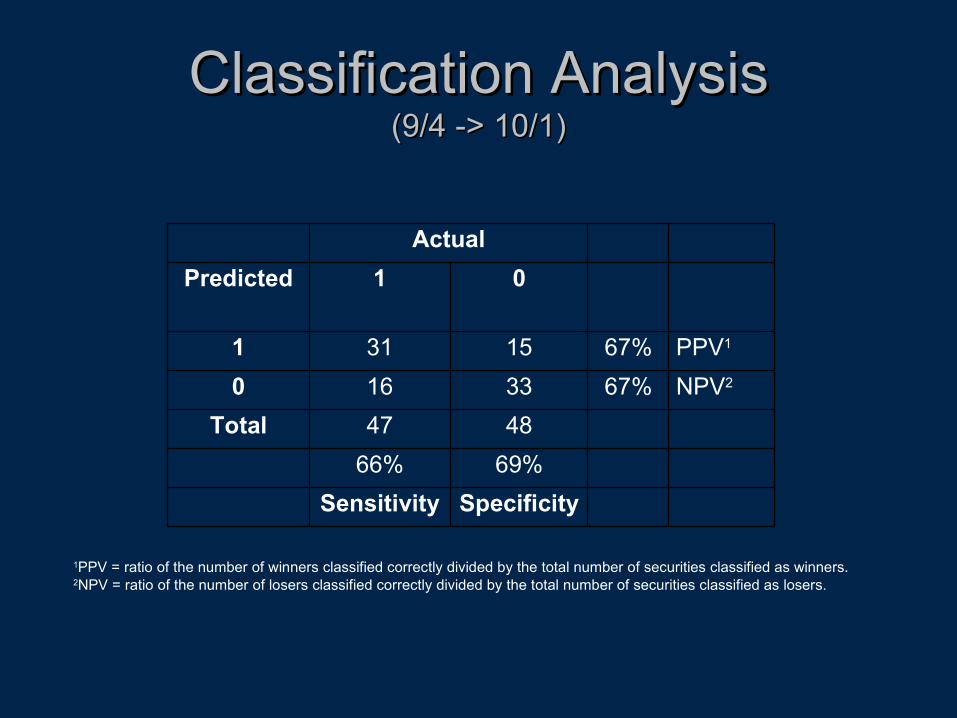
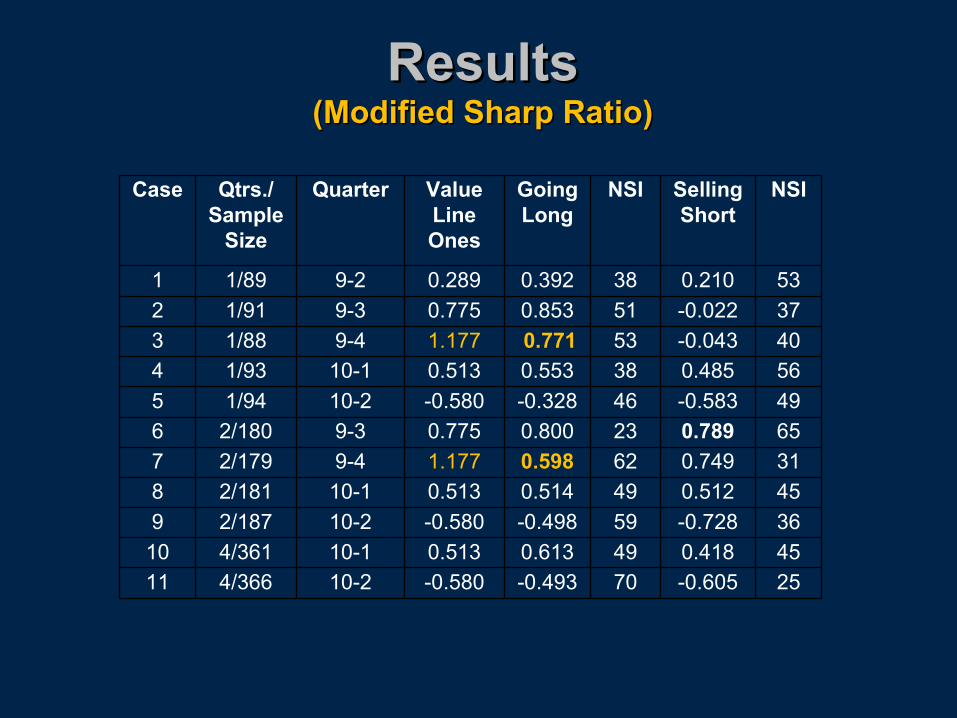
1PPV = ratio of the number of winners classified correctly divided by the total number of securities classified as winners.2NPV = ratio of the number of losers classified correctly divided by the total number of securities classified as losers.