+ All Categories
Home > Documents > Assessing the Computational Capacity of Functionally-Defined Networks Anthony Randal McIntosh The...

Assessing the Computational Capacity of Functionally-Defined Networks Anthony Randal McIntosh The...

Date post: 16-Dec-2015
Category:
Upload: opal-walters
View: 219 times
Download: 1 times
Share this document with a friend
Popular Tags:
6
Assessing the Computational Assessing the Computational Capacity of Functionally- Capacity of Functionally- Defined Networks Defined Networks Anthony Randal McIntosh The Rotman Research Institute Rolf Kötter C. &. O. Vogt Brain Research Institute Computational Systems Neuroscience Group
Transcript

Assessing the Computational Capacity Assessing the Computational Capacity of Functionally-Defined Networksof Functionally-Defined Networks

Anthony Randal McIntosh

The Rotman Research Institute

Rolf Kötter

C. &. O. Vogt Brain Research Institute

Computational Systems Neuroscience Group

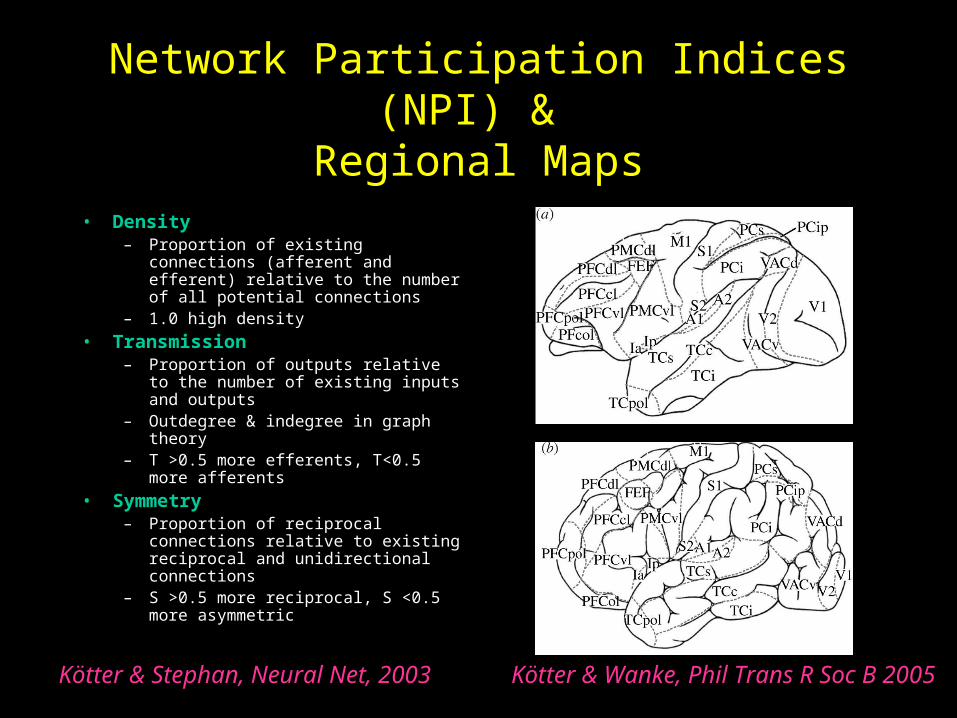
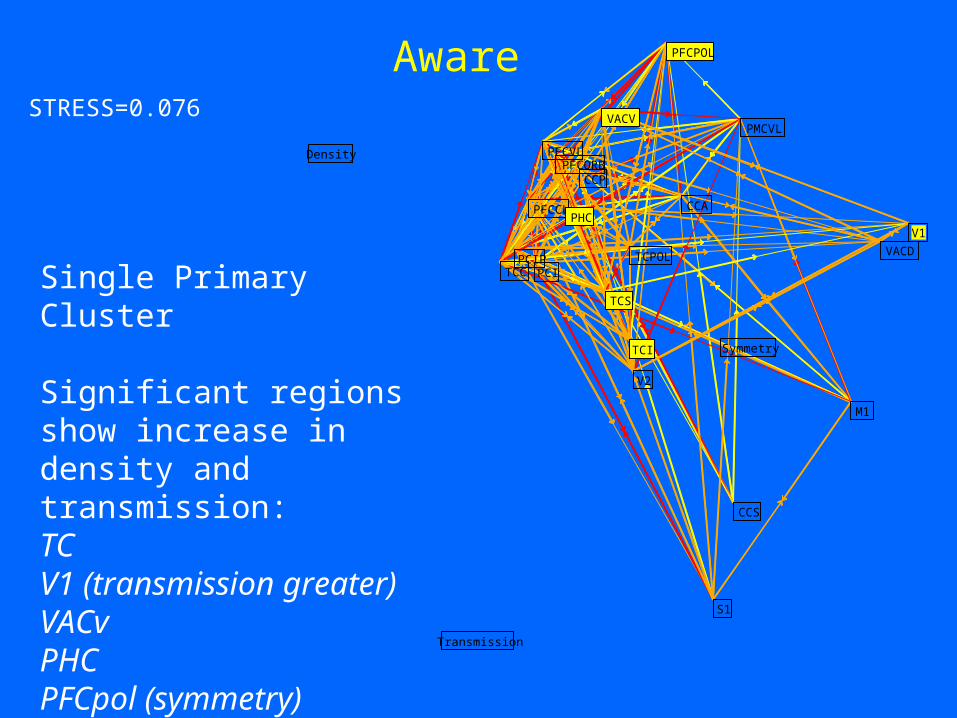
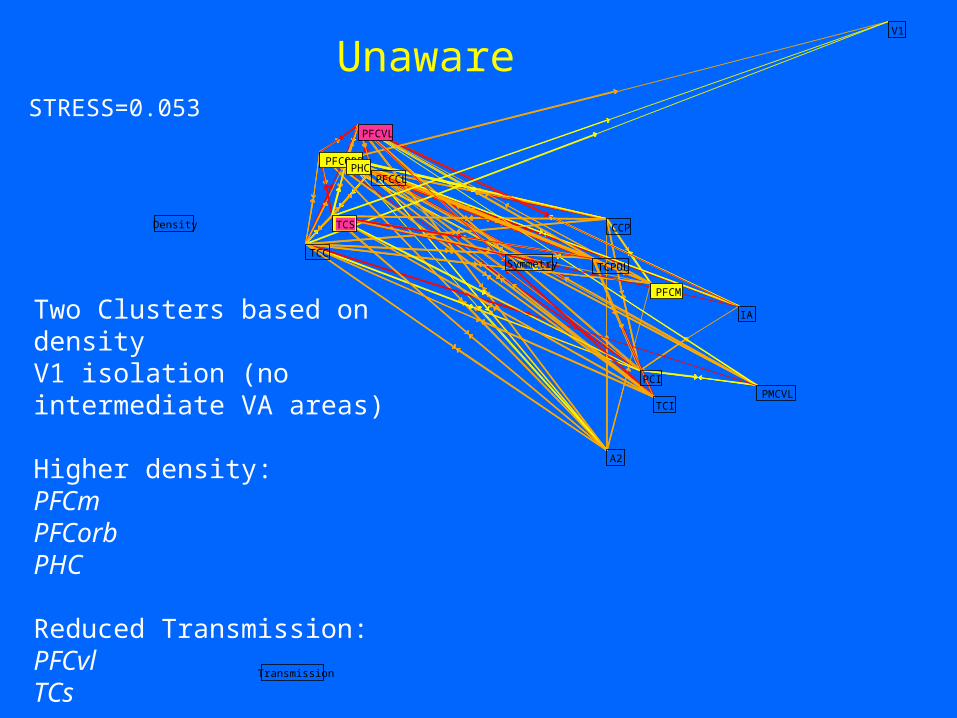
Network Participation Indices(NPI) &

Regional Maps• Density

– Proportion of existing connections (afferent and efferent) relative to the number of all potential connections

– 1.0 high density

• Transmission– Proportion of outputs relative to the

number of existing inputs and outputs– Outdegree & indegree in graph theory– T >0.5 more efferents, T<0.5 more

afferents

• Symmetry– Proportion of reciprocal connections

relative to existing reciprocal and unidirectional connections

– S >0.5 more reciprocal, S <0.5 more asymmetric

Kötter & Stephan, Neural Net, 2003 Kötter & Wanke, Phil Trans R Soc B 2005

A1

A2

CCACCP

CCR

CCS

FEF

IA

IP

M1

PCI

PCIP

PCM

PCS

PFCCL

PFCDLPFCDM

PFCM

PFCORB

PFCPOL

PFCVL

PHCPMCDLPMCM

PMCVL

S1

S2

TCCTCI

TCPOL

TCS

TCV

V1

V2

VACD

VACV

Pulvinar

ThalAM

Transmission

Density

Symmetry

STRESS=0.092

RM entire matrix

Awareness & Medial Temporal Lobe Functional Connectivity

Aware Unaware

See

d

Beh

avio

r

See

d

Beh

avio

r

McIntosh, Rajah & Lobaugh, J Neurosci, 2003

AwareSTRESS=0.076

CCA

CCP

CCS

M1

PCIPCIP

PFCCL

PFCORB

PFCPOL

PFCVL

PHC

PMCVL

S1

TCC

TCI

TCPOL

TCS

V1

V2

VACD

VACV

Transmission

Density

Symmetry

Single Primary Cluster

Significant regions show increase in density and transmission:TCV1 (transmission greater)VACvPHCPFCpol (symmetry)

STRESS=0.053

A2

CCP

IA

PCI

PFCCL

PFCM

PFCORB

PFCVL

PHC

PMCVL

TCC

TCI

TCPOL

TCS

V1

Transmission

Density

Symmetry

Unaware

Two Clusters based on densityV1 isolation (no intermediate VA areas)

Higher density:PFCmPFCorbPHC

Reduced Transmission:PFCvlTCs


Recommended