Assessing the environmental impact of pesticides; Effects of photosystem II inhibiting herbicides on primary production and ecosystems Anna Alvarsson Degree project for Master of Science in Ecotoxicology 30 ECTS Department of Biology and Environmental Sciences University of Gothenburg June 2012
Transcript
Assessing the environmental
impact of pesticides;
Effects of photosystem II inhibiting
herbicides on primary production
and ecosystems
Anna Alvarsson
Degree project for Master of Science in Ecotoxicology 30 ECTS Department of Biology and Environmental Sciences University of Gothenburg June 2012
1
2
SUMMARY
Today's society is more or less dependent on chemicals, and considering there are more than 100.000 chemicals used at an industrial scale, effects on non-target species are important. Planetary boundaries for nine environmental problems have been defined recently, but a boundary for chemical loads in the environment has not yet been quantified. Pesticides have a different use patterns compared to other chemicals. They are produced and used with the intention to prevent, control or destroy pests, which are considered to be harmful for humans. Photosystem II (PS II) inhibitors belong to a well known group of herbicides, which should not affect non-photosynthesising organisms. The aim of this study was to identify PS II inhibitors, their safe concentration limits as well as their environmental concentrations. This was made through a literature review. Four databases were used to search for scientific articles. The toxicity data of interest were restricted to field studies in which effects were determined at community level for primary producers. Effect data (EC50 and NOEC) were found for 14 out of 56 PS II inhibitors, and those with most information were diuron, atrazine, isoproturon and linuron. A comparison of effect data against temperature, light intensity and exposure duration did not indicate in any significant relationships. The literature search showed that almost all the studies were conducted in Europe. Only a few experiments were conducted in tropical areas. More field toxicity data for all chemicals, including photosystem II inhibitors as well as less extrapolation of threshold values from temperate to tropical zones might contribute to the quantification of a planetary boundary for chemical pollution.
SAMMANFATTNING
Dagens samhälle är mer eller mindre beroende av kemikalier, och om man beaktar att det finns mer än 100.000 kemikalier som används på industriell nivå,, så är effekter på arter som inte bör påverkas ett stort problem. Gobala gränser för nio miljöproblem har nyligen definierats, men någon gräns för kemisk påverkan i miljön har ännu inte kunnat kvantifieras. Pesticider har annorlunda användningssätt än andra kemikalier. De produceras och används med avsikt att förebygga, kontrollera och förgöra skadedjur. Fotosystem II hämmare är en välkänd grupp av herbicider, som inte bör ha någon påverkan på icke-fotosyntetiserande organismer. Syftet med detta arbete var att identifiera fotosystem II hämmare, dess säkra koncentrationsnivåer samt deras halter i miljön. Detta gjordes genom en litteraturstudie. Fyra databaser användes för att söka efter vetenskapliga artiklar. Toxicitetsdatan begränsades till det som tagits fram genom fältstudier och mätts på samhällsnivå för primärproducenter. Effektdata (EC50 och NOEC) hittades för 14 av 56 fotosystem II hämmare, och de med mest data var diuron, atrazin, isoproturon och linuron. Effektdata testades för korrelation med temperatur, ljusintensitet och exponeringstid, men dessa visade inte på några signifikanta trender. Litteratursökningen visade att nästan alla studier hade genomförts i Europa. Endast ett fåtal studier har gjorts i tropiska områden. Fler fältstudier med kemikalier i allmänhet, inklusive fotosystem II hämmare, såväl som mindre extrapolering av tröskelvärden från tempererade till tropiska zoner skulle kunna bidra till att kvantifiera globala gränsenvärden för kemisk påverkan.
APPENDIX C: Legal status of PS II inhibitors in EU and USA .................................................... 50
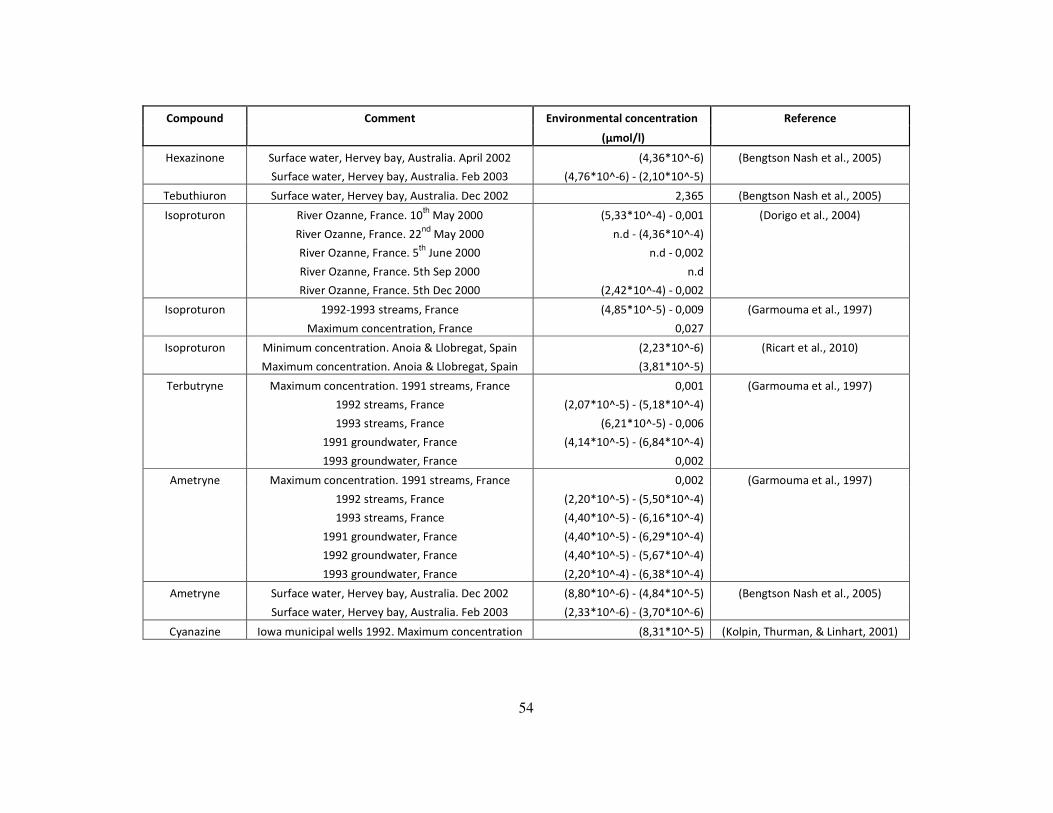
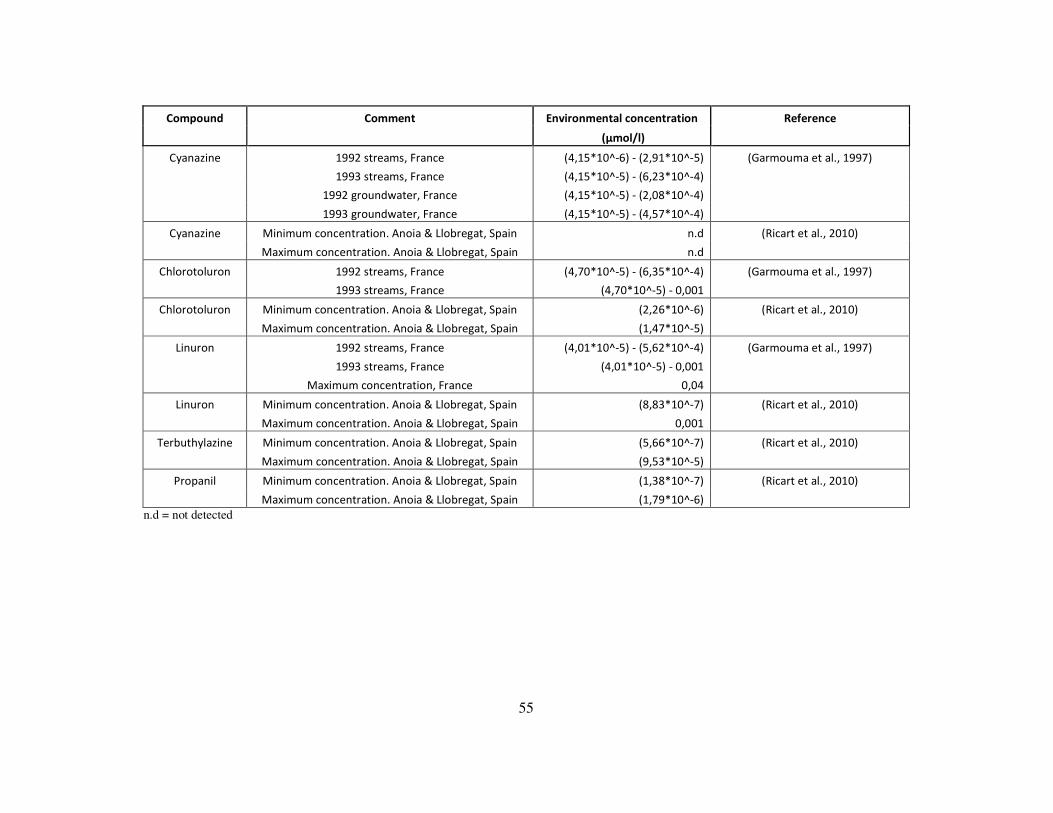
APPENDIX D: Environmental concentrations for 13 PS II inhibitors............................................ 52
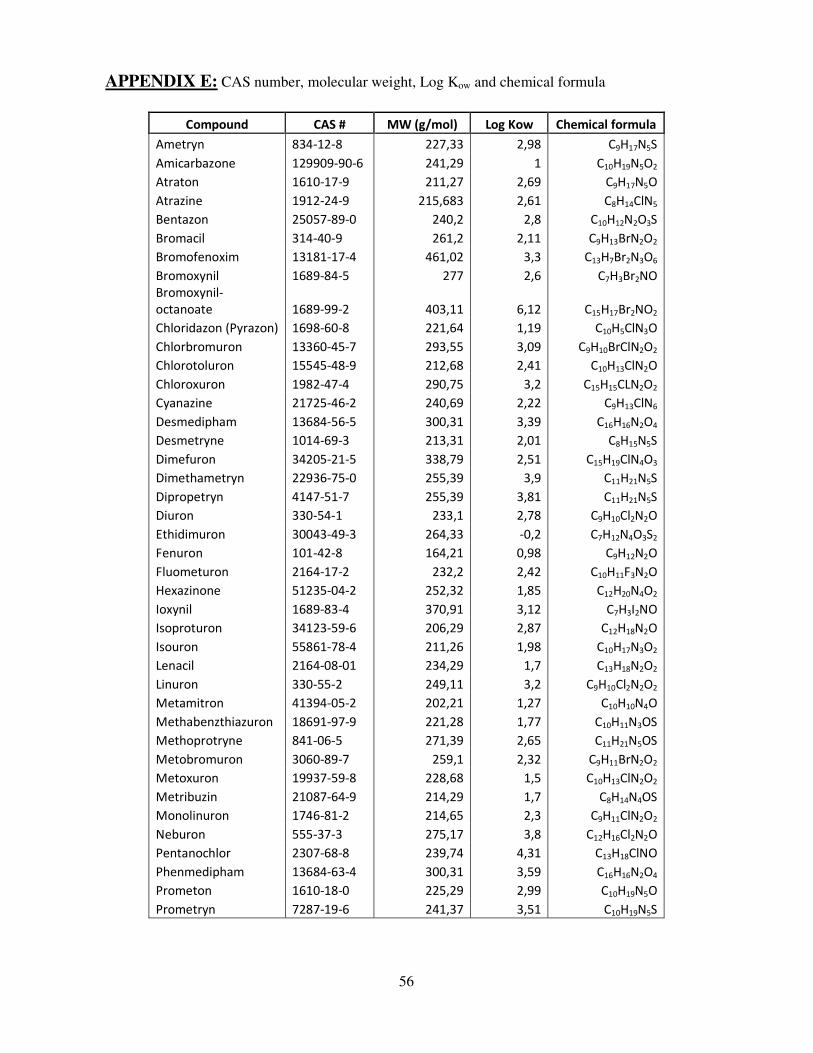
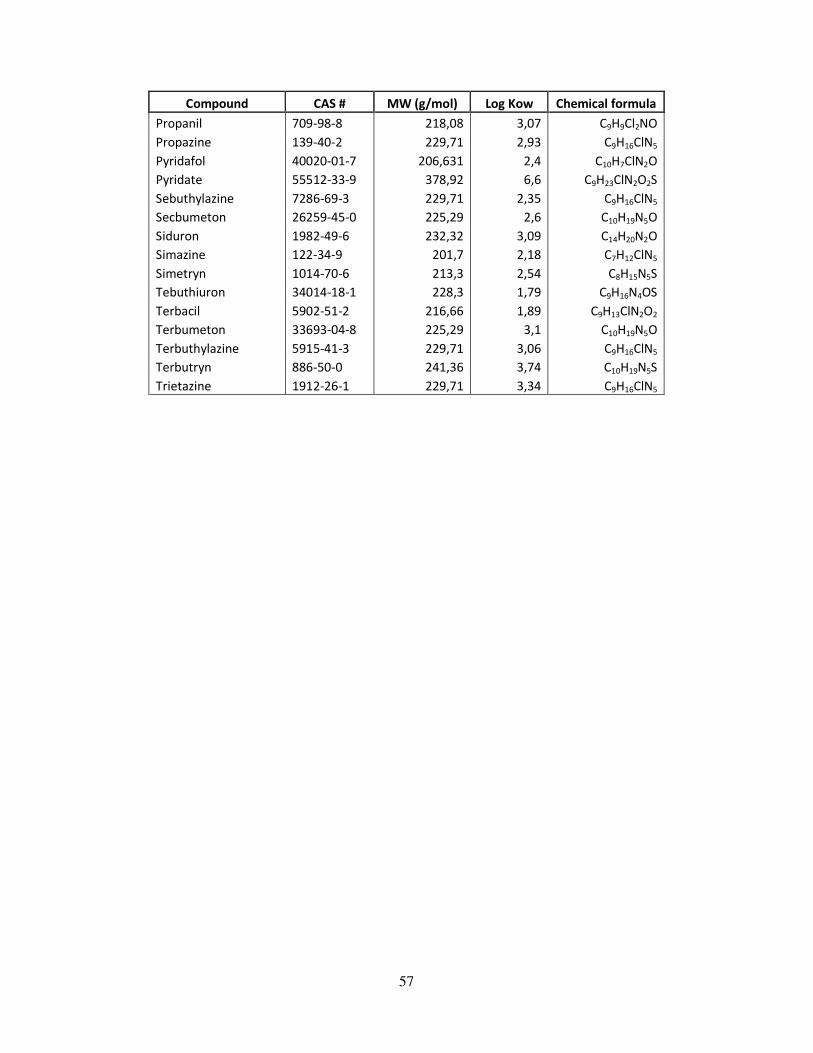
APPENDIX E: CAS number, molecular weight, Log Kow and chemical formula........................... 56
4
1. INTRODUCTION
Today's society is highly dependent on the use of various chemicals. The chemicals are seldom produced to have an impact on the environment. Unfortunately environmental impact is a rather common side-effect of societal use. Impacts on ecological life do occur when chemicals are released. The environmental concern of existing and emerging chemicals as well as their environmental transformation products is of large interest to today's ecotoxicologists. Rockström et al. (2009) have tried to define planetary boundaries for several environmental problems, such as the thinning of the ozone layer, global warming, eutrophication, over consumption of freshwater etc. Such “planetary boundaries” are values applied to control variables, for example carbon dioxide concentration in the atmosphere, and they can either be at a safe distance (for processes with known threshold values) or at more dangerous levels (for processes without known threshold values). One of the identified environmental problems was “chemical stress”. Due to lack of evidence for threshold behaviour, boundaries for chemical loads in the environment have not yet been quantified. Their study also claims that the Earth´s Holocene, the period of environmental stability, is under great threat since the Industrial Revolution human activities have the possibility to disturb large scale environmental processes such as the nitrogen/phosphorous cycle or lowering the pH in our oceans. Exceeding planetary boundaries could cause the Earth to be pushed outside the Holocene, which in turn could lead to a less suitable place for human and ecological life development (Rockström et al., 2009). Considering the vast number of chemicals in our environment (> 100.000 at an industrial scale (von der Ohe et al., 2011)), effects on non-target species are a big issue. Pesticides and biocides are two classes of chemicals for which the use pattern is different as when compared with other chemicals. These two compound groups are deliberately released into the environment with an intention to prevent, control (Brock et al., 2004) or destroy any pest that is considered to be harmful (WHO, 2012). Leakage from agricultural fields sprayed with pesticides impacts nearby ecosystems. Yet, effects on ecological life further away are also of potential concern due to drift and volatilization. The environment and the ecological life may be affected from such run-offs and dissipation patterns (Brock et al., 2004). Rachel Carson raised the environmental concern from the usage of DDT to a public level in 1962 when Silent Spring was published. She highlighted how DDT resisted degradation and instead accumulated in lipids in organisms. How DDT caused thinning of egg shells and enhanced the risk of breaking after being laid, consequently populations of raptors and fish-eating birds rapidly decreased (Newman & Unger, 2003). Although DDT is banned in Europe and North America since the 1970s there are still other pesticides in use raising issues and concerns about the environmental health. This study focuses on photosystem II (PS II) inhibitors, a well known group of herbicides. PS II inhibitors should not affect non-photosynthesising organisms which facilitate the limitation of this study. Also, more focus is put on a group of chemicals rather than single substances to achieve higher ecological relevance. Herbicides sprayed on agricultural fields to control pests may affect aquatic life. Such contamination have been observed several times, both in the laboratory and in the fields (Daam, Rodrigues, Van den Brink, & Nogueira, 2009). Microcosm and mesocosm studies, simulating real ecosystems, are tools to analyse effects from pesticide stress to the aquatic life and provide more ecological relevance to the study compared to a single species laboratory test (Daam, Rodrigues, et al., 2009; P. J. Van den Brink, Blake, Brock, & Maltby, 2006). The results from a micro- or mesocosm study have the potential to explain a real case scenario better, although indirect effects from chemical exposure may be difficult to evaluate as it is more site-specific and time dependent
5
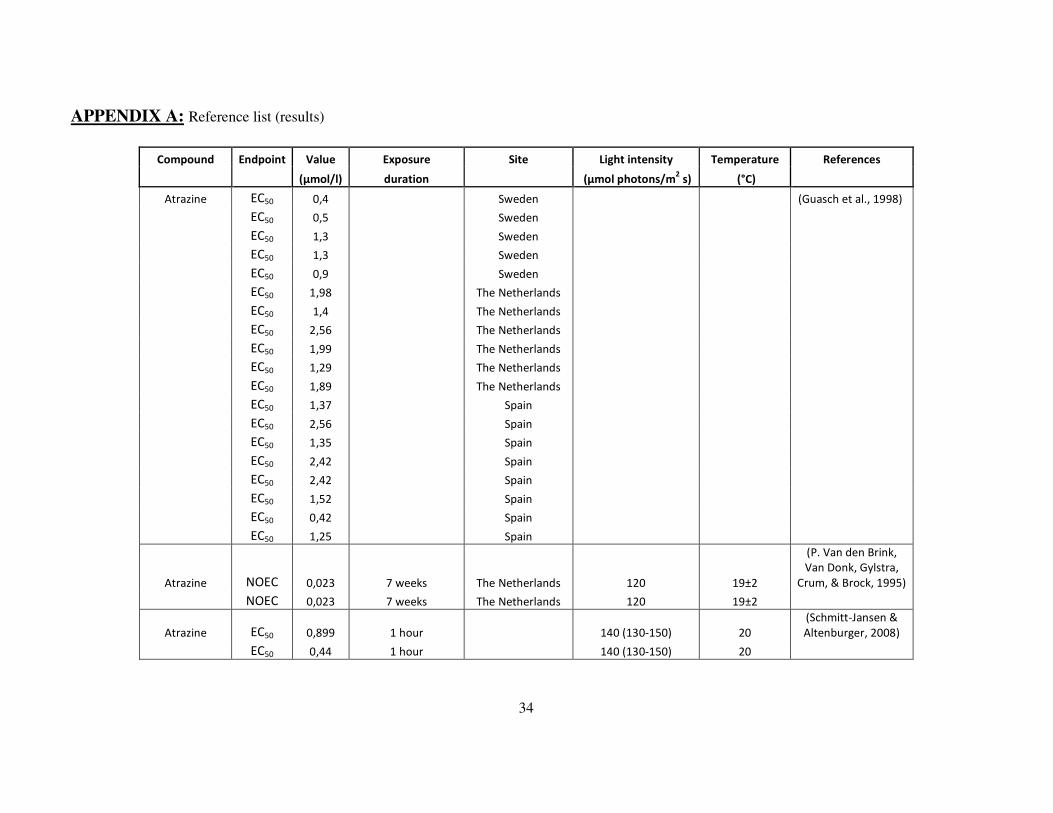
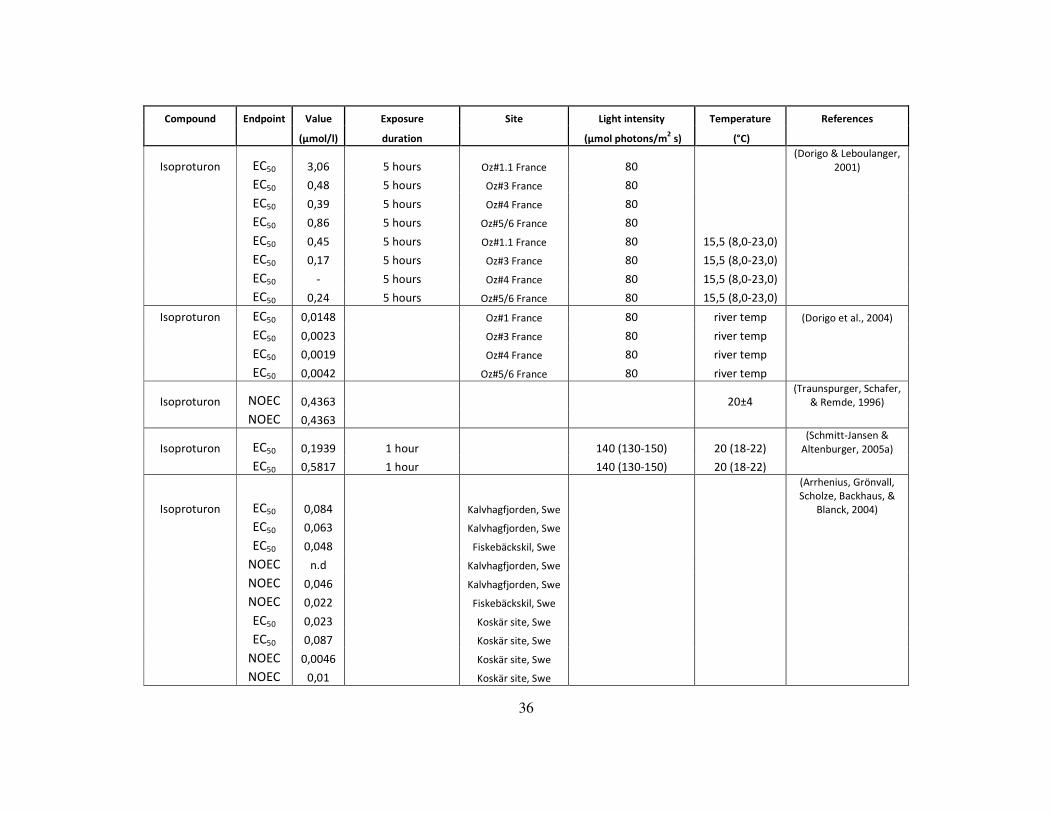
(Kersting & Van Wijngaarden, 1999) in matter of ecosystem structure and function. In addition, indirect effects most often play a bigger role on how the abundance is affected in a community compared to direct effects. But the knowledge of indirect effects in ecotoxicological studies are still narrow as standard test species used in mesocosms are usually not the most sensitive ones. Secondly, the generation times of those species are often below one year, therefore it can be assumed that the recovery potential in mesocosms are higher than for a real field community with generation times of one year or more (von der Ohe et al., 2011). The complexity of indirect effects is a reason behind why it is not standardised in any legal framework (Bengtson Nash et al., 2005). Guasch et al. (1998) found different EC50 values (Effect Concentration 50%) for the triazine herbicide atrazine from twenty different locations in Sweden, The Netherlands and Spain. The relationship between environmental variables, community composition and the sensitivity of periphyton was evaluated. The Swedish sites were less polluted compared to the Dutch and Spanish sites, consequently the periphyton was affected at lower atrazine exposure concentrations. The Swedish sites also showed lower nutrient content, pH and alkalinity but had higher dissolved organic carbon (DOC) content compared to the Dutch and most of the Spanish sites. Differences in species composition, pH and nutrient and DOC contents are potential reasons behind the variation in sensitivity. The lowest atrazine EC50 measured was from a nutrient-poor site in Sweden and the highest were measured in one shaded site in Spain and one open site with high nutrient content in The Netherlands (0,4 µmol/l and 2,56 µmol/l, respectively) (Guasch et al., 1998). The urea herbicides diuron (Pesce et al., 2010) and isoproturon (Dorigo & Leboulanger, 2001) have shown to be less toxic to already pre-exposed periphyton communities (more polluted sites) with some differences in nutrient and DOC contents between locations (Dorigo & Leboulanger, 2001; Pesce et al., 2010). It has been recently acknowledged that an ecosystems response to stress depends partly upon environmental factors, especially nutrient contents (De Laender, Van den Brink, & Janssen, 2011). The level of certainty to extrapolate effect data from one ecosystem to another with regards to different geographical locations (temperate or tropic zones), exposure regimes (stagnant or flow-through) or if it is a lab or field study is an ongoing debate (Daam et al.., 2009). However, . Van den Brink et al. (2006) showed high similarity between threshold values in the different types of systems compared. This is consistent with a study performed in Thailand by Daam et al. (2009) when primary producers and zooplankton communities were exposed to linuron. The fate and sensitivity did not differ to a larger extent compared to temperate zones. In comparison, Magnusson et al. (2010) showed the tropical benthic microalgae to be relatively sensitive to herbicide stress compared to species from temperate zones and standard test species. As a result Magnusson et al., 2010 claims that it may be more advantageous to test local organisms and local regions for superior protection when guidelines are established. A lab study performed by Mayasich et al. (1986) with atrazine agrees with Magnusson et al.(2010) as it showed elevated toxicity in higher temperatures and increased light conditions to the green algae Nannochloris oculata. Intensive agriculture is usually the main source and the cause to herbicides ending up in the river systems (Dorigo & Leboulanger, 2001). Approximately 1% of the applied herbicide is estimated to leak out from the herbicide treated fields to surrounding environment and 2-3% where heavy rainfall occurs within 2 weeks after application (Bengtson Nash et al., 2005). In the Netherlands pesticides have been detected at concentrations above its legal standards (Hartgers et al., 1998), streams in Sweden, Denmark (Gustavsonet al., 2003) and Spain (Guasch et al., 1998) just as other European countries (Knauer et al., 2010) suffers from agricultural pollution. Water and sediment samples from Australia report herbicide contamination along the Queensland coast (Magnusson, Heimann, & Negri, 2008), and the marine tropical environment are of great concern due to exposure to agricultural pesticides (Jones, 2005). North American streams also suffer from pollution around agricultural areas (Gustavson et al., 2003). In Bangladesh around 1800 tons/year of pesticide residues are added to the aquatic environment, which is also estimated for other Asian countries such as India, Indonesia and China (Islam & Tanaka, 2004). Pesticides influence all the trophic
6
levels in the aquatic ecosystem due to pesticide run-off and their residues, thus the system are at great risk (Islam & Tanaka, 2004). National and international policy makers and agencies face a challenge in weighing the benefits against the risks associated with exposure to a pesticide. The development of new regulations or amendments of already existing ones aims to minimize the risks but at the same time gain welfare and protect surrounding society and ecosystems. As pesticide pollution to aquatic environment is of major concern (Konstantinou et al., 2006) authorities in many countries have decided upon ecological standards for a pesticide before it can be registered for commercial use (Daam et al., 2009). The European Union (EU) has acts against surface-, transitional-, coastal- and groundwater pollution, enforcing the assessment of the chemical status of the waterbodies and to reduce the levels of pollutants (European Union, 2010). A number of different directives and regulations deal with the use of pesticides. The Council Directive 91/414/EEC for evaluation and marketing of pesticides in plant protection in the community, came in to force in 1991, concerning the placing of plant protection products on the market “whereas their use may involve risks and hazards for humans, animals and the environment, especially if placed on the market without having been officially tested and authorized and if incorrectly used” (European Union, 1991). The European Commission lists the directives and decisions of inclusion or non-inclusion of individual active substances in pesticides in Annex I in Directive 91/414/EEC (European Commission, 2012a). The compounds included on the list are approved for usage within EU, including a total of 15 PS II inhibitors. The Directive 2000/60/EC of the European Parliament and of the Council establishing a framework for Community action in the field of water policy, also called Water Framework Directive (WFD) was adopted in 2000 for protection and management of European waters. Objectives such as a “good ecological and chemical status” for both ground waters and surface waters will be achieved by year 2015 (European Union, 2010). The Water Framework Directive established a first list of priority substances outlined in Annex X. The 33 priority substances are single substances or groups of substances that represent a considerable risk to the aquatic environment and are outlined according to Article 16 of the WFD. The priority substances are risk assessed through evaluation of hazardous properties, the extent of contamination of European waters, volumes used etc. The WFD was amended and the first list of priority substances was replaced by Annex II in Directive 2008/105/EC, on environmental quality standards in the field of water policy (EQSD), also called the Priority Substances Directive. This directive implemented environmental quality standards (EQS) for substances in surface waters. A certain threshold concentration (an ecotoxicological boundary) of concerned toxic substances in the water communities cannot be exceeded. Additionally, according to a new proposal from 2012 (COM(2011)876) amending Directive 2000/60/EC and Directive 2008/105/EC, 15 new substances may be added to the list of priority substances, including one PS II inhibitor. This adds up to a total of five (atrazine, diuron, isoproturon, simazine and the proposed terbutryn) PS II inhibitors on the list of priority substances (European Commission, 2012b). There are primarily two groups of PS II inhibitors, 1) phenylurea and triazines, 2) phenols (Jones, 2005). These two groups are further divided into chemical classes which forms triazines (ametryn, atraton, atrazine, cyanazine, desmetryne, dimethametryne, dipropetryn, methoprotryne, prometon, prometryn, propazine, sebuthylazine, secbumeton, simazine, simetryne, terbumeton, terbuthylazine, terbutryn, trietazine), triazinones (hexazinone, metamitron, metribuzin), triazolinone (amicarbazone), uracils (bromacil, terbacil, lenacil), pyridazinone (chloridazon = pyrazon), phenyl-carbamates (desmedipham, phenmedipham), ureas (chlorbromuron, chlorotoluron, chloroxuron, dimefuron, diuron, ethidimuron, fenuron, fluometuron, isoproturon, isouron, linuron, methabenzthiazuron, metobromuron, metoxuron, monolinuron, neburon, siduron, tebuthiuron),
7
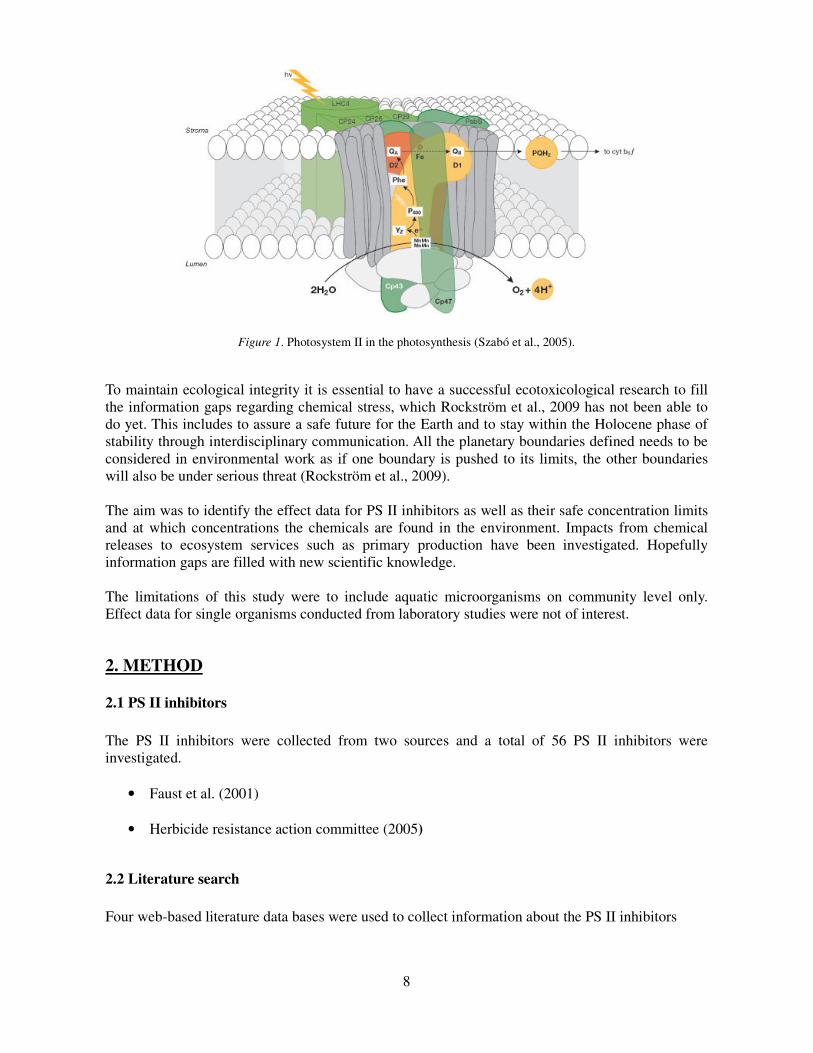
amides (propanil, pentanochlor), nitriles (bromofenoxim, bromoxynil, ioxynil), benzothiadiazinone (bentazon) and phenylpyridazines (pyridate, pyridafol) (Faust et al., 2001; Herbicide resistance action committee, 2005). More than half of all the herbicides for commercial use are PS II inhibitors and as the name already reveals they act by inhibit the photosystem II in the photosynthesis (Jones, 2005). The photosynthesis is a light dependent reaction enabling plants, algae and cyanobacteria to convert carbon dioxide into organic compounds, e.g. sugars, in the presence of sunlight or some other light source. This is a vital chemical reaction for all organisms as it is a source for energy and food. Pigment proteins, such as chlorophyll are structurally placed within the thylakoids. These pigment proteins build up the photosystems where each such complex consists of 250 to 400 pigment molecules. To get the most efficient capture of light the chlorophyll-proteins are bound and held in place by specific chlorophyll-binding proteins located in the membrane. The vital photochemical reaction in photosystem II is carried out when electrons are transferred from water to plastoquinone (PQ). Plastoquinone are also called water-plastoquinone oxido-reductase. It is only one pair of the pigment molecules (chlorophyll-a) that are able to capture photons and transfer them directly in to the chemical reaction. These are located in the reaction centre (D1) (Fig. 1) and are known as P680 and as P680* in an excited singlet state. The reduction of pheophytin by P680* forms a primary radical pair (P680*+ pheo-) which can then reduce the first stable electron acceptor in the chain, QA, forming QA
-. At the same time an electron from the water-splitting enzyme is extracted. In its turn, QA
- passes the electron down the reaction chain on the D1 protein to QB. In the second run of electron transfer from QA, QB becomes reduced to plastoquinol as 2H+ are simultaneously taken up and QB is exchanged for PQ. However in the presence of a PS II inhibitor QA cannot be oxidised by QB as it is already fully reduced. Hence PS II inhibitors are PQ analogs and therefore blocks the electron transport chain in photosystem II through the binding to the QB binding site on the D1 protein and compete for the site with PQ (Jones, 2005). Without the presence of a PS II inhibitor the electron carriers are coupled such that the protons are able to be pumped over the thylakoid membrane, through a cytochrome b6/f complex. This will create an electrochemical proton gradient and finally generate ATP in photosystem I (Raven et al., 2005). As the electron flow is interrupted, no ATP synthesis will occur consequently killing the plant (Masojidek et al., 2011; Rutherford & Krieger-Liszkay, 2001). This is for example visible to the human eye through the plants colour conversion from green to yellow when photosynthesis has stopped and the chlorophyll molecules break down. Eventually, the leaves fall off and there will be nothing left but the stem. However, energy starvation is not the main cause of the plants death; photodamage of chlorophyll-bearing proteins is the reason behind the mortality of the plant (Jones, 2005).
8
Figure 1. Photosystem II in the photosynthesis (Szabó et al., 2005).
To maintain ecological integrity it is essential to have a successful ecotoxicological research to fill the information gaps regarding chemical stress, which Rockström et al., 2009 has not been able to do yet. This includes to assure a safe future for the Earth and to stay within the Holocene phase of stability through interdisciplinary communication. All the planetary boundaries defined needs to be considered in environmental work as if one boundary is pushed to its limits, the other boundaries will also be under serious threat (Rockström et al., 2009). The aim was to identify the effect data for PS II inhibitors as well as their safe concentration limits and at which concentrations the chemicals are found in the environment. Impacts from chemical releases to ecosystem services such as primary production have been investigated. Hopefully information gaps are filled with new scientific knowledge. The limitations of this study were to include aquatic microorganisms on community level only. Effect data for single organisms conducted from laboratory studies were not of interest.
2. METHOD
2.1 PS II inhibitors
The PS II inhibitors were collected from two sources and a total of 56 PS II inhibitors were investigated.
• Faust et al. (2001)
• Herbicide resistance action committee (2005)
2.2 Literature search
Four web-based literature data bases were used to collect information about the PS II inhibitors
9
• Web of knowledge (webofknowledge.com) • Science direct (sciencedirect.com) • Scopus (scopus.com) • Google scholar (scholar.google.se)
To receive the correct information a refined search was made for each compound where the compounds name in combination with a more detailed word gave the selection of articles available for comparison. At least three searches (usually 4-6) were made on each data base depending on the amount of available information of the compounds. The same combination of words was used in all four data bases for each compound.
• microcosm – compounds name • mesocosm – compounds name • field study – compounds name • primary production – compounds name
The order of the refined search word and the compounds name did not matter concerning the available information of each PS II inhibitor. However, there were some differences in the search between PS II inhibitors. Compounds having a substantially large amount of articles (e.g. atrazine and diuron) needed a more refined search compared to compounds where the information was scarce. PS II inhibitors lacking information, a search only on the compounds name was enough (e.g. secbumeton and bromofenoxim). Although for some occasions when the information of a PS II inhibitor was scarce a more refined search helped to find the few articles that was of interest. An example of the layout of a more detailed and refined search was:
• atrazine – primary production – effect data – microcosm • field study – diuron – periphyton
Cyanazine and simazine, were the PS II inhibitors that needed a detailed search because of the lack of information. Diuron and atrazine were the PS II inhibitors that needed a detailed search because of the great amount of information.
2.3 Effect data comparison
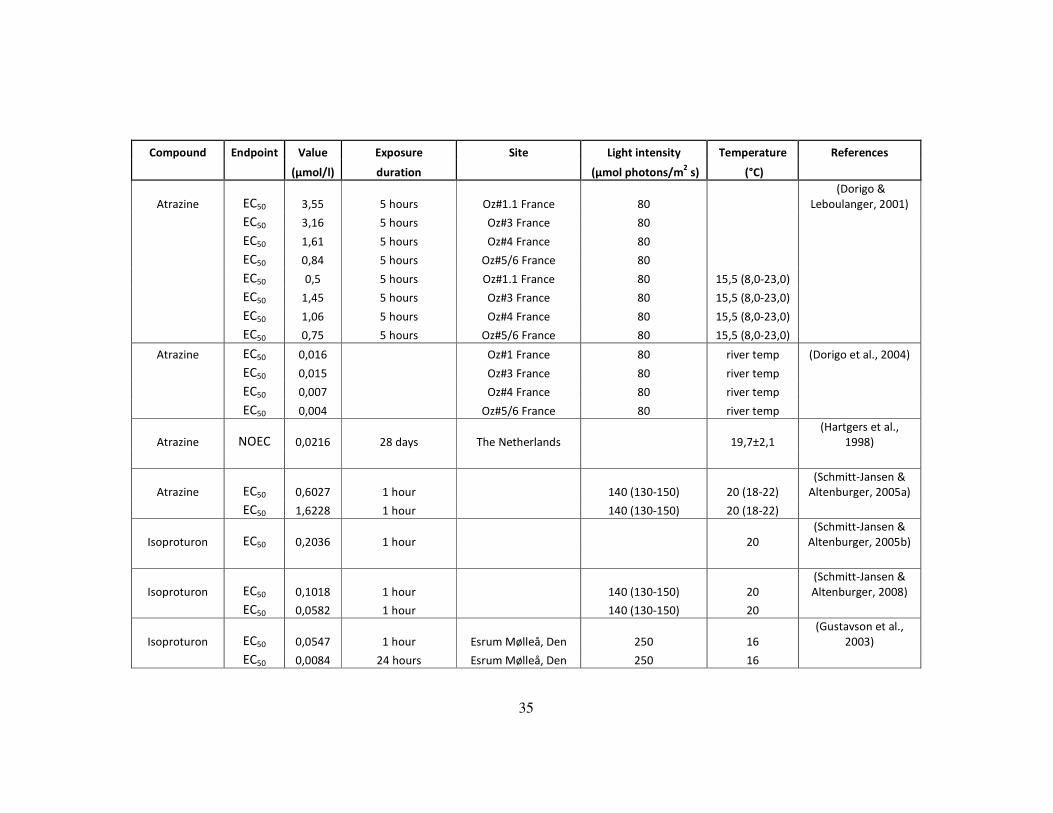
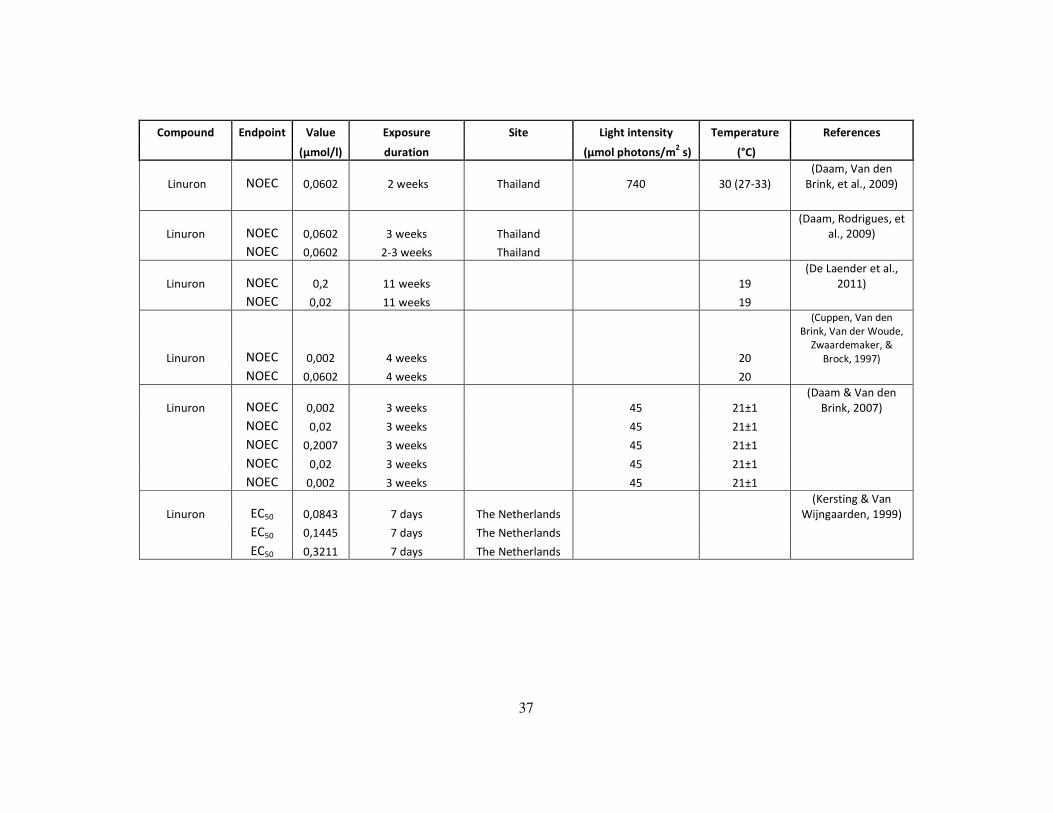
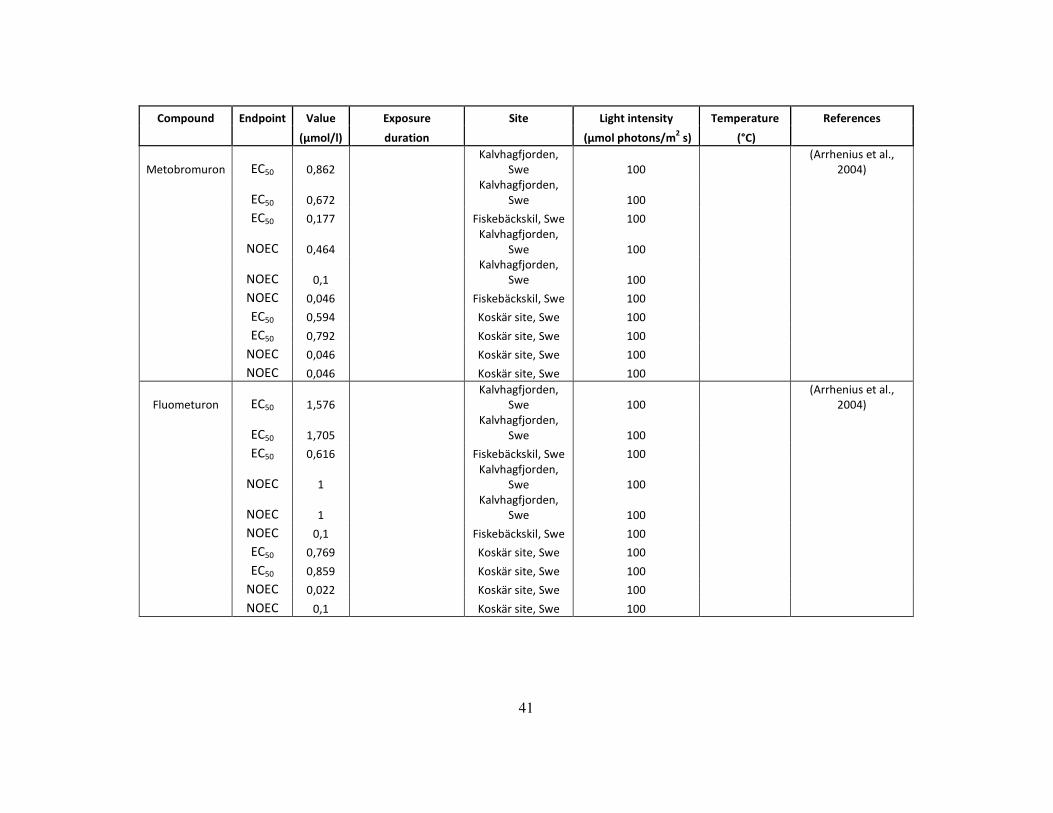
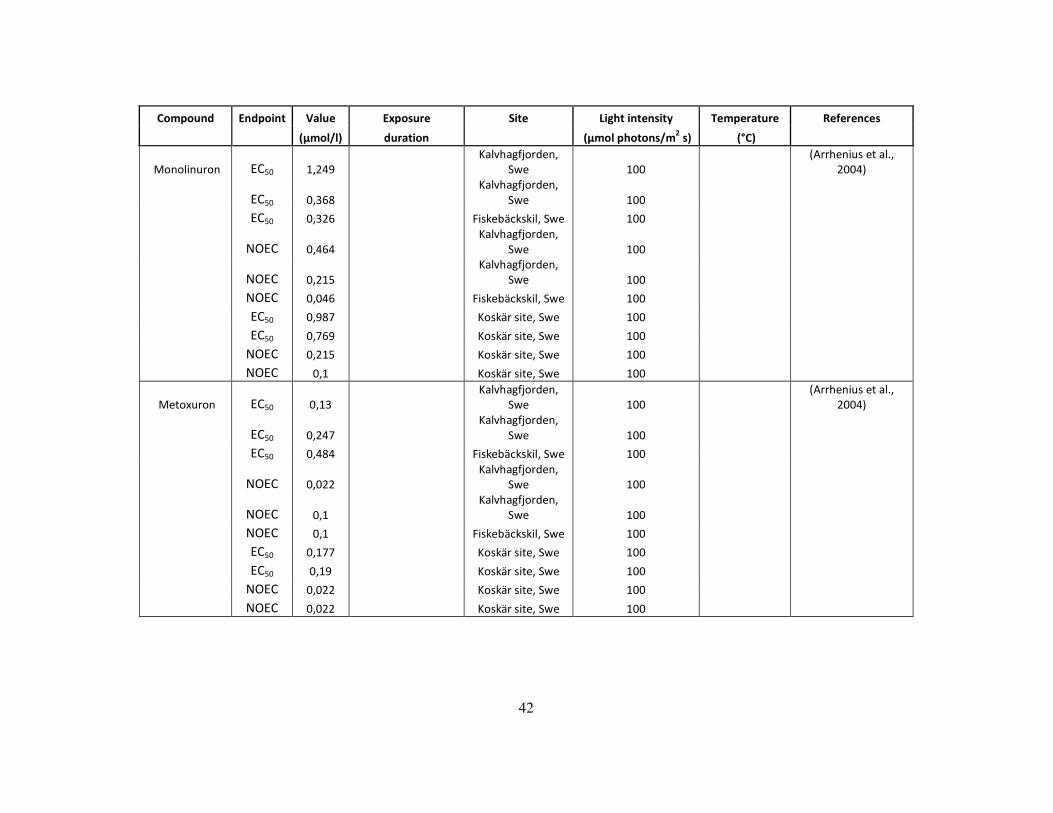
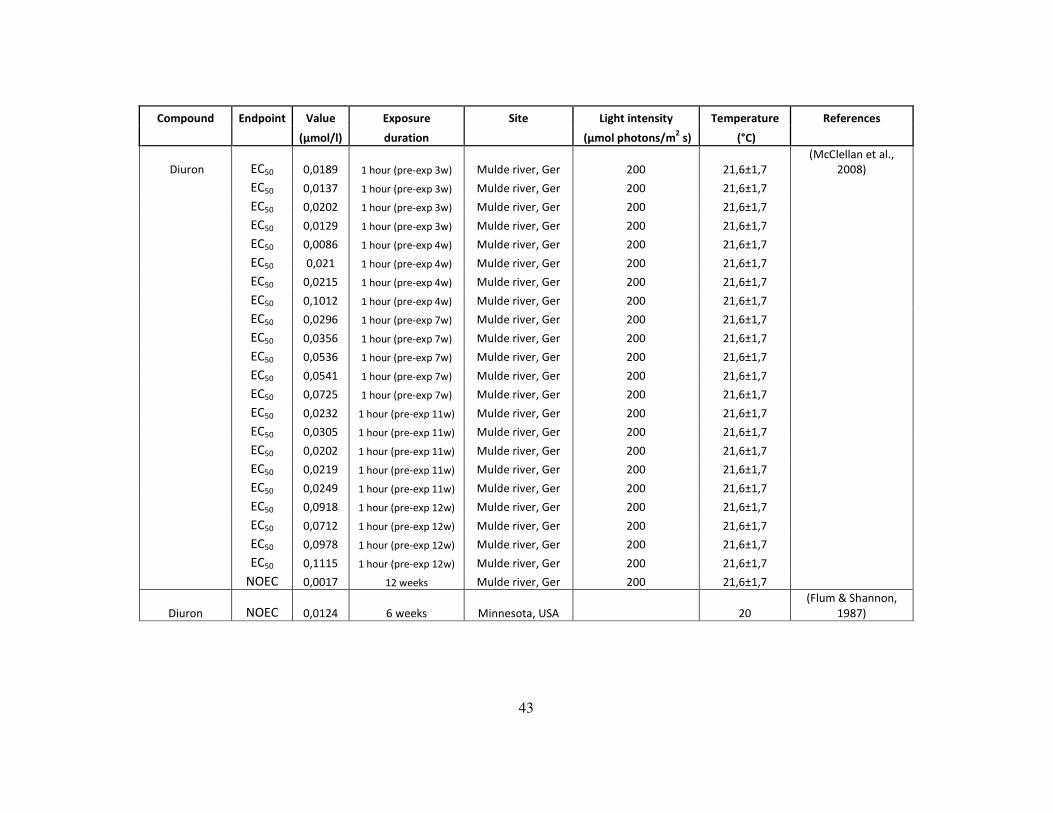
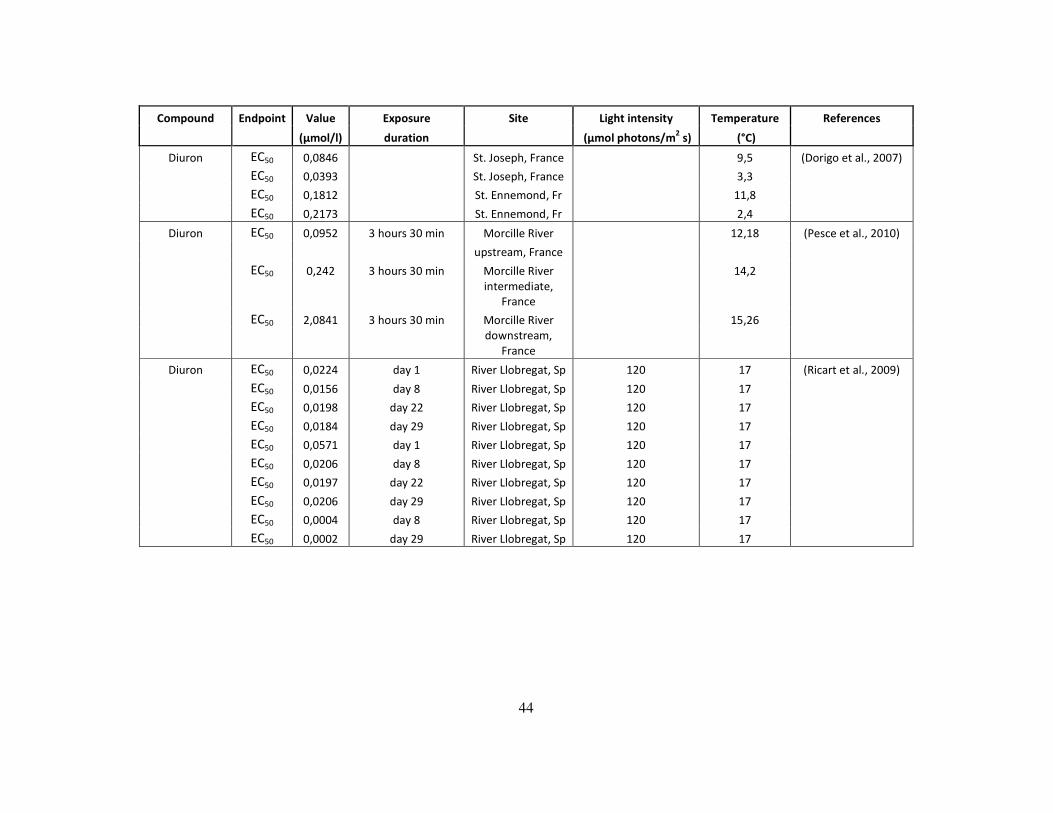
The articles in this literature review had used microcosms, mesocosms or sampled natural periphyton on discs to analyze the toxicity for one or more PS II inhibitors. The effect data together with environmental factors from the articles were compiled in a table in excel (full table not shown, appendix A contain the information used in results). Factors accounted for were:
• Compounds name • Endpoint (EC50 or NOEC) • Measured parameter • Value (µmol/l) • Exposure duration • Site • Date
10
• Light:Dark regime • Light intensity (µmol/m2 s) • Biomass (Chlorophyll-a) • Temperature (°C) • Nutrient content (P and N) • DOC content • DO and O2 • Conductivity • Alkalinity • pH • Reference
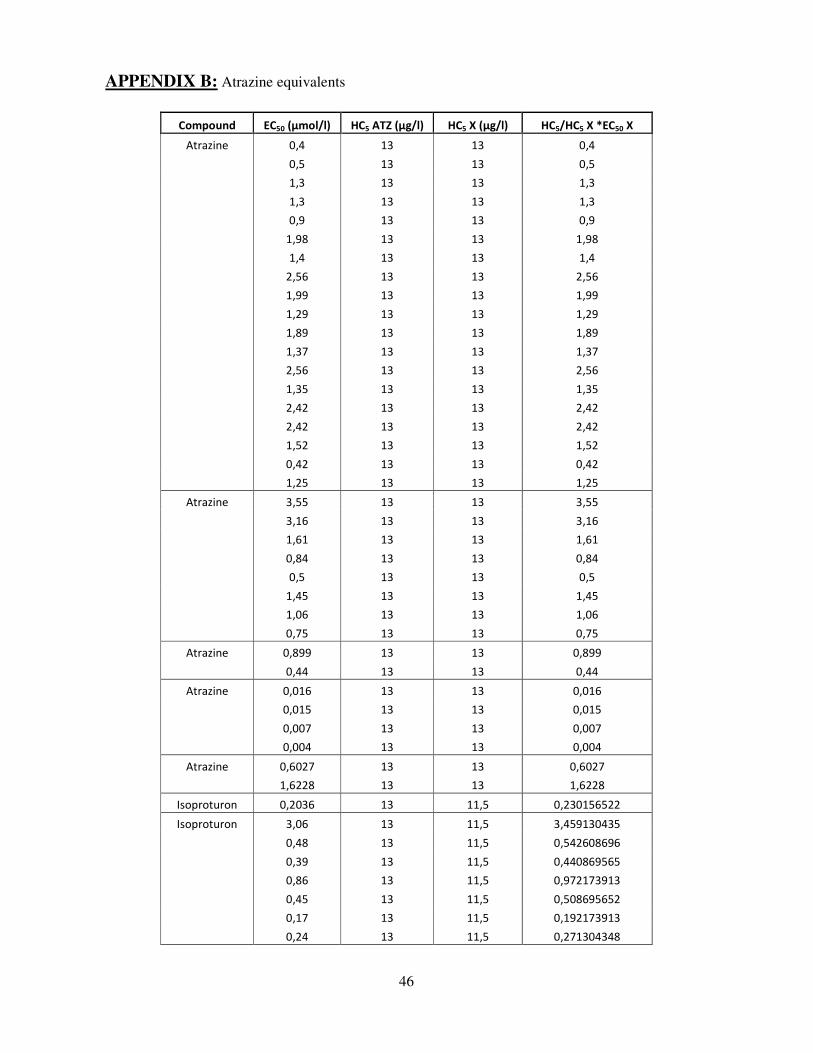
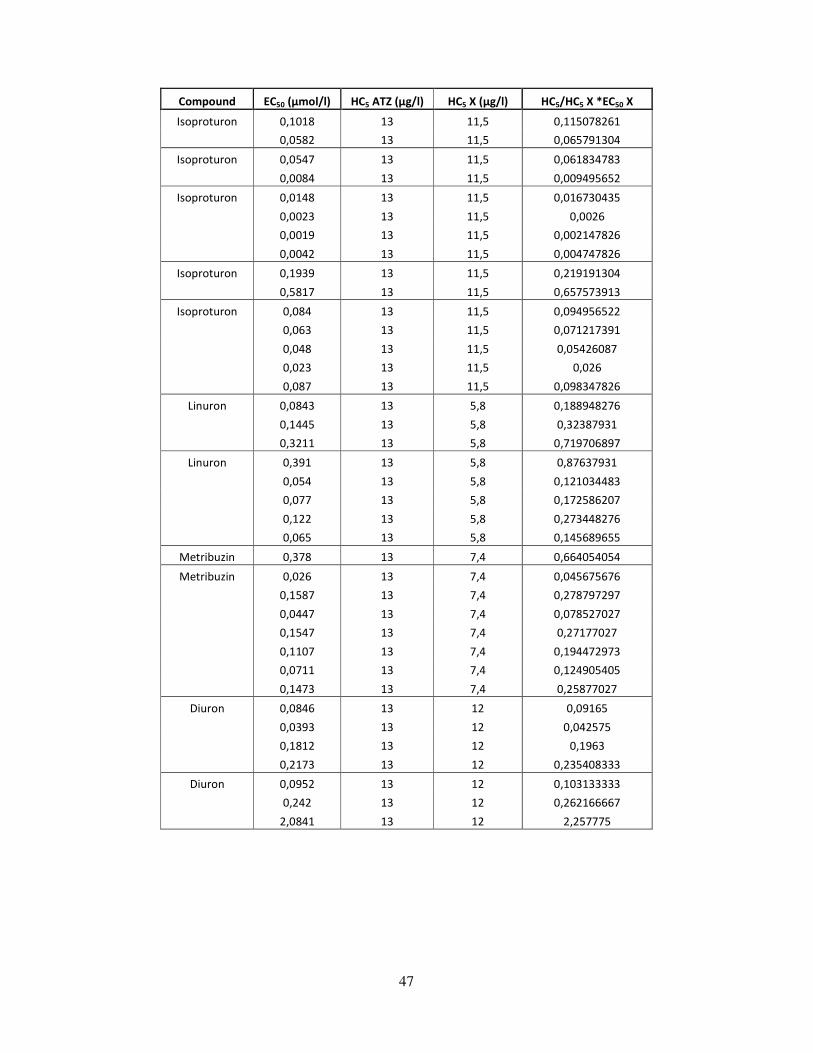
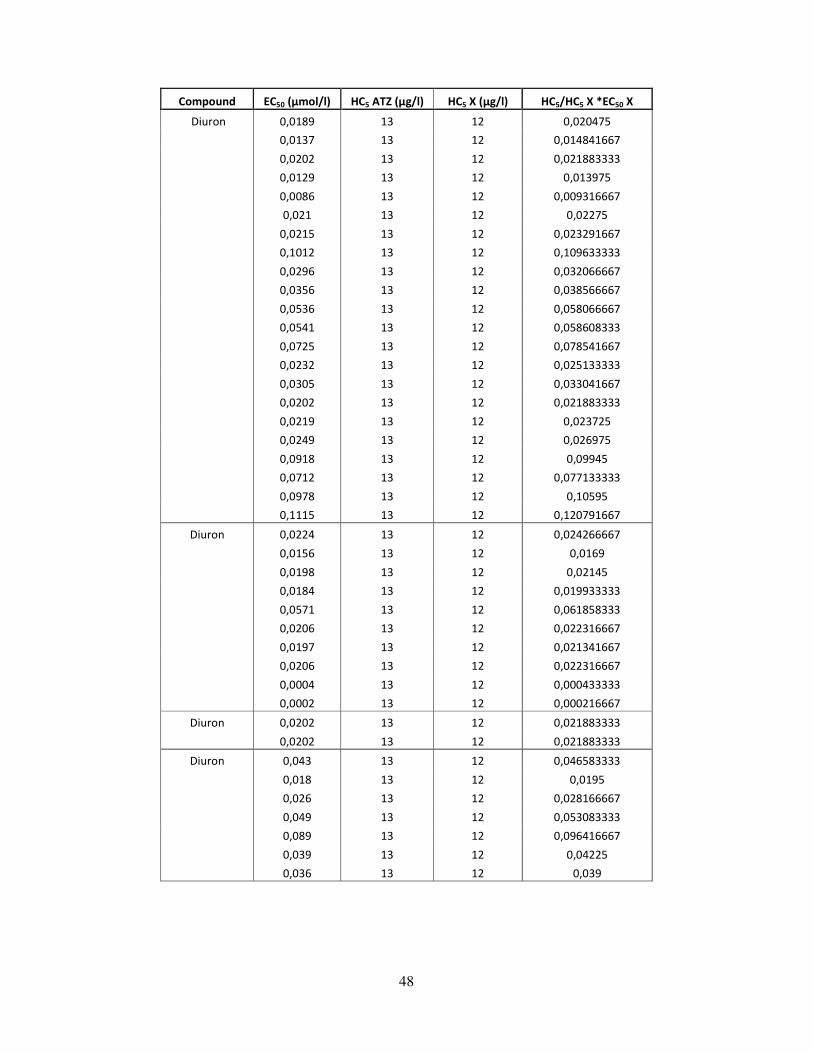
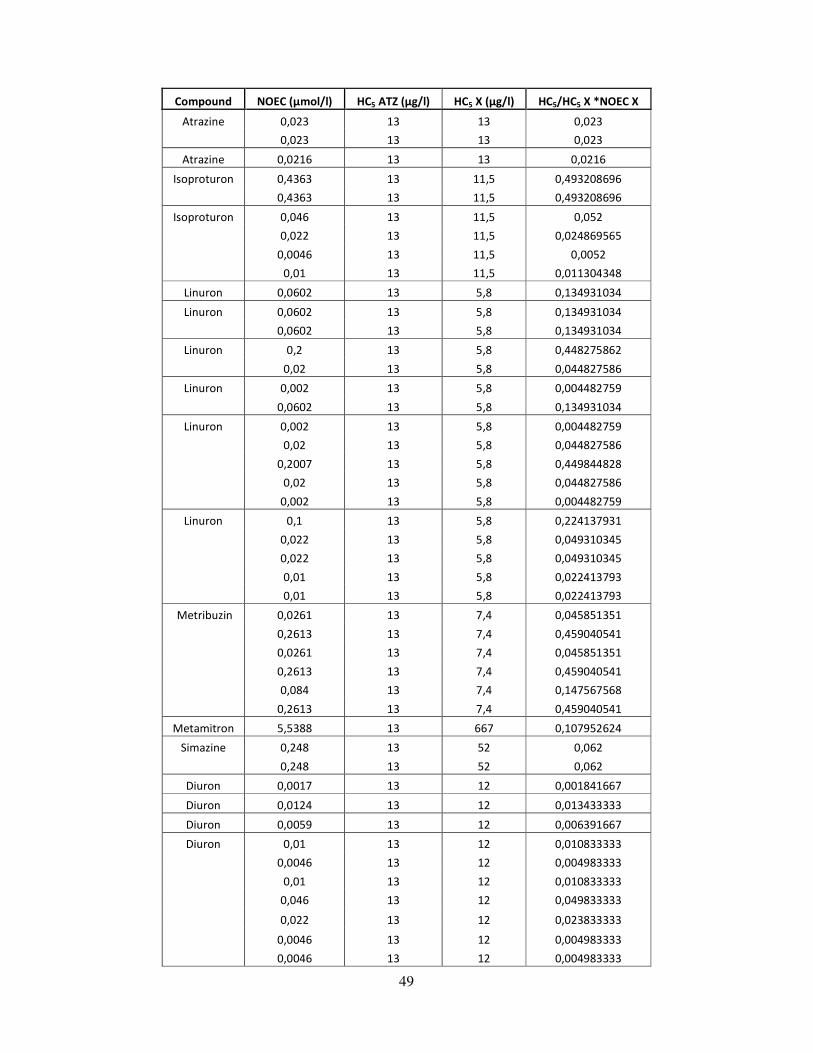
All of EC50 (Effect Concentration 50%) values for each compound were combined in a graph. The differences between the EC50 minimum and maximum for the respective PS II inhibitors were compiled in a table together with mean values ± standard deviation (SD), whereupon another graph was made for all the compounds that had effect data. Additionally a third graph explains the order from the most toxic to the least toxic PS II inhibitor based on their mean EC50 values. The EC50 and NOEC values from individual studies for 7 PS II inhibitors (atrazine, diuron, isoproturon, linuron, metamitron, metribuzin and simazine) were recalculated into corresponding EC50 and NOEC values for atrazine, assuming atrazine was the only PS II inhibitor. These atrazine (ATZ) equivalents were calculated using HC5 (Hazard Concentration 5%) values (Eq. 1) and the reason behind using ATZ equivalents instead of the individual effect data was the few field toxicity data available for PS II inhibitors. The ATZ equivalents were then compared with three factors (temperature, light intensity and exposure duration) which are presented as graphs. These factors were best suitable for comparison as there were a fairly large number of studies declaring these factors, which was required for the comparison. Hence, all environmental factors could not be compared to the ATZ equivalents. Equation 1.
EC50 X ATZ equivalent = HC5 ATZ / HC5 X * EC50 X
X = PS II inhibitor It was the same process for the determination of NOEC (No Observed Effect Concentration) values and the calculation of ATZ equivalents (Eq. 2). Equation 2.
NOEC X ATZ equivalent = HC5 ATZ / HC5 X * NOEC X
X = PS II inhibitor
2.4 Legal status of the PS II inhibitors
Information about the legal status of the compounds was collected from Regulation (EC) No 1107/2009 amending Directive 91/414/EEC Annex I (EU) and from U.S EPA, Substance Registry
11
Services (USA).
• European Union, 2008 (EU) • U.S. Environmental protection agency, 2012 (USA)
Information about EQS was collected from Directive 2008/105/EC of the European Parliament and of the Council on environmentally quality standards in the field of water policy amending directive 2000/60/EC of the European Parliament and of the Council establishing a framework for Community action in the field of water policy together with the revised list of priority substances from 2012 (COM(2011)876).
2.5 Environmental concentrations
Finding environmental concentrations of the PS II inhibitors was solely based on the articles in this literature review. Information from other sources was only discussed.
3. RESULTS
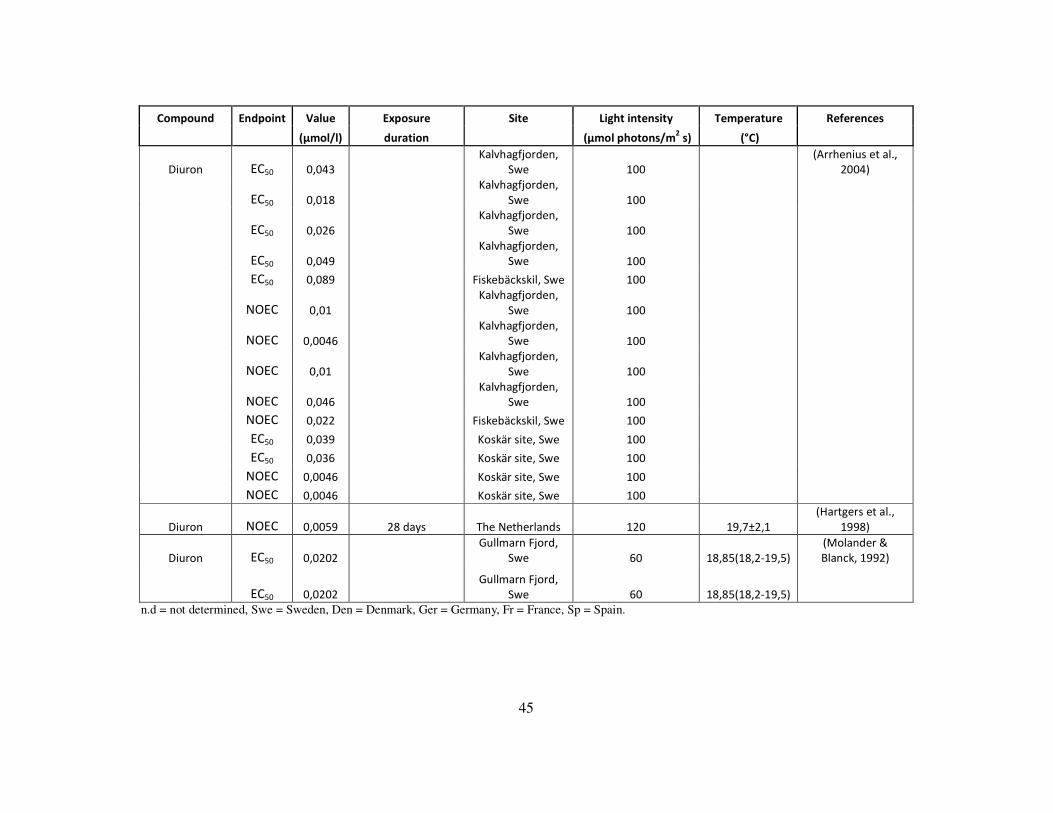
The results are based on effect data from the literature search for each compound. For the full reference list on results, see appendix A.
3.1 EC50 data
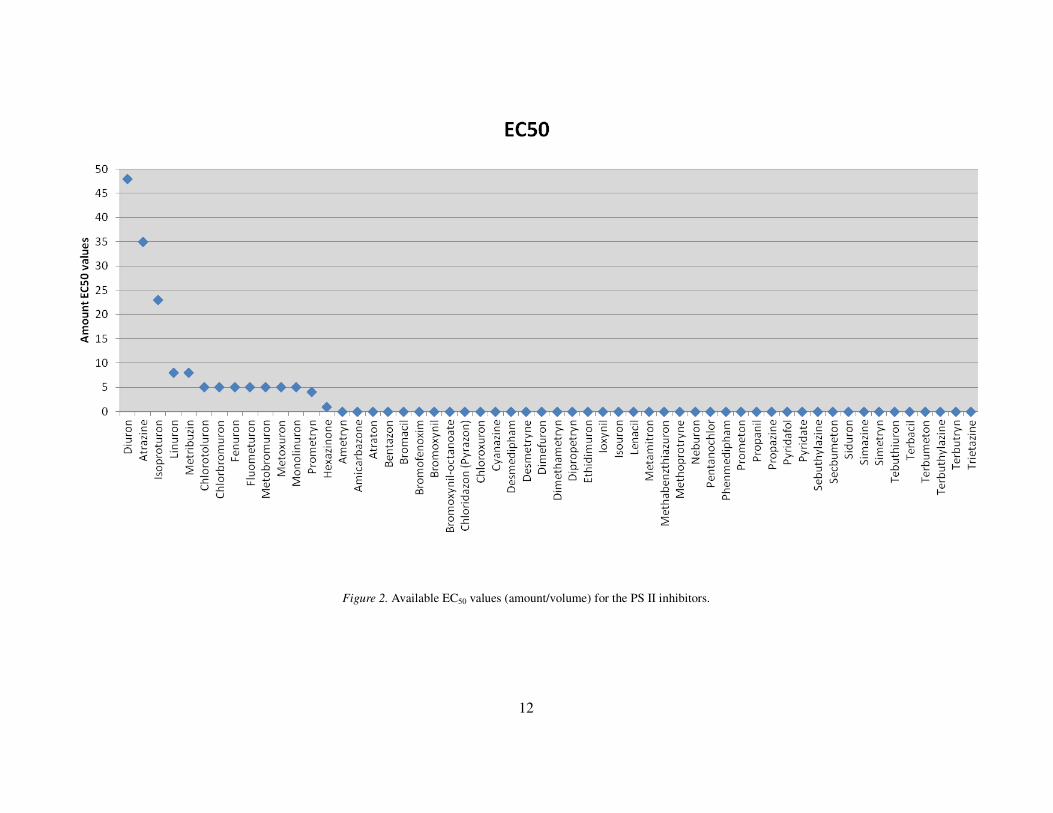
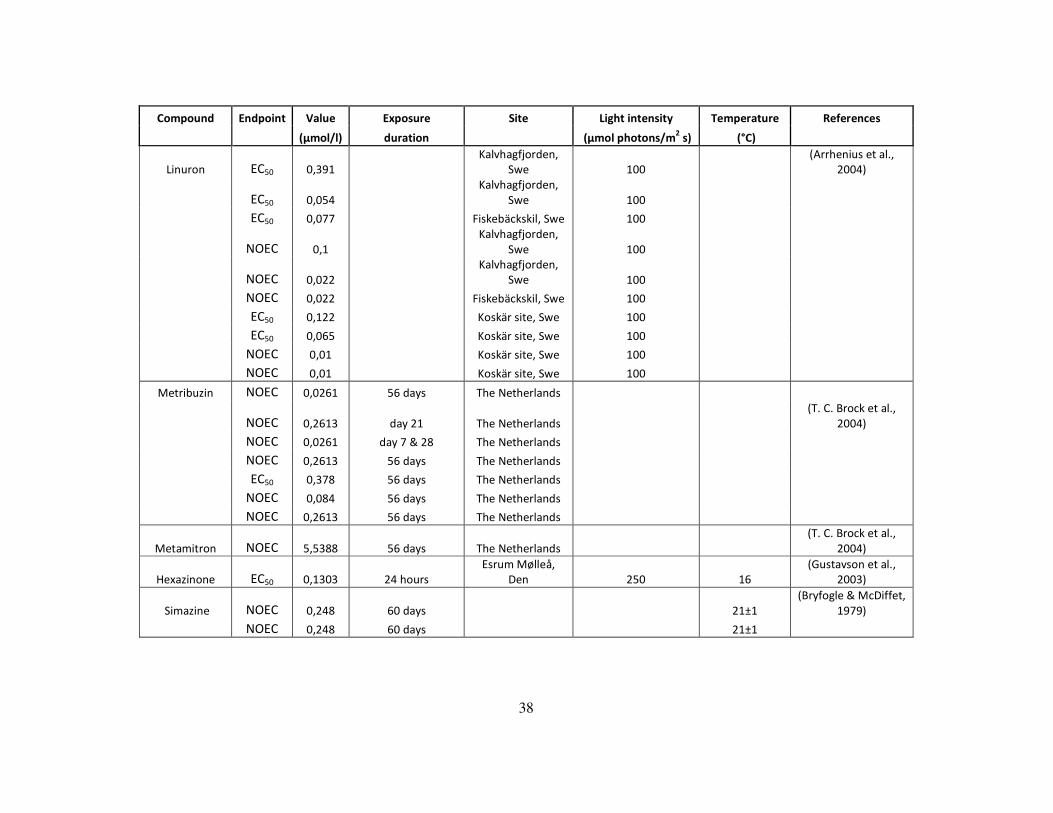
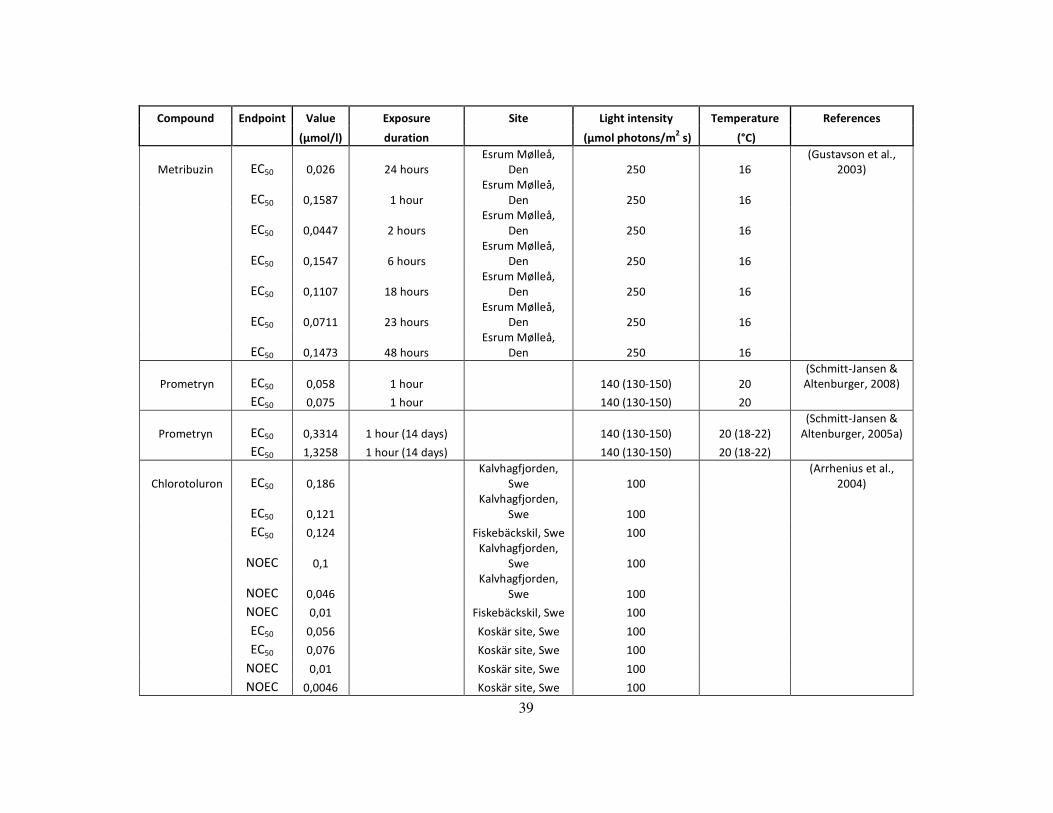
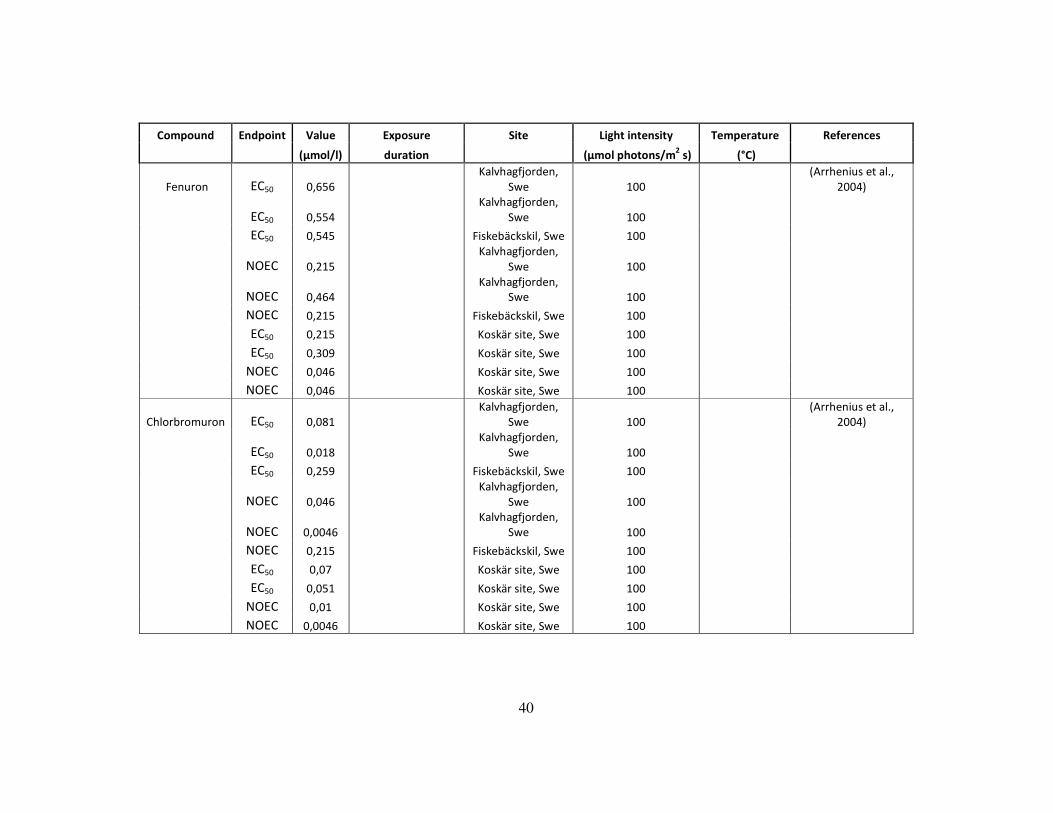
Effect data from microcosm/mesocosm or field studies on community level for primary producers were found for 14 out of the 56 PS II inhibitors investigated. These were atrazine, chlorbromuron, chlorotoluron, diuron, fenuron, fluometuron, hexazinone, isoproturon, linuron, metobromuron, metoxuron, metribuzin, monolinuron and prometryn (Fig. 2). The remaining 42 compounds lacked field toxicity data. The amount of EC50 values and number of studies differed between the compounds. Diuron had the greatest number with 48 EC50 values, second was atrazine with 35 and third was isoproturon with 23; these were the only PS II inhibitors having a substantial amount of EC50 data. Eight values were found for linuron and metribuzin. Chlorotoluron, chlorbromuron, fenuron, fluometuron, metobromuron, metoxuron, monolinuron had five and prometryn had four EC50 values. One EC50 value was found for hexazinone. For the remaining 42 compounds, no effect data on community level was found. The EC50 values for the compounds presented here were studies performed throughout Europe (Sweden, Denmark, Germany, The Netherlands, France and Spain). EC50 data for primary producers on a community level were not available from tropical zones. Although, some data were from unknown sites.
12
Figure 2. Available EC50 values (amount/volume) for the PS II inhibitors.
13
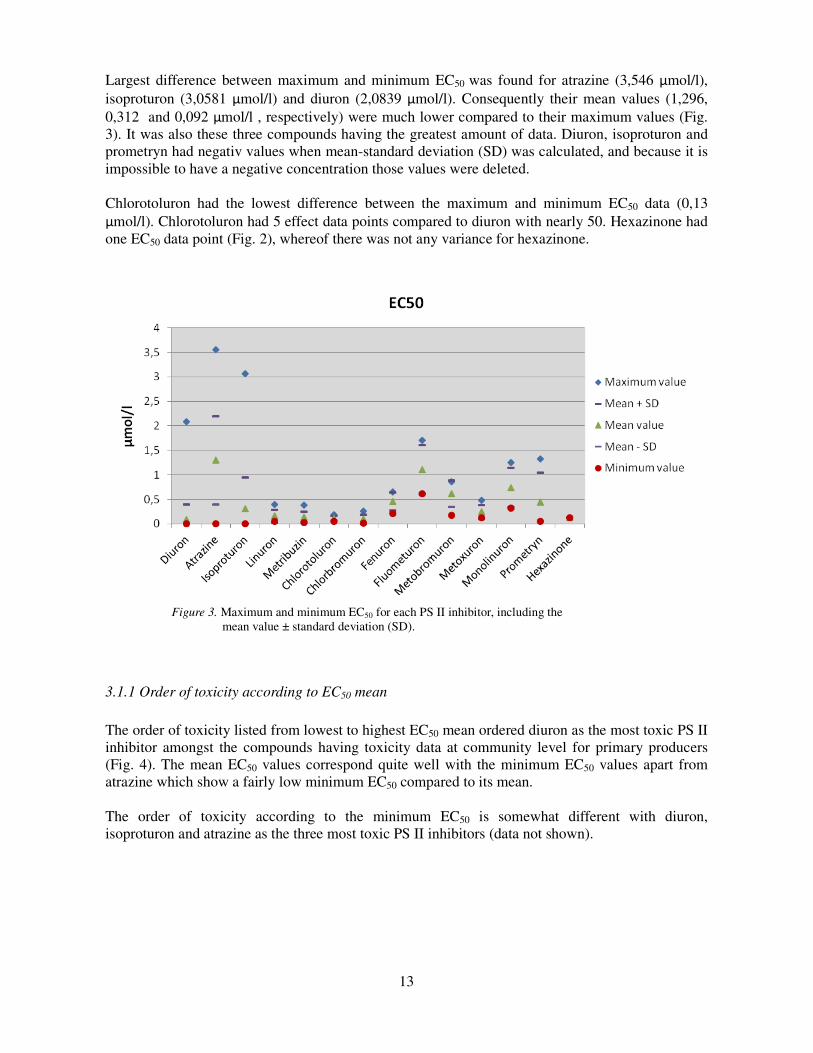
Largest difference between maximum and minimum EC50 was found for atrazine (3,546 µmol/l), isoproturon (3,0581 µmol/l) and diuron (2,0839 µmol/l). Consequently their mean values (1,296, 0,312 and 0,092 µmol/l , respectively) were much lower compared to their maximum values (Fig. 3). It was also these three compounds having the greatest amount of data. Diuron, isoproturon and prometryn had negativ values when mean-standard deviation (SD) was calculated, and because it is impossible to have a negative concentration those values were deleted. Chlorotoluron had the lowest difference between the maximum and minimum EC50 data (0,13 µmol/l). Chlorotoluron had 5 effect data points compared to diuron with nearly 50. Hexazinone had one EC50 data point (Fig. 2), whereof there was not any variance for hexazinone.
Figure 3. Maximum and minimum EC50 for each PS II inhibitor, including the
mean value ± standard deviation (SD).
3.1.1 Order of toxicity according to EC50 mean
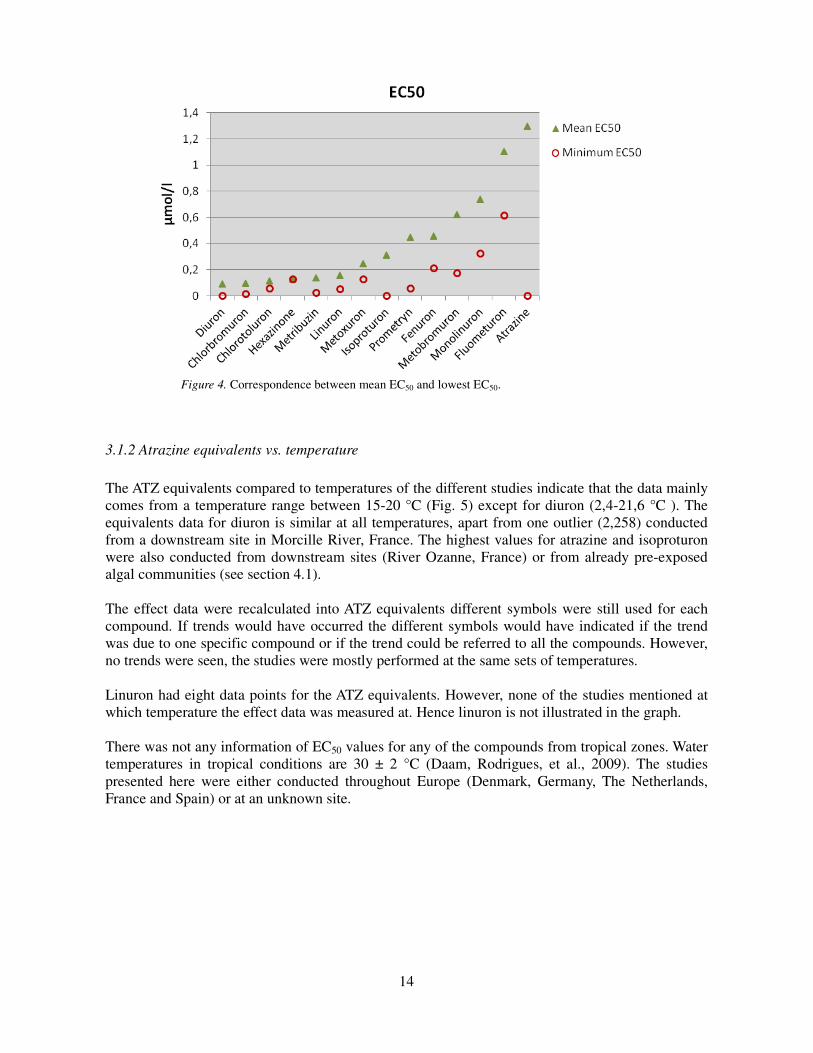
The order of toxicity listed from lowest to highest EC50 mean ordered diuron as the most toxic PS II inhibitor amongst the compounds having toxicity data at community level for primary producers (Fig. 4). The mean EC50 values correspond quite well with the minimum EC50 values apart from atrazine which show a fairly low minimum EC50 compared to its mean. The order of toxicity according to the minimum EC50 is somewhat different with diuron, isoproturon and atrazine as the three most toxic PS II inhibitors (data not shown).
14
Figure 4. Correspondence between mean EC50 and lowest EC50.
3.1.2 Atrazine equivalents vs. temperature
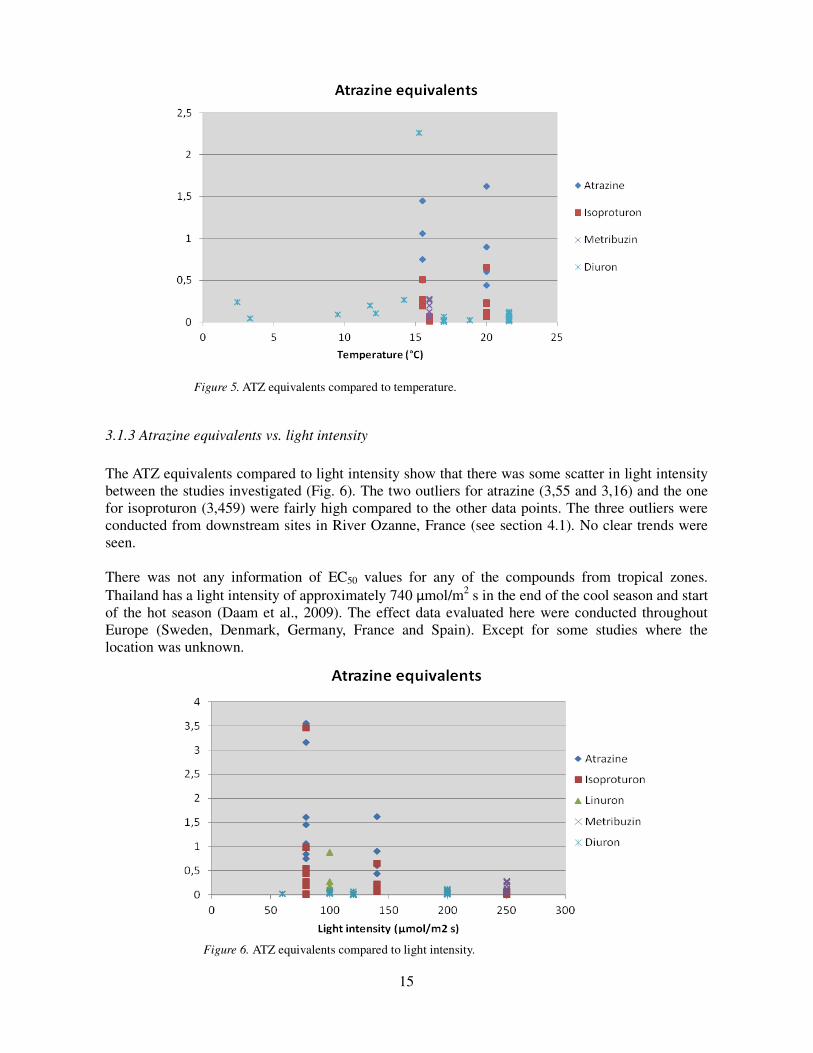
The ATZ equivalents compared to temperatures of the different studies indicate that the data mainly comes from a temperature range between 15-20 °C (Fig. 5) except for diuron (2,4-21,6 °C ). The equivalents data for diuron is similar at all temperatures, apart from one outlier (2,258) conducted from a downstream site in Morcille River, France. The highest values for atrazine and isoproturon were also conducted from downstream sites (River Ozanne, France) or from already pre-exposed algal communities (see section 4.1). The effect data were recalculated into ATZ equivalents different symbols were still used for each compound. If trends would have occurred the different symbols would have indicated if the trend was due to one specific compound or if the trend could be referred to all the compounds. However, no trends were seen, the studies were mostly performed at the same sets of temperatures. Linuron had eight data points for the ATZ equivalents. However, none of the studies mentioned at which temperature the effect data was measured at. Hence linuron is not illustrated in the graph. There was not any information of EC50 values for any of the compounds from tropical zones. Water temperatures in tropical conditions are 30 ± 2 °C (Daam, Rodrigues, et al., 2009). The studies presented here were either conducted throughout Europe (Denmark, Germany, The Netherlands, France and Spain) or at an unknown site.
15
Figure 5. ATZ equivalents compared to temperature.
3.1.3 Atrazine equivalents vs. light intensity
The ATZ equivalents compared to light intensity show that there was some scatter in light intensity between the studies investigated (Fig. 6). The two outliers for atrazine (3,55 and 3,16) and the one for isoproturon (3,459) were fairly high compared to the other data points. The three outliers were conducted from downstream sites in River Ozanne, France (see section 4.1). No clear trends were seen. There was not any information of EC50 values for any of the compounds from tropical zones. Thailand has a light intensity of approximately 740 µmol/m2 s in the end of the cool season and start of the hot season (Daam et al., 2009). The effect data evaluated here were conducted throughout Europe (Sweden, Denmark, Germany, France and Spain). Except for some studies where the location was unknown.
Figure 6. ATZ equivalents compared to light intensity.
16
3.1.4 Atrazine equivalents vs. exposure duration
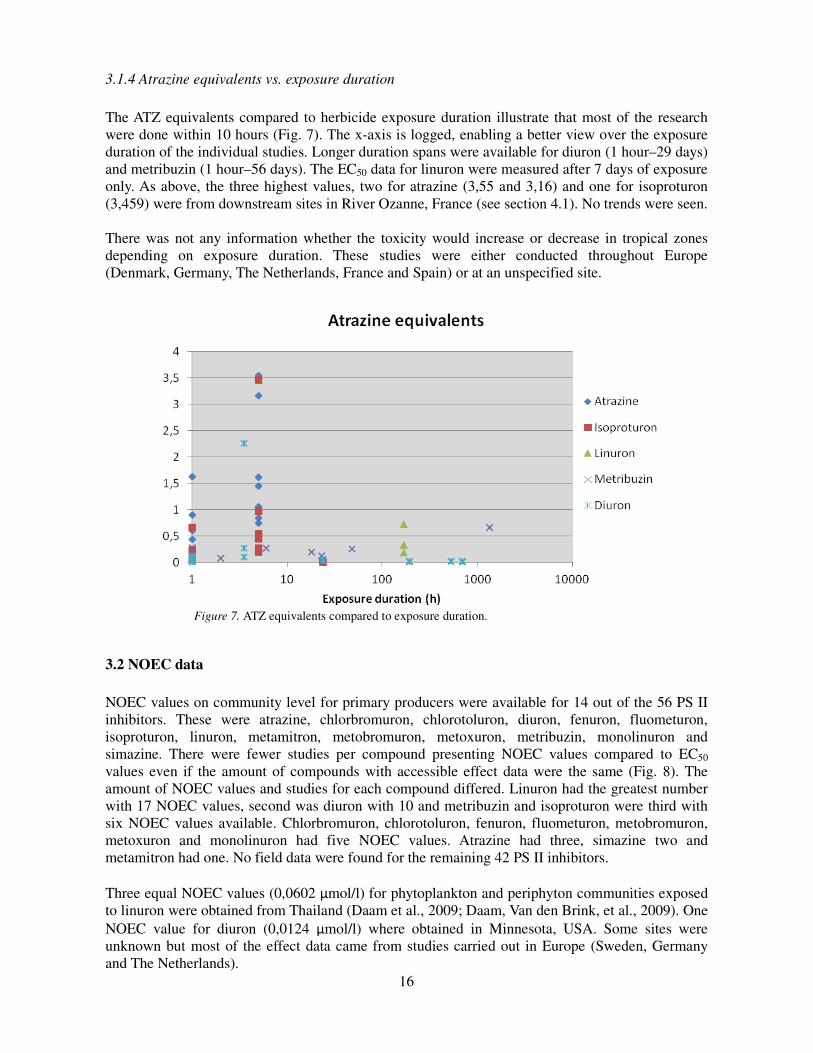
The ATZ equivalents compared to herbicide exposure duration illustrate that most of the research were done within 10 hours (Fig. 7). The x-axis is logged, enabling a better view over the exposure duration of the individual studies. Longer duration spans were available for diuron (1 hour–29 days) and metribuzin (1 hour–56 days). The EC50 data for linuron were measured after 7 days of exposure only. As above, the three highest values, two for atrazine (3,55 and 3,16) and one for isoproturon (3,459) were from downstream sites in River Ozanne, France (see section 4.1). No trends were seen.
There was not any information whether the toxicity would increase or decrease in tropical zones depending on exposure duration. These studies were either conducted throughout Europe (Denmark, Germany, The Netherlands, France and Spain) or at an unspecified site.
Figure 7. ATZ equivalents compared to exposure duration.
3.2 NOEC data
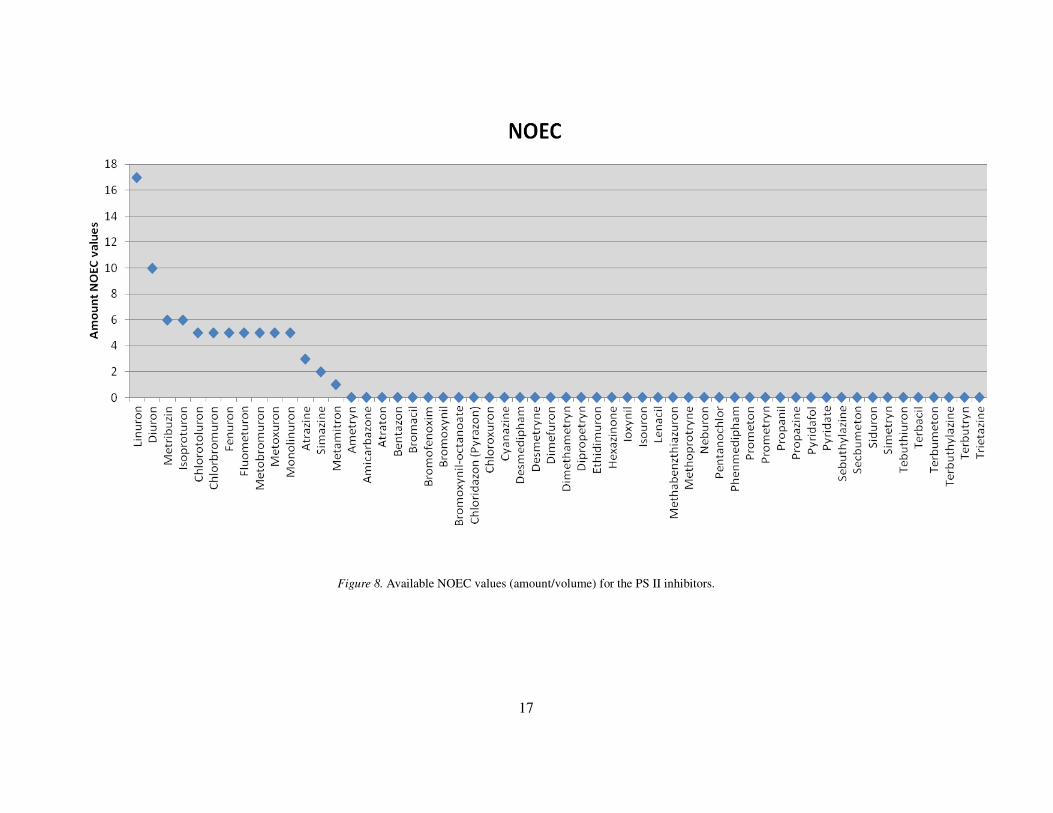
NOEC values on community level for primary producers were available for 14 out of the 56 PS II inhibitors. These were atrazine, chlorbromuron, chlorotoluron, diuron, fenuron, fluometuron, isoproturon, linuron, metamitron, metobromuron, metoxuron, metribuzin, monolinuron and simazine. There were fewer studies per compound presenting NOEC values compared to EC50 values even if the amount of compounds with accessible effect data were the same (Fig. 8). The amount of NOEC values and studies for each compound differed. Linuron had the greatest number with 17 NOEC values, second was diuron with 10 and metribuzin and isoproturon were third with six NOEC values available. Chlorbromuron, chlorotoluron, fenuron, fluometuron, metobromuron, metoxuron and monolinuron had five NOEC values. Atrazine had three, simazine two and metamitron had one. No field data were found for the remaining 42 PS II inhibitors. Three equal NOEC values (0,0602 µmol/l) for phytoplankton and periphyton communities exposed to linuron were obtained from Thailand (Daam et al., 2009; Daam, Van den Brink, et al., 2009). One NOEC value for diuron (0,0124 µmol/l) where obtained in Minnesota, USA. Some sites were unknown but most of the effect data came from studies carried out in Europe (Sweden, Germany and The Netherlands).
17
Figure 8. Available NOEC values (amount/volume) for the PS II inhibitors.
18
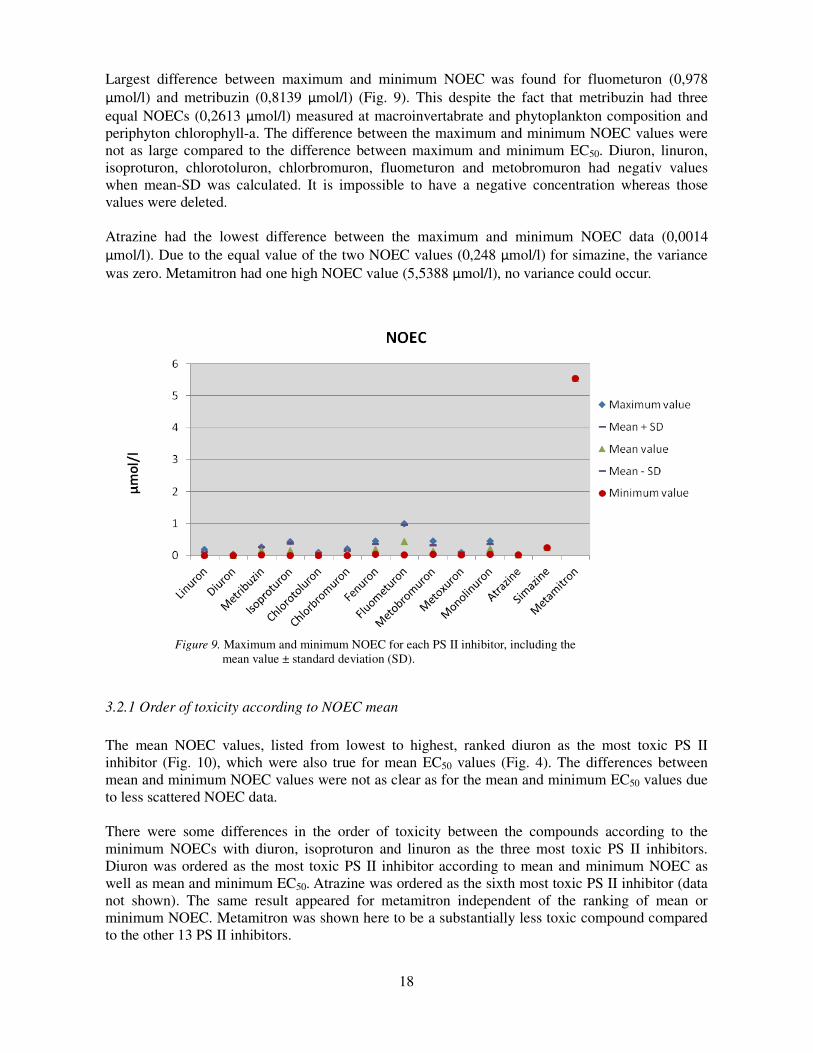
Largest difference between maximum and minimum NOEC was found for fluometuron (0,978 µmol/l) and metribuzin (0,8139 µmol/l) (Fig. 9). This despite the fact that metribuzin had three equal NOECs (0,2613 µmol/l) measured at macroinvertabrate and phytoplankton composition and periphyton chlorophyll-a. The difference between the maximum and minimum NOEC values were not as large compared to the difference between maximum and minimum EC50. Diuron, linuron, isoproturon, chlorotoluron, chlorbromuron, fluometuron and metobromuron had negativ values when mean-SD was calculated. It is impossible to have a negative concentration whereas those values were deleted. Atrazine had the lowest difference between the maximum and minimum NOEC data (0,0014 µmol/l). Due to the equal value of the two NOEC values (0,248 µmol/l) for simazine, the variance was zero. Metamitron had one high NOEC value (5,5388 µmol/l), no variance could occur.
Figure 9. Maximum and minimum NOEC for each PS II inhibitor, including the
mean value ± standard deviation (SD).
3.2.1 Order of toxicity according to NOEC mean
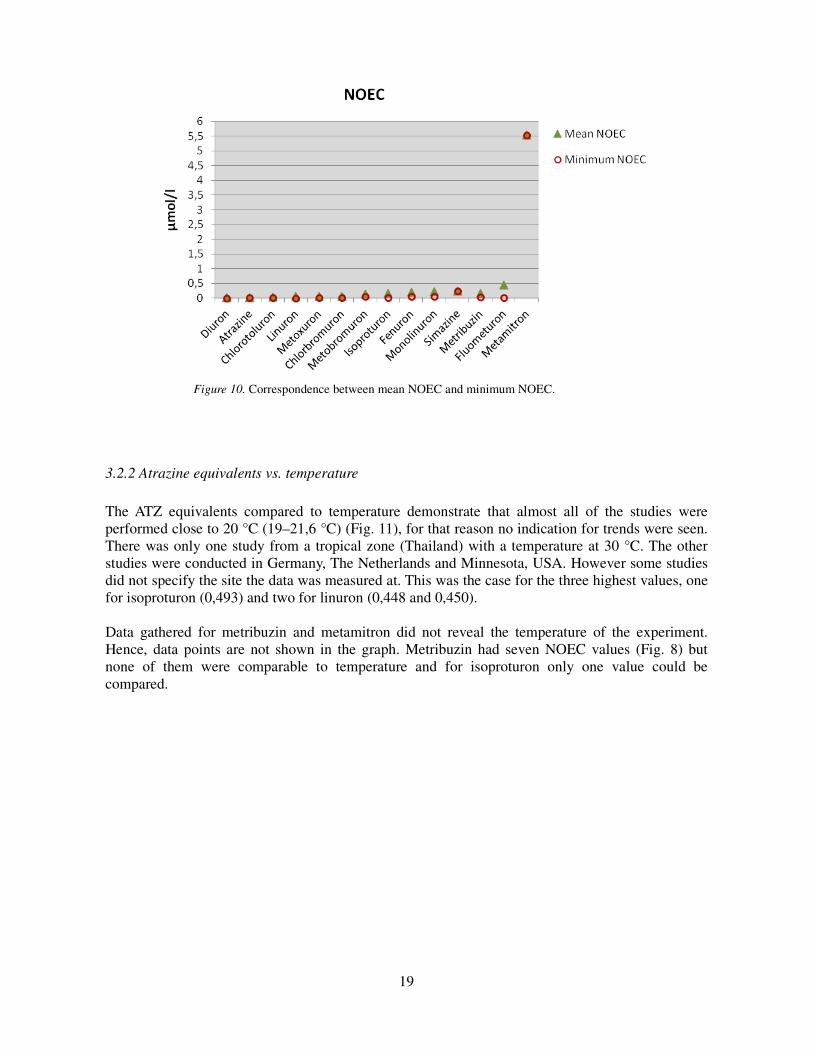
The mean NOEC values, listed from lowest to highest, ranked diuron as the most toxic PS II inhibitor (Fig. 10), which were also true for mean EC50 values (Fig. 4). The differences between mean and minimum NOEC values were not as clear as for the mean and minimum EC50 values due to less scattered NOEC data. There were some differences in the order of toxicity between the compounds according to the minimum NOECs with diuron, isoproturon and linuron as the three most toxic PS II inhibitors. Diuron was ordered as the most toxic PS II inhibitor according to mean and minimum NOEC as well as mean and minimum EC50. Atrazine was ordered as the sixth most toxic PS II inhibitor (data not shown). The same result appeared for metamitron independent of the ranking of mean or minimum NOEC. Metamitron was shown here to be a substantially less toxic compound compared to the other 13 PS II inhibitors.
19
Figure 10. Correspondence between mean NOEC and minimum NOEC.
3.2.2 Atrazine equivalents vs. temperature
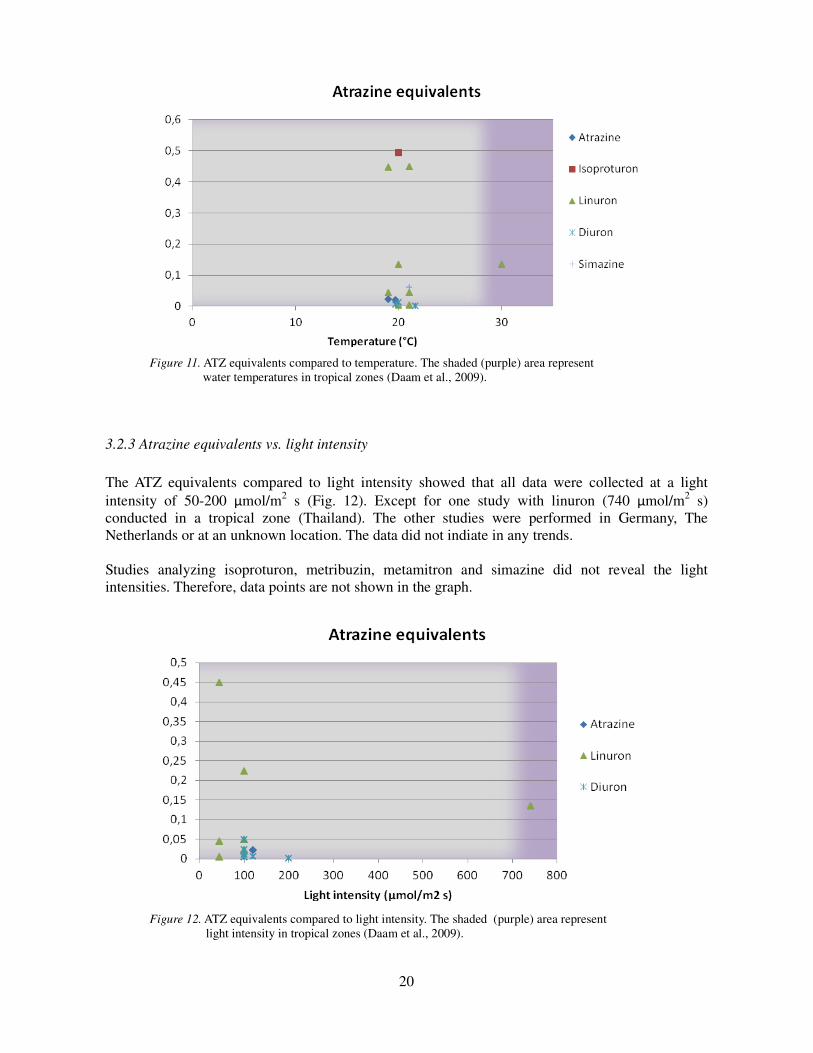
The ATZ equivalents compared to temperature demonstrate that almost all of the studies were performed close to 20 °C (19–21,6 °C) (Fig. 11), for that reason no indication for trends were seen. There was only one study from a tropical zone (Thailand) with a temperature at 30 °C. The other studies were conducted in Germany, The Netherlands and Minnesota, USA. However some studies did not specify the site the data was measured at. This was the case for the three highest values, one for isoproturon (0,493) and two for linuron (0,448 and 0,450). Data gathered for metribuzin and metamitron did not reveal the temperature of the experiment. Hence, data points are not shown in the graph. Metribuzin had seven NOEC values (Fig. 8) but none of them were comparable to temperature and for isoproturon only one value could be compared.
20
Figure 11. ATZ equivalents compared to temperature. The shaded (purple) area represent water temperatures in tropical zones (Daam et al., 2009).
3.2.3 Atrazine equivalents vs. light intensity
The ATZ equivalents compared to light intensity showed that all data were collected at a light intensity of 50-200 µmol/m2 s (Fig. 12). Except for one study with linuron (740 µmol/m2 s) conducted in a tropical zone (Thailand). The other studies were performed in Germany, The Netherlands or at an unknown location. The data did not indiate in any trends. Studies analyzing isoproturon, metribuzin, metamitron and simazine did not reveal the light intensities. Therefore, data points are not shown in the graph.
Figure 12. ATZ equivalents compared to light intensity. The shaded (purple) area represent light intensity in tropical zones (Daam et al., 2009).
21
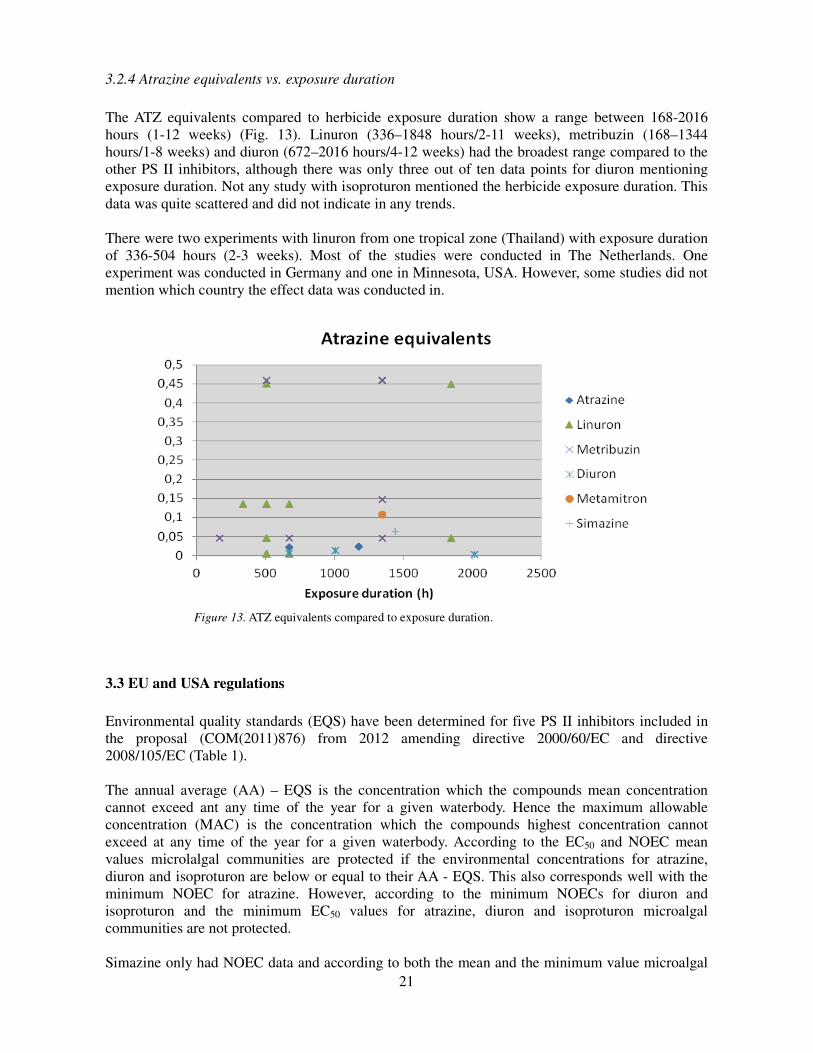
3.2.4 Atrazine equivalents vs. exposure duration
The ATZ equivalents compared to herbicide exposure duration show a range between 168-2016 hours (1-12 weeks) (Fig. 13). Linuron (336–1848 hours/2-11 weeks), metribuzin (168–1344 hours/1-8 weeks) and diuron (672–2016 hours/4-12 weeks) had the broadest range compared to the other PS II inhibitors, although there was only three out of ten data points for diuron mentioning exposure duration. Not any study with isoproturon mentioned the herbicide exposure duration. This data was quite scattered and did not indicate in any trends.
There were two experiments with linuron from one tropical zone (Thailand) with exposure duration of 336-504 hours (2-3 weeks). Most of the studies were conducted in The Netherlands. One experiment was conducted in Germany and one in Minnesota, USA. However, some studies did not mention which country the effect data was conducted in.
Figure 13. ATZ equivalents compared to exposure duration.
3.3 EU and USA regulations
Environmental quality standards (EQS) have been determined for five PS II inhibitors included in the proposal (COM(2011)876) from 2012 amending directive 2000/60/EC and directive 2008/105/EC (Table 1). The annual average (AA) – EQS is the concentration which the compounds mean concentration cannot exceed ant any time of the year for a given waterbody. Hence the maximum allowable concentration (MAC) is the concentration which the compounds highest concentration cannot exceed at any time of the year for a given waterbody. According to the EC50 and NOEC mean values microlalgal communities are protected if the environmental concentrations for atrazine, diuron and isoproturon are below or equal to their AA - EQS. This also corresponds well with the minimum NOEC for atrazine. However, according to the minimum NOECs for diuron and isoproturon and the minimum EC50 values for atrazine, diuron and isoproturon microalgal communities are not protected. Simazine only had NOEC data and according to both the mean and the minimum value microalgal
22
communities are protected if the environmental concentration are below or equal to AA - EQS. No data on community level were found for terbutryn.
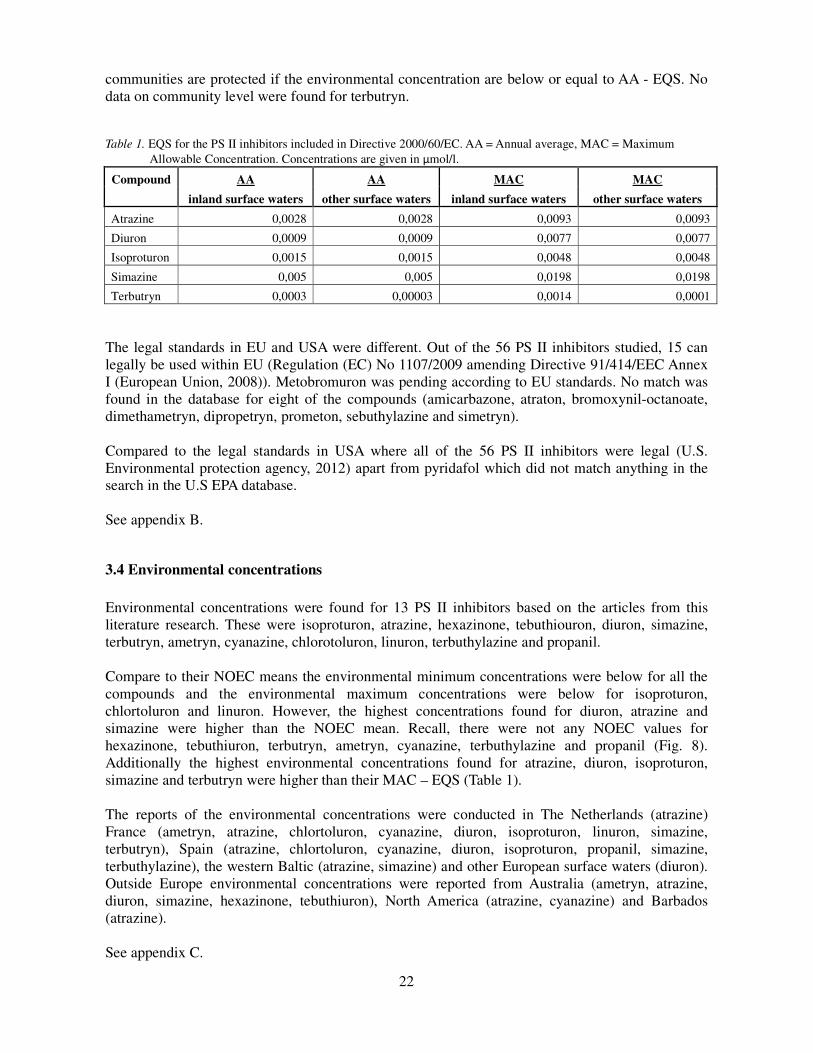
Table 1. EQS for the PS II inhibitors included in Directive 2000/60/EC. AA = Annual average, MAC = Maximum Allowable Concentration. Concentrations are given in µmol/l.
Compound AA AA MAC MAC
inland surface waters other surface waters inland surface waters other surface waters
Atrazine 0,0028 0,0028 0,0093 0,0093
Diuron 0,0009 0,0009 0,0077 0,0077
Isoproturon 0,0015 0,0015 0,0048 0,0048
Simazine 0,005 0,005 0,0198 0,0198
Terbutryn 0,0003 0,00003 0,0014 0,0001
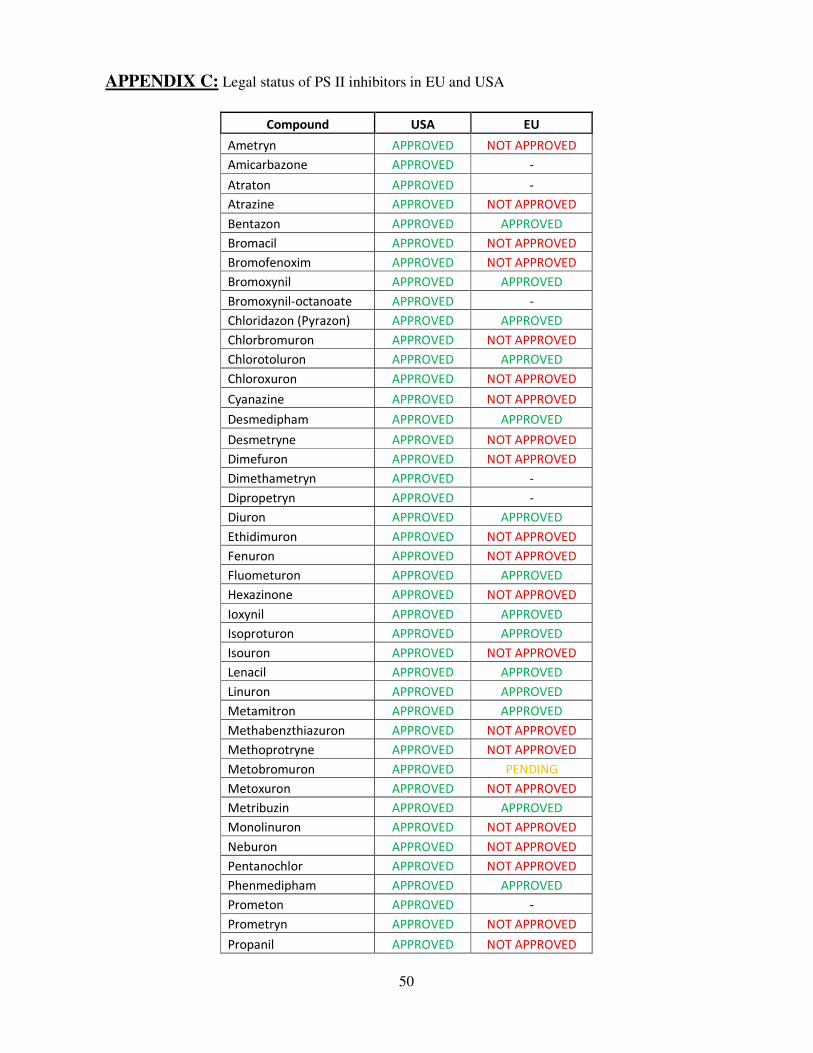
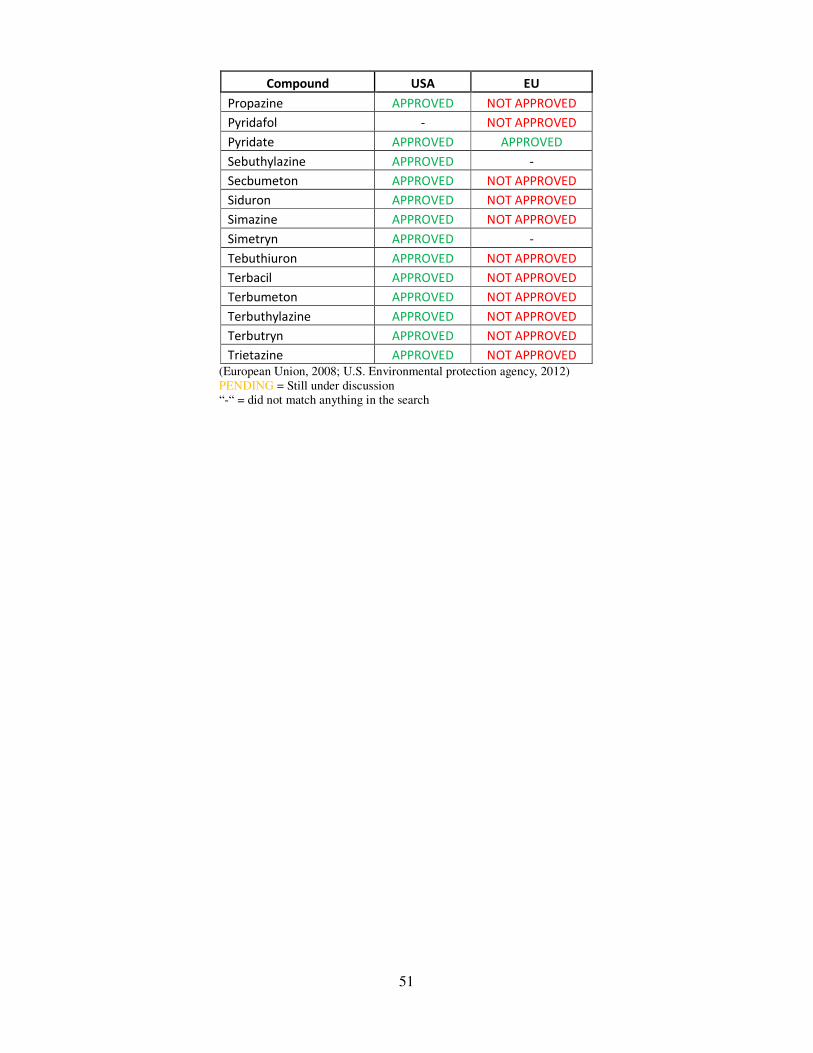
The legal standards in EU and USA were different. Out of the 56 PS II inhibitors studied, 15 can legally be used within EU (Regulation (EC) No 1107/2009 amending Directive 91/414/EEC Annex I (European Union, 2008)). Metobromuron was pending according to EU standards. No match was found in the database for eight of the compounds (amicarbazone, atraton, bromoxynil-octanoate, dimethametryn, dipropetryn, prometon, sebuthylazine and simetryn). Compared to the legal standards in USA where all of the 56 PS II inhibitors were legal (U.S. Environmental protection agency, 2012) apart from pyridafol which did not match anything in the search in the U.S EPA database. See appendix B.
3.4 Environmental concentrations
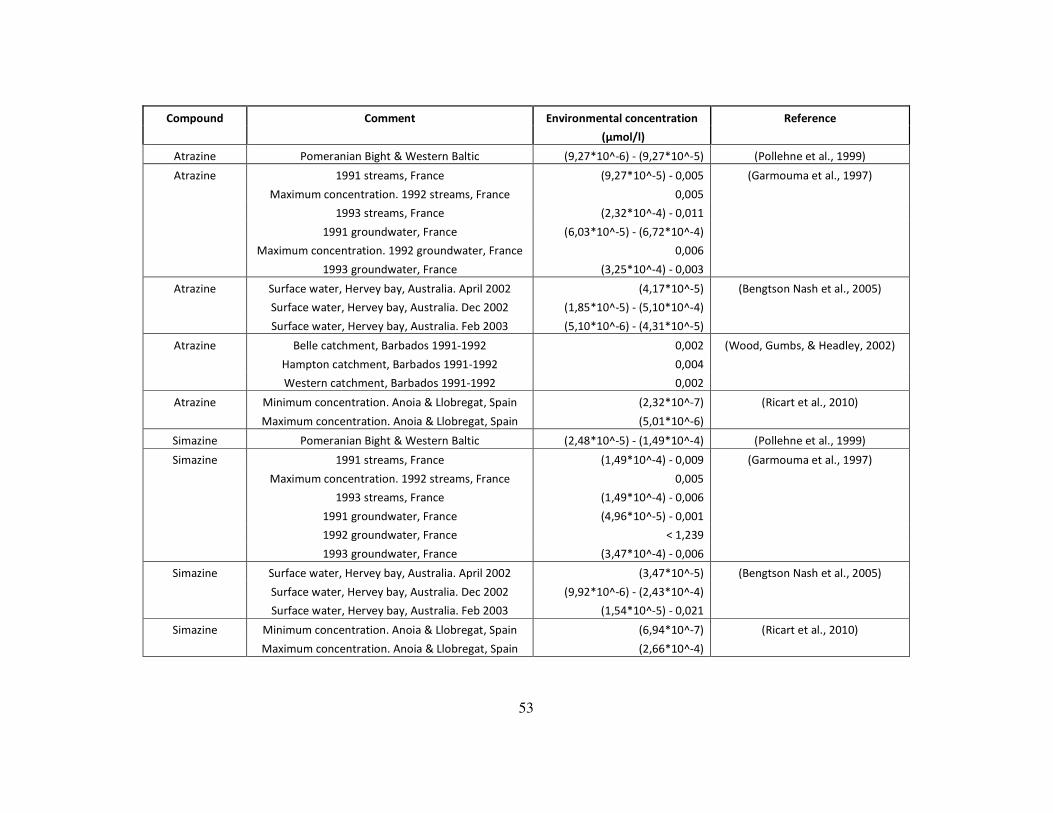
Environmental concentrations were found for 13 PS II inhibitors based on the articles from this literature research. These were isoproturon, atrazine, hexazinone, tebuthiouron, diuron, simazine, terbutryn, ametryn, cyanazine, chlorotoluron, linuron, terbuthylazine and propanil. Compare to their NOEC means the environmental minimum concentrations were below for all the compounds and the environmental maximum concentrations were below for isoproturon, chlortoluron and linuron. However, the highest concentrations found for diuron, atrazine and simazine were higher than the NOEC mean. Recall, there were not any NOEC values for hexazinone, tebuthiuron, terbutryn, ametryn, cyanazine, terbuthylazine and propanil (Fig. 8). Additionally the highest environmental concentrations found for atrazine, diuron, isoproturon, simazine and terbutryn were higher than their MAC – EQS (Table 1). The reports of the environmental concentrations were conducted in The Netherlands (atrazine) France (ametryn, atrazine, chlortoluron, cyanazine, diuron, isoproturon, linuron, simazine, terbutryn), Spain (atrazine, chlortoluron, cyanazine, diuron, isoproturon, propanil, simazine, terbuthylazine), the western Baltic (atrazine, simazine) and other European surface waters (diuron). Outside Europe environmental concentrations were reported from Australia (ametryn, atrazine, diuron, simazine, hexazinone, tebuthiuron), North America (atrazine, cyanazine) and Barbados (atrazine). See appendix C.
23
4. DISCUSSION
PS II inhibitors have most of its direct effects on autotrophic organisms but many other species are affected indirectly through water quality and food availability and might result in reduced abundance and diversity. Some compounds have toxic metabolites which can persist in the environment for a long time. Differences in ecosystem community function and structure as well as the legislation system play an important role when it comes to environmental concentrations. Environmental concentrations also largely depends upon if it is a river with flowing water or a stream near an agricultural field, the latter with presumably higher concentrations than the former. Additionally, seasonal differences have been detected with highest concentrations during spring (Knauer et al., 2010). Environmental factors such as pH, nutrient load (N and P), DOC, temperature, species diversity etc can influence the bioavailability and concentrations of the PS II inhibitors.
4.1 EC50 and NOEC data
There are large gaps between the minimum and maximum EC50 value for atrazine and isoproturon, (Fig. 3), bigger than for any other PS II inhibitor. These two compounds had a lot of data, measured at different sites with different environmental factors and under a range of various herbicide exposure durations. Their large amount of data may explain the scatter of the effect concentrations for these compounds. Only diuron had more data (Fig. 2), also with quite a difference between maximum and minimum EC50. Due to such large variance, the mean values might indicate the toxicity with less certainty, and show a slightly less toxic compound. This was supported by the ranking of PS II inhibitors which resulted in a different order of the toxicity depending on EC50/NOEC means (Fig. 4 and 10) or EC50/NOEC minimums (data not shown). The difference between the compounds NOEC maximum and minimum was not as large compared to the EC50
values, whereof the mean value did not differ dramatically from the minimum. Nevertheless, diuron was the most toxic PS II inhibitor for algal communities based on their mean and minimum EC50 respective NOEC. Metamitron had only a single NOEC value, which was considerably higher compared to the other 13 compounds. It was measured at community metabolism (dissolved oxygen and pH) which was also an endpoint for several other NOEC values for the PS II inhibitors. Speculating around if metamitron really was the least toxic PS II inhibitor of those included is complicated. The log kow for metamitron speaks to its advantage as it was moderately low (1,27) in comparison to the other compounds, ranging from 0,98-3,20 including PS II inhibitors with accessible NOEC values and from -0,20-6,6 (Sangster, 2012; The national center for biotechnology information, 2005) including all PS II inhibitors. Higher log kow values usually indicate a higher toxicity due to bioaccumulating properties of the compound. According to U.S. Environmental protection agency, 2000 a log kow above 4,0 is required for bioaccumulation through the food chain. However, since it was only one data point and metamitron was lacking EC50 data, it is difficult to draw any conclusions about the toxicity for metamitron from the information gathered here. Another peculiar value was for metribuzin which had a greater NOEC mean (0,15335 µmol/l) than EC50 mean (0,1364 µmol/l). An explanation to this might be that all NOEC values and one EC50
value were measured in The Netherlands (Brock et al., 2004) whilst all the EC50 data came from a river in Denmark (Gustavson et al., 2003). Brock et al., 2004 used enclosures placed in experimental ditches, the metribuzin was added in the range of predicted environmental concentrations in Dutch drainage ditches (0-0,840 µmol/l). Gustavson et al., 2003 sampled periphyton on glass discs from an unpolluted river site and exposed the periphyton to a
24
concentration range between 0-0,233 µmol/l. The effect data were determined using different methods. Also differences in exposure concentrations and exposure duration (hours to the periphyton in Denmark to days in the Dutch enclosures) may be reasons behind the greater NOEC mean. In addition, the experimental site in The Netherlands and the river site in Denmark are probably influenced by differences in nutrient content, pH and species composition. Guasch et al. (1998) showed atrazine to have a lower EC50 in Sweden compared to The Netherlands, partly due to differences in environmental factors and different levels of pollution. Most of the PS II inhibitors did not have any effect data from microcosm/mesocosm or field studies (Fig. 2 and 8). Only 14 out of 56 PS II inhibitors had at least one accessible toxicity value (EC50 and/or NOEC) measured at community level for aquatic microalgae. Out of those 14 PS II inhibitors, only diuron, isoproturon, atrazine (EC50) and linuron (NOEC) had a substantial amount of effect data. Even if effect data from laboratory studies and species sensitivity distributions (SSD) are well-known to be extrapolated to whole ecosystems and communities, more comprehensive information from field experiments was expected considering the extensive use of herbicides world-wide. Communities living at downstream sites or previously exposed communities seem to have a higher EC50 due to a tolerance development (Dorigo & Leboulanger, 2001; Pesce et al., 2010). Morcille River in France is exposed to chemicals, such as organic and mineral pesticides due to vineyards located along the river. Periphyton communities from downstream sites in Morcille River indicated a tolerance development to diuron as the community showed a higher EC50 compared to upstream sites (Pesce et al., 2010) (see section 3.1.2). River Ozanne, also located in France, is exposed to agricultural run-off containing mainly atrazine and isoproturon. The periphyton communities here showed the same tolerance development to atrazine and isoproturon in the two most downstream sites (Dorigo & Leboulanger, 2001). Schmitt-Jansen & Altenburger (2005a) also showed an increasing tolerance of periphyton communities to atrazine and isoproturon. Communities experienced a constant exposure for 14 days prior a short-term inhibition test had higher EC50 values than the control communities (see section 3.1.2, 3.1.3 and 3.1.4).
4.1.1 Legal standards
The European Union has approved 15 out of the 56 PS II inhibitors for usage but there were still a great number of those that were lacking field toxicity data at community level. Eight of the compounds (bentazon, bromoxynil, chloridazon (pyrazon), desmedipham, ioxynil, lenacil, phenmedipham and pyridate) had neither EC50 nor NOEC data and one compound (metamitron) had one NOEC value but not any EC50 data. The decision behind the approval of those PS II inhibitors may be based upon effect data from laboratory experiments or single species tests with less environmental relevance. The WFD is based on such tests (McClellan, Altenburger, & Schmitt-Jansen, 2008) which may not reveal long-term effects from chronic exposure or indirect effects. However, there are probably data behind the approval of these compounds which are only accessible to authorities. On the one hand, diuron proved to be the most toxic compound here but it can still be legally used within EU and USA (European Union, 2008; U.S. Environmental protection agency, 2012). On the other hand, Nélieu et al.(2010) claimed that diuron was recently banned in EU but are still heavily used in USA. Legal standards in USA are formulated by the U.S EPA according to the toxicity from short-term single species tests (Fairchild & Sappington, 2002; Ricart et al., 2009). Besides that, U.S EPA approved all the compounds, and according to Fairchild & Sappington (2002) USA does not, unlike Canada, have specific aquatic life criteria for pesticides such as metribuzin. Differences in effect concentration has been shown for diuron comparing single species vs. communities (McClellan et al., 2008), where an accurate extrapolation was not possible. McClellan
25
et al.(2008) suggest higher-tier studies for the establishment of EQSs, such as model ecosystems including several species with different sensitivity and the usage of PICT (Pollution Induced Community Tolerance) as a complementary tool to the present standards. But according to Annex V (point 1.4.3) of the WFD and Article 1 of the EQSD good chemical status for a water body is reached when the concentrations of the priority substances and other pollutants listed in Annex I of the EQSD are consistent with the EQSs (European Commission, 2012b). Additionally, concentrations equal to the EQS for atrazine have shown to be below a safe threshold to aquatic invertebrate populations (Van den Brink et al., 2009). Another important aspect is the testing of individual compounds. Cumulative direct and indirect effects are not determined in any guidelines (Bengtson Nash et al., 2005), it is complex processes and difficult to standardize. Still, such effects probably constitute a big part in open aquatic systems. Therefore, future research needs to consider mixture toxicity for a better understanding and legislation system.
4.2 Limitations of this study
Three factors (temperature, light intensity and exposure duration) were comparable with ATZ equivalents. The reason not to include more environmental parameters was because there were 1) not enough studies revealing such factors, 2) none or too few effect data assessments for an accurate comparison.
4.2.1 Biomass
Biomass is a typical parameter for the analysis of biofilms (Schmitt-Jansen & Altenburger, 2008). It would therefore be of interest to compare the ATZ equivalents with biomass but unfortunately there were only a limited number of studies mentioning biomass in actual figures. Several articles refer to it as it matters and changes on a certain time (Bryfogle & McDiffet, 1979; Gustavson et al., 2003) and exposure concentration (Schmitt-Jansen & Altenburger, 2005b). Biomass, determined through chlorophyll-a (Chl-a) fluorescence, has shown to decline in periphyton and phytoplankton communities exposed to isoproturon (Schmitt-Jansen & Altenburger, 2005b), linuron (Daam, et al., 2009), simazine (Bryfogle & McDiffet, 1979) and metribuzin (Brock et al., 2004; Gustavson et al., 2003) from different exposure scenarios. However, Chl-a might not only decrease in the presence of an herbicide, it can also increase. Microalgae are able to regulate their intracellular concentrations of photosynthetic pigments due to altered environmental factors. Ricart et al.(2009) showed increasing Chl-a contents in algal communities with increasing diuron concentrations. This behavior, called “shade-adaptation” increases the photosynthetic pigments, consequently the Chl-a content, in response to reduced light intensity (Ricart et al., 2009). As already mentioned, communities chronically exposed to herbicides have shown to develop a tolerance to herbicide stress (Dorigo et al., 2004). This was supported by Dorigo & Leboulanger (2001) who showed a downstream increasing gradient of biomass for periphyton communities exposed to atrazine and isoproturon in River Ozanne in France (see section 3.1.2, 3.1.3 and 3.1.4). Periphyton in marine microcosms exposed to diuron has shown a similar tolerance increase (Molander & Blanck, 1992). For an accurate comparison between herbicide stress and biomass/species composition for primary producers, more studies need to take the pigment analysis in to account in risk assessments and toxicity tests. However Chl-a content does not describe the abundance for each taxon (Hartgers et al., 1998) only the total abundance. Hence, impacts on biomass and Chl-a content may be difficult to interpret if the community are dominated by tolerant taxa or if the algae hold heterotrophic
26
properties. This agrees with a study by Daam et al.(2009), who showed that the Chl-a content did not reflect the impact from linuron stress for the phytoplankton community as good as the periphyton community, suggesting a change from sensitive species to more tolerant. For example diatoms (ochrophytes) appear to be more tolerant to photosynthesis inhibitors in general compared to green algae (chlorophytes) (Daam et al., 2009; Dorigo et al., 2004; Magnusson et al., 2008). The differences in tolerance between taxa are another reason to analyze the pigments throughout the risk assessment. In addition, herbicide applications are known to change the water chemistry (Kasai & Hanazato, 1995). The relative amounts of carbon dioxide (CO2), bicarbonate and carbonate determines the pH of the water. During photosynthesis algae consume CO2 and produces oxygen (O2) and due to a decline in algal biomass, hence photosynthesis, it will result in a reduction of pH and dissolved oxygen (Kasai & Hanazato, 1995; Vervliet-Scheebaum et al., 2010). Therefore, biomass may be indirectly affected through the impact from herbicide stress to other factors e.g. oxygen levels (Day, 1993), metabolism, light, temperature and nutrient availability (Hartgers et al., 1998).
4.2.2 Temperate and tropical zones
Risk assessments and toxicity tests carried out for pesticides to aquatic organisms often use standard test species in laboratory experiments or field studies. Due to the larger proportion of studies performed in temperate zones, there is lacking knowledge of how the chemicals may affect aquatic life in tropical zones (Daam et al., 2009). The very few studies found from tropical areas indicate that the environmental risk assessment in those areas will be based upon data from temperate zones (Daam et al., 2009; Magnusson et al., 2008). Extrapolation of such threshold values may be questionable. The chlorophyte biomass are generally higher in tropical freshwaters than in temperate (Daam, Van den Brink, et al., 2009), recall the chlorophytes are more sensitive than diatoms. This suggests an elevated toxicity to herbicide stress in tropical regions. Community structure may also be affected by seasonality changes as cyanobacteria seem to dominate during rainy seasons due to limited light conditions (Daam et al., 2009). To test the most sensitive endpoint, risk assessments should be conducted when the chlorophytes are dominating the community. Consequently, if extrapolation is necessary, such threshold values from countries in temperate regions should be conducted during spring and midsummer (Daam et al., 2009) when the communities differ to a lesser extent. To be able to quantify the planetary boundary of chemical stress it is important to consider the differences in environmental factors such as, temperature, nutrient content and light intensity (Magnusson et al., 2008). Bear to mind, differences in water temperatures and light intensity have been demonstrated to affect the behavior of the herbicide. This has been shown for atrazine in laboratory conditions to the chlorophyte Nannochloris oculata (Mayasich et al., 1986) and for linuron to algal communities in Thailand (Daam et al., 2009) with increased toxicity in warmer temperatures and elevated light intensity. The importance to test local regions needs to be highlighted as there may be crucial differences in the function and structure of key species. Not to mention how the differences in nutrient content matter for the recovery of an ecosystem (De Laender et al., 2011). It is also debated how accurate it is to extrapolate threshold values between different types of ecosystems, from a laboratory scale out to the field or from single species tests to whole communities (Daam et al., 2009).
4.3 Environmental concentrations
Compared to the NOEC means environmental maximum concentrations were below for
27
chlorotoluron, isoproturon and linuron. However, the NOEC mean for linuron was almost equal to the highest concentration found in the environment and simazine had two equal NOEC values at community level for primary producers. One can speculate around the geographic location and where the highest environmental concentrations are found but it is uncertain to draw any conclusions. This because the limited information, due to the articles used here, were conducted in the same set of countries and therefore report environmental concentrations from that area. A large proportion of the environmental concentrations introduced here were measured in French and Spanish waters. France is one of the main user of herbicides in the world next after USA and Japan (Garmouma, Blanchard, Chesterikoff, Ansart, & Chevreuil, 1997) consequently French waters had most often the highest concentrations of PS II inhibitors. However due to the ban of atrazine in Europe and its wide use in North America and Australia (Knauer et al., 2010; Knauert et al., 2009) the highest concentrations of atrazine have been found in American and Australian waters (Graymore et al., 2001). Atrazine, isoproturon, chlorotoluron, hexazinone and linuron had EC50 mean values below their highest environmental concentrations which could suggest that acute impacts (<50%) from environmental relevant concentrations of these compounds would not be of concern to microalgal communities. Nevertheless, both atrazine and isoproturon had large differences between their minimum and maximum EC50 and atrazine concentrations have been reported to reach as high as 4,636 µmol/l in bulk run-off (sediment + water) during catastrophic events according to Day, 1993. That concentration is higher than the highest EC50 (3,55 µmol/l) reported for atrazine. Additionally, also according to Day, 1993 hexazinone can reach concentrations up to 1,752 µmol/l in surface run-off around forested watersheds and due to its high water solubility, hexazinone have the possibility to affect other areas away from its target (Day, 1993). Recall, there was only one EC50 value for hexazinone, 0,1303 µmol/l. The environmental concentrations found here may or may not have an acute impact on microalgal communities but might be able to affect important ecosystem functions during a long-term exposure, such as photosynthesis and primary production (Schmitt-Jansen & Altenburger, 2005a). The structuring of diatoms have shown to be affected in lotic mesocosms at environmentally relevant concentrations of a pesticide mixture with diuron (0,0064 µmol/l for chronic pollution and 0,0858 µmol/l for acute pollution lasting few hours) (Rimet & Bouchez, 2011), which were below the NOEC and EC50 mean from this study, respectively. The ability of mesocosms to provide high ecological relevance to the experiment indicates that environmental concentrations in natural rivers might affect diatom life-forms and ecological guilds (Rimet & Bouchez, 2011). The global pollution problem is a threat as there is lack of evidence around threshold behavior associated to the not yet quantified planetary boundary. The lacking knowledge brings uncertainty around how the other planetary boundaries will be affected due to the pollution problem but also around how long it takes to cause serious environmental change. So far, the research of the environmental problems by Rockström et al. (2009) indicate that as long as the threshold values are not crossed, humans has the possibility to pursue the life of social and economic development without forcing the surrounding environment to pay for it.
28
5. CONCLUSIONS
From this literature review, I found that most of the studies were done using standard test species under laboratory conditions. Risk assessments at community level would be more relevant, since the responses from exposure vary between algal species, test concentration and exposure duration (Dorigo et al., 2004). There were information gaps for several compounds, as many as 42 PS II inhibitors lacked effect data from field studies. To fill the information gaps, more environmental realistic studies including more PS II inhibitors need to be conducted. Coastal pollution from pesticides is a global issue (Magnusson et al., 2010), and many freshwater systems are becoming more and more polluted despite the increasing restrictions of the use of pesticides (Dorigo & Leboulanger, 2001). Although, a global boundary for chemical pollution might be ambiguous, as sensitivity between species and geographical regions differs. Also, seasonal differences and weather interactions amongst others have been found to influence the behavior of a toxicant. A global boundary may be a limit that is too wide concerning chemical pollution due to the more common local/regional impacts of many chemicals. However, a global boundary is a good first step accepting that there is a maximal carrying capacity for chemical pollution, especially with regard to approval of new products and compounds. The pollution problem is defined by interconnectedness, conflicts between policy makers, complex ecological interactions and uncertainty, which makes it a difficult problem to control in regulation systems. Furthermore, the scientific knowledge gap is just another factor complicating management strategies (Islam & Tanaka, 2004). Some aspects to consider are:
• More field research including all the compounds together with evaluation of several environmental factors.
• Less extrapolation from temperate to tropical zones.
• Effect data at community level instead of single species.
• Open access for scientists to data used in regulation systems.
Acknowledgments
I would like to gratefully acknowledge Thomas Backhaus (supervisor), Mikael Gustavsson and Göran Dave for valuable comments and suggestions during this time.
29
6. REFERENCES
Arrhenius, Å., Grönvall, F., Scholze, M., Backhaus, T., & Blanck, H. (2004). Predictability of the mixture toxicity of 12 similarly acting congeneric inhibitors of photosystem II in marine periphyton and epipsammon communities. Aquatic Toxicology, 68(4), 351-367.
Bengtson Nash, S., McMahon, K., Eaglesham, G., & Müller, J. (2005). Application of a novel phytotoxicity assay for the detection of herbicides in Hervey Bay and the Great Sandy Straits. Marine Pollution Bulletin, 51(1-4), 351-360.
Bontje, D., Kooi, B., & van Hattum, B. (2011). Sublethal toxic effects in a generic aquatic ecosystem. Ecotoxicology and Environmental Safety, 74(4), 929-939.
Brock, T. C., Crum, S. J., Deneer, J. W., Heimbach, F., Roijackers, R. M., & Sinkeldam, J. A. (2004). Comparing aquatic risk assessment methods for the photosynthesis-inhibiting herbicides metribuzin and metamitron. Environmental Pollution, 130(3), 403-426.
Bryfogle, B. M., & McDiffet, W. (1979). Algal succession in laboratory microcosms as affected by an herbicide stress. American Midland Naturalist, 101(2), 344-354.
Cuppen, J. G., Van den Brink, P. J., Van der Woude, H., Zwaardemaker, N., & Brock, T. C. (1997). Sensitivity of macrophyte-dominated freshwater microcosms to chronic levels of the herbicide linuron. Ecotoxicology and Environmental Safety, 38(1), 25-35.
Daam, M. A., & Van den Brink, P. J. (2007). Effects of chlorpyrifos, carbendazim and linuron on the ecology of a small indoor aquatic microcosm. Archives of Environmental Contamination
and Toxicology, 53(1), 22-35.
Daam, M. A., Rodrigues, A. M., Van den Brink, P. J., & Nogueira, A. J. (2009). Ecological effects of the herbicide linuron in tropical freshwater microcosms. Ecotoxicology and Environmental
Safety, 72(2), 410-423.
Daam, M. A., Van den Brink, P. J., & Nogueira, A. J. (2009). Comparison of fate and ecological effects of the herbicide linuron in freshwater model ecosystems between tropical and temperate regions. Ecotoxicology and Environmental Safety, 72(2), 424-433.
Day, K. E. (1993). Short-term effects of herbicides on primary productivity of periphyton in lotic environments. Ecotoxicology, 2(2), 123-138.
De Laender, F., Van den Brink, P., & Janssen, C. (2011). Functional redundancy and food web functioning in linuron-exposed ecosystems. Environmental Pollution, 159(10), 3009-3017.
Dorigo, U., & Leboulanger, C. (2001). A pulse-amplitude modulated fluorescence-based method for assessing the effects of photosystem II herbicides on freshwater periphyton. Journal of
Applied Phycology, 13(6), 509-515.
Dorigo, U., Bourrain, X., Bérard, A., & Leboulanger, C. (2004). Seasonal changes in the sensitivity of river microalgae to atrazine and isoproturon along a contamination gradient. The Science of
the Total Environment, 318(1-3), 101-114.
Dorigo, U., Leboulanger, C., Bérard, A., Bouchez, A., Humbert, J.-F., & Montuelle, B. (2007). Lotic biofilm community structure and pesticide tolerance along a contamination gradient in a vineyard area. Aquatic Microbial Ecology, 50(1), 91-102.
30
European Commission. (2012a). Plant protection products - Directive 91/414/EEC. Health and
Consumers. Plants. Retrieved 2012, a from http://ec.europa.eu/food/plant/protection/evaluation/dir91-414eec_en.htm
European Commission. (2012b). Priority substances under the water framework directive. Environment. Retrieved 2012, b from http://ec.europa.eu/environment/water/water-dangersub/pri_substances.htm#prop_2011
European Union. (1991). Council directive 91/414/EEC of 15 July 1991 concerning the placing of plant protection products on the market. EUR-Lex. Retrieved 2012, from http://eur-lex.europa.eu/LexUriServ/LexUriServ.do?uri=CELEX:31991L0414:EN:NOT
European Union. (2008). Directorate general for health & consumers. Pesticide Residues MRLs. Retrieved 2012, from http://ec.europa.eu/sanco_pesticides/public/index.cfm#
European Union. (2010). Water protection and management (Water framework directive). Summaries of EU legislation. Retrieved 2012, from http://europa.eu/legislation_summaries/environment/water_protection_management/l28002b_en.htm
Fairchild, J., & Sappington, L. (2002). Fate and effects of the triazinone herbicide metribuzin in experimental pond mesocosms. Archives of environmental contamination and toxicology, 43(2), 198-202.
Faust, M., Altenburger, R., Backhaus, T., Blanck, H., Boedeker, W., Gramatica, P., Hamer, V., et al. (2001). Predicting the joint algal toxicity of multi-component s-triazine mixtures at low-effect concentrations of individual toxicants. Aquatic Toxicology, 56(1), 13-32.
Flum, T., & Shannon, L. (1987). The effects of three related amides on microecosystem stability. Ecotoxicology and Environmental Safety, 13(2), 239-252.
Garmouma, M., Blanchard, M., Chesterikoff, A., Ansart, P., & Chevreuil, M. (1997). Seasonal transport of herbicides (triazines and phenylureas) in a small stream draining an agricultural basin: Mélarchez (France). Water Research, 31(6), 1489-1503.
Graymore, M., Stagnitti, F., & Allinson, G. (2001). Impacts of atrazine in aquatic ecosystems. Environment International, 26(7-8), 483-495.
Guasch, H., Ivorra, N., Lehmann, V., Paulsson, M., Real, M., & Sabater, S. (1998). Community composition and sensitivity of periphyton to atrazine in flowing waters: the role of environmental factors. Journal of Applied Phycology, 10(2), 203-213.
Gustavson, K., Møhlenberg, F., & Schlüter, L. (2003). Effects of exposure duration of herbicides on natural stream periphyton communities and recovery. Archives of Environmental
Contamination and Toxicology, 45(1), 48-58.
Hartgers, E. M., Aalderink, R. G., Van den Brink, P. J., Gylstra, R., Wiegman, J. W. F., & Brock, T. C. (1998). Ecotoxicological threshold levels of a mixture of herbicides (atrazine, diuron and metolachlor) in freshwater microcosms. Aquatic Ecology, 32(2), 135-152.
Herbicide resistance action committee. (2005). Classificaton of herbicides. Classificaton of
herbicides according to site of action. Retrieved 2012, from http://www.hracglobal.com/Publications/ClassificationofHerbicideSiteofAction/tabid/222/Default.aspx
31
Islam, M., & Tanaka, M. (2004). Impacts of pollution on coastal and marine ecosystems including coastal and marine fisheries and approach for management: a review and synthesis. Marine
Pollution Bulletin, 48(7-8), 624-649.
Jones, R. (2005). The ecotoxicological effects of photosystem II herbicides on corals. Marine
Pollution Bulletin, 51(5-7), 495-506.
Kasai, F., & Hanazato, T. (1995). Genetic changes in phytoplankton communities exposed to the herbicide simetryn in outdoor experimental ponds. Archives of Environmental Contamination
and Toxicology, 28(2), 154-160.
Kersting, K., & Van Wijngaarden, R. P. (1999). Effects of a pulsed treatment with the herbicide afalon (active ingredient linuron) on macrophyte-dominated mesocosms. I. Responses of ecosystem metabolism. Environmental Toxicology and Chemistry, 18(12), 2859-2865.
Key, P., Chung, K., Siewicki, T., & Fulton, M. (2007). Toxicity of three pesticides individually and in mixture to larval grass shrimp (Palaemonetes pugio). Ecotoxicology and Environmental
Safety, 68(2), 272-277.
Knauer, K., Leimgruber, A., Hommen, U., & Knauert, S. (2010). Co-tolerance of phytoplankton communities to photosynthesis II inhibitors . Aquatic Toxicology, 96(4), 256-263.
Knauert, S., Dawo, U., Hollender, J., Hommen, U., & Knauer, K. (2009). Effects of photosystem II inhibitors and their mixture on freshwater phytoplankton succession in outdoor mesocosms. Environmental Toxicology and Chemistry, 28(4), 836-845.
Kolpin, D. W., Thurman, E. M., & Linhart, S. M. (2001). Occurence of cyanazine compounds in groundwater: Degradates more prevalent than the parent compound. Environmental Science
and Technology, 35(6), 1217-1222.
Konstantinou, I., Hela, D., & Albanis, T. (2006). The status of pesticide pollution in surface waters (rivers and lakes) of Greece. Part I. Review on occurence and levels. Environmental Pollution, 141(3), 555-570.
Magnusson, M., Heimann, K., & Negri, A. P. (2008). Comparative effects of herbicides on photosynthesis and growth of tropical estuarine microalgae. Marine Pollution Bulletin, 56(9), 1545-1552.
Magnusson, M., Heimann, K., Quayle, P., & Negri, A. P. (2010). Additive toxicity of herbicide mixtures and comparative sensitivity of tropical benthic microalgae. Marine Pollution Bulletin, 60(11), 1978-1987.
Masojidek, J., Soucek, P., Machova, J., Frolik, J., Klem, K., & Maly, J. (2011). Detection of photosynthetic herbicides: Algal growth inhibition test vs. electrochemical photosystem II biosensor. Ecotoxicology and Environmental Safety, 74(1), 117-122.
Mayasich, J., Karlander, E., & Terlizzi, D. (1986). Growth responses of Nannochloris oculata Droop and Phaeodactylum tricornutum Bohlin to the herbicide atrazine as influenced by light intensity and temperature. Aquatic Toxicology, 8(3), 175-184.
McClellan, K., Altenburger, R., & Schmitt-Jansen, M. (2008). Pollution-induced community tolerance as a measure of species interaction in toxicity assessment. Journal of Applied
Ecology, 45(5), 1514-1522.
32
Molander, S., & Blanck, H. (1992). Detection of pollution-induced community tolerance (PICT) in marine periphyton communities established under diuron exposure. Aquatic Toxicology, 22(2), 129-144.
Newman, M. C., & Unger, M. A. (2003). Fundamentals of Ecotoxicology. Boca Raton: Lewis Publishers.
Nélieu, S., Bonnemoy, F., Bonnet, J.-L., Lefeuvre, L., Baudiffier, D., Heydorff, M., Quéméneur, A., et al. (2010). Ecotoxicological effects of diuron and chlorotoluron nitrate-induced photodegradation products: Monospecific and aquatic mesocosm-integrated studies. Environmental Chemistry, 29(12), 2644-2652.
Pesce, S., Lissalde, S., Lavieille, D., Margoum, C., Mazzella, N., Roubeix, V., & Montuelle, B. (2010). Evaluation of single and joint toxicity of diuron and its main metabolites on natural phototrophic biofilms using a pollution-induced tolerance (PICT) approach. Aquatic
Toxicology, 99(4), 492-499.
Pollehne, F., Jost, G., Kerstan, E., Meyer-Harms, B., Reckermann, M., Nausch, M., & Wodarg, D. (1999). Triazine herbicides and primary pelagic interactions in an estuarine summer situation. Journal of Experimental Marine Biology and Ecology, 238(2), 243-257.
Raven, P. H., Evert, R. F., & Eichhorn, S. E. (2005). Biology of plants. (K. Ahr, S. Anderson, V. Weiss, B. Moscatelli, & N. Tymoczko, Eds.) (7th ed., p. 126). New York: W.H. Freeman and Company Publishers.
Ricart, M., Barceló, D., Geiszinger, A., Guasch, H., de Alda, M. L., Romaní, A. M., Vidal, G., et al. (2009). Effects of low concentrations of the phenylurea herbicide diuron on biofilm algae and bacteria. Chemosphere, 76(10), 1392-1401.
Ricart, M., Guasch, H., Barceló, D., Brix, R., Conceição, M. H., Geiszinger, A., de Alda, M. J. L., et al. (2010). Primary and complex stressors in polluted mediterranean rivers: Pesticide effects on biological communities. Journal of Hydrology, 383(1-2), 52-61.
Rimet, F., & Bouchez, A. (2011). Use of diatom life-forms and ecological guilds to assess contamination in rivers: Lotic mesocosm approaches. Ecological Indicators, 11(2), 489-499.
Rockström, J., Steffen, W., Noone, K., Persson, Å., Chapin, F. S., Lambin, E. F., Lenton, T. M., et al. (2009). A safe operating space for humanity. Nature, 461(7263), 472-475.
Rutherford, A., & Krieger-Liszkay, A. (2001). Herbicide-induced oxidative stress in photosystem II. Trends in Biochemical Sciences, 26(11), 648-653.
Sangster, J. (2012). LOGKOW. A databank of evaluated octanol-water partition coefficients (Log P). Sangster Research Laboratories. Retrieved 2012, from http://logkow.cisti.nrc.ca/logkow/search.html
Schmitt-Jansen, M., & Altenburger, R. (2005a). Predicting and observing responses of algal communities to photosystem II-herbicide exposure using pollution-induced community tolerance and species-sensitivity distributions. Environmental Toxicology and Chemistry, 24(2), 304-312.
Schmitt-Jansen, M., & Altenburger, R. (2005b). Toxic effects of isoproturon on periphyton communities - a microcosm study. Estuarine, Coastal and Shelf Science, 62(3), 539-545.
Schmitt-Jansen, M., & Altenburger, R. (2008). Community-level microalgal toxicity assessment by multiwavelength-excitation PAM fluorometry. Aquatic Toxicology, 86(1), 49-58.
33
Solomon, K. R., Baker, D. B., Richards, R. P., Dixon, K. R., Klaine, S. J., La Point, T. W., Kendall, R. J., et al. (1996). Ecological risk assessment of atrazine in North American surface waters. Environmental Toxicology and Chemistry, 15(1), 31-76.
Szabó, I., Bergantino, E., & Giacometti, G. M. (2005). Light and oxygenic photosynthesis: energy
dissipation as a protection mechanism against photo-oxidation (pp. 629-634). Padova. Retrieved from http://www.nature.com/embor/journal/v6/n7/pdf/7400460.pdf
The national center for biotechnology information. (2005). Chemicals and bioassays. Pubchem. Retrieved 2012, from http://pubchem.ncbi.nlm.nih.gov/
Traunspurger, W., Schafer, H., & Remde, A. (1996). Comparative investigation on the effect of a herbicide on aquatic organisms in single species tests and aquatic microcosms. Chemosphere, 33(6), 1129-1141.
U.S. Environmental protection agency. (2000). Bioaccumulation testing and interpretation for the
purpose of sediment and quality assessment. Status and needs (pp. 1-136). Washington, DC. Retrieved from http://water.epa.gov/polwaste/sediments/cs/upload/bioaccum.pdf
U.S. Environmental protection agency. (2012). Substance search. Substance Registry Services. Retrieved 2012, from http://iaspub.epa.gov/sor_internet/registry/substreg/searchandretrieve/substancesearch/search.do
Van den Brink, P. J., Blake, N., Brock, T. C., & Maltby, L. (2006). Predicitve value of species sensitivity distributions for effects og herbicides in freshwater ecosystems. Human and
Ecological Risk Assessment, 12(4), 645-674.
Van den Brink, P. J., Crum, S. J., Gylstra, R., Bransen, F., Cuppen, J. G., & Brock, T. C. (2009). Effects of a herbicide-insecticide mixture in freshwater microcosms: Risk assessment and ecological effect chain. Environmental Pollution, 157(1), 237-249.
Van den Brink, P., Van Donk, E., Gylstra, R., Crum, S., & Brock, T. (1995). Effects of chronic low concentrations of the pesticides chlorpyrifos and atrazine in indoor freshwater microcosms. Chemosphere, 31(5), 3181-3200.
Vervliet-Scheebaum, M., Straus, A., Tremp, H., Hamer, M., Maund, S. J., Wagner, E., & Schultz, R. (2010). A microcosm system to evaluate the toxicity of the triazine herbicide simazine on aquatic macrophytes. Environmental Pollution, 158(2), 615-623.
WHO. (2012). Health topics. Pesticides. Retrieved 2012, from http://www.who.int/topics/pesticides/en/.
Wood, B. P., Gumbs, F., & Headley, J. V. (2002). Distribution and occurence of atrazine, deethylatrazine, and ametryne residues in groundwater of the tropical island Barbados. Communications in Soil Science and Plant Analysis, 33(15-18), 3501-3515.
von der Ohe, P. C., Dulio, V., Slobodnik, J., De Deckere, E., Kühne, R., Ebert, R.-U., Ginebreda, A., et al. (2011). A new risk assessment approach for the prioritization of 500 classical and emerging organic microcontaminants as potential river basin specific pollutants under the European Water Framework Directive. Science of the Total Environment, 409(11), 2064-2077.
34
APPENDIX A: Reference list (results)
Compound Endpoint Value Exposure Site Light intensity Temperature References
(µmol/l) duration (µmol photons/m2 s) (°C)
Atrazine EC50 0,4 Sweden (Guasch et al., 1998)
EC50 0,5 Sweden
EC50 1,3 Sweden
EC50 1,3 Sweden
EC50 0,9 Sweden
EC50 1,98 The Netherlands
EC50 1,4 The Netherlands
EC50 2,56 The Netherlands
EC50 1,99 The Netherlands
EC50 1,29 The Netherlands
EC50 1,89 The Netherlands
EC50 1,37 Spain
EC50 2,56 Spain
EC50 1,35 Spain
EC50 2,42 Spain
EC50 2,42 Spain
EC50 1,52 Spain
EC50 0,42 Spain
EC50 1,25 Spain
Atrazine NOEC 0,023 7 weeks The Netherlands 120 19±2
(P. Van den Brink,
Van Donk, Gylstra,
Crum, & Brock, 1995)
NOEC 0,023 7 weeks The Netherlands 120 19±2
Atrazine EC50 0,899 1 hour 140 (130-150) 20
(Schmitt-Jansen &
Altenburger, 2008)
EC50 0,44 1 hour 140 (130-150) 20
35
Compound Endpoint Value Exposure Site Light intensity Temperature References
(µmol/l) duration (µmol photons/m2 s) (°C)
Atrazine EC50 3,55 5 hours Oz#1.1 France 80
(Dorigo &
Leboulanger, 2001)
EC50 3,16 5 hours Oz#3 France 80
EC50 1,61 5 hours Oz#4 France 80
EC50 0,84 5 hours Oz#5/6 France 80
EC50 0,5 5 hours Oz#1.1 France 80 15,5 (8,0-23,0)
EC50 1,45 5 hours Oz#3 France 80 15,5 (8,0-23,0)
EC50 1,06 5 hours Oz#4 France 80 15,5 (8,0-23,0)
EC50 0,75 5 hours Oz#5/6 France 80 15,5 (8,0-23,0)
Atrazine EC50 0,016 Oz#1 France 80 river temp (Dorigo et al., 2004)
EC50 0,015 Oz#3 France 80 river temp
EC50 0,007 Oz#4 France 80 river temp
EC50 0,004 Oz#5/6 France 80 river temp
Atrazine NOEC 0,0216 28 days The Netherlands 19,7±2,1