Page 1
Volume 3 Issue 1 2014 Journal of Business Management ISSN 1985-8698
ASSESSING THE EQUILIBRIUM RELATIONSHIPS BETWEEN
MACROECONOMIC VARIABLES AND THE MALAYSIAN STOCK
MARKET: BOUNDS STATISTICS METHODOLOGY
Hussain Ali Bekhet and Mohamed Ibrahim Mugableh
1
LIQUIDITY ASPECTS OF LARGE CORPORATE BUSINESS: A
STUDY WITH REFERENCE TO LISTED COMPANIES IN INDIA
S.Chakraborty, B.B.Sarkar, Raveesh Krishnankutty and Bhushan Chandra
Das
15
AN EMPIRICAL STUDY ON DIRECTORS’ REMUNERATION IN
RELATION TO CORPORATE PERFORMANCE: A COMPARISON
BETWEEN GLCs AND NON-GLCs IN MALAYSIA
Lee Seng Fatt, Mohammad Izzat Amir Abdul Ghani, Adrian A/L Alphonsus
and Prasanth Nair A/L Sasedharan
28
THE EFFECTS OF TEACHING QUALITY ON STUDENT
SATISFACTION AND BEHAVIOURAL INTENTIONS FROM THE
VIEW POINT OF UNIVERSITY STUDENTS
Bahari Mohamed, Saripah bt Basar, Hasmah bt Safiei and Pritam Singh
A/L Santa Singh
40
THE EFFECTS OF SELF-EFFICACY ON THE DEVELOPMENT OF
ENTREPRENEURIAL INTENTION
Tan Kwe Lu
57
THE RELATIONSHIP BETWEEN FIRM CHARACTERISTIC AND
CORPORATE GOVERNANCE MECHANISM WITH FIRM’S
INTELLECTUAL CAPITAL DISCLOSURE IN MALAYSIAN
INITIAL PUBLIC OFFERINGS
Zaifudin Zainol, Rashidah Abdul Rahman, Shahrul Suhaimi Ab. Shokor and
Afdzal Aizat Ramli
66
LEADERSHIP BEHAVIOR AND ORGANIZATIONAL
PERFORMANCE: A CASE OF 100 BEST CO-OPERATIVES IN
MALAYSIA
Mohd Zainal Munshid bin Harun, Othman B Chin, Sharul Nizam B
Salahuddin and Mohd Yunus B Majid
85
HOW CORPORATE SOCIAL RESPONSIBILITY (CSR)
CONTRIBUTES TO CUSTOMER - BASED BRAND EQUITY
AMONG MALAYSIAN MOBILE TELCOS’
Abdul Rahman Zahari, Elinda Esa and Inaliah Mohd. Ali
97
Page 2
Assessing the equilibrium relationship between macroeconomic variables and the Malaysian stock market:
Bounds statistics Methodology
Journal of Business Management Volume 3 Issue 1 2014 1
ASSESSING THE EQUILIBRIUM RELATIONSHIPS BETWEEN
MACROECONOMIC VARIABLES AND THE MALAYSIAN STOCK MARKET:
BOUNDS STATISTICS METHODOLOGY
Hussain Ali Bekhet
[email protected]
[email protected]
Mohamed Ibrahim Mugableh
[email protected]
University Tenaga Nasional
ABSTRACT
The paper aims at estimating six macroeconomic variables that are influencing the Malaysian
stock market index. Specifically, it assesses the long-run and short-run equilibrium
relationships between the industrial production index (IP), the producer price index (PPI), the
consumer price index (CPI), exchange rates (ER), narrow money supply (M1), broad money
supply (M2) and the Malaysian Stock Market Index (SMI) using annual time-series data for
the 1977-2011 period. To accomplish these goals, the paper utilizes the Augmented-Dickey
Fuller (ADF) and the Phillips-Perron (PP) stationarity bounds statistics tests. The paper then,
uses Pesaran bounds statistics for testing the co-integrating relationships among variables.
Eventually, the results of the stationarity and co-integration tests are used to analyze the long-
run and short-run equilibrium relationships among the variables. The results of the ADF and
the PP tests show that the null hypothesis of non-stationary cannot be rejected even at the 10%
significance level in all cases except for one variable. More specifically, the variables IP, PPI,
CPI, ER, M1, and M2 are stationary at the upper bound, while the variable SMI is stationary at
both lower and upper bounds. However, the results of the pesaran bounds statistics reveal that
all variables are co-integrated with SMI except ER, and CPI. The results of the stationarity
tests and co-integration show the presence of long-run and short-run equilibrium relationships
between four macroeconomic variables and SMI. In particular, IP and M1 are positively
associated with SMI in the long-run, while PPI and M2 are negatively associated. Additionally,
IP and M2 are negatively associated with SMI in the short-run, while PPI and M1 are
positively associated. The study‟s findings are of particular interest and importance to policy
makers, financial economists, and investors dealing with the Malaysian economy and its stock
market.
Keywords: stock prices, macroeconomic variables, economic equilibrium, bounds statistics,
stationarity tests, co-integration test
INTRODUCTION
During the last decades, the equilibrium relationships between macroeconomic variables and
stock prices have been widely studied by academic researchers and practitioners. In fact, the
literature is very rich for the matured stock markets of Canada, France, Germany, Italy, Japan,
the UK, and the US. However, the latest studies in this area support the argument that stock
Page 3
Assessing the equilibrium relationship between macroeconomic variables and the Malaysian stock market:
Bounds statistics Methodology
Journal of Business Management Volume 3 Issue 1 2014 2
prices are influenced by macroeconomic variables such as the industrial production index (IP),
the consumer price index (CPI), the producer price index (PPI), the federal funds rate (FFR), a
narrow money supply (M1), a broad money supply (M2), interest rates (INT), real gross
domestic product (RGDP), and exchange rates (ER) in mature stock markets (Beltratti and
Morano, 2006; Hatemi-J and Morgan, 2009; Humpe and Macmillan, 2009; Kizys and
Pierdzioch, 2009).
Since the early 1980s, there has been an increasing attention to study the relationships between
macroeconomic variables and stock prices in emerging stock markets. However, in the early
1990s, many emerging countries liberalized their stock markets and decided to open their
domestic stock markets to foreign investors. As a result, this lead to rapid growth in their stock
markets and economies as well as increasing their positions in the international economic and
financial environment (Ghosh and Ariff, 2004). In light of these matters, it is reasonable to
conclude that emerging stock markets have features which attract investors and researchers to
recognize and policy makers to evaluate and study these matters.
Notable studies have been conducted to examine the relationships between macroeconomic
variables and stock prices in emerging stock markets. Hanousek and Kocenda (2011) used the
generalized autoregressive conditional heteroscedasticity (GARCH) Model and found
significant evidence that emerging European stock market indices, i.e., the Czech Republic,
Hungary, and Poland were strongly influenced by mature European and the US stock market
indices as well as by their macroeconomic variables. Nguyen (2011) used the moving average
exponential (MAE)-GARCH Model and found that the US macroeconomic variables had
positive effects on the conditional mean and negative effects on the conditional variance of the
Vietnam stock market index (GSE- share index). Using arbitrage pricing theory (APT), Rjoub
et al. (2009) documented significant pricing relationships between stock returns and
macroeconomic variables in the case of Turkey. Tsoukalas (2003) used the vector
autoregressive (VAR) Model and found that macroeconomic variables (CPI, ER, IP, and M2)
were strongly related to stock prices in the case of Cyprus. Similarly, Verma and Ozuna (2005)
showed that the changes in the macroeconomic variables of one Latin American country did
not affect the stock markets of other Latin American countries. Moreover, they found that the
Mexican stock market significantly affected other Latin American stock markets and the
reverse did not hold.
In the Malaysian context, few notable studies have been made in our area of interest. Ibrahim
(1999) studied the relationships between seven macroeconomic variables (ER, foreign reserves
(FR), credit aggregates (CG), consumer prices (CP), IP, M1, and M2) and the Malaysian stock
market index using the vector error correction model (VECM) and monthly time series data for
the 1977-1996 period. The results suggested that the Malaysian stock market index was
efficient with respect to the CP, CG, and FR, while inefficient, with respect to M1, M2, ER,
and IP. Similarly, Ibrahim and Aziz (2003) examined the short-run and long-run relationships
between four macroeconomic variables (IP, CPI, M2, and ER) and the Malaysian stock market
index using monthly time series data for the 1977-1998 period. They found positive short-run
and long-run relationships between the Malaysian stock market index and both CPI and IP.
Additionally, they found negative short-run and long-run relationships between the Malaysian
stock market index and both of M2 and ER.
The current paper provides further evidence to the literature on the equilibrium relationships
between macroeconomic variables and stock prices. In particular, it examines the equilibrium
long-run and short-run relationships between six macroeconomic variables (IP, PPI, CPI, ER,
M1, and M2) and SMI in Malaysia for the 1977-2011 period.
Page 4
Assessing the equilibrium relationship between macroeconomic variables and the Malaysian stock market:
Bounds statistics Methodology
Journal of Business Management Volume 3 Issue 1 2014 3
The rest of the paper is divided into six sections. Section 2 presents an overview of the
Malaysian stock market; section 3 discusses the review of previous empirical studies; section 4
provides the bounds statistics methodology; section 5 reports empirical results and analysis;
while section 6 provides policy implications. Conclusions, suggestions, and further studies are
discussed in section 7.
OVERVIEW OF THE MALAYSIAN STIOCK MARKET
The Malaysian stock market is considered second among the largest South East Asian stock
markets according to its domestic market capitalization (See Figure 1).
Source: WFE, http://www.world-exchanges.org/statistics/time-series/value-share-trading.
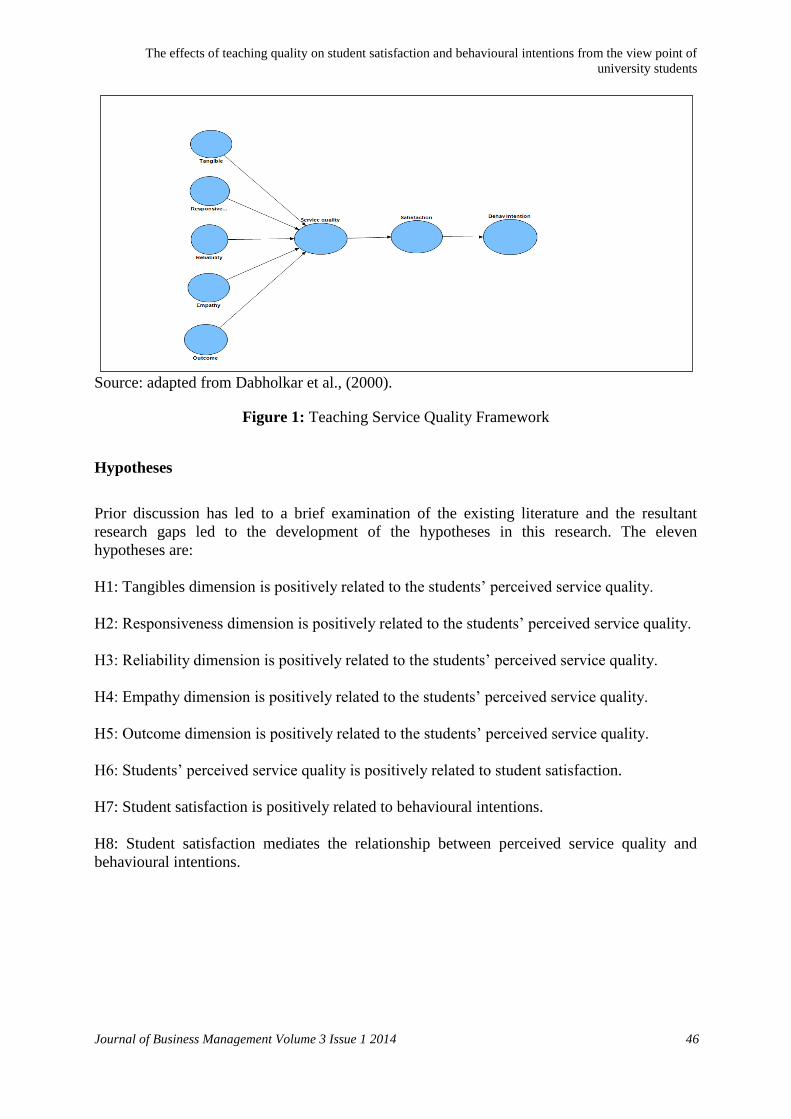
Figure 1: Domestic Market Capitalization for 1990-2011 Period
Figure 1 shows that the Singapore stock market achieved the highest domestic market
capitalization of U.S.$ 598 million at the end of 2011 followed by the Malaysian, Indonesian,
Thailand, and Philippine stock markets which recorded U.S.$396, 390, 268, and 165 million
respectively. The Malaysian stock market index (SMI) is the weighted average of stock prices
which is used to reflect the market capitalization of its components (Bursa Malaysia, 2012).
SMI started its operations officially in 1977 with a value of 113.40 points as shown in Figure
2.
Source: Bursa Malaysia, available online at: www.bursamalaysia.com.
Figure 2: Stock Market Index for the 1977-2011 Period
0.0
200.0
400.0
600.0
800.0
199
01
99
11
99
21
99
31
99
4
199
5
199
6
199
7
199
8
199
9
200
0
200
1
200
2
200
3
200
4
200
5
200
6
200
7
200
8
200
9
201
0
201
1
Mil
lio
ns
($)
Singapore
Malaysia
Indonesia
Thailand
Philippine
SMI = 203.2e0.057t
R² = 0.761
0
200
400
600
800
1000
1200
1400
1600
1800
Poin
ts
SMI
Expon. (SMI)
Page 5
Assessing the equilibrium relationship between macroeconomic variables and the Malaysian stock market:
Bounds statistics Methodology
Journal of Business Management Volume 3 Issue 1 2014 4
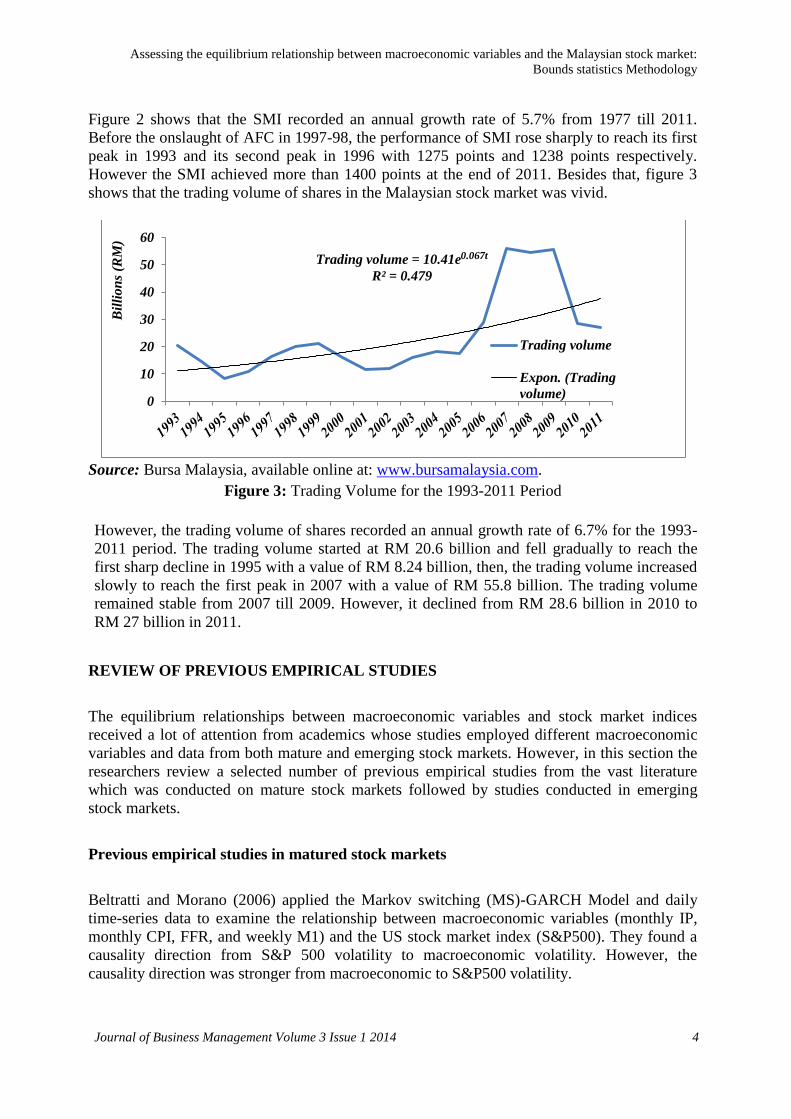
Figure 2 shows that the SMI recorded an annual growth rate of 5.7% from 1977 till 2011.
Before the onslaught of AFC in 1997-98, the performance of SMI rose sharply to reach its first
peak in 1993 and its second peak in 1996 with 1275 points and 1238 points respectively.
However the SMI achieved more than 1400 points at the end of 2011. Besides that, figure 3
shows that the trading volume of shares in the Malaysian stock market was vivid.
Source: Bursa Malaysia, available online at: www.bursamalaysia.com.
Figure 3: Trading Volume for the 1993-2011 Period
However, the trading volume of shares recorded an annual growth rate of 6.7% for the 1993-
2011 period. The trading volume started at RM 20.6 billion and fell gradually to reach the
first sharp decline in 1995 with a value of RM 8.24 billion, then, the trading volume increased
slowly to reach the first peak in 2007 with a value of RM 55.8 billion. The trading volume
remained stable from 2007 till 2009. However, it declined from RM 28.6 billion in 2010 to
RM 27 billion in 2011.
REVIEW OF PREVIOUS EMPIRICAL STUDIES
The equilibrium relationships between macroeconomic variables and stock market indices
received a lot of attention from academics whose studies employed different macroeconomic
variables and data from both mature and emerging stock markets. However, in this section the
researchers review a selected number of previous empirical studies from the vast literature
which was conducted on mature stock markets followed by studies conducted in emerging
stock markets.
Previous empirical studies in matured stock markets
Beltratti and Morano (2006) applied the Markov switching (MS)-GARCH Model and daily
time-series data to examine the relationship between macroeconomic variables (monthly IP,
monthly CPI, FFR, and weekly M1) and the US stock market index (S&P500). They found a
causality direction from S&P 500 volatility to macroeconomic volatility. However, the
causality direction was stronger from macroeconomic to S&P500 volatility.
Trading volume = 10.41e0.067t
R² = 0.479
0
10
20
30
40
50
60
Bil
lio
ns
(RM
)
Trading volume
Expon. (Trading
volume)
Page 6
Assessing the equilibrium relationship between macroeconomic variables and the Malaysian stock market:
Bounds statistics Methodology
Journal of Business Management Volume 3 Issue 1 2014 5
Hatemi-J and Morgan (2009) explored whether the Australian stock market was information-
ally efficient in the semi-strong form in relation to the ER and INT using the Auto-Regressive
Conditional Heteroscedasticity (ARCH) Model and daily time-series data for the 1994-2006
period. They found that the Australian stock market was not information-ally efficient with
respect to the INT and ER.
Humpe and Macmillan (2009) investigated the impact of macroeconomic variables (IP, CPI,
M2, and long-term INT) on the S&P 500 and the Japanese stock market index (Nikkei 225)
using VECM. For the US market, they found that S&P 500 was positively related to IP and
negatively related to both CPI and long-term INT. They also found a positive relationship
between S&P500 and M2. However, for the Japanese data, they found that the Nikkei 225 was
influenced positively by IP and negatively by CPI and long-term INT.
Kizys and Pierdzioch (2009) examined the relationships between macroeconomic variables
(short-term INT, inflation (INF), ER, CPI, and PPI) and the mature stock market indices of
Canada, France, Germany, Italy, Japan, the UK, and the US, using the VAR Model and
monthly time-series data for the 1975-2004 period. They found that the stock market indices
were not systematically linked to the macroeconomic variables in both the long-run and the
short-run.
Previous empirical studies in emerging stock markets
Aburgi (2008) examined the impact of macroeconomic variables (ER, INT, IP, and M1) on
stock market indices of four Latin American countries (Argentina, Brazil, Chile, and Mexico)
using the VAR Model and monthly time-series data for the 1986-2001 period. He found that
macroeconomic variables influenced Latin American stock markets indices significantly.
Adjasi (2009) employed the Exponential (E)-GARCH Model and monthly time-series data to
investigate the effects of macroeconomic variables (CPI as a proxy of INF, M2, INT, gold
prices (GP), oil prices (OP), and ER,) on the volatility of the Ghanaian stock market index. He
found that the volatility of INT increased the volatility of the Ghanaian stock market index,
while the volatility of GP, OP, and M2 reduced the volatility of this market.
Liu and Shrestha (2008) examined the long-run relationship between macroeconomic variables
(time deposit INT, INF, M2, IP, and ER) and the two indices of the Chinese stock market,
namely, Shanghai Stock Exchange, and Shenzhen Stock Exchange using the GARCH Model
and monthly time-series data for the 1992-2001 period with a total of 120 observations. The
results showed that a co-integration relationship existed between the stock market indices and
macroeconomic variables in the long-run.
Pal and Mittal (2011) applied VECM and quarterly time-series data for the 1995-2008 period
to examine the equilibrium long-run and short- run relationships between macroeconomic
variables (INT, INF, gross domestic savings (GDS), and ER) and stock market indices in India.
The results indicated co-integration relationships between macroeconomic variables and the
Indian stock market indices in both the short-run and the long-run.
Based on the previous empirical studies, the following hypotheses could be formulated for the
current study:
: There are significant long-run equilibrium relationships between macroeconomic
variables (IP, PPI, CPI, ER, M1, and M2) and SMI.
Page 7
Assessing the equilibrium relationship between macroeconomic variables and the Malaysian stock market:
Bounds statistics Methodology
Journal of Business Management Volume 3 Issue 1 2014 6
: There are significant short-run equilibrium relationships between macroeconomic
variables (IP, PPI, CPI, ER, M1, and M2) and SMI.
BOUNDS STATISTICS METHODOLOGY
In fact, the research methodology needs to be carefully designed to obtain results that are quite
robust, objective, and realistic. For the current paper, several steps of the research
methodology have been adopted.
Variables sources
The present study uses annual time series data covering the 1977-2011 period. However, data
on the SMI was obtained from Bursa Malaysia (www.bursamalaysia.com); data on M1, M2,
and ER was obtained from BNM (www.bnm.gov.my); data on IP, PPI, and CPI was obtained
from the department of statistics, Malaysia (DOSM) (www.statistics.gov.my).
Model specification and variables descriptions
The researchers examine the long-run and short-run equilibrium relationships between six
macroeconomic variables (IP, PPI, CPI, ER, M1, and M2) and SMI, by relying on the
following model:
+ + (1)
Where denotes the intercept; represent the coefficients of the explanatory
variables; denotes the error term. represents the logarithms of yearly figures of the
Malaysian stock market index which are obtained by taking the weighted average of daily
closing stock prices; representing the logarithms of yearly weights of the Malaysian
industrial production index, and covering manufacturing, mining, and electricity sectors using
2005 as the base year; denotes the logarithms of yearly weights of the Malaysian
producer price index, and cover agriculture, fishing, mining, manufacturing, electricity, gas,
and water supply sectors using 2000 as the base year; denotes the logarithms of yearly
weights that have been taken to measure the Malaysian aggregate price level of the main
groups of goods and services using 2000 as the base year; represents the yearly values of
bilateral Malaysian Ringgit (RM) exchange rate vis-à-vis the US dollar ($); and
denoting the logarithms of yearly figures of the total amount of money available in the
Malaysian economy, expressed in RM (millions). However, all variables were transformed into
natural logarithmic forms expect ER to make this variable simultaneous with other variables or
series (Chen et al., 1986).
The error-corrections representations for ARDL Approach for the variables in equation 1 can
be written as the following models:
Page 8
Assessing the equilibrium relationship between macroeconomic variables and the Malaysian stock market:
Bounds statistics Methodology
Journal of Business Management Volume 3 Issue 1 2014 7
t 1 11 t i 12 t i 13 t i 14 t i 15 t i 16 t i 17 t i
1 0 0 0 0 0 0
牋 1 2K K K K K K K
i i i i i i i
LSMI LSMI LIP LPPI LCPI ER LM LM
11 t 1牋 12 t 1牋 13 t 1牋 14 t 1牋 15 t 1牋 16 t 1牋 17 t 1牋 t 1 t1 2LSMI LIP LPPI LCPI ER LM LM ECM
(2)
t 2 21 t i 22 t i 23 t i 24 t i 25 t i 26 t i 27 t i
1 0 0 0 0 0 0
牋 1 2K K K K K K K
i i i i i i i
LIP LIP LSMI LPPI LCPI ER LM LM
21 t 1牋 22 t 1牋 23 t 1牋 24 t 1牋 25 t 1牋 26 t 1牋 27 t 1牋 t 1 t1 2LIP LSMI LPPI LCPI ER LM LM ECM
(3)
t 3 31 t i 32 t i 33 t i 34 t i 35 t i 36 t i 37 t i
1 0 0 0 0 0 0
牋 1 2K K K K K K K
i i i i i i i
LPPI LPPI LSMI LIP LCPI ER LM LM
31 t 1牋 32 t 1牋 33 t 1牋 34 t 1牋 35 t 1牋 36 t 1牋 37 t 1牋 t 1 t1 2LPPI LSMI LIP LCPI ER LM LM ECM
(4)
t 4 41 t i 42 t i 43 t i 44 t i 45 t i 46 t i 47 t i
1 0 0 0 0 0 0
牋 1 2K K K K K K K
i i i i i i i
LCPI LCPI LSMI LIP LPPI ER LM LM
41 t 1牋 42 t 1牋 43 t 1牋 44 t 1牋 45 t 1牋 46 t 1牋 47 t 1牋 t 1 t1 2LCPI LSMI LIP LPPI ER LM LM ECM
(5)
t 5 51 t i 52 t i 53 t i 54 t i 55 t i 56 t i 57 t i
1 0 0 0 0 0 0
牋 1 2K K K K K K K
i i i i i i i
ER ER LSMI LIP LPPI LCPI LM LM
51 t 1牋 52 t 1牋 53 t 1牋 54 t 1牋 55 t 1牋 56 t 1牋 57 t 1牋 t 1 t1 2ER LSMI LIP LPPI LCPI LM LM ECM
(6)
t 6 61 t i 62 t i 63 t i 64 t i 65 t i 66 t i 67 t i
1 0 0 0 0 0 0
1 牋 1 2K K K K K K K
i i i i i i i
LM LM LSMI LIP LPPI LCPI ER LM
61 t 1牋 62 t 1牋 63 t 1牋 64 t 1牋 65 t 1牋 66 t 1牋 67 t 1牋 t 1 t1 2LM LSMI LIP LPPI LCPI ER LM ECM
(7)
t 7 71 t i 72 t i 73 t i 74 t i 75 t i 76 t i 77 t i
1 0 0 0 0 0 0
2 牋 2 1K K K K K K K
i i i i i i i
LM LM LSMI LIP LPPI LCPI ER LM
71 t 1牋 72 t 1牋 73 t 1牋 74 t 1牋 75 t 1牋 76 t 1牋 77 t 1牋 t 1 t2 1LM LSMI LIP LPPI LCPI ER LM ECM
(8)
Where represent the first difference operators; denotes the short-run
coefficients of the variables; represents the long-run coefficients of the one
lagged variable; ( )‟s denote the error correction terms which are used to link the long-
run equilibrium relationships of the variables with their short-run eqilibria.
Page 9
Assessing the equilibrium relationship between macroeconomic variables and the Malaysian stock market:
Bounds statistics Methodology
Journal of Business Management Volume 3 Issue 1 2014 8
The current paper uses the bounds statistics methodology to examine the long-run and short-
run equilibrium relationships among variables in the above 7 models (Equations, 2-8).
Specifically, the researchers started by testing whether the variables achieve their stationarity
at the upper or the lower bounds using both the augmented Dickey-fuller (ADF) and Phillips-
Peron (PP) stationarity bounds statistics tests. Then, the researchers proceeded by testing the
number of co-integrating relationships among variables using Pesaran et al. (2001) bounds
statistics tests. Finally, we use the results of stationarity and co-integration to analyze the long-
run and short-run equilibrium relationships among the variables.
RESULTS AND ANALYSIS
ADF and PP stationarity bounds statistics tests
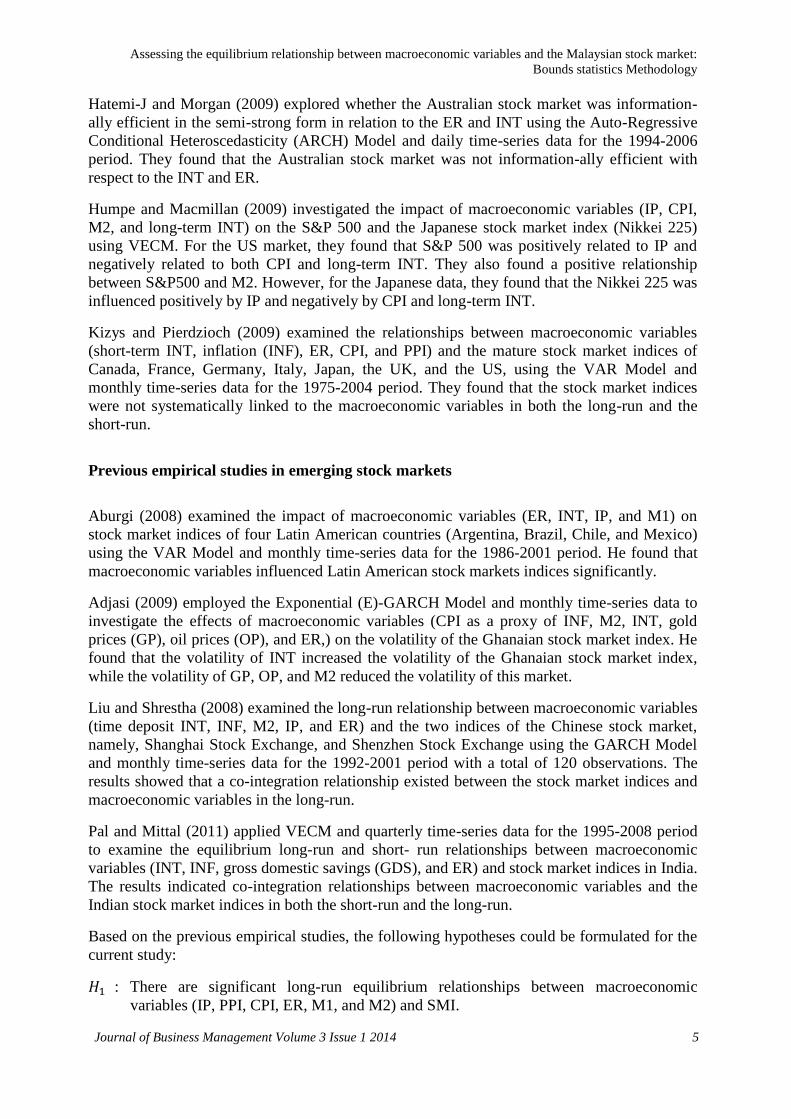
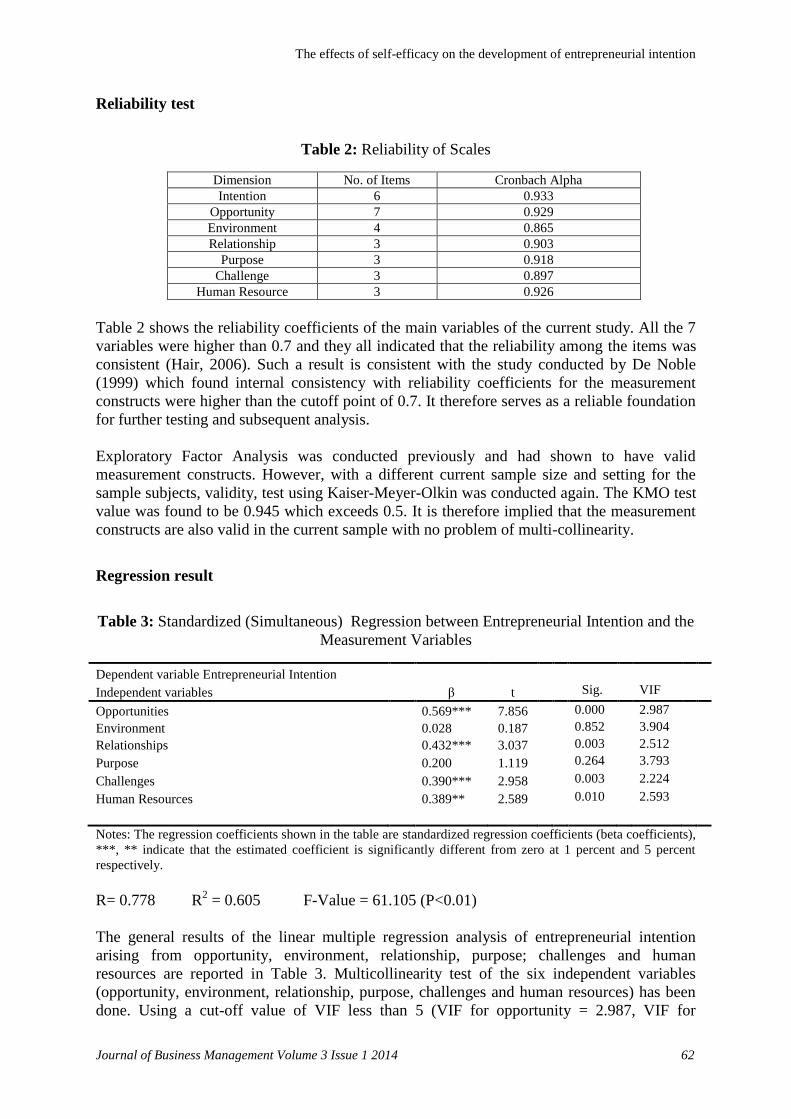
This study uses both of ADF and PP stationarity bounds statistics tests. However, table 1
reports the stationarity results of ADF and PP tests.
Table 1: Stationarity Results of ADFand PP Bound Statistics Tests
Stage Variables
ADF Critical values PP Critical values
Trend and
intercept 1% 5% 10%
Trend and
intercept 1% 5% 10%
At Lower
Bound
LSMI -3.47(0)***
-4.25 -3.54 -3.22 -3.59[4]**
-4.25 -3.56 -3.21
LIP -2.36(0) -4.26 -3.53 -3.21 -2.36[0] -4.26 -3.55 -3.23
LPPI -1.62(0) -4.25 -3.55 -3.23 -1.78[3] -4.24 -3.54 -3.21
LCPI -1.89(0) -4.28 -3.56 -3.21 -1.91[3] -4.25 -3.55 -3.22
ER -1.86(0) -4.25 -3.55 -3.22 -2.04[5] -4.24 -3.51 -3.25
LM1 2.87(0) -4.26 -3.54 -3.23 4.55[2] -4.25 -3.56 -3.26
LM2 3.13(0) -4.28 -3.53 -3.24 2.55[2] -4.24 -3.55 -3.27
At Upper
Bound
(LSMI) - 7.86(0)* -4.26 -3.55 -3.21 -8.38[4]
* -4.26 -3.55 -3.21
LIP) - 5.81(0)* -4.27 -3.56 -3.22 -5.81[0]
* -4.28 -3.52 -3.22
LPPI) -5.71(0)* -4.24 -3.53 -3.20 - 5.73[3]
* -4.26 -3.55 -3.21
LCPI) - 6.26(0)* -4.26 -3.55 -3.21 - 6.32[3]
* -4.29 -3.52 -3.25
ER) -6.20(0)* -4.25 -3.58 -3.22 -6.30[5]
* -4.27 -3.56 -3.21
(LM1) - 4.97(0)* -4.27 -3.56 -3.23 - 4.94[2]
* -4.28 -3.55 -3.22
LM2) - 3.34(0)***
-4.34 -3.59 -3.25 - 3.33[2]***
-4.26 -3.57 -3.23
Notes: (1), *, **, ***, describe the stationarity at 1%, 5 % and 10% significance level respectively. (2), Source:
Output of EViews 7.2 Software.
Table 1 shows that all variables in both the ADF and PP tests are non-stationary at the lower
bound except LSMI. When the first differences are executed, all the variables are stationary.
Specifically, at the lower bound, LSMI is stationary at the 10% significance level in the ADF
test; while it is stationary at the 5% significance level in the PP test. At the upper bound, all the
variables are stationary at the 1% significance level in both the ADF and PP tests except LM2
which is stationary at the 10% significance level.
Pesaran bounds statistics tests for co-integration
The present study uses the F-statistics as suggested by Pesaran et al. (2001) to test the null
hypotheses of no co-integration among variables by setting the long-run coefficients of the one
lagged variable in the above 7 models (Equations, 2-8) equal to zero i.e., : = 0, against
Page 10
Assessing the equilibrium relationship between macroeconomic variables and the Malaysian stock market:
Bounds statistics Methodology
Journal of Business Management Volume 3 Issue 1 2014 9
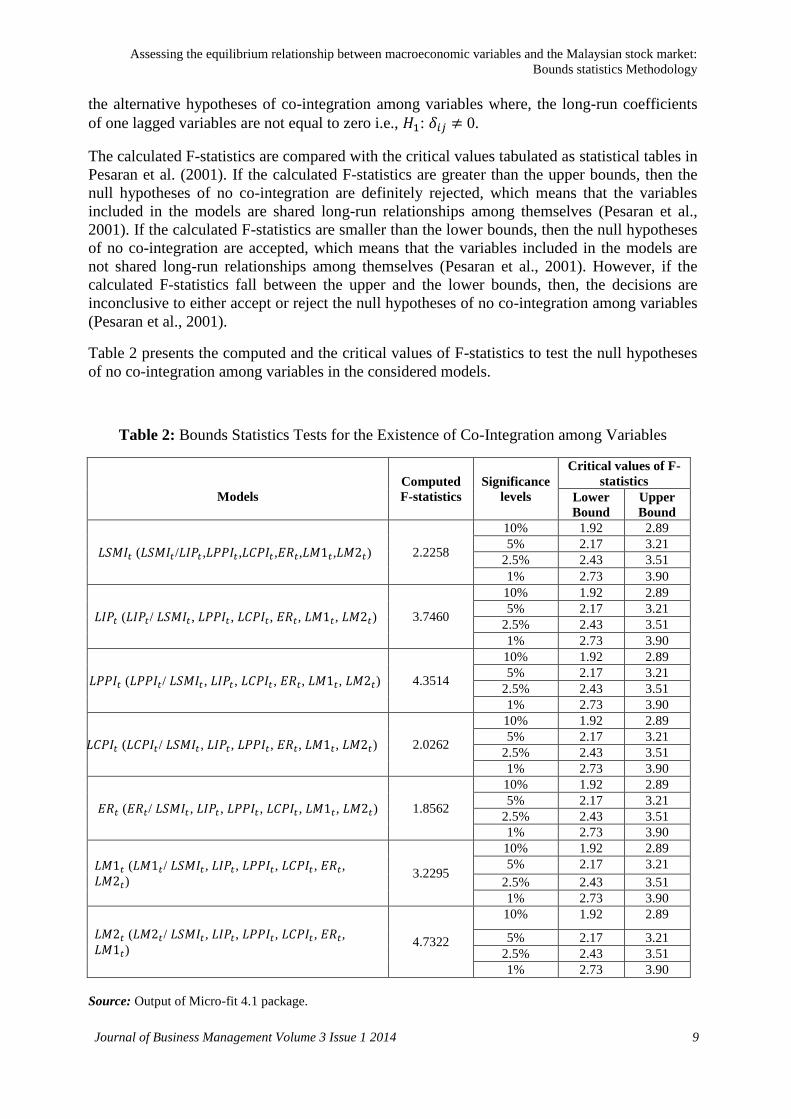
the alternative hypotheses of co-integration among variables where, the long-run coefficients
of one lagged variables are not equal to zero i.e., : 0.
The calculated F-statistics are compared with the critical values tabulated as statistical tables in
Pesaran et al. (2001). If the calculated F-statistics are greater than the upper bounds, then the
null hypotheses of no co-integration are definitely rejected, which means that the variables
included in the models are shared long-run relationships among themselves (Pesaran et al.,
2001). If the calculated F-statistics are smaller than the lower bounds, then the null hypotheses
of no co-integration are accepted, which means that the variables included in the models are
not shared long-run relationships among themselves (Pesaran et al., 2001). However, if the
calculated F-statistics fall between the upper and the lower bounds, then, the decisions are
inconclusive to either accept or reject the null hypotheses of no co-integration among variables
(Pesaran et al., 2001).
Table 2 presents the computed and the critical values of F-statistics to test the null hypotheses
of no co-integration among variables in the considered models.
Table 2: Bounds Statistics Tests for the Existence of Co-Integration among Variables
Source: Output of Micro-fit 4.1 package.
Models
Computed
F-statistics
Significance
levels
Critical values of F-
statistics
Lower
Bound
Upper
Bound
( / , , , , , ) 2.2258
10% 1.92 2.89
5% 2.17 3.21
2.5% 2.43 3.51
1% 2.73 3.90
( / , , , , , ) 3.7460
10% 1.92 2.89
5% 2.17 3.21
2.5% 2.43 3.51
1% 2.73 3.90
( / , , , , , ) 4.3514
10% 1.92 2.89
5% 2.17 3.21
2.5% 2.43 3.51
1% 2.73 3.90
( / , , , , , ) 2.0262
10% 1.92 2.89
5% 2.17 3.21
2.5% 2.43 3.51
1% 2.73 3.90
( / , , , , , ) 1.8562
10% 1.92 2.89
5% 2.17 3.21
2.5% 2.43 3.51
1% 2.73 3.90
( / , , , , ,
) 3.2295
10% 1.92 2.89
5% 2.17 3.21
2.5% 2.43 3.51
1% 2.73 3.90
( / , , , , ,
) 4.7322
10% 1.92 2.89
5% 2.17 3.21
2.5% 2.43 3.51
1% 2.73 3.90
Page 11
Assessing the equilibrium relationship between macroeconomic variables and the Malaysian stock market:
Bounds statistics Methodology
Journal of Business Management Volume 3 Issue 1 2014 10
Table 2 shows that the null hypotheses of no co-integration among variables in , and
models are rejected at all significance levels. We reject the null hypotheses of no co-
integration among variables in , model at the 10%, 5%, and 2.5% significance levels; also
we reject the null hypothesis of no co-integration among variables in model at the10%
and 5% significance levels. However, the researchers accept the null hypothesis of no co-
integration among variables in model.
The decisions are inconclusive to either accept or reject the null hypotheses of no co-
integration among variables in , and models. Specifically, we accept the null
hypothesis of no co-integration among variables in and models.
Finally, the researchers conclude that the variables in , , and models are
co-integrated among themselves, while the variables in and models are not
co-integrated among themselves. In fact, the results of co-integration are confirmed with the
results of Pan et al. (2007) who found a no co-integration between and , and
Ibrahim and Aziz (2003) who found a co-integration between ( , ) and .
Analyzing the long-run and short-run equilibrium relationships
The main objective of the current study is to analyze the long-run and short-run equilibrium
relationships between macroeconomic variables and SMI. However, after conducting the
bounds statistics tests for co-integration, we conclude that all variables are co-integrated with
expect and , therefore we need to examine the long-run and short-run
equilibrium relationships among these variables. Table 3 shows the estimations of long-run
coefficients.
Table 3: Long-Run Coefficients Estimations
model
= -3.89 + 0.12 - 0.17 + 0.60 + 0.13 – 0.01 + 0.39
S.E = (0.86) (0.06) (0.28) (0.32) (0.02) (0.18) (0.18)
S.S = (0.004)a (0.07)
c (0.56) (0.11) (0.002)
a (0.97) (0.07)
c
model
= 5.33 – 0.14 + 0.66 – .80 - 0.12 - 0.08 + 0.19
S.E =(1.53) (0.06) (0.26) (0.47) (0.03) (0.20) (0.18)
S.S =(0.01)a (0.03)
b (0.03)
b (0.11) (0.004)
a (0.71) (0.31)
model
=5.62 + 0.09 + 0.82 – 0.85 - 0.54 - 0.10 + 0.67
S.E =(2.01) (0.06) (0.39) (0.42) (0.47) (0.06) (0.25)
S.S =(0.02)b (0.16) (0.06)
c (0.07)
c (0.28) (0.13) (0.02)
b
model
=0.91 – 0.14 + 0.81 + 0.72 + 0.04 - 0.13 + 0.56
S.E =(0.05) (0.08) (0.18) (0.21) (0.31) (0.04) (0.12)
S.S =(0.43) (0.01)a (0.00)
a (0.00)
a (0.91) (0.01)
a (0.00)
a
Notes: (i) S.E denotes the standard errors of long-run coefficients. (ii) S.S defines the statistical significance of
long-run coefficients. (iii) The notations a, b, and c denote the statistical significance at 1%, 5%, and 10% levels
respectively.
Table 3 shows that at 1% significance level, the variable is positively associated with
model, while it is negatively associated with and models. On the other hand,
the variables , , and are positively associated with the model, while the
variable is negatively associated. At the 10% significance level, the variables
Page 12
Assessing the equilibrium relationship between macroeconomic variables and the Malaysian stock market:
Bounds statistics Methodology
Journal of Business Management Volume 3 Issue 1 2014 11
are positively associated with the model. Furthermore, the variable
is positively associated with the model, while is negatively associated. At
the 5% significance level, the variables , and are negatively and positively
associated with the model respectively, while the variable is positively associated
with the model. Table 4 presents short-run coefficients, error-corrections
representations, and estimation methods based on least squares and relevant diagnostic tests.
Table 4: Short-run Coefficients and Error-corrections Representations
model
= -3.69 + + - 0.07 +
(0.01)a (0.13) (0.14) (0.76) (0.06)
c (0.14)
0.53 - 0.46 +
(0.06)c (0.47) (0.03)
b (0.60)
(0.10)c
0.05 – + 0.39 –
(0.07)c (0.012)
b (0.20) (0.03)
b (0.32)
(0.01)a
0.24 – 0.43 – 0.94
(0.12) (0.02)b (0.00)
a
Estimated methods: Least squares
R2 = 0.98 S.E of regression = 0.02 F-statistics = 17.62[0.00]
Diagnostic tests
J-B normality test = 3.23 [0.20] Lagrange Multiplier test of residual serial correlation = 1.13[0.34]
ARCH test = 0.67[0.41] Ramsey RESET test of model specification = 4.11[0.10]
model
= 3.35 + 0.22 + 0.08 + 0.17 + 0.08 + 0.41 –
(0.00)a (0.15) (0.02)
b (0.00)
a (0.01)
a (
0.002)
a
0.31 + 0.59 - 0.08 - 0.60 - 0.27 - 0.24 +
(0.01)a (0.00)
a (0.00)
a (0.00)
a (0.07)
c (0.02)
b
0.04 - 0.16 + 0.37 - 0.63
(0.80) (0.14) (0.00)a (0.00)
a
Estimated methods: Least squares
R2 = 0.91 S.E of regression = 0.02 F-statistics = 8.30[0.01]
Diagnostic tests
J-B normality test = 1.16[0.56] Lagrange Multiplier test of residual serial correlation = 1.19[0.30]
ARCH test = 0.10[0.75] Ramsey RESET test of model specification = 1.28[0.26]
model
=3.10 – 0.45 + 0.20 + 0.20 + 0.11 + 0.29 –
(0.00)a (0.00)
a (0.00)
a (0.00)
a (0.00)
a (0.11)
0.47 - 0.40 - 0.73 + 0.34 + 0.47 - 0.06 -
(0.00)a (0.01)
a (0.00)
a (0.10) (0.03)
b (0.002)
a
0.05 - 0.02 + 0.37 - 0.55
(0.08)c (0.17) (0.02)
b (0.00)
a
Estimated methods: Least squares
R2 = 0.98 S.E of regression = 0.02 F-statistics = 32.78[0.00]
Diagnostic tests
J-B normality test = 0.98[0.61] Lagrange Multiplier test of residual serial correlation = .45[0.50]
ARCH test = 0.10[0.75] Ramsey RESET test of model specification = 0.01[0.91]
model
= 0.53 + 0.26 + 0.16 - 0.08 + 0.47 + 0.41 +
(0.41) (0.03)b (0.09)
c (0.01)
a (0.00)
a (0.01)
a
0.02 + 0.02 + 0.07 + 0.52 - 0.21 - 0.58
(0.91) (0.15) (0.00)a
(0.00)a (0.01)
a (0.00)
a
Page 13
Assessing the equilibrium relationship between macroeconomic variables and the Malaysian stock market:
Bounds statistics Methodology
Journal of Business Management Volume 3 Issue 1 2014 12
Estimated methods: Least squares
R2 = 0.91 S.E of regression = 0.022 F-statistics = 17.02[0.00]
Diagnostic tests
J-B normality test = 1.39[0.50] Lagrange Multiplier test of residual serial correlation = 1.74[0.19]
ARCH test = 1.08[0.30] Ramsey RESET test of model specification = 3.64[0.07]
Notes: (i) Figures in parentheses ( ) identify the statistical significance levels of short-run and (
coefficients. (ii) J-B represents jarque-bera for testing normality. (iii) Figures in brackets [ ] identify the p-values.
(iii) ARCH represents the auto-regressive conditional heteroscedasticity for testing heteroscedasticity.
Table 4 shows that the speed of adjustments to obtain the equilibrium, the ( , are
highly significant at the 1% level which suggest a high speed of arriving at the long-run
equilibrium. Specifically, the model records the highest in absolute value
among other models suggesting that 94% of the disequilibria in of the previous year‟s
shock adjust back to the long-run equilibrium in the current year. While, model
records the lowest in absolute value, suggesting a very low speed of converge toward
its long-run equilibrium. It is worth noting that the significances of ( imply the
causality directions among the considered variables in the models. However, we find causality
directions from , , , , and variables to model,
from , , , , and variables to model, from
, , , , , variables to model, and from
, , , , , variables to model in both short and
long-run.
The validity of estimated models by relying on both chi-square and F-version is confirmed
using diagnostic tests such as the J-B test, the Lagrange Multiplier test, the ARCH test, and the
Ramsey RESET test. However, the J-B test approved the normality assumption of the
estimated residual series in all models, the Lagrange Multiplier test confirmed the assumption
of no residual autocorrelation in all the models, the ARCH test confirmed the homoscedasticity
assumption in all models, and the Ramsey RESET test confirmed the correct specifications of
all models.
POLICY IMPLICATIONS
The findings of this study suggest that Malaysian policy makers should pay the most attention
to the effects of monetary policies on the stock market. Specifically, the results of the current
study are confirmed with the results of Ibrahim (1999) that found, both that M1 and M2 are
positively and negatively associated with SMI in both the long-run and short-run. The
contraction of the money supply leads to lower interest rate, lower firm investment and then,
decreases the attractiveness of investors to invest in the stock market. In sharp contrast, the
expansion of the money supply leads to hyper inflation, but increases share prices in the stock
market. Furthermore, the results of the current study are confirmed with the results of Ibrahim
(1999) who found that IP is positively and negatively associated with SMI in both the long-run
and short-run. A high IP in a particular industry, let us say the Malaysian manufacturing
industry, is a sign that the firms in that industry are performing well, thereby leading to
increasing their share prices in the stock market. In sharp contrast, a low IP is a sign that these
firms are not performing well, which leads to a decrease in their share prices in the stock
market.
CONCLUSIONS AND FURTHER STUDIES
Page 14
Assessing the equilibrium relationship between macroeconomic variables and the Malaysian stock market:
Bounds statistics Methodology
Journal of Business Management Volume 3 Issue 1 2014 13
The present paper examines the long-run and short-run equilibrium relationships between
macroeconomic variables (IP, PPI, CPI, ER, M1, and M2) and SMI using annual time-series
data for the 1977-2011 period. However, it employs the Augmented-Dickey Fuller (ADF) and
Phillips-Perron (PP) stationarity bounds statistics tests. Then, it uses Pesaran bounds statistics
for testing the co-integrating relationships among variables, and eventually, the results of
stationarity and co-integration tests are used to analyze the long-run and short-run equilibrium
relationships among the variables. Results of ADF and PP tests show that the null hypothesis
of non-stationary cannot be rejected even at the 10% significance level in all cases except one
variable. More specifically, the variables IP, PPI, CPI, ER, M1, and M2 are stationary at the
upper bound, while the variable SMI is stationary at both the lower and upper bounds.
However, the results of pesaran bounds statistics reveal that all variables are co-integrated with
SMI except ER, and CPI. The results of stationarity tests and co-integration show the presence
of long-run and short-run equilibrium relationships between four macroeconomic variables and
SMI. In particular, IP and M1 are positively associated with SMI in the long-run, while PPI
and M2 are negatively associated. Additionally, IP and M2 are negatively associated with SMI
in the short-run, while PPI and M1 are positively associated.
The present study adds to the existing literature and focuses on the long-run and short-run
equilibrium relationships between macroeconomic variables and stock prices in the case of an
emerging stock market, Malaysia, rather than a mature stock market, such as the US or the UK,
which have been frequently studied in the past. Finally, the results of this paper are of
particular interest and importance to policy makers, financial economists, and investors dealing
with the Malaysian economy and the Malaysian stock market.
In fact, our results could lead to research questions that need to be answered. For instance,
further research could broaden this study by adding more variables that have significant
influences on stock prices such as oil prices. Furthermore, further research could broaden this
study by including more than one country to draw robust results, since the main limitation of
this study is the use of one country.
REFERENCES
Abugri, B.A. (2008). Empirical relationship between macroeconomic volatility and stock
returns: Evidence from Latin American markets. International Review of Financial
Analysis, 17, 396-410
Adjasi, K.D.C. (2009). Macroeconomic uncertainty and conditional stock-price volatility in
frontier African markets: Evidence from Ghana. The Journal of Risk Finance, 10(4),
333-49
Beltratti, A.& Morano, C. (2006). Breaks and Persistency: macroeconomic causes of stock
market volatility. Journal of Econometrics, 131, 151-77
Chen, N., Richard R. & Stephen, A.R. (1986). Economic forces and the stock market. Journal
of Business, 59(3), 383-403
Dickey, D. A. & Fuller, W.A. (1979). Distribution of the estimators for auto-regression time
series with a unit root. Journal of the American Statistical Association, 10, 291-321
Ghosh, D.K. & Ariff, M. (2004). Global financial markets, 1st edition, Greenwood Publishing
group, Inc, USA
Hanousek, J.& Kocenda, E. (2011). Foreign news and spillovers in emerging European stock
markets. Review of International Economics, 19(1), 170-88
Page 15
Assessing the equilibrium relationship between macroeconomic variables and the Malaysian stock market:
Bounds statistics Methodology
Journal of Business Management Volume 3 Issue 1 2014 14
Hatemi-J, A. &Morgan, B. (2009). An empirical analysis of the informational efficiency of
Australian equity markets. Journal of Economic Studies, 36(5), 437-45
Humpe, A. & Macmillan, P. (2009). Can macroeconomics variables explain long-term stock
market movements? A comparison of the US and Japan. Applied Financial Economics,
19(2), 111-19
Ibrahim, M.H. (1999). Macroeconomic variables and stock prices in Malaysia: an empirical
analysis. Asian Economic Journal, 13(2), 219-31
Ibrahim, M.H. & Aziz, H. (2003). Macroeconomic variables and the Malaysian equity market
a view through rolling subsamples. Journal of Economic Studies, 30, 6-27
Kizys, R. & Pierdzioch, C. (2009). Changes in the international co-movement of stock returns
and asymmetric macroeconomic shocks. Journal of International Financial Markets,
Institutions and Money, 19, 289-305
Liu, M. & Shrestha, K.M. (2008). Analysis of the long-term relationship between macro-
economy variables and the Chinese stock market using heteroscedastic co-integration.
Managerial Finance, 34(11), 744-55
Nguyen, T. (2011). US macroeconomic news spillover effects on Vietnamese stock market.
Journal of Risk Finance, 12(5), 1-16
Pal, K. & Mittal, R. (2011). Impact of macroeconomic indicators on Indian capital markets.
Journal of Risk Finance, 12(2), 84-97
Pan, M.H., Fok, R.C.W & Liu, Y.A. (2007). Dynamic linkages between exchange rates and
stock prices: Evidence from East Asian markets. International Review of Economics
and Finance, 16, 503-520
Pesaran, M.H.,Shin, Y. & Smith, R.J. (2001). Bounds testing approach to the analysis of level
relationships. Journal of Applied Econometrics. 16, 289-326
Phillips, P.C.B. & Perron, P. (1988). Testing for a unit root in time series regression. Biometrika,
75, 335-46
Rjoub, H., Tursoy, T. & Gunsel, N. (2009). The effects of macroeconomic factors on stock
returrns: Istanbul stock market. Studies in Economics and Finance, 26(1), 36-45
Tsoukalas, D. (2003). Macroeconomic factors and stock prices in the emerging Cypriot equity
market. Managerial Finance, 29(4), 87-92
Verma, R. & Ozuna, T. (2005). Are emerging equity markets responsive to cross-country
macroeconomic movements? Evidence from Latin America. Journal of International
Finance Markets, Institutions and Money, 15, 73-87
Page 16
Liquidity aspects of large corporate business: A study with reference to listed companies in India
Journal of Business Management Volume 3 Issue 1 2014 15
LIQUIDITY ASPECTS OF LARGE CORPORATE BUSINESS: A STUDY WITH
REFERENCE TO LISTED COMPANIES IN INDIA
S.Chakraborty,
[email protected]
B.B.Sarkar
[email protected]
Indira Gandhi National Open University
Raveesh Krishnankutty
[email protected]
ICFAI University
Bhushan Chandra Das
[email protected]
M.B.B. College, Agartala, Tripura
ABSTRACT
The present study examines the determinants of liquidity of listed companies in India. The
analysis is based on data collected from 219 large companies of Bombay Stock Exchange 500
index. The study evaluates the determinants of liquidity by using current ratio as well as
quick ratio as the dependent variables. We found current assets to total assets, operating
profit margin and receivable days positively determine the level of liquidity. Payable days,
trade debtors to current assets, current liability to total assets and size of the firm negatively
determine the liquidity.
Keywords: liquidity, panel data, current ratio
INTRODUCTION
Liquidity is a prerequisite for the survival of any firm (Khan and Jain 2011). The major ratios
which indicate liquidity are current ratio (current assets divided by current liability) and quick
ratio or acid-test ratio (current assets minus inventories divided by current liability). There are
also some other ratios such as cash ratio and net working capital. Current ratio is a measure of
short term solvency. Current ratio of 2:1 is considered as an ideal ratio (Pandey, 2011; Khan
and Jain, 2011; Chandra, 2008). Current ratio of 2: 1 indicates that for every one rupee of
current liability the firm is having 2 rupees of current assets. However, in the case of the quick
ratio inventory is omitted from the current assets, because an asset is considered liquid only
when it can be converted into cash immediately without a loss of value (Pandey, 2011). A
ratio of 1:1 is considered as the ideal quick ratio.
Page 17
Liquidity aspects of large corporate business: A study with reference to listed companies in India
Journal of Business Management Volume 3 Issue 1 2014 16
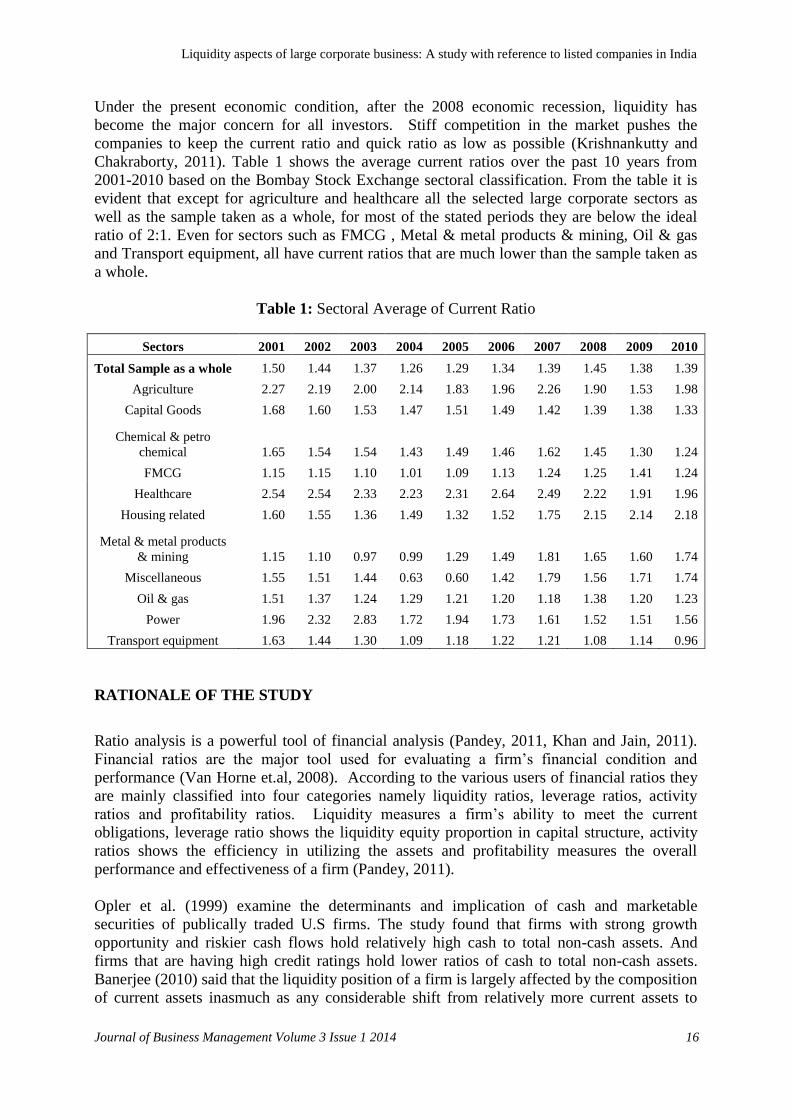
Under the present economic condition, after the 2008 economic recession, liquidity has
become the major concern for all investors. Stiff competition in the market pushes the
companies to keep the current ratio and quick ratio as low as possible (Krishnankutty and
Chakraborty, 2011). Table 1 shows the average current ratios over the past 10 years from
2001-2010 based on the Bombay Stock Exchange sectoral classification. From the table it is
evident that except for agriculture and healthcare all the selected large corporate sectors as
well as the sample taken as a whole, for most of the stated periods they are below the ideal
ratio of 2:1. Even for sectors such as FMCG , Metal & metal products & mining, Oil & gas
and Transport equipment, all have current ratios that are much lower than the sample taken as
a whole.
Table 1: Sectoral Average of Current Ratio
Sectors 2001 2002 2003 2004 2005 2006 2007 2008 2009 2010
Total Sample as a whole 1.50 1.44 1.37 1.26 1.29 1.34 1.39 1.45 1.38 1.39
Agriculture 2.27 2.19 2.00 2.14 1.83 1.96 2.26 1.90 1.53 1.98
Capital Goods 1.68 1.60 1.53 1.47 1.51 1.49 1.42 1.39 1.38 1.33
Chemical & petro
chemical 1.65 1.54 1.54 1.43 1.49 1.46 1.62 1.45 1.30 1.24
FMCG 1.15 1.15 1.10 1.01 1.09 1.13 1.24 1.25 1.41 1.24
Healthcare 2.54 2.54 2.33 2.23 2.31 2.64 2.49 2.22 1.91 1.96
Housing related 1.60 1.55 1.36 1.49 1.32 1.52 1.75 2.15 2.14 2.18
Metal & metal products
& mining 1.15 1.10 0.97 0.99 1.29 1.49 1.81 1.65 1.60 1.74
Miscellaneous 1.55 1.51 1.44 0.63 0.60 1.42 1.79 1.56 1.71 1.74
Oil & gas 1.51 1.37 1.24 1.29 1.21 1.20 1.18 1.38 1.20 1.23
Power 1.96 2.32 2.83 1.72 1.94 1.73 1.61 1.52 1.51 1.56
Transport equipment 1.63 1.44 1.30 1.09 1.18 1.22 1.21 1.08 1.14 0.96
RATIONALE OF THE STUDY
Ratio analysis is a powerful tool of financial analysis (Pandey, 2011, Khan and Jain, 2011).
Financial ratios are the major tool used for evaluating a firm‟s financial condition and
performance (Van Horne et.al, 2008). According to the various users of financial ratios they
are mainly classified into four categories namely liquidity ratios, leverage ratios, activity
ratios and profitability ratios. Liquidity measures a firm‟s ability to meet the current
obligations, leverage ratio shows the liquidity equity proportion in capital structure, activity
ratios shows the efficiency in utilizing the assets and profitability measures the overall
performance and effectiveness of a firm (Pandey, 2011).
Opler et al. (1999) examine the determinants and implication of cash and marketable
securities of publically traded U.S firms. The study found that firms with strong growth
opportunity and riskier cash flows hold relatively high cash to total non-cash assets. And
firms that are having high credit ratings hold lower ratios of cash to total non-cash assets.
Banerjee (2010) said that the liquidity position of a firm is largely affected by the composition
of current assets inasmuch as any considerable shift from relatively more current assets to
Page 18
Liquidity aspects of large corporate business: A study with reference to listed companies in India
Journal of Business Management Volume 3 Issue 1 2014 17
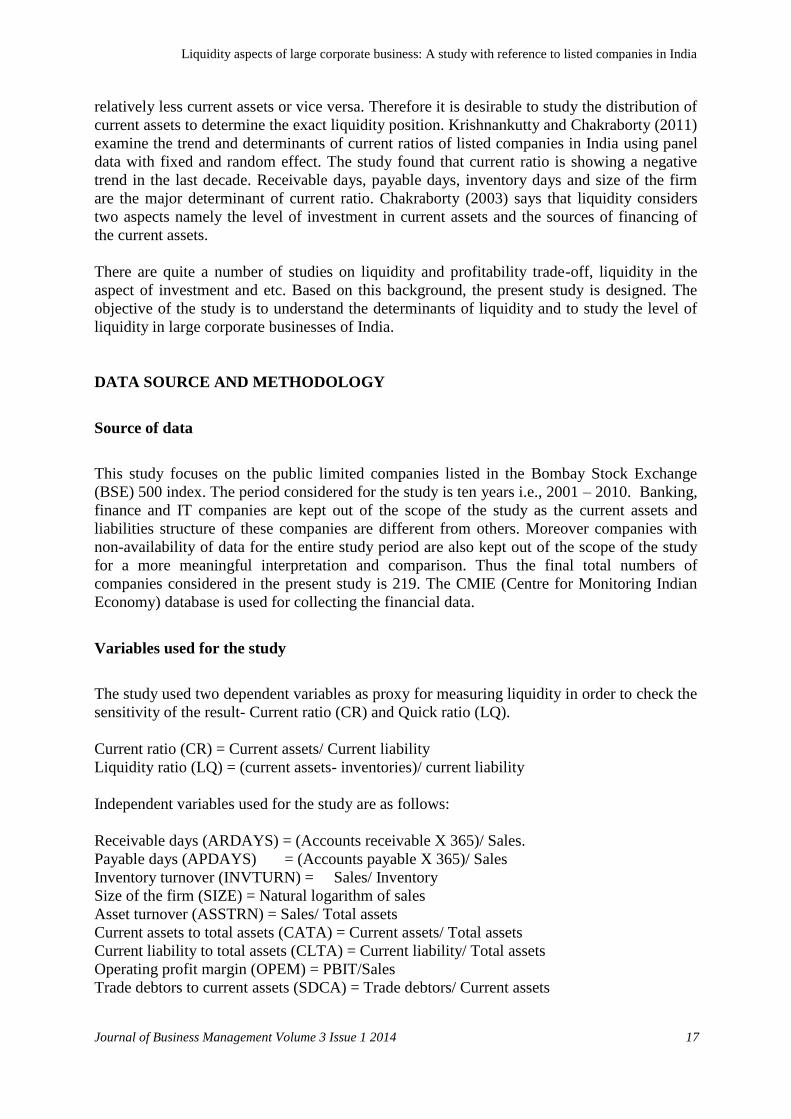
relatively less current assets or vice versa. Therefore it is desirable to study the distribution of
current assets to determine the exact liquidity position. Krishnankutty and Chakraborty (2011)
examine the trend and determinants of current ratios of listed companies in India using panel
data with fixed and random effect. The study found that current ratio is showing a negative
trend in the last decade. Receivable days, payable days, inventory days and size of the firm
are the major determinant of current ratio. Chakraborty (2003) says that liquidity considers
two aspects namely the level of investment in current assets and the sources of financing of
the current assets.
There are quite a number of studies on liquidity and profitability trade-off, liquidity in the
aspect of investment and etc. Based on this background, the present study is designed. The
objective of the study is to understand the determinants of liquidity and to study the level of
liquidity in large corporate businesses of India.
DATA SOURCE AND METHODOLOGY
Source of data
This study focuses on the public limited companies listed in the Bombay Stock Exchange
(BSE) 500 index. The period considered for the study is ten years i.e., 2001 – 2010. Banking,
finance and IT companies are kept out of the scope of the study as the current assets and
liabilities structure of these companies are different from others. Moreover companies with
non-availability of data for the entire study period are also kept out of the scope of the study
for a more meaningful interpretation and comparison. Thus the final total numbers of
companies considered in the present study is 219. The CMIE (Centre for Monitoring Indian
Economy) database is used for collecting the financial data.
Variables used for the study
The study used two dependent variables as proxy for measuring liquidity in order to check the
sensitivity of the result- Current ratio (CR) and Quick ratio (LQ).
Current ratio (CR) = Current assets/ Current liability
Liquidity ratio (LQ) = (current assets- inventories)/ current liability
Independent variables used for the study are as follows:
Receivable days (ARDAYS) = (Accounts receivable X 365)/ Sales.
Payable days (APDAYS) = (Accounts payable X 365)/ Sales
Inventory turnover (INVTURN) = Sales/ Inventory
Size of the firm (SIZE) = Natural logarithm of sales
Asset turnover (ASSTRN) = Sales/ Total assets
Current assets to total assets (CATA) = Current assets/ Total assets
Current liability to total assets (CLTA) = Current liability/ Total assets
Operating profit margin (OPEM) = PBIT/Sales
Trade debtors to current assets (SDCA) = Trade debtors/ Current assets
Page 19
Liquidity aspects of large corporate business: A study with reference to listed companies in India
Journal of Business Management Volume 3 Issue 1 2014 18
Panel least square with fixed and random effect
The study used balanced panel data for the analysis. A data set contains observations on
different objects studied over a period of time and this is called panel data. It is a combination
of cross-sectional data and time series data. In balanced panel data same time period must be
available for all cross-sections.
To analyse the liquidity, the study proposes the panel least square with fixed and random
effects. For assessing the relationship between liquidity and its determinants static panel data
models are used. There are three types of panel data models: a pooled Ordinary Least Squire
(OLS) regression, panel model with random effects and the panel model with fixed effects.
The evaluation of a pooled OLS regression can be presented in the following way:
)1......(,.........)()()()(
)()()()()(
987
543210
ititititit
itititititit
CLTASDCAOPEMCATA
SATAINVTURNSIZEAPDAYSARDAYCR
)2......(,.........)()()()(
)()()()()(
987
543210
ititititit
itititititit
CLTASDCAOPEMCATA
SATAINVTURNSIZEAPDAYSARDAYLQ
Where i indexes firms, t indexes time,β1, β2, β3……….. β9 are the coefficients of
independent variables. CRit is the current ratio while LQit is quick ratio. Both are measures for
liquidity. ARDAYSit is receivable days, APDAYS it is payable days, INVTURNit is inventory
turnover, SIZEit is size of the firm, SATAit is asset turnover, CATAit is the current assets to
total assets, CLTAit is current liability to total assets, OPEMit is operating profit margin,
SDCA is trade debtors to current assets and it is the error term which is assumed to have a
normal distribution and varies over both company and time. However, by using a pooled OLS
regression, firms‟ unobservable individual effects are not controlled, and so, as Bevan and
Danbolt (2004) conclude, heterogeneity, a consequence of not considering those effects, can
influence measurements of the estimated parameters. By using panel models of random or
fixed effects, it is possible to control the implications of firms‟ non-observable individual
effects on the estimated parameters. Therefore, by considering the existence of non-
observable individual effects, we have:
)3......(,.........,)()()()(
)()()()()(
987
543210
ititititit
itititititit
uCLTASDCAOPEMCATA
SATAINVTURNSIZEAPDAYSARDAYCR
)4......(,.........,)()()()(
)()()()()(
987
543210
ititititit
itititititit
uCLTASDCAOPEMCATA
SATAINVTURNSIZEAPDAYSARDAYLQ
where ,itiitu with i being firms‟ unobservable individual effects. The difference
between a polled OLS regression and a model considering unobservable individual effects lies
precisely in i .
Page 20
Liquidity aspects of large corporate business: A study with reference to listed companies in India
Journal of Business Management Volume 3 Issue 1 2014 19
To test the relevance of unobservable individual effects, the study used the LM (Lagrange
Multiplier) test. This tests the null hypothesis of irrelevance of unobservable individual
effects against the alternative hypothesis of relevance of unobservable individual effects. Not
rejecting the null hypothesis, we conclude that unobservable individual effects are not
relevant, and so a pooled OLS regression would be an appropriate way of carrying out
evaluation of liquidity determinants. On the contrary, if we reject the null hypothesis that
unobservable individual effects are not relevant, we can conclude that a pooled OLS
regression is not the most appropriate way of carrying out analysis of the relationship between
liquidity and its determinants.
However, there may be correlation between firms‟ unobservable individual effects and
liquidity determinants. If there is no correlation between firms‟ unobservable individual
effects and liquidity determinants, the most appropriate way of carrying out evaluation is by
using a panel model of random effects. If there is correlation between firms‟ individual effects
and liquidity determinants, the most appropriate way of carrying out evaluation is using a
panel model admitting the existence of fixed effects. For testing the possible existence of
correlation, we use the Hausman test. This tests the null hypothesis of non-existence of
correlation between unobservable individual effects and the explanatory variables, in this
study, liquidity determinants, against the null hypothesis of existence of correlation. By not
rejecting the null hypothesis, we can conclude that correlation is not relevant, and a panel
model of random effects is the correct way of carrying out evaluation of the relationship
between liquidity and its determinants. On the other hand, by rejecting the null hypothesis, we
conclude that correlation is relevant, and so the most appropriate way to carry out evaluation
of the relationship between liquidity and its determinants is by using a panel model of fixed
effects. In this study, we also present the evaluation of the most appropriate panel model,
according to the results of the LM and Hausman tests which is consistent with the existence of
first order autocorrelation.
Quantile regression analysis
Quantile regression (Koenker and Bassett 1978; Koenker and Hallock 2001) is a method for
fitting a regression line through the conditional quantiles of a distribution. It allows the
examination of the relationship between a set of independent variables and the different
parts of the distribution of the dependent variable. Quantile regression overcomes some of
the disadvantages of the conditional mean framework built upon central tendencies, which
tend to lose information on phenomena whose tendencies are toward the tails of a given
distribution (Hao and Naiman 2007). The use of quantile regression approach is chosen also
because of skewed distribution of CR, LQ, ARDAYS, APDAYS, SIZE, INVTURN, SATA,
CATA, CLTA, OPEM, and SDCA (see the evidence in Table 2). Since in such case the
usual assumption of normally distributed error terms is not warranted and could lead to
unreliable estimates. Furthermore, companies analyzed are fundamentally heterogeneous
and it may make little sense to use regression estimators that implicitly focus on the
„average effect for the average company‟ by giving summary point estimates for
coefficients. Instead, quantile regression techniques are robust to outliers and are able to
describe the influence of the regressors over the entire conditional distribution of CR, LQ,
ARDAYS, APDAYS, SIZE, INVTURN, SATA, CATA, CLTA, OPEM, and SDCA.
Page 21
Liquidity aspects of large corporate business: A study with reference to listed companies in India
Journal of Business Management Volume 3 Issue 1 2014 20
Standard least squares regression techniques provide summary point estimates that calculate
the average effect of the independent variables on the „average company‟. However, this
focus on the average company may hide important features of the underlying relationship.
As Mosteller and Tukey (1977, pp.266) correctly argued, “What the regression curve does is
give a grand summary for the averages of the distributions corresponding to the set of x‟s.
We could go further and compute several regression curves corresponding to the various
percentage points of the distributions and thus get a more complete picture of the set.
Ordinarily this is not done, and so regression often gives a rather incomplete picture. Just as
the mean gives an incomplete picture of a single distribution, so the regression curve gives a
correspondingly incomplete picture for a set of distributions. Quantile regression techniques
can therefore help us obtain a more complete picture of the underlying relationship between
liquidity (CR, LQ) and its determinants. In our case, estimation of linear models by quantile
regression may be preferable to the usual regression methods for a number of reasons.
While the optimal properties of standard regression estimators are not robust to modest
departures from normality, quantile regression results are characteristically robust to
outliers and heavy tailed distributions. In fact, the quantile regression solution 0̂ is
invariant to outliers of the dependent variable that tend to (Buchinsky, 1994). Another
advantage is that, while conventional regressions focus on the mean, quantile regressions
are able to describe the entire conditional distribution of the dependent variable. In the
context of this study, all determinants of liquidity (CR, LQ) are of interest in their own right,
we do not want to dismiss them as outliers, but on the contrary we believe it would be
worthwhile to study them in detail. This can be done by calculating coefficient estimates at
various quantiles of the conditional distribution. Finally, a quantile regression approach
avoids the restrictive assumption that the error terms are identically distributed at all points
of the conditional distribution. Relaxing this assumption allows us to acknowledge company
heterogeneity and consider the possibility that estimated slope parameters vary at different
quantiles of the conditional distribution of all determents of liquidity.
The quantile regression model, first introduced by Koenker and Bassett (1978), can be
written as:
ititit xy 0
'
with 0
'| ititit xxyQuant (5)
where i denotes company, t denotes time, ity is the dependent variable, itx is a vector of
regressors, is the vector of parameters to be estimated, and is a vector of residuals. itit xyQuant | denotes the
th conditional quantile of ity given itx . The th regression
quantile ,10 solves the following problem:
n
i
it
xyti
itit
xyti
ititn
xyxyn
itititit1:,
'
:,
' 1min||)1(||
1min
''
(6)
where )( , which is known as the „check function‟, is defined as”:
0)1(
0)(
itit
itit
itif
if
(7)
Page 22
Liquidity aspects of large corporate business: A study with reference to listed companies in India
Journal of Business Management Volume 3 Issue 1 2014 21
Equation (6) is then solved by linear programming methods. As one increases
continuously from 0 to 1, one traces the entire conditional distribution of ity , conditional on
itx (Buchinsky 1998).
Here we assume that CR and LQ is the function of ARDAYS, APDAYS, SIZE, INVTURN,
SATA, CATA, CLTA, OPEM, and SDCA. Due to the advantages (as stated above) of
quantile regression estimation technique over OLS, fixed and random effect models in the
study, we examined at the 5th
, 25th
, 50th
, 75th
and 95th
quantiles as shown here for first and
second specifications respectively:
it
it
CLTASDCAOPEMCATASATA
INVTURNSIZEAPDAYSARDAYSCRQ
05.5,05.5,05.5,05.5,05.5,05.
4,05.3,05.2,05.1,05.05.05. )(
(8)
it
it
CLTASDCAOPEMCATASATA
INVTURNSIZEAPDAYSARDAYSCRQ
25.5,25.5,25.5,25.5,25.5,25.
4,25.3,25.2,25.1,25.25.25.. )(
(9)
it
it
CLTASDCAOPEMCATASATA
INVTURNSIZEAPDAYSARDAYSCRQ
5.5,5.5,5.5,5.5,5.5,5.
4,5.3,5.2,5.1,5.5.5. )(
(10)
it
it
CLTASDCAOPEMCATASATA
INVTURNSIZEAPDAYSARDAYSCRQ
75.5,75.5,75.5,75.5,75.5,75.
4,75.3,75.2,75.1,75.75.75. )(
(11)
it
it
CLTASDCAOPEMCATASATA
INVTURNSIZEAPDAYSARDAYSCRQ
95.5,95.5,95.5,95.5,95.5,95.
4,95.3,95.2,95.1,95.95.95. )(
(12)
it
it
CLTASDCAOPEMCATASATA
INVTURNSIZEAPDAYSARDAYSLQQ
05.5,05.5,05.5,05.5,05.5,05.
4,05.3,05.2,05.1,05.05.05. )(
(13)
it
it
CLTASDCAOPEMCATASATA
INVTURNSIZEAPDAYSARDAYSLQQ
25.5,25.5,25.5,25.5,25.5,25.
4,25.3,25.2,25.1,25.25.25.. )(
(14)
it
it
CLTASDCAOPEMCATASATA
INVTURNSIZEAPDAYSARDAYSLQQ
5.5,5.5,5.5,5.5,5.5,5.
4,5.3,5.2,5.1,5.5.5. )(
(15)
it
it
CLTASDCAOPEMCATASATA
INVTURNSIZEAPDAYSARDAYSLQQ
75.5,75.5,75.5,75.5,75.5,75.
4,75.3,75.2,75.1,75.75.75. )(
(16)
it
it
CLTASDCAOPEMCATASATA
INVTURNSIZEAPDAYSARDAYSLQQ
95.5,95.5,95.5,95.5,95.5,95.
4,95.3,95.2,95.1,95.95.95. )(
(17)
Page 23
Liquidity aspects of large corporate business: A study with reference to listed companies in India
Journal of Business Management Volume 3 Issue 1 2014 22
We used sqreg module of STATA 11 for simultaneous quantile regression estimation and
obtain an estimate of the entire variance-covariance of the estimators by bootstrapping with
100 bootstrap replications. Simultaneous quantile regression is a robust regression technique
that accounts for the non-normal distribution of error terms and heteroskedasticity (Koenker
and Bassett 1978; Koenker and Hallock 2001). Unlike traditional linear models, such as
OLS regression, that assume that estimates have a constant effect, simultaneous quantile
regression can illustrate if independent variables have non-constant or variable effects
across the full distribution of the dependent variable.
RESULTS
Panel least square with fixed and random effect
Before conducting regression analysis, correlation analysis was carried out in order to find out
whether there is any evidence of severe multicollinearity among the test variables. Since we
do not find evidence of multicollinearity, regression analysis has been carried out with
incorporation of all variables simultaneously. First, we present the results of the static panel
model analysis. Results of panel data models with random and fixed effects have been
presented in Table 2.
Table 2: The Result of Panel Least Square with Fixed and Random Effects
Independent
variable
Model 3 Model 4
FE RE FE RE
ARDAYS .001359***
(0001807)
.001340***
(.0001701)
.0007274***
(.0001623)
.0007693***
(.0001509)
APDAYS -.0025031***
(0004036)
-.0028219***
(.0003958)
-.0008163**
(.0003625)
-.0009949***
(.0003529)
SIZE -.0275186
(.0232609)
-.0424685**
(.0195117)
.0358867*
(.0208895)
.0268993
(.0170912)
INVTURN .0006654
(.0004277)
.0008435**
(.0004218)
.0013438***
(.0003841)
.0014444***
(.0003763)
SATA -.1002509**
(.0463167)
-.1113813***
(.0403838)
-.1999969***
(.0415948)
-.1789142***
(.0355039)
CATA 2.483092***
(.1596137)
2.009579***
(.139276)
1.540021***
(.1433415)
1.161519***
(.1225136)
OPEM .0746823
(.0582761)
.0713454
(.0536048)
.1482225***
(.052335)
.1451047***
(.0474001)
SDCA -.8604573***
(1493588)
-.8202655***
(.1396742)
-.5290588***
(.134132)
-.4320049***
(.1237661)
CLTA -.2818231***
(.0729365 )
-.3506192***
(.065621)
-.013249
(.0655008)
-.0932999
(.0578927)
Constant 1.191029***
(.2016914)
1.556322***
(.1838392)
.2842534
(.1811294)
.4926345***
(.1612464)
Model Summary
R2 with in 0.2178 0.2137 0.1420 0.1378
R2 between 0.0664 0.0975 0.0241 0.0470
R2 overall 0.1101 0.1342 0.0576 0.0776
F- test 60.70*** 36.07***
Page 24
Liquidity aspects of large corporate business: A study with reference to listed companies in India
Journal of Business Management Volume 3 Issue 1 2014 23
Fixed effect, F-test 11.97*** 10.24***
Wald test 527.91*** 305.08***
Hausman test 79.49*** 59.87***
No.of firms 219 219 219 219
Total panel
observation
2190 2190 2190 2190
Dependent variable Current ratio Current ratio Quick ratio Quick ratio
Notes:
1. The Hausman test has χ2 distribution and tests the null hypothesis that unobservable individual effects are not
correlated with the explanatory variables, against the null hypothesis of correlation between unobservable
individual effects and the explanatory variables.
2. The Wald test has χ2 distribution and tests the null hypothesis of insignificance as a whole of the parameters of
the explanatory variables, against the alternative hypothesis of significance as a whole of the parameters of the
explanatory variables.
3. The F test has normal distribution N(0,1) and tests the null hypothesis of insignificance as a whole of the
estimated parameters, against the alternative hypothesis of significance as a whole of the estimated parameters.
4. ***, **, and *denote significance at 1, 5 and 10 % level of significance respectively.
5. FE and RE denote fixed effect and random effect respectively.
From the analysis of the results of the Wald and F tests, we can conclude that we cannot reject
the null hypothesis that the explanatory variables do not explain. Taken as a whole, the
explained variable and so the determinants selected in this study can be considered
explanatory for both the model.
The results of the Hausman test show that we cannot reject the null hypothesis in absence of
correlation between firms‟ unobservable individual effects and debt determinants. Therefore,
we can conclude that the most appropriate way to carry out evaluation of the relationship
between debt and its determinants is evaluation of a fixed effects panel model. So the study
will interpret the result based on the fixed effect model in both models.
Receivable days (ARDAYS) and current assets to total assets (CATA) are positively
significant at 1 percent in both models. However payable days (APDAYS), trade debtors to
current assets (SDCA) and sales to total assets (SATA) are negatively significant at 1 percent,
5 percent and 1 percent respectively for model 3, and 5 percent, 1 percent, and 1 percent
respectively in the case of model 4. Size (SIZE), inventory turnover (INVTURN), and
operating profit margin (OPEM) are not showing any kind of significance for model 3. But in
the case of model 4 all variables are positively determined the liquidity at 10 percent, 1
percent and 1 percent respectively. Current liability to total assets (CLTA) is negatively
significant at 1 percent in the case of model 3 and is not showing any kind of significance for
model 4.
Quantile regression
First, we present descriptive statistics of all our variables as shown in Table 3.
Page 25
Liquidity aspects of large corporate business: A study with reference to listed companies in India
Journal of Business Management Volume 3 Issue 1 2014 24
Table 3: The Result of Descriptive Statistics
Mean
Media
n
Std.
Dev.
Skewnes
s
Kurtosi
s
Jarque-
Bera
Probabilit
y
Observation
s
CR 1.66 1.40 1.09 4.35 37.26 114016.50 0.00 2190
QR 0.91 0.71 0.89 5.28 53.86 246242.40 0.00 2190
ARDAYS
119.6
3 81.25 189.79 11.36 203.02 3697717.00 0.00 2190
APDAYS 54.06 44.55 50.36 11.86 311.11 8714126.00 0.00 2190
SIZE 6.95 6.88 1.55 0.26 4.24 164.33 0.00 2190
INVTUR
N 13.05 7.30 45.00 20.76 572.23 29724637.00 0.00 2190
SATA 1.01 0.87 0.72 2.41 14.97 15200.36 0.00 2190
CATA 0.49 0.48 0.22 0.18 2.17 75.12 0.00 2190
CLTA 0.28 0.24 0.17 0.92 3.44 326.97 0.00 2190
OPEM 0.24 0.15 0.62 14.20 255.57 5894525.00 0.00 2190
SDCA 0.46 0.46 0.19 0.10 2.63 16.83 0.00 2190
Table 4 shows one measures of tails i.e. the kurtosis among other descriptive statistics. It is
well known that whenever this quantity exceeds 3, we can conclude that the data feature
excess kurtosis, or that their distribution is leptokurtic i.e. it has heavy tails. It is evident
from Table 1 that except for CATA, CLTA and SDCA distribution of all variables is
leptokurtic. This shows that data is not normal which is also proved with the JB test statistic.
JB test statistics shows, in particular, that no variables have the feature of normality.
Therefore, estimation technique (like OLS) based linear Gaussian models will be biased and
the use of quantile regression estimation is more appropriate. Therefore, the study applied
quantile regression estimation technique and reported result of quantiles }95.0,75.0,50.0,25.0,05.0{ is available in Table 4 below.
Table 4: The Result of Quantile Regression
Variable/Quantile 0.05 0.25 0.50 0.75 0.95
ARDAYS -.0000148
(.0001336)
.0000458
(.000141)
.0006652*
(.0004027)
.0024982***
(.0009622)
.0064441***
(.0009615)
APDAYS -.0003102
(.0002405)
-.0008817***
(.000244)
-.0009839*
(.000502)
-.0055724 ***
(.0017402)
-.0106295**
(.0042633)
SIZE -.0116334*
(.0065733)
-.0100971*
(.0055473)
-.014754*
(.0083752)
-.1070995***
(.0266563)
-.2496088***
(.0331077)
INVTURN .0004743
(.0009316)
.0006844
(.0005639)
.0015268 **
(.0006534)
.0010218
(.0011177)
.0000451
(.0017497)
SATA -.0200322
(.0227599)
-.0067823
(.0153479)
.0046304
(.0220382)
-.052079
(.0571485)
-.1080383
(.0694277)
CATA 1.284888***
(.0750841)
1.602161***
(.0804146)
1.709484***
(.137283)
1.104016***
(.4100967)
-.1620684
(.2606661)
OPEM -.02974
(.0345951)
.0267738
(.059165 )
.0665217
(.1426374)
.7173953
(.4456597)
1.343607***
(.4033663)
SDCA -.1734254***
(.0659588)
-.2134072***
(.0608423)
-.2768251***
(.0980112)
-.8202248***
(.2841327)
-2.801899***
(.332155)
CLTA -.7836924***
(.0911939)
-1.494018***
(.1094826)
-2.037849***
(.209865 )
-1.064997
(.776718 )
-.1649004**
(.0709893)
constant .7441981***
(.0775229)
1.07581***
(.0776037)
1.375898***
(.0880631)
2.686525***
(.3909906)
5.817202***
(.4222078)
Model summary
Pseudo R2 0.2463 0.1963 0.1605 0.1463 0.2447
Page 26
Liquidity aspects of large corporate business: A study with reference to listed companies in India
Journal of Business Management Volume 3 Issue 1 2014 25
Dependent variable : Current ratio(CR)
Note: ***, **, and *denote significance at 1, 5 and 10 % level of significance respectively.
It is evident from Table 4 that receivable days (ARDAYS) is not showing a significant level
for 0.05th
and 0.25th
quantile but in the case of 0.50th
, 0.75th
and 0.95th
quantiles, they are
positively significance at 10 percent, 1 percent and 1 percent respectively. Except for the
lowest quantile of 0.05th
, payable days (APDAYS) is showing a negative significant in all
other quantiles with 1 percent, 10 percent, 1 percent and 5 percent respectively. Size of the
firm (SIZE) is showing a negative significance irrespective of the quantile with 10 percent,
10 percent, 10 percent, 1 percent and 1 percent respectively. Inventory turnover (INVTURN)
is showing a positive significance at 5 percent only in the case of median quantile (0.50)
and all other cases are not showing any significance. Sales to total assets (SATA) is not
showing any kind of significance irrespective of the quantile. Except for the highest quantile
i.e. 0.95th
, all other cases of current assets to total assets (CATA) is positively significant at
1 percent. Operating profit margin (OPEM) is positively significant at 1 percent only in the
highest quantile 0.95th
while all other cases are not showing significance result. Trade
debtors to current assets (SDCA) are negatively significant at 1 percent irrespective of the
quantiles. Constant is positively significant at 1 percent irrespective of the quantiles.
Table 5: The Result of Quantile Regression
Variable/Quantile 0.05 0.25 0.50 0.75 0.95
ARDAYS .0001704**
(.000082 )
.0000507
(.0001502)
.0002138
(.0001957)
.001535***
(.0005653)
.0050529***
(.0008062)
APDAYS -.0001728
(.0001936)
-.0006685***
(.0002424)
-.0009442**
(.0004246)
-.003045***
(.0008896)
-.001586
(.0024815)
SIZE -.0082464**
(.0038967)
.0019985
(.0047509)
-.009198
(.0077416)
-.0125959
(.0155781)
.0506542
(.0575565)
INVTURN -.0002293
(.0003509)
-.0000676
(.0007831)
.0019822
(.0014558)
.0032103**
(.0015054)
.002015
(.0029973)
SATA .0486478***
(.0108099)
.0227531*
(.0124971)
-.0061727
(.0186605)
-.0776478***
(.029639)
-.2121861***
(.0576296)
CATA .270684***
(.0517543)
.5389883***
(.0660343)
.5342399***
(.1249824)
.449313**
(.1766196)
.2226931
(.2812334)
OPEM .0649691*
(.0366213)
.1630878***
(.0405958)
.2647922***
(.0667938)
.1387364***
(.1749885)
1.296822*
(.6808432)
SDCA .3295429***
(.0533951)
.6128637***
(.044715)
.4985588***
(.0661216)
-.2017263
(.1540333)
-1.510364***
(.3855738)
CLTA -.0894916
(.0565402)
-.2570917***
(.0872533)
-.3542804*
(.1959924)
-.0890996
(238902)
-.2188621***
(.0735277)
constant .0023406**
(.0437993)
-.0165878
(.0475904)
.3377901***
(.0888365)
1.055545***
(.1523291)
1.925666***
(.5318802)
Model summary
Pseudo R2 0.0564 0.0836 0.0622 0.0671 0.1707
Dependent variable : Quick ratio (LQ)
Note: ***, **, and *denote significance at 1, 5 and 10 % level of significance respectively.
Table 5 shows the result of quantile regression for the Quick ratio as the dependent variable.
Receivable days (ARDAYS) are positively significant at 5 percent for the lowest quantile of
0.05th
while 0.25th
and 0.50 are not showing any significance. In the case of 0.75th
and 0.95th,
both are positively significant at 1 percent. In the case of payable days (APDAYS), the lowest
quantile 0.05th
and the highest quantile 0.95th
are not significant. All other cases i.e., 0.25th
,
Page 27
Liquidity aspects of large corporate business: A study with reference to listed companies in India
Journal of Business Management Volume 3 Issue 1 2014 26
0.50th
and 0.75th
, they are negatively significant at 1 percent, 5 percent and 10 percent level
respectively. However size of the firm (SIZE) is negatively significant at 5 percent only for
the lowest quantile. All other cases are not showing any kind of significance. Inventory
turnover (INVTURN) is not showing any significance except for the 0.75th
quantile. For this
quantile, it is positively significant at 5 percent. Sales to total assets (SATA) are positively
significant at 1 percent and 10 percent for 0.05th and 0.25th quantiles respectively. 0.50th
quantile is not showing any significance and in the case of 0.75th
and 0.95th
quantiles, they are
negatively significant at 1 percent. Except for the highest quantile 0.95th
, current assets to
total assets (CATA) is positively significant at 1 percent, 1 percent, 1 percent and 5 percent
respectively. Operating profit margin (OPEM) is the only one variable showing positive
significance irrespective of the quantiles at 10 percent, 1 percent, 1 percent, 1 percent and 10
percent respectively. Trade debtors to current assets (SDCA) are positively significant at 1
percent for 0.05th
, 0.25th
and 0.50th
quantile. 0.75th
quantile is also not showing significance
value. For the highest quantile i.e. 0.95th
, it is negatively significant at 1 percent. Current
assets to total assets (CLTA) is negatively significant for 0.25th
, 0.50 and 0.95th
quantile at 1
percent, 10 percent and 1 percent respectively. In the case of constant, except for 0.25th
quantile, all other cases are positively significant at 1 percent.
CONCLUSION
The study intends to identify the determinants of liquidity for Indian firms using a panel
framework. The study has taken current ratio as well as quick ratio as dependent variable in
checking the sensitivity of the ratios. For the analysis, we have taken 219 firms (from the
BSE 500 firms based on the availability of data) during the period 2001-2010, comprising a
panel model with fixed and random effects. However, most of the variables show skewed
distribution and therefore, we relied upon quantile regression analysis as an appropriate tool
and quantiles used for our case are }95.0,75.0,50.0,25.0,05.0{ .
We found that the fixed and random effect model are not performing well. The overall
study find that Receivable days are positively determined the liquidity in the case of upper
quantiles (0.75th
, 0.95th
). However the payable days are negatively determining the liquidity
of the lower quarter to upper quarter quantiles (0.25th
- 0.75th
). Size of the firm is
negatively determining the liquidity only for the lowest quantile (0.05th
). Inventory turnover
does not have any impact on determining the liquidity. In case of sales to total assets we are
unable to draw any kind conclusion because of the un-common result in both models.
Current assets to total assets are positively determining the liquidity except for the upper
quantile (0.95th)
. Operating profit margin is positively determining the liquidity in upper
quantile (0.95th
). Trade debtors to current assets negatively determine the liquidity in upper
quantiles (0.75th
, 0.75th
). In the case of lower quantile, it is showing a significance value in
opposite signs. Current liability to total assets negatively determines the liquidity in the
case of 0.25th
, 0.50th
and 0.95th
quantile.
REFERENCES
Bevan, A.A. and Daubolt, J. (2001) „Testing for inconsistencies in the estimation of UK
capital structure determinants‟, Working Paper, No. 2001/4, Department of
Accounting and Finance, University of Glasgow, Glasgow G 12 *LE
Page 28
Liquidity aspects of large corporate business: A study with reference to listed companies in India
Journal of Business Management Volume 3 Issue 1 2014 27
Buchinsky, M. (1998). Recent advances in quantile regression models: a practical guide for
empirical research. Journal of Human Resources, 33, 88-126
Banerjee, B. (2010) Financial policy and management accounting. 7th
Edition. New Delhi:
PHI Learning Pvt.Ltd
Chandra, P. (2008) Financial management theory and practice. 7th
Edition. New Delhi: Tata
McGraw Hill Publish Company Limited. 7th
Edition
Hao, L. and Naiman, D.Q. (2007). Quantile regression. Thousand Oaks, CA: Sage
Khan, M.Y. and Jain, P.K. (2011) Financial management text problems and cases. 6th
Edition. New Delhi: Tata McGraw Hill Publish Company Limited
Koenker, R., & Bassett, G. (1978). Regression quantiles. Econometrica, 46, 33–50
Koenker R, Hallock K.F. (2001). Quantile regression. J Econ Perspect, 15, 143–156
Krishnankutty, R & chakaraborty, K. S (2011). Determinants of current ratio. MPRA working
paper
Chakraborty, K.S.(2003). Anatomy of overtrading. New Delhi: Mittal publications
Mosteller, F., & Tukey, J. (1977). Data Analysis and Regression Addison-Wesley, Reading,
MA
Pandey, I.M. (2010). Financial management. 10th
Edition. New Delhi: Vikas publishing
house
Opler. T, Pinkowitz. L, Stulz. R and Williamson. R. (1999). The determinants and
implications of corporate cash holdings, Journal of financial economics, 52, 3-46
Page 29
An empirical study on directors’ remuneration in relation to corporate performance: A comparison between GLCs and Non-GLCs in Malaysia
Journal of Business Management Volume 3 Issue 1 2014 28
AN EMPIRICAL STUDY ON DIRECTORS’ REMUNERATION IN RELATION TO
CORPORATE PERFORMANCE: A COMPARISON BETWEEN GLCs AND NON-
GLCs IN MALAYSIA
Lee Seng Fatt
[email protected]
Mohammad Izzat Amir Abdul Ghani
Adrian A/L Alphonsus
Prasanth Nair A/L Sasedharan
Universiti Tenaga Nasional
ABSTRACT
The capital of the Government-linked Companies (GLCs) and Non-GLCs is structured
differently whereby GLCs are companies with government having a direct controlling stake,
which gives the government the right to appoint a board of directors, top management and to
make major decisions. This study examines the relationship between directors‟ remuneration
and corporate performance in both GLCs, and Non-GLCs in Malaysia. It aims to assess how
differently directors in GLCs, and Non-GLCs are rewarded. This study finds a significant
relationship between profit after tax and directors‟ remuneration for both GLCs and Non-
GLCs. The results also provide evidence that there is a significant difference between GLCs
and Non-GLCs‟ directors‟ remuneration.
Keywords: government-linked companies, non-government-linked companies, directors’
remuneration, corporate performance, correlation and relationship
INTRODUCTION
Considerable attention on issues of directors‟ remuneration has been given by local and
foreign researchers. The focus was generally directed on the overall level of directors‟
remuneration, suitability of performance measures linking directors‟ remuneration with
performance and also the role played by the remuneration committee in the setting of
directors‟ remuneration. The perception that directors often rewards themselves with a huge
remuneration package in relation to their effort to boost the corporate performance has fuelled
further interest.
In Malaysia, under its Code of Corporate Governance 2000, rewards should be structured to
link to corporate and individual performance. In addition, directors in Malaysia are to be
guided by the Company Directors‟ Code of Ethics to achieve the objective of ensuring proper
behavior and ethical conduct of directors. The Code of Ethics is concerned with transparency,
integrity, accountability and corporate social responsibilities of company directors. Both of
these Codes are in place for creating and sustaining a healthy investment climate.
Company in Malaysia can generally be classified either as a Government-Linked Company
(GLC) or a Non Government-Linked Company (Non-GLC). The capital of GLCs and Non-
Page 30
An empirical study on directors‟ remuneration in relation to corporate performance: A comparison between
GLCs and Non-GLCs in Malaysia
Journal of Business Management Volume 3 Issue 1 2014 29
GLCs is structured differently whereby GLCs are companies with government having their
direct controlling stake, which gives the government the right to appoint the board of directors,
top management and to make major decisions such as restructuring, financing and
acquisitions. Generally, a GLC is defined as a company in which the government owns a
majority ownership in it. Rahman and Najid (2011) defined a GLC as a company that has a
primary commercial objective and the government has a direct controlling stake through
institutions such as Khazanah, the Ministry of Finance (MOF), Kumpulan Wang Amanah
Pencen (KWAP), and Bank Negara Malaysia (BNM). This definition also extends to
companies in which the GLCs themselves have a controlling stake. A Non-GLC would be
defined as a company that has a majority ownership by individuals or private companies
whereby the government has only a minority ownership or none at all and is not related to any
of the GLCs.
This study aims to examine and compare the relationship between these two types of
companies based on information disclosed in their annual audited financial statements.
LITERATURE REVIEW
Jensen and Meckling (1976) described an agency relationship, as a contract under which one
party (the principal) engages another party (the agent) to perform some services on the
principal‟s behalf. Under the contract, the principal delegates some decision-making authority
to the agent. This would, however, trigger the agent‟s self-interests (e.g., in job protection or
career advancement) to influence their management decisions. Many researchers dealing with
directors‟ remuneration and corporate performance have their results revolved around the
Agency Theory. As stated by Murphy (1999), directors‟ remuneration is designed to align
with the interests of executives and shareholders of the company in order to minimize agency
cost. Therefore, one way to do so is to make managers‟ remuneration a function of firm
performance.
Many research studies have been done in the US and Europe in the past to assess the
relationship between directors‟ remuneration and corporate performance. Their findings
indicated a significant relationship does exist between the two variables in the USA (Mehran,
1995; Murphy, 1985) and Europe (Duffhues and Kabir, 2008; Fernandes, 2008). In Asia, most
of the research done (Unite, 2008; Firth, 2006; Kato, 2007; Mitsudome, 2008) also found a
significant relationship exists between the two variables. Previous studies by Merhebi et al.
(2006) and Firth & Cheng (2005) also reported a significant relationship between directors‟
remuneration and return on equity.
Murphy (1999) mentioned four basic components of directors‟ remuneration. They are base
salary, an annual bonus tied to accounting performance, stock options, and long-term
incentive plans, including restricted stock option plans and multi-year accounting-based
performance plans. Abugu (2012) emphasized the need to hold directors accountable to
shareholders for remuneration received. He drew the attention of scholars, law reformers and
law enforcement agencies to the inadequacies of the rules regulating directors‟ remuneration
packages.
Executives have incentives to make major corporate decisions and report income which
will affect ROA and also their remuneration. Mehran (1995) and Kato and Kubo (2006)
Page 31
An empirical study on directors‟ remuneration in relation to corporate performance: A comparison between
GLCs and Non-GLCs in Malaysia
Journal of Business Management Volume 3 Issue 1 2014 30
found that there is a relationship between ROA with directors‟ remuneration. The analysis
also found that directors‟ pay is significantly related to shareholder returns but the estimated
elasticity is small (Conyon & Gregg (1994).
Murphy (1985) conducted a research to re-examine the relationship between firms‟
performance and managerial pay, using data that focused on individual directors over
time and found that directors‟ remuneration is related to firms‟ performance. Mehran (1995)
found that remuneration structures of firms with more non-executive directors have a
higher percentage of their executive remuneration in an equity-based form. Mehran
(1994) findings also suggested that directors‟ remuneration is significantly related to the firms‟
performance.
Meanwhile, Brunello, Graziano and Parigi (2001) found that managerial pay is significantly
affected by firms‟ performance. In particular, they estimated that an increase of real profit per
firm will increase the pay of upper and middle rank directors more than the increase found for
lower management. Importantly, they also found that the sensitivity of pay to performance is
higher when the firm belongs to a multinational group, which is owned by foreign capital and
listed on a stock exchange. The interests of the shareholders and the managers can be aligned
by making managerial pay dependent on the measurement of firms‟ performance.
Furthermore, Conyon and Schwalbach (2000) stated that the link between remuneration and
company performance is an important issue for CEOs, directors and their advisors. The
incentives created from the design of remuneration packages can be a very powerful
mechanism to align the behavior of corporate executives with overall business strategy. This
incentive exists notwithstanding the fact that the extent of empirical literature on directors‟
remuneration has often demonstrated only a small quantitative association between the
rewards received by management and company performance.
Mitsudome, Weintrop and Hwang (2008) examined the relationship between changes in
remuneration and various measures of short and long-term firms‟ performance. For the
Japanese firms, they found a significant relationship between remuneration changes and
changes in the same period of accounting earnings and stock returns. The relationship
between remuneration and performance measures of Japanese firms is significant over a
longer time period. This finding is consistent with a popular belief that Japanese executives
are more concerned with, and appropriately rewarded for current as well as long-term firms‟
performance.
Feng (2007) analyzed the directors‟ compensation for Real Estate Investment Trusts (REITs)
and investigated the reactions between directors‟ compensation and other measures of the
board independence and board monitoring. They found that REITS that pay higher equity-
based compensation for their board members is associated with higher financial performance.
The analysis of Le, Trien Vinh et al. (2011) of more than 1,000 Chinese listed firms revealed
a positive association between state ownership and firm performance. They found that when
there is a higher degree of state ownership in a firm, the higher would be the firm value. Their
finding supported the claim that government ownership plays a vital role in creating firm
value in China.
Page 32
An empirical study on directors‟ remuneration in relation to corporate performance: A comparison between
GLCs and Non-GLCs in Malaysia
Journal of Business Management Volume 3 Issue 1 2014 31
THEORETICAL FRAMEWORK
Agency Theory (Jensen and Meckling, 1976) supports the framework for this study.
Managers are viewed as agents of shareholders, who hire them to run the firms. Firm
managers often have goals that conflict with the interests of shareholders. Furthermore,
managers are typically better informed about a firms‟ conditions compared to shareholders.
Agency theory suggests that it is good for shareholders to align incentives of managers with
their own incentives (Fernandes, 2008). The interests of both the shareholders and managers
can be partly aligned by making managerial pay dependent on observable measures of a
firm‟s performance.
Managers are known to be risk-averse individuals. Managers would want their remuneration
structured so that they bear the less personal risk. In order to reduce their remuneration
risk, managers may engage in activities which could reduce the firm‟s risk.
The Malaysian Code on Corporate Governance (MCCG 2000, revised 2007) emphasizes the
following principles on directors‟ remuneration. Firstly, in the case of executive directors,
remuneration should be structured so as to link rewards to corporate and individual
performance. Secondly, companies should establish a formal and transparent procedure for
developing policy on executive remuneration and for fixing the remuneration packages of
individual directors. Thirdly, company‟s annual reports should contain details of the
remuneration of each director.
METHODOLOGY
Secondary data from published financial statements of companies in Malaysia for the period
2008 to 2010 were used in this study. A total of 66 companies was selected which consist of
33 Government-Linked companies (GLCs) and 33 Non Government-Linked Companies
(Non-GLCs). The 33 GLCs selected in the sample were based on the list provided by “The
Putrajaya Committee on GLC High Performance” as at 13 March 2009. As for the Non-GLCs,
the sample selection was based on a random basis but with their corresponding industry.
All data extracted was processed using SPSS statistical software as the analysis tool.
Normality test of data was conducted to decide whether parametric or non-parametric tests
were to be used. Correlation Coefficients were generated to assess the strength of correlation
between directors‟ remuneration and corporate performance. The directors‟ remuneration
would be the total amount of remuneration received by the directors from the group as
disclosed in the notes to the financial statements. The performance measurements include
Profit after Tax (PAT), Net Profit Margin (NPM) and Return on Assets (ROA).
NPM is calculated as PAT divided by revenue. A high NPM implies that a company is
profitable and has better control over its costs relative to its business competitors. ROA
indicates how profitable the company is in relation to the total assets. It reflects how efficient
the management team is at utilizing its assets in generating its earnings.
Hypothesis testing was performed to test the existence of any relationship between the two
parameters under review.
Page 33
An empirical study on directors‟ remuneration in relation to corporate performance: A comparison between
GLCs and Non-GLCs in Malaysia
Journal of Business Management Volume 3 Issue 1 2014 32
OBSERVATIONS AND ANALYSIS
Reliability testing
The reliability of data collected was first tested for its consistency and stability by generating
the Cronbach‟s alpha coefficient. This coefficient reflects how well the items in a set are
positively correlated to one another. Cronbach‟s alpha can be measured as a correlation
coefficient range in value from 0 to 1. The closer the alpha is to 1, the higher is the internal
consistency and hence is considered as more reliable (Coakes, Steed and Ong, 2010).
Table 1: Table of Reliability Statistics
Cronbach's Alpha Number of parameters
0.751 16
The Cronbach‟s alpha value of 0.751 shows that the reliability of the sets of data collected is
acceptable.
Normality test
Normality test was performed on the various series of financial data collected to assess
whether they follow a normal distribution or Gaussian distribution. Based on the results of the
normality test, we would then decide on the type of statistical test for analysis.
Generally, statistical procedures can be grouped into parametric statistics and nonparametric
statistic. The major distinction between them lies in the underlying assumptions about the data
to be analyzed. Parametric statistics involve numbers with known, continuous distributions.
(Zikmund et al., 2006) characterized with an interval or ratio scale data from a large sample
size. Nonparametric tests are used for the data measured which do not conform to a known
normal distribution.
To determine whether the normality of the data is violated, we looked at the significance level
of the Kolmogorov-Smirnov (KS) statistic and the Shapiro-Wilk (WS) statistic. If the
significance level is greater than 0.05, then normality is assumed and parametric techniques
are used. When the data does not meet the underlying assumption of a parametric test, non-
parametric techniques would be used instead.
The normality of data collected can be assessed by referring to their respective significance
(Sig.) level columns in Table 2. As the sample size is less than one hundred, we shall refer to
the outcome of the Shapiro-Wilk test (Coakes, Steed and Ong, 2010). Based on a 5 percent
significance level, it can be inferred that most of the data series are not normally distributed,
except for a few that are marked with an asterisk.
Page 34
An empirical study on directors‟ remuneration in relation to corporate performance: A comparison between
GLCs and Non-GLCs in Malaysia
Journal of Business Management Volume 3 Issue 1 2014 33
Table 2: Test of Normality for All Variables
Variable
Kolmogorov-Smirnov Shapiro-Wilk
GLC Non-GLC GLC Non-GLC
Sig. Sig. Sig. Sig.
PAT2008 0.000 0.000 0.000 0.000
PAT2009 0.001 0.000 0.000 0.000
PAT2010 0.000 0.000 0.000 0.000
Overall 0.000 0.000 0.000 0.000
NPM2008 0.000 0.005 0.000 0.002
NPM2009 0.000 0.127* 0.000 0.013
NPM2010 0.020 0.000 0.011 0.000
Overall 0.000 0.005 0.000 0.002
ROA2008 0.001 0.006 0.000 0.003
ROA2009 0.000 0.145* 0.000 0.233*
ROA2010 0.152* 0.200* 0.106* 0.249*
Overall 0.001 0.006 0.000 0.003
DirectorRem2008 0.000 0.000 0.000 0.000
DirectorRem2009 0.000 0.000 0.000 0.000
DirectorRem2010 0.000 0.000 0.000 0.000
Overall 0.000 0.000 0.000 0.000
Table 2 shows that the directors‟ remuneration of both the GLCs and Non-GLCs for all the
periods under study does not exhibit a normal distribution. Hence, the Spearman
nonparametric coefficient would be used for testing hypothesis H1 to H6 while the Mann-
Whitney U Test was used to assess whether there is any significant difference between the
means of the two sets of sample data representing the GLCs and non-GLCs as stated in H7.
The factor causing the non-Gaussian data could be due to the limited sample size and that the
GLCs selection was based on the list of the Putrajaya Committee. This inevitably introduced a
certain degree of „biasness‟ in the sample selection.
Correlation measurement using spearman correlation coefficient and tests of hypothesis
As stated above, we would use the non-parametric measurement, Spearman correlation
coefficient, to assess the strength of the relationship between the parameters. The Spearman
Correlation Coefficient value ranges between +1 and -1. A positive coefficient indicates that
the variables are positively correlated and vice versa. A zero coefficient would be the result if
there is no relationship between the two variables.
The hypotheses of testing the relationship between the parameters are stated as follows:
H1 : There is a significant relationship between directors‟ remuneration and PAT for GLCs
in Malaysia.
H2 : There is a significant relationship between directors‟ remuneration and PAT for Non-
GLCs in Malaysia.
Page 35
An empirical study on directors‟ remuneration in relation to corporate performance: A comparison between
GLCs and Non-GLCs in Malaysia
Journal of Business Management Volume 3 Issue 1 2014 34
H3 : There is a significant relationship between directors‟ remuneration and NPM for GLCs
in Malaysia.
H4 : There is a significant relationship between directors‟ remuneration and NPM for Non-
GLCs in Malaysia.
H5 : There is a significant relationship between directors‟ remuneration and ROA for GLCs
in Malaysia.
H6 : There is a significant relationship between directors‟ remuneration and ROA for GLCs
in Malaysia.
H7 : There is a significant difference in the mean [Directors‟ remuneration / PAT]
between GLCs and Non-GLCs in Malaysia.
Based on the 5 percent significance level, if the resulted significance level or ρ-value is less
than 0.05, it would be statistically significant to reject the null hypothesis and accept the
above hypotheses. This would suggest that directors‟ remuneration and the respective
corporate performance parameter are significantly related. On the contrary, with a ρ-value of
larger than 0.05, we would accept the null hypothesis and reject the above hypothesis.
Table 3: Results on Spearman Correlation Coefficient and Significance Level between
Directors‟ Remuneration and Corporate Performance for Government Linked Companies
Variable/Year
Spearman Coefficient Significant Level (2 Tailed)
2008 2009 2010 Overall 2008 2009 2010 Overall
PAT 0.332 0.337 0.334 0.348 0.059 0.055 0.061 0.000
NPM -0.004 -0.199 -0.127 -0.097 0.982 0.267 0.495 0.346
ROA -0.105 -0.264 -0.275 -0.189 0.562 0.138 0.134 0.063
Table 4: Result on Spearman Correlation Coefficient between Directors‟ Remuneration and
Corporate Performance for Non-Government Linked Companies
Variable/Year
Spearman Coefficient Significant Level (2 Tailed)
2008 2009 2010 Overall 2008 2009 2010 Overall
PAT 0.316 0.525 0.574 0.493 0.078 0.002 0.001 0.000
NPM -0.007 -0.126 0.118 0.032 0.971 0.493 0.527 0.756
ROA 0.023 -0.104 -0.054 -0.016 0.902 0.576 0.768 0.879
Correlation analysis: degree of correlation
The results in Table 3 indicate a positive correlation coefficient between PAT and directors‟
remuneration for each of the three years and with an overall correlation coefficient of 0.348
for GLCs. Positive correlation coefficients are also found in Non-GLCs as shown in Table 4
with an overall stronger correlation coefficient of 0.493. The readings are consistent over the
Page 36
An empirical study on directors‟ remuneration in relation to corporate performance: A comparison between
GLCs and Non-GLCs in Malaysia
Journal of Business Management Volume 3 Issue 1 2014 35
years within their respective group. The results above indicate the directors‟ remuneration of
Non-GLCs has a stronger degree of correlation with Profit after tax than GLCs and their
strength of the correlation is generally moderate and positive.
The results from the tables above indicate that correlation coefficients are weak throughout
the three years between directors‟ remuneration and NPM. Table 3 indicates an unusual
negative coefficient correlation between NPM and directors‟ remuneration in GLCs with an
overall weak correlation coefficient of -0.097. The Non-GLCs, however, posses an overall
positive, but equally weak correlation coefficient of 0.032.
Both GLCs and Non-GLCs show a negative correlation coefficient between directors‟
remuneration and ROA (except for Non-GLCs in 2008). The overall coefficients are generally
weak at -0.189 and -0.016 for GLCs and Non-GLCs respectively. The GLCs‟s figures trigger
a concern as they show a gradual increase but negatively!
Significant relationship between variables
The first and second hypotheses concern whether there is any significant relationship between
directors‟ remuneration and Profit after Tax (PAT) in GLCs and Non-GLCs in Malaysia
respectively. Based on Table 3 and 4, the overall ρ-values for GLCs and Non-GLCs are less
than 0.05. Hence, there is sufficient statistical evidence to reject the null hypothesis and
support the hypothesis H1 and H2 inferring a significant relationship does exist between
directors‟ remuneration and corporate performance measured in terms of profit after tax for
both GLCs and Non-GLCs. This finding is also consistent with research outcome done by
Brunello et al. (2001) on companies in Italy.
The third and fourth hypotheses concern if there is any significant relationship between
directors‟ remuneration and net profit margin (NPM) in GLC and Non-GLC. Both the ρ-
values in Table 3 and Table 4 are more than 0.05, hence, there is insufficient statistical
evidence to reject the null hypothesis and it can be inferred that there is no significant
relationship between directors‟ remuneration and corporate performance measured in terms of
net profit margin for both GLCs and Non-GLCs in Malaysia. The weak correlation
coefficients lend further support to this finding.
The fifth and sixth hypotheses concern whether a significant relationship exists between
directors‟ remuneration and return on assets (ROA) in GLC and Non-GLC. Table 3 and 4
show all the three years 2008, 2009, 2010 and the overall ρ-values for both GLCs and Non-
GLCs are higher than 0.05 inferring no significant relationship exist between the two
parameters. The findings differ from the research findings of Mehran (1995) and Kato and
Kubo (2006). Hence, it can be inferred that irrespective of GLCs or Non-GLCs, directors‟
remuneration of companies in Malaysia do not relate to corporate performance measured in
term of ROA. This observation is consistent with the overall weak correlation coefficient
between them, especially for the Non-GLCs of -0.016.
Page 37
An empirical study on directors‟ remuneration in relation to corporate performance: A comparison between
GLCs and Non-GLCs in Malaysia
Journal of Business Management Volume 3 Issue 1 2014 36
Mann-Whitney U test
Mann-Whitney U test is used to test the seventh hypothesis stated above. The Mann-Whitney
U test is a nonparametric test specifically used to compare between means of two independent
groups of sampled data. This test is equivalent to the independent T-test. By contrast to the
parametric t-test, this non-parametric test makes no assumptions about the distribution of the
data when the assumption of normality or equality of variance is not met.
A two-tailed ρ-value is used to interpret the output from the Mann-Whitney U test. If the
result of the Mann-Whitney test has a probability greater than 0.05 (ρ value > 0.05), the null
hypothesis is accepted and equal variance estimates are assumed. This infers no significant
difference between the variances of the two groups.
Table 5: Results on Mann Whitney U Test
Co. Type N Mean Rank Sum of Ranks
DRPAT2008 Government Link
Companies
33 28.24 932.00
Non Government Link
Companies
32 37.91 1213.00
Asymp. Sig. (2-tailed) 0.039
DRPAT2009 Government Link
Companies
33 28.48 940.00
Non Government Link
Companies
33 38.52 1271.00
Asymp. Sig. (2-tailed) 0.034
DRPAT2010 Government Link
Companies
32 29.00 928.00
Non Government Link
Companies
32 36.00 1152.00
Asymp. Sig. (2-tailed) 0.133
DRPAT080910 Government Link
Companies
98 84.51 8282.00
Non Government Link
Companies
97 111.63 10828.00
Asymp. Sig. (2-tailed) 0.001
The significance level is 0.05.
DRPAT: Directors‟ Remuneration / Profit after Tax
In this study, the Mann-Whitney U test was used to test the significant difference in the mean
DRPAT (directors‟ remuneration / profit after tax) between GLCs and Non-GLCs in Malaysia.
Based on the ρ-value, the overall value of DRPAT080910 (ρ=0. 001), DRPAT2008, (ρ=0.
039) and DRPAT2009 (ρ=0. 034) are all less than 0.05, the null hypothesis is to be rejected
and H7 hypothesis is accepted for all the periods under study except for 2010 (DRPAT2010,
p= 0.133). This result infers that there is a significant difference between the distribution of
the means of GLCs and Non-GLCs in Malaysia and the Non-GLCs is having a higher mean
rank than the GLCs in all the four series.
Page 38
An empirical study on directors‟ remuneration in relation to corporate performance: A comparison between
GLCs and Non-GLCs in Malaysia
Journal of Business Management Volume 3 Issue 1 2014 37
CONCLUSIONS
From the observations above, we can conclude that the directors‟ remuneration for both the
GLCs and Non-GLCs does exhibit a significant relationship with PAT and the degree of
correlation is stronger in the case of Non-GLCs. This finding supports the good practice of the
Malaysian Code on Corporate Governance‟s underlying principle on directors‟ remuneration
to be structured so as to link rewards to corporate and individual performance.
Net Profit Margin (NPM) which measures how much a company keeps in its earnings out of
every dollar of sales reflects further the quality of directors‟ ability in cost control. The
finding indicates that director‟s remuneration has no significant relationship with NPM
irrespective of GLCs and Non-GLCs. This implies that changes in profit margin are not
significantly relevant to the determining of the amount of directors‟ remuneration. Though the
degree of correlation is relatively weak for GLCs, the results show a negative correlation to
performance and this observation may deserve further attention.
Findings from this study also reveal that the directors‟ remuneration for both the GLCs and
Non-GLCs in Malaysia does not have a significant relationship with ROA and the degree of
correlation is generally negatively weak. The weak coefficient could be due to the diffusion of
the impact by the denominator. We can conclude that irrespective of GLCs or Non-GLCs, the
directors‟ remuneration does not take into consideration on how efficiently the directors or
management utilize the resources in generating the company‟s earnings. A larger, though not
strong overall negative correlation coefficient of -0.189 in the case of ROA shown for the
GLCs suggests a need to improve on the efficiency of resource utilization.
LIMITATIONS AND RECOMMENDATIONS
The findings of this study are interpreted with certain limitations. The data used for this study
was extracted from the financial statements for the years ended 2008 and 2009 and 2010.
Observations of data for a longer time period would be more revealing. Furthermore, the
directors‟ remuneration and corporate performance are based on what have been presented
and disclosed in the financial statements. In other words, the observations made would also
depend on the accuracy of the recognition and measurement used by the companies for
financial reporting.
This study includes only companies that are listed on Bursa Malaysia and the findings may
not be applicable to non-listed companies. A similar study on non-listed companies might
provide a different perspective.
The accretion or reduction in fair value of a company‟s assets does reflect the quality of
directors‟ decisions and their performance. ROA used as corporate performance parameter in
this study is based on an extracted carrying value from the financial statements. The use of
ROA based on fair or market value instead of carrying value presented in the financial
statements could shed light on a more in-depth perspective.
Apart from structuring directors‟ remuneration to corporate performance measured in absolute
amounts, such as PAT, efficiency in resource utilization and cost control measured in ROA
and NPM respectively should not be ignored.
Page 39
An empirical study on directors‟ remuneration in relation to corporate performance: A comparison between
GLCs and Non-GLCs in Malaysia
Journal of Business Management Volume 3 Issue 1 2014 38
Unlike companies in US, Malaysian companies are currently not required to disclose
remuneration information of individual directors. The additional disclosure of individual
director‟s remuneration would certainly help explain any inconsistency or deviation from the
good practices of corporate governance.
REFERENCES
Abdul Rahman, R. and Afzan Najid N. (2011), Government Ownership and Performance of
Malaysian Government-Linked Companies, International Research Journal of
Finance and Economics, 61, 1450 – 2887
Brunello, Graziano and Parigi (2001), Executive compensation and firm performance in Italy,
Italy, International Journal of Industrial Organization, 19, 133-161
Cheng, S. and Firth, M. (2005), Ownership, corporate governance and top management pay in
Hong Kong, Corporate Governance, Vol. 13 (2), 291-302
Coakes, S.; Steed, L & Ong C (2010), SPSS Version 17.0 for Windows- Analysis without
Anguish Version, Australia, John Wiley & Sons Australia, Ltd
Conyon, M.J. and Schwalbach, J. (2000). Executive compensation: Evidence from UK and
Germany, Long Range Planning, 33, 504 – 526
Conyon, Martin J; Gregg, Paul (1994). A study of the sensitivity of top director remuneration
to company specific shocks, National Institute Economic Review, Sage Publication
Ltd., issue 149, 83-92
Duffhues, P. and Kabir, R. (2008). Is the pay–performance relationship always positive?
Evidence from the Netherlands, Journal of Multi- Financial Management, 18, 45- 60
Feng, Zhilan; Chinmoy Ghosh; C.F Sirmans (2007), Director compensation and CEO
Bargaining Power in REITs, Journal of Real Estate Finance and Economics 35 (3),
225
Fernandes, N. (2008), EC: Board compensation and firm performance: The role of
“independent” board members, Journal of Multi. Financial Management, 18, 30 - 44
Firth, M (2006), Corporate Performance and CEO Compensation in China, Journal of
Corporate Finance, 12, 693- 714
Jensen, Michael C. and William H. Meckling (1976), Theory of the firm: Managerial
Behavior, agency costs and ownership structure, Journal of Financial Economics, 3
(4), 305 – 360
Joseph E.O. Abugu (2012), Monitoring directors‟ remuneration, fat cat packages and perks of
office, Journal of Financial Crime, 19.1: 6-19
Kato T. and Kubo K. (2006), CEO compensation and firm performance in Japan: Evidence
from new panel data on individual CEO pay, Japanese International Economies, 20, 1
-19
Le, Trien Vinh; Buck, Trevor (2011), State ownership and listed firm performance: a
universally negative governance relationship?. Journal of Management & Governance,
15.2: 227-248
Marija Norusis, (2008), SPSS 16.0 Guide to Data Analysis, 2nd edition, New Jersey, Prentice
Hall
Merhebi, R., Pattenden, K., Swan, P.L. and Xianming, Z. (2006), Australian chief executive
officer remuneration: Pay and performance, Accounting & Finance, 46, 481-497
Mehran H (1995), Executive compensation structure, ownership, and firm performance,
Journal of Financial Economics, 38, 163-184
Page 40
An empirical study on directors‟ remuneration in relation to corporate performance: A comparison between
GLCs and Non-GLCs in Malaysia
Journal of Business Management Volume 3 Issue 1 2014 39
Mitsudome, Weintrop, and Hwang (2008). The relation between changes in CEO
compensation and firm performance: A Japanese/American comparison, Japanese
International. Economies, 22, 605-619
Murphy K.J (1985). Corporate Performance and Managerial Remuneration: An Empirical
Analysis, Journal of Accounting and Economics, 7, 11- 42
Murphy, K.J, (1999), Executive compensation. In: Ashenfelter, Orley, Card, David (Eds.),
Handbook of Labor Economics, vol. 3B, Elsevier Science, North-Holland, 2485 –2563
Putrajaya High Committee Group website, GLC Transformation Manual - Section I – IV
Retrieved on 24th June 2011: http://www.pcg.gov.my
Sekaran, U. and Roger Bougie (2010), Research Methods for Business: A Skill Building
Approach, 5th Edition, New York, John Wiley & Sons, Inc. New York
Unite, Sullivan, Brookman, Majadillas and Taningco (2008), Executive pay and firm
performance in the Philippines, Pacific-Basin Finance Journal, 16, 606 – 623
Zikmund, W.G., Babin, B.J., Carr, J.C. & Griffin, M. (2010), Business Research Methods,
Eighth Edition. Canada, South Western Cengage Learning
Page 41
The effects of teaching quality on student satisfaction and behavioural intentions from the view point of
university students
Journal of Business Management Volume 3 Issue 1 2014 40
THE EFFECTS OF TEACHING QUALITY ON STUDENT SATISFACTION AND
BEHAVIOURAL INTENTIONS FROM THE VIEW POINT OF UNIVERSITY
STUDENTS
Bahari Mohamed
[email protected]
Saripah bt Basar
[email protected]
Hasmah bt Safiei
[email protected]
Pritam Singh A/L Santa Singh
[email protected]
University College Shahputra
ABSTRACT
This study focuses on the effects of teaching quality on student satisfaction and behavioural
intentions, with emphasis on students‟ experiences at a university in the East Coast. Data was
collected from 168 students at the university. Using a PLS-SEM tool, the hypothesised
effects among the constructs were tested empirically. The results indicate that the path
coefficients from tangible, empathy and outcome constructs are the key factors that influence
the students‟ perception of service quality; the path coefficient from service quality of student
experience to student satisfaction is significant and satisfied students are more positive in
their behavioural intentions toward the university.
Keywords: higher education institution, service quality, student satisfaction, Behavioural
intention
INTRODUCTION
Customer satisfaction is a very important marketing concept. Strong competition in today‟s
competitive educational markets forces higher educational institutions in Malaysia to adopt a
market orientation strategy to differentiate their services from those of their competitors (Sirat,
2005). Thus, the administrators of higher education institutions need to understand the target
customer needs in order to boost customer satisfaction. In higher education, the term
“customer” is different from that in other industries since groups such as students, employers,
academic staff, government and families are all customers of the education system with a
variety of needs. However, students are the direct recipients of the service provided by higher
education institutions. Continuous improvement in quality has become an extremely
important issue for higher educational institutions to enhance educational value and to
increase satisfaction among the students and stakeholders. As the core service provided by
higher educational institutions is teaching, the instructors or academic staff have a crucial role
as a service provider for the students who are their customers. Thus, higher educational
Page 42
The effects of teaching quality on student satisfaction and behavioural intentions from the view point of
university students
Journal of Business Management Volume 3 Issue 1 2014 41
institutions should give the highest priority to effective teaching provided by their instructors
and engage students in the learning process because student satisfaction is often used to assess
the quality of service provided by the institution (Standifird, Pons, and Moshavi, 2008; and
Qureshi, Shaukat, and Hijazi, 2010).
Many studies had been conducted on the perception of teaching service quality at the level of
higher education. However, the studies were mostly conducted in the developed countries
(Nasser and Abouchedid, 2005) and there was no consensus on the factors that contribute
significantly to service quality, student satisfaction or how behavioural intentions are
determined. Studies on student evaluations of service encounters, technical and functional
service quality, service satisfaction, and the effects on behavioural intentions are not well
documented. Only a few such studies have been conducted in developing countries, including
Malaysia. Therefore, the present study was conducted to determine the effects of teaching
quality provided by lecturers on student satisfaction and behavioural intentions, from the
view-point of university students.
LITERATURE REVIEW
Customer satisfaction with service quality is a major goal in service organisations. Service
providers cannot detach themselves from this general concern; thus, managers and
practitioners must give priority to addressing issues concerning quality and customer
satisfaction. Service quality is basically difficult to define and measure and has been subject
of much debate (Legčević, 2009). Thus, the concepts of perceived quality and related
customer satisfaction are coined. Service quality in general differs from product quality due to
special characteristics including intangibility, simultaneity and heterogeneity (Parasuraman,
Zeithaml, and Berry, 1985). Service quality is more difficult for the consumer to evaluate than
goods quality. Moreover, quality evaluations are not made exclusively on the outcome of
service but rather they involve evaluations of the process of service provided. (Parasuraman et
al., 1985). Intangible - this is the principal feature of higher education since most quality
attributes cannot be seen, felt, or touched in advance and the production and consumption of
the service are performed simultaneously. That is, personal contact between students and
instructors plays an important role in the service action. Consequently, the student contributes
directly to the quality of service delivered, and to his or her satisfaction or dissatisfaction.
Service quality in higher education especially the lecturers‟ teaching ability varies depending
on many factors. The most important service quality is context specific. Driscoll and Cadden
(2010) in their research of teaching effectiveness found that the lecturer‟s teaching ability is
influenced by the department that offers the course, the course‟s requirement- core or elective,
and the students‟ anticipated grade.
The development of quality management in the education sector is still considered new
compared with the other sectors (Ramseook-Munhurrun, Naidoo, and Nundlall, 2010).
Attention on service quality in the education setting is increasing due to the demand for
excellence in education (Sahney, Banwet, and Karunes, 2004). In recent years, numerous
empirical studies on higher education have shown several examples of the successful use of
systematic quality management in education (Lagrosen, Sayyed-Hashemi, and Leitner, 2004;
Stodnick and Rogers, 2008). Ling, Piew, and Chai, (2010) conducted a study involving 458
undergraduate business students from a private university to evaluate the determinants of
perceived service quality of higher education in that institution and found that contact
personnel, access to facilities, cost of courses offered, physical facilities of the tertiary
Page 43
The effects of teaching quality on student satisfaction and behavioural intentions from the view point of
university students
Journal of Business Management Volume 3 Issue 1 2014 42
institution and resource input model of education quality were positively related to the overall
students‟ perceived service quality. However, according to Douglas, Douglas, and Barnes
(2006) the most important aspects of service quality in HEI are those associated with teaching
and learning.
Dimension of service quality
The quality dimensions can be classified into technical quality and functional quality
(Gronross, 1998). The technical quality or outcome quality of the process can be measured
objectively; it is the practical result of service. The functional quality or process quality
dimension is often perceived in a subjective manner and is related to the interaction between
the service provider and customer (Gronross 2001). Functional quality can be divided into
tangible and intangible; the intangible aspects of quality include reliability, responsiveness,
assurance, and empathy (Banwet and Datta, 2003). The functional quality very much relates
to higher education service where the influence of interaction between instructors and
students is very significant. Due to the abstract nature of the concept of service quality and the
characteristics of the service, measuring service quality appears to be a complicated and
difficult to evaluate (Sultan and Wong, 2010; and Parasuraman et al., 1985).
Service quality is generally defined as a consumer‟s perceived ... superiority of an entity
(Cronin and Taylor, 1992; Parasuraman et al., 1985, 1988; and Bitner and Hubbert, 1994).
Moreover, service quality is context-specific (Dagger, Sweeney, and Johnson, 2007; and
Sultan and Wong, 2010) such as it depends on the nature of work, environment, and culture.
Thus, it is attached to different meanings and inferences depending on contexts. In other
words, there is no conclusive definition of service quality. In order to define service quality in
the right perspective, it is vital to study the context of the service being investigated. In
addition, to comprehend the service quality in the educational sector, we must have a strong
understanding of service quality attributes in other sectors and to do some adaptation if
necessary (Lagrosen et al., 2004).
Approach in measuring service quality
A number of researchers have provided lists of service quality dimensions, but the best known
service quality dimensions is SERVQUAL developed by Parasuraman et al. (1985, 1988).
The SERVQUAL is based on the assumption that customers are able to express their
expectation of service quality and could distinguish these from their perception of the actual
service quality being provided; the instrument is based on the difference between perception
and expectation (Parasuraman et al., 1985, 1988). Although the SERVQUAL instrument has
been widely used, it has not been free of certain criticisms. SERVQUAL has been much
criticised over the years (Cronin and Taylor, 1992; and Asubonteng et al., 1996). Cronin and
Taylor (1992) disagreed with the concept of perception minus expectation and proposed an
alternative measurement, SERVPERF which utilises the perception only in the service quality
model. Both SERVQUAL and SERVPERF are based on the dimensional approach to service
quality (Sultan and Wong, 2010); service dimensions are conceptualised as components of the
service quality construct. On the other hand, Dabholkar, Shepherd, and Thorpe (2000)
consider service dimensions as antecedents to the overall service quality construct. However,
the antecedent concept is more acceptable and has been in use in recent years (Dagger and
Sweeney, 2006; and Dagger et al., 2007). Hence, there seems to be consensus among
Page 44
The effects of teaching quality on student satisfaction and behavioural intentions from the view point of
university students
Journal of Business Management Volume 3 Issue 1 2014 43
researchers that satisfaction and service quality are two distinctive constructs; however,
dissimilarities in their definitions are not always clear (Choi et al., 2004; Chen and Ting,
2002; and Spreng and Mackoy, 1996). Parasuraman et al. (1988) and Bitner (1990) argued
that customer satisfaction is an antecedent of service quality. On the other hand, many
researchers (such as Cronin and Taylor, 1992; Dabholkar et al., 2000; and Dagger and
Sweeney, 2006) believed that it is service quality that leads to customer satisfaction. As such,
selecting a reliable method to assess service quality is very important. Many models and
instruments have been developed and used in research to determine service quality in higher
educational institutions. Many researchers have adapted SERVQUAL scale (Parasuraman et
al., 1985, 1988), SERVPERF (Cronin and Taylor, 1992), and HEdPERF (Abdullah, 2005) are
among the service quality models that have been used to measure higher educational service
quality by incorporating student satisfaction into their survey instrument.
The present study, as mentioned earlier, sets out to diagnose the effects of service quality
dimensions on perceived service quality (teaching), student satisfaction and behavioural
intentions of the students in the classroom environment by using an integrated scale. The
study takes the view that perceived service quality leads to satisfaction and is in agreement
with the empirical research conducted by Cronin and Taylor (1992); and Dagger and
Sweeney, (2006). The following section discusses briefly the literature of the integrated
model dimensions or constructs as developed by previous researchers.
Behavioural intentions
Studies showed that perceived service quality and service satisfaction have a mixed impact on
behavioural intentions. Many researchers (such as Cronin and Taylor 1992; and Dabholkar et
al., 2000) have found that service quality is indirectly related to behavioural intentions with
service satisfaction as a mediating variable. However, Cronin, Brady, and Hult (2000) in their
study found that service quality has a direct impact on behavioural intentions. Hence,
students‟ intention to re-attend or recommend lectures is dependent on their perceptions of
quality and the satisfaction they received from attending previous lectures (Banwet and Datta,
2003).
Student satisfaction
Kim et al. (2008) describe customer satisfaction as results from customers having good
experiences. Ott and van Dijk (2005) assert that customer satisfaction is an important
indicator of the performance of an organization. According to Storbacka, Strandvik, and
Gronroos (1994), a satisfied customer creates a strong relationship with the provider and this
leads to customer retention or customer loyalty and generates steady revenues and profit for
the firm. When service quality increases, correspondingly, satisfaction with the service will
increase and intentions to reuse the service will also increase (Dagger et al., 2007). A number
of studies have confirmed that service quality is an antecedent to customer satisfaction
(Cronin and Taylor, 1992; Dabholkar et al., 2000; and Dagger and Sweeney, 2006).
Satisfaction is affective, feeling-based, and subjective, and, therefore, satisfaction is hard to
measure accurately (Dabholkar et al., 2000).
Page 45
The effects of teaching quality on student satisfaction and behavioural intentions from the view point of
university students
Journal of Business Management Volume 3 Issue 1 2014 44
Thus, customer satisfaction as mentioned above is a critical factor that determines the quality
of the product or service. In higher education sectors, student satisfaction is considered to be
an indicator of service quality delivered (Wiers-jenssen, Stensakeri, and Grogaard, 2002).
They conducted a study in Norway to determine student satisfaction in relation to learning
experience. They found that the academic and pedagogic qualities of teaching are important
factors in determining student satisfaction. Banwet and Datta (2003) in their study found
satisfied students are likely to attend another lecture delivered by the same instructor or opt
for another module or course taught by the instructor. However, social climate, aesthetic
aspects of the physical infrastructure and the quality of services from the administrative staff
also influence overall student satisfaction (Rapert et al., 2004; and Diamantis and Benos
2007).
Perceived service quality
Customers usually have some expectations of service given by providers before receiving the
actual service and these expectations will be compared to the actual perception of the service
provided. The degree and gap between service perception and customer expectations is
defined as service quality (Parasuraman et al., 1985, 1988). Thus, perceived service quality in
classroom teaching is fulfilled when a lecturer meets or exceeds students‟ expectation.
Accordingly, Thai students consider teaching and the ability of lecturers to communicate
skilfully as very important attributes in selecting international universities (Srikatanyoo and
Gnoth, 2005). Therefore, student satisfaction with the services offered at a university is
influenced by students‟ perceived service quality (Gruber et al., 2010).
Service quality antecedents
Reliability
The reliability dimension is one the strongest effects on perceived lecture quality (Banwet and
Datta, 2003). Reliability in teaching refers to the lecturers‟ ability to deliver the lecture
dependably, accurately, and consistently (Stodnick and Roger, 2008). Accordingly, the ability
of a lecturer to deliver a lecture clearly, emphasis on the relevance and practicality of the
subject, the punctuality of the lecturer, and the lecturer‟s sincerity and problem solving ability
are rated as very important factors contributing to a superior teaching quality (Banwet and
Datta, 2003).
Responsiveness
Lecturer responsiveness is an important dimension of student perception toward teaching
quality. Among the indicators of responsiveness that students expect from the lecturers are:
responding promptly when needed; willing to go out of his or her way to help students;
always welcoming student questions and comments; and being available and approachable
outside class hours (Stodnick and Roger, 2008; Banwet and Datta, 2003).
Page 46
The effects of teaching quality on student satisfaction and behavioural intentions from the view point of
university students
Journal of Business Management Volume 3 Issue 1 2014 45
Empathy
The lecturers or faculty members‟ empathy and understanding of students‟ problems and
needs can greatly influence perceived service quality. Faculty members desire students to be
attentive and understanding towards them. According to Stodnick and Roger (2008) and
Banwet and Datta (2003), faculty members must be genuinely concerned about the students,
understand the individual needs of students, have the student‟s best long-term interests in
mind and encourage and motivate students to do their best. These reflect the faculty
members‟ empathy toward the students.
Tangibles
Physical evidence of the college or university will provide the first impression of service
quality and this is very important to the students‟ perceived service quality judgments.
Generally, good appearance of the physical facilities, equipment, personnel and written
materials create positive impressions. A clean and organized appearance of a college or
university, its staff, its premises, restrooms, equipment, classrooms, workshops, laboratories,
library, computer and information systems can influence students‟ impressions about the
college or university. Jones, Jamal, and Babu (1996) study involving international business
students attending colleges and universities in the United States found that tangibles is one of
the most important factors in their assessment of educational service quality. Tangibles are
aspects such as classroom environment, quality of presentations and the lecturer‟s appearance
which have an influence on students‟ perception of teaching quality (Banwet and Datta, 2003;
Markovic, 2006; and Hill and Epps, 2010). In a number of studies students considered
tangibles a very important factor in determining their satisfaction of educational service
quality (Arambewela and Hall, 2006; Markovic, 2006; and Banwet and Datta, 2003).
Outcome
Outcome or technical quality is also a vital dimension that affects perception of service
quality by students. The technical dimension is rated the most important factor contributing to
perception of service quality by students in Banwet and Datta (2003) study. In their survey of
168 students who attended four lectures delivered by the same lecturers, they found that
students placed more importance on the outcome of the lecture than on any other dimension.
The outcome or technical quality in this study refers to knowledge and skills gained during a
lecture, the availability of class notes and reading materials, the lecture‟s feedback on
assessed work, and coverage and depth of the lecture (Banwet and Datta, 2003).
Theoretical framework
Based on the literature review and discussions presented above, the following theoretical
framework for teaching service quality is developed. Figure 1 shows the service quality
dimensions, namely, tangibles, responsiveness, reliability, empathy, and outcome; perceived
service quality construct; student satisfaction construct; and behavioural intentions construct.
All the constructs/dimensions have been explained in the above section.
Page 47
The effects of teaching quality on student satisfaction and behavioural intentions from the view point of
university students
Journal of Business Management Volume 3 Issue 1 2014 46
Source: adapted from Dabholkar et al., (2000).
Figure 1: Teaching Service Quality Framework
Hypotheses
Prior discussion has led to a brief examination of the existing literature and the resultant
research gaps led to the development of the hypotheses in this research. The eleven
hypotheses are:
H1: Tangibles dimension is positively related to the students‟ perceived service quality.
H2: Responsiveness dimension is positively related to the students‟ perceived service quality.
H3: Reliability dimension is positively related to the students‟ perceived service quality.
H4: Empathy dimension is positively related to the students‟ perceived service quality.
H5: Outcome dimension is positively related to the students‟ perceived service quality.
H6: Students‟ perceived service quality is positively related to student satisfaction.
H7: Student satisfaction is positively related to behavioural intentions.
H8: Student satisfaction mediates the relationship between perceived service quality and
behavioural intentions.
Page 48
The effects of teaching quality on student satisfaction and behavioural intentions from the view point of
university students
Journal of Business Management Volume 3 Issue 1 2014 47
METHODOLOGY
Instrument
Basically the instrument was adapted from Dabholkar et al. (2000). The instrument has been
adapted to suit the context of this study. However, the service quality dimensions, that is, the
functional quality aspects of service for this study, have been adopted from SERVQUAL
(Parasuraman, 1988); and a technical dimension, that is, outcome has been adopted from
Banwet and Datta (2003). The perceived service quality, student satisfaction, and behavioural
intentions constructs have been adopted from Dabholkar et al. (2000). All the items in this
study have been adapted or adopted from previous studies, namely, Stodnick and Roger
(2008), Banwet and Datta (2003), Markovic (2006), and Dabholkar et al. (2000). To establish
support for content validity a panel of lecturers reviewed the constructs and the initial set of
measure items. Based on their suggestions a few of the items were rephrased but no item was
deleted. This study adapted a 7-point Likert-type scale to assess the model. All constructs
were reflective since the items reflect the meaning of the construct. Reflective indicators
mean they measure the same underlying phenomenon (Chin, 1998).
Sample
The population for this study comprised students enrolled in one of the universities in the East
Coast with an estimated population of 3,000 students pursuing 20 programmes in five
faculties. The sampling unit included all the current full-time students at the university who
had completed at least one semester of their study because they are familiar with the teaching
style and services provided at the university as compared to the first semester students. The
general rule for the minimum number of respondents or sample size is five-to-one ratio of the
number of independent variables to be tested. Hair et al. (2010) suggested that the acceptable
ratio is ten-to-one. Since there are 7 independent variables in this study, a minimum sample
size of 70 respondents would be appropriate.
The self-administer survey questionnaire was randomly distributed to the students during
class hours by the research team. The time allocated for the students to answer the
questionnaire was 15 minutes. The students‟ verbal consent was obtained before they
answered the survey questionnaire. Confidentiality was ensured as the subjects were not
required to state their names or other particulars on the survey form. A total of 168 samples
were collected. Therefore, the response rate achieved was considered adequate for the study.
Results and data analysis
This study used partial least square structural equation modelling (PLS-SEM) tool to evaluate
the manner in which the constructs presented in Figure 1 might relate to each other. The PLS-
SEM technique is a statistical method that has been developed for the analysis of latent
variable structural models involving multiple constructs with multiple indicators. PLS-SEMs
have a number of potential strengths, including ability for the testing of the psychometric
properties of the scales used to measure a variable, as well as the strength and the direction of
relationships among the variables (Akter et al., 2011).
Page 49
The effects of teaching quality on student satisfaction and behavioural intentions from the view point of
university students
Journal of Business Management Volume 3 Issue 1 2014 48
The PLS-SEM consisted of two sets of testing equations: first, the assessment of measurement
model, which is the process of calculating the item reliability, validity; the second, the
assessment of the structural model, which is the method of determining the appropriate nature
of the relationships (paths) between the measures and constructs. The estimated path
coefficients indicate the sign and the power of the relationships while the item‟s weights and
loadings indicate the strength of the measures (Hair, Ringle and Sarstedt, 2011). The
confirmatory factor analysis was first conducted to assess the measurement model; then, the
structural relationships were examined (Anderson and Gerbing 1988; Hair et al. 2010).
Measurement Model
The two main criteria used for testing the measurement model are validity and reliability. The
reliability of a research instrument concerns the extent to which the instrument produces
consistency results in repeated measurements, whereas validity is the degree to which a test of
how well an instrument that is developed measures and what is supposed to measure (Sekaran
and Bougie 2010). To validate our measurement model, two basic approaches to validity were
assessed: convergent validity, and discriminant validity.
Reliability analysis
To analyse the reliability/internal consistency of the items, we used the Cronbach‟s alpha
coefficient. Table 1 shows all alpha values are above 0.6 as suggested by Nunnally and
Berstein (1994). Another way to determine internal consistency is by looking at composite
reliability values. The composite reliability (CR) values also ranged from 0.805 to 0.941
(Table 1). A composite reliability of 0.70 or greater is considered acceptable (Fornell and
Larcker 1981). As such we can conclude that the measurements are reliable.
Convergent validity
When multiple items are used for an individual construct, the researcher should be concerned
with the extent to which the items demonstrate convergent validity. The measurement model
was tested for convergent validity which is the degree to which multiple items to measure the
same concept are in agreement. Anderson and Gerbing (1988) stated that convergent validity
is established if all factor loadings for the items measuring the same construct are statistically
significant. According to Hair et al. (2010) convergence validity should be accessed through
factor loadings, composite reliability and average variance extracted. The loadings for all
items exceeded the recommended value of 0.5 (Hair et al. 2010). Composite reliability (CR)
values (see Table 1), which is a measure of internal consistency, the value ranged from 0.805
to 0.941 which exceeded the recommended value of 0.7 (Hair et al. 2010). The average
variance extracted (AVE) measures the variance captured by the indicators relative to
measurement error, and it should be greater than 0.50 to indicate acceptability of the construct
(Fornell and Larcker, 1981; Henseler, Ringle, and Sinkovics, 2009). Table 1 shows that the
average variances extracted range from 0.582 to 0.813, which are above the acceptability
value.
Page 50
The effects of teaching quality on student satisfaction and behavioural intentions from the view point of
university students
Journal of Business Management Volume 3 Issue 1 2014 49
Table 1: Results of Measurement Model
Construct Items Loading Cronbachs
Alpha
CR1 AVE
2
Tangible T1 0.762 0.638 0.805 0.582
T3 0.857
T4 0.655
Empathy E1 0.729 0.838 0.885 0.607
E2 0.817
E3 0.812
E4 0.780
E5 0.754
Reliability REL1 0.864 0.908 0.932 0.732
REL2 0.876
REL3 0.908
REL4 0.825
REL5 0.799
Outcome OC1 0.758 0.853 0.900 0.693
OC2 0.845
OC3 0.898
OC4 0.824
Responsiveness RES1 0.856 0.874 0.913 0.724
RES2 0.866
RES3 0.830
RES4 0.849
Service Quality SQ1 0.888 0.885 0.929 0.813
SQ3 0.930
SQ4 0.887
Satisfaction S1 0.835 0.862 0.906 0.709
S2 0.899
S3 0.889
S5 0.734
Behavioural Intention BI1 0.862 0.921 0.941 0.761
BI2 0.915
BI3 0.867
BI4 0.854
BI5 0.862
Note:
1. Composite reliability (CR) = (square of the summation of the factor loading)/
{(square of the summation of the factor loading) + (square of the summation of the error variances)}
2. Average variance extracted (AVE) = (summation of the square of the factor loadings)/
{(summation of the square of the factor loadings) + (summation of the error variances)}
Page 51
The effects of teaching quality on student satisfaction and behavioural intentions from the view point of
university students
Journal of Business Management Volume 3 Issue 1 2014 50
Table 2: Summary Results of the Model Construct
Construct Items Standardized
Estimate
t-value
Tangible T1 0.762 13.05
T3 0.857 29.28
T4 0.655 8.24
Empathy E1 0.729 14.02
E2 0.817 26.62
E3 0.812 22.86
E4 0.780 17.28
E5 0.754 17.70
Reliability REL1 0.864 35.82
REL2 0.876 33.26
REL3 0.908 37.37
REL4 0.825 21.93
REL5 0.799 19.17
Outcome OC1 0.758 14.27
OC2 0.845 22.80
OC3 0.898 47.93
OC4 0.824 29.01
Responsiveness RES1 0.856 26.12
RES2 0.866 26.28
RES3 0.830 18.25
RES4 0.849 37.60
Service Quality SQ1 0.888 38.55
SQ3 0.930 78.00
SQ4 0.887 33.14
Satisfaction S1 0.835 18.98
S2 0.899 59.56
S3 0.889 50.54
S5 0.734 14.83
Behavioural Intention BI1 0.862 41.10
BI2 0.915 77.76
BI3 0.867 31.40
BI4 0.854 29.86
BI5 0.862 30.41
Table 2 summarizes the results of the measures in our research model. The results show that
all the constructs, i.e., tangible, empathy, reliability, outcome, responsiveness, service quality,
satisfaction, and behavioural intention are all valid measures of their respective constructs
based on their parameter estimates and statistical significance (Chow and Chan 2008). All
measures are significant on their path loadings at the level of 0.001
Page 52
The effects of teaching quality on student satisfaction and behavioural intentions from the view point of
university students
Journal of Business Management Volume 3 Issue 1 2014 51
Discriminant validity
Next we validated the discriminant validity of our instrument. The discriminant validity
represents the extent to which measures of a given construct differ from measures of other
constructs in the same model. In a PLS context, the most important criteria for adequate
discriminant validity is that a construct should share more variance with its items than it is
should share with other constructs in a given model (Hulland, 1999). It was assessed by
examining the correlations between the measures of potentially overlapping constructs. Items
should load more strongly on their own constructs in the model, and the square root of the
average variance extracted for each construct is greater than the levels of correlations
involving the construct (Fornell and Larcker, 1981). As shown in Table 3, the square root of
the average variance extracted for each construct is greater than the items on off-diagonal in
their corresponding row and column, thus, indicating adequate discriminant validity. The
inter-construct correlations also show that each construct shares larger variance with its own
measures than with other measures. In sum, the measurement model demonstrated adequate
convergent validity and discriminant validity.
Table 3: Discriminant Validity of Constructs
Construct 1 2 3 4 5 6 7 8
1. Tangible 0.763
2. Empathy 0.378 0.779
3. Reliability 0.224 0.575 0.855
4. Outcome 0.233 0.401 0.639 0.833
5. Respons 0.277 0.642 0.747 0.522 0.851
6. S. Quality 0.503 0.531 0.492 0.613 0.474 0.902
7. Satisfaction 0.449 0.466 0.475 0.506 0.427 0.685 0.842
8. B. Intention 0.455 0.362 0.244 0.309 0.250 0.519 0.730 0.872
Diagonals (in bold) represent the square root of the average variance extracted while the other entries represent
correlations.
Hypotheses testing
Table 4 presents the results and hypothesis testing. The findings support the hypotheses H1
and H4 to H8; hypotheses H2 and H3 were not supported (Table 4). Responsiveness and
reliability were not significant predictors of service quality (H2 and H3). The 2R value of
service quality construct was 0.568 suggesting that 56.8% of the variance in service quality
can be explained by tangible, empathy, reliability, outcome and responsiveness. H1 and H4 to
H8 were supported with t-value range from 2. 956 to 18.419. The 2R value of satisfaction
construct was 0.470 suggesting that 47% of the variance in satisfaction can be explained by
service quality and 2R value of behavioural intention construct was 0.533 suggesting that 53.3%
of the variance in satisfaction can be explained by satisfaction. H8, student satisfaction
mediates the relationship between perceived service quality and behavioural intentions was
supported because the relationship between service quality and satisfaction, and satisfaction
Page 53
The effects of teaching quality on student satisfaction and behavioural intentions from the view point of
university students
Journal of Business Management Volume 3 Issue 1 2014 52
with behavioural intention were significant. In order to assess if there is full or partial
mediation, we also used the method suggested by Baron and Kenny (1986). We found that
student satisfaction is fully mediated with the service quality and behavioural intention.
Table 4: Path Coefficients and Hypothesis Testing
Hyp Relationship Beta t-value Supported
H1 Tangible-Service Quality 0.310 4.675, 01.0 Yes
H2 Responsiveness Service Quality 0.009 0.094, 05.0 No
H3 Reliability Service Quality 0.001 0.013, 05.0 No
H4 Empathy Service Quality 0.229 2.956, 01.0 Yes
H5 Outcome Service Quality 0.443 5.106, 01.0 Yes
H6 Service Quality Satisfaction 0.685 16.176, 01.0 Yes
H7 Satisfaction Behavioural Intention 0.730 18.419, 01.0 Yes
H8 Service QualitySatisfactionB.
Intention
Yes
DISCUSSION AND CONCLUSION
Higher education institutions (HEI) in Malaysia are facing competitive market challenges, and
customers or students evaluate the services provided by the HEI. In this competitive
environments, student perceptions of service quality and their satisfaction level of the
teaching process are considered of paramount importance in order to attract the customers
(students) and retain them. Thus, the main purpose of this paper is to look at the relationship
between behavioural intention and related constructs; more precisely the relationships
between antecedents of service quality, perceived service quality, student satisfaction and
behavioural intention. Behavioural intention is perceived as being the ultimate dependent
variable of the research model.
The empathy dimension indicates the lecturers‟ willingness to help and motivate the students.
It is also reflects the sensibility and cautions to students' needs. The smallest beta value ( =
0.229, t = 2.866) shows that students are still not satisfied with the quality of this dimension.
The results of analysis of this dimension indicate that the students are not satisfied with their
lecturer‟s supportive behaviour toward fulfilling their needs. That is, the students perceived
the lecturers as not showing interest in their students‟ development and did not encourage
them to do their best in the study. However, the empathy dimension was found to have a
positive impact on student perception of teaching/service quality and satisfaction with the
lecturer (Standifird et al., 2008; Hancock, 2000). The tangible dimension focuses on lecturer
appearance and physical facilities available in the classroom. From the analysis the dimension
generated the value equal to 0.310 and t value equal to 4.639 that show the dimension is
still not adequate to fullfil student needs. In other words, the students learning process was
affected by inadequate classroom comfort. However, we did not find that the lecturers„ attire
and appearance affected the student learning process. The tangible dimension is very
important in the teaching and learning process, that is modern, fully equipped and clean
classrooms would give a positive perception of teaching/service quality provided by the
lecturer (Hill and Epps, 2010). The outcome dimension highlighted the technical part of
service quality. Students evaluate the lecturer in terms of knowledge and skills they gained,
Page 54
The effects of teaching quality on student satisfaction and behavioural intentions from the view point of
university students
Journal of Business Management Volume 3 Issue 1 2014 53
the availability of class notes and reading materials, the lecturer‟s feedback on assessed work,
and the coverage and depth of the lecture. From the analysis, we found that the dimension was
paramount in determining service quality (with = 0.443 and t = 4.959). In other words, in
an educational context, the lecturer‟s performance during the teaching or service transactions
is very important.
Our final conclusion was that the reliability and responsiveness constructs were not very
important in determining perceived service quality from the students‟ perspective. The
values of the two dimensions were not significant. It was also apparent that the students
perceived that the two constructs were being delivered effectively. The results demonstrate
that student satisfaction was the most influential factor, directly and strongly related to
behavioural intention. The service quality construct has only an indirect relationship to
service quality via student satisfaction. This study confirmed that service quality, satisfaction
and behavioural intention are distinct concepts. Taking into consideration the significance
levels of the path coefficients, satisfaction and behavioural intention dimensions have the
highest degree of association with service quality either directly or indirectly. This shows that
the service quality and satisfaction dimensions are very important in determining student
behavioural intention. Therefore, academic leaders should place more emphasis on these
dimensions. Such insights can help the leaders when making decisions concerning the
allocation of scarce resources.
We suggest that students should be viewed as customers because higher education institutions
are currently facing great competition in attracting students and thus, they are adopting a
marketing approach to attract more students to their institutions (Sultan and Wong, 2010). It is
important to have students who are satisfied for important positive word of mouth and referral
decisions. From the analysis techniques presented here, tangible, empathy and outcome
(technical quality) constructs can be a source of help to lecturers. They should identify the
components and subcomponents that are important in increasing teaching quality which
would eventually lead to student satisfaction. If the constructs (tangible, empathy, and
outcome) are improved, this improvement will have a positive impact on other constructs as
well.
Due to the diversity of courses offered in other higher education institutions that also have
different facilities, equipment, staff and faculty members the results of this study may only be
generalised in a limited way to other institutions. Hence, it is recommended that every
institution carries out a similar study so that a model with a greater conformity can be
produced for purposes of planning and further improving teaching services quality.
REFERENCES
Abdullah, F. (2005). “HEdPERF versus SERVPERF: the quest for ideal measuring instrument
of service quality in higher education sector”, Quality Assurance in Education, 13(4),
305-328
Akter, S., D'Ambra, J. and Ray, P. (2011). An evaluation of PLS based complex models: the
roles of power analysis, predictive relevance and GoF index. AMCIS 2011
Proceedings - All Submissions. Paper 151 (online). Available from:
http://aisel.aisnet.org/amcis2011_submissions/151
Page 55
The effects of teaching quality on student satisfaction and behavioural intentions from the view point of
university students
Journal of Business Management Volume 3 Issue 1 2014 54
Anderson, J. C., and Gerbing, D. W. (1988). “Structural Equation Modeling in Practice: A
Review and Recommended Two-Step Approach”, Psychological Bulletin, 103(3), 41-
423
Arambewela, R. and Hall, J. (2006). “A comparative analysis of international education
satisfaction using SERVQUAL”, Journal of Services Research, 6(July), 140-163
Asubonteng, A., McCleary, K.J. and Swan, J.E. (1996). “SERVQUAL revisited: a critical
review of service quality”, The Journal of Services Marketing, 10(6), 62-81
Banwet, D. K. and Datta, B. (2003). “A study of the effect of perceived lecture quality on
post-lecture intentions”, Work Study, 52(4/5), 234-243
Baron, R.M. and Kenny, D.A. (1986). “The moderator-mediator variable distinction in social
psychological research: conceptual, strategic and statistical considerations”, Journal
Pers Soc Psychol, 51, 1173–1182
Bitner, M.J. (1990). “Evaluating service encounters: the effects of physical surroundings and
employee responses”, Journal of Marketing, 54(April), 69-82
Bitner, M. J. and Hubbert, A. R. (1992). “Servicescape: the impact of physical surroundings
on customer and employees”, Journal of Marketing, 56(April), 57-71
Chow, W.S. and Chan, L.S. (2008). “Social network, social trust and shared goals in
organizational knowledge sharing”, Information & Management, 45(7), 458–465
Chen, C. N. and Ting, S. C. (2002). “A study using the grey system theory to evaluate the
importance of various service quality factors”, The International Journal of Quality &
Reliability Management, 19(6/7), 838-851
Chin, W.W. (1998). “Issues and opinion on structural equation modelling”, MIS Quarterly,
22(1), 7-16
Choi, K., Cho, W., Lee, S., Lee, H. and Kim, C. (2004). “The relationship among quality,
value, satisfaction and behavioural intention in health care provider choice: a South
Korea study”, Journal of Business Research, 57, 913-921
Cronin, J.J. Jr and Taylor, S.A. (1992). “Measuring service quality: a re-examination and
extension”, Journal of Marketing, 56(July), 55-68
Cronin,Jr. J.J., Brady, M.K., and Hult, G.T.M. (2000). “Assessing the effects of quality, value
and customer satisfaction on consumer behavioural intension in service environments”,
Journal of Retailing, 76(2), 193-218
Dabholkar, P. A., Shepherd, C. D. and Thorpe, D. I. (2000). “A comprehensive framework for
service quality: an investigation of critical conceptual and measurement issues through
a longitudinal study”, Journal of Retailing, 76(2), 139-173
Dagger, T. S. and Sweeney, J. C. (2006). “The effect of service evaluations on behavioural
intentions and quality of life”. Journal of Service Research, 9(1), 3-18
Dagger, T. S., Sweeney, J. C. and Johnson, L. W. (2007). “A hierarchical model of health
service quality: scale development and investigation of integrated model”, Journal of
Service Research, 10(2), 123-142
Diamantis, G. V. and Benos, V. K. (2007). “Measuring student satisfaction with their studies
in an International and European Studies Department”, Operation research. An
International Journal, 7(1), 47-59
Douglas, J., Douglas, A., and Barnes, B. (2006). “Measuring student satisfaction at a UK
university”, Quality Assurance in Education, 14(3), 251-267
Driscoll, J. and Cadden, D. (2010). “Student Evaluation Instruments: The interactive impact
of course requirement, student level, department and anticipated grade”, American
Journal of Business Education, 3(5), 21-30
Fornell, C., and Larcker, D. F. (1981). “Structural Equation Models with Unobservable
Variables and Measurement Errors”, Journal of Marketing Research, 18(2), 39-50
Page 56
The effects of teaching quality on student satisfaction and behavioural intentions from the view point of
university students
Journal of Business Management Volume 3 Issue 1 2014 55
Gronroos, C. (1998). “Marketing services: the case of a missing product”, The Journal of
Business & Industrial Marketing, 13(4/5), 322-338
Gronroos, C. (2001). “The perceive service quality concept – a mistake?” Managing Service
Quality, 11(3), 150 -152
Gruber, T., Fuß, S. Voss, R. and Glaser-Zikuda, M. (2010). “Examining student satisfaction
with higher education services: Using a new measurement tool”. International Journal
of Public Sector Management, 23(2), 105-123
Hair, J.F., Black, W.C., Babin, B.J., Anderson, R.E. (2010). Multivariate data analysis. Upper
Saddle River: Prentice-Hall
Hair, J. F., Ringle, C. M. and Sarstedt, M. 2011. “PLS-SEM: Indeed a Silver Bullet”, Journal
of Marketing Theory and Practice. 19(2): 139–151
Hancock, D.R. (2000). “Impact of verbal praise on college students' time spent on homework”,
The Journal of Educational Research, 93(6), 384-389
Henseler, J., Ringle, C. M. and Sinkovics, R.R. (2009). “The use of partial least squares path
modelling in International Marketing: new challenges to International Marketing”.
Advances in International Marketing, 20, 277–319
Hill, M.C. and Epps, K.K. (2010). “The impact of physical classroom environment on student
satisfaction and student evaluation of teaching in the university environment”,
Academy of Educational Leadership Journal, 4(4), 65-79
Hulland, J. (1999). “Use of Partial Least Squares (PLS) in strategic management research: a
view of four recent studies”, Strategic Management Journal, 20, 195-204
Jones, T. C., Jamal, S. A. and Babu, G. B. (1996). “An assessment of the service quality
provided to foreign students at U.S. business schools”, Journal of Education for
Business, 71(3), 130-133
Kim, K. H., Kim, K. S., Kim, D. Y., Kim, J. H. and Kang, S.H. (2008). “Brand equity in
hospital marketing”, Journal of Business Research, 61, 75-82
Lagrosen, S., Sayyed-Hashemi, R. and Leitner, M. (2004). “Examination of the dimensions of
quality in higher education”, Quality Assurances in Education, 12(2), 61-69
Legčević, J. (2009). “Quality gap of educational services in viewpoints of students”, Ekon.
Misao Praksa dbk, 18(2), 279-298
Ling, K.C., Piew, T.H. and Chai, L.C. (2010). “The impact of resource input model of
education quality on the overall students‟ perceived service quality”, Canadian Social
Science, 6(2), 125-144
Markovic, S. (2000). “Expected service quality measurement in tourism higher education”,
Nase Gospodarstvo, 52(1/2), 89-95
Nasser, R. and Abouchedid, K. (2005). ”Graduates' perception of university training in light
of occupational attainment and university type”, Education & Training, 47(2/3), 124-
133
Parasuraman, A., Zeithaml, E.V. and Berry, L.L. (1985). “A conceptual model of service
quality and its implication for future researches”, Journal of Marketing. 49(4), 41-50
Parasuraman, A., Zeithaml, E.V. and Berry, L.L. (1988). “SERVQUAL: a multiple items
scale for measuring customers perception of service quality”, Journal of Retailing,.
64, 12-23
Qureshi, T.M., Shaukat, M.Z. and Hijazi, S.T. (2010). “Service quality SERVQUAL model in
higher education institutions, what factors are to be considered?” Interdisciplinary
Journal of Contemporary in Business, 2(5), 281-290
Ramseook-Munhurrun, P., Naidoo, P., and Nundlall, P. (2010). “A proposed model for
measuring service quality in secondary education”, International Journal of Quality
and Service Sciences, 2(3), 335-345
Page 57
The effects of teaching quality on student satisfaction and behavioural intentions from the view point of
university students
Journal of Business Management Volume 3 Issue 1 2014 56
Rapert, M. I., Smith, S., Velliquette, A. and Garretson, J. A. (2004). “The meaning of quality:
expectations of students in pursuit of an MBA”, Journal of Education for Business,
80(1), 17-24
Sahney, S., Banwet, D.K. and Karunes, S. (2004). “Customer requirement constructs: the
premise for TQM in education: A comparative study of select engineering and
management institutions in the Indian context”, International Journal of Productivity
and Performance Management, 53(6), 499-520
Sekaran, U. and Bougie, R. (2010). Research methods for business: a skill building approach,
Wiley, UK
Sirat, M. (2005). Transnational higher education in Malaysia: balancing benefits and concerns
through regulations, National Higher Education Research Institute. (online).
Available from: http://www.usm.my/ipptn (20 January, 2011)
Spreng, R. A. and Mackoy, R. D. (1996). “An empirical examination of a model of perceived
service quality and satisfaction”, Journal of Retailing, 72(2), 201-214
Srikatanyoo, N. and Gnoth, J. (2005). “Quality dimensions in International Tertiary
Education: a Thai prospective student‟s perspective”, The Quality Management
Journal, 12(1), 30-40
Standifird, S.S., Pons, F. and Moshavi, D. (2008). “Influence Tactics in the Classroom and
Their Relationship to Student Satisfaction”, Decision Sciences Journal of Innovative
Education, 6(1), 135-152
Stodnick, M. and Roger, P. (2008). “Using SERVQUAL to measure the quality of the
classroom experience”, Decision Sciences Journal of Innovative Education, 6(1), 115–
133
Storbacka, K., Strandvik, T. and Gronroos, C. (1994). “Managing customer relationship for
profit: the dynamics of relationship quality”, International Journal of Service Industry
Management, 5(5), 21-38
Sultan, P. and Wong, H. Y. (2010). “Service quality in higher education - a review and
research agenda”, International Journal of Quality and Service Science. 2(2), 259-272
Wiers-jenssen, J., Stensakeri, B. and Grogaard, J.B. (2002). “Student Satisfaction: towards an
empirical deconstruction of the concept”, Quality in Higher Education, 8(2), 183–195
Page 58
The effects of self-efficacy on the development of entrepreneurial intention
Journal of Business Management Volume 3 Issue 1 2014 57
THE EFFECTS OF SELF-EFFICACY ON THE DEVELOPMENT OF
ENTREPRENEURIAL INTENTION
Tan Kwe Lu
[email protected]
Universiti Tenaga Nasional
ABSTRACT
The objective of this study is to investigate empirically the extent to which self-efficacy
contributes to the development of entrepreneurial intention. Structured questionnaires were
deployed to various strategic locations in the UNITEN campus where 246 sample subjects
were conveniently selected. The measurement constructs of self-efficacy were classified into
opportunity, environment, relationship, purpose, challenges and human resources. The
coefficient of determination, R2 shows that 60.5 percent of the variance of intention to
entrepreneurship is explained by the combined variance of the six independent variables. It
was found that the model fits for prediction.
Keywords: self-efficacy, entrepreneurial intention, opportunity, relationship
INTRODUCTION
There is a renewed global interest in entrepreneurship. The evidence of this resurgent interest
is by the sheer amount of concrete efforts and initiatives taken by various governments. Many
policy measures and programs have been provided to increase the supply of entrepreneurship.
These are increasing market incentives, improving the availability of credit and capital,
developing entrepreneurship programs, and reforming the market regulations to facilitate
easier entry into the market, and to increase entrepreneurial activities and opportunities. This
trend of placing greater importance on entrepreneurship was first noted in 1984 by the late
Professor Albert Shapero (Shapero, 1985).
Over the last decades, there has been a growing emphasis on the importance of new
enterprises and SMEs in an economic development process. This growing awareness has led
many public administrations from all political ideologies and all administrative levels to
establish agencies to stimulate and to favor the creation of new enterprises. All agree that
entrepreneurship has a vital role to play in catalyzing and speeding economic activities. It is
also this awareness that has attracted the interest of many academic researchers to join in the
fray in seeking ways to increase the level of entrepreneurial activity so as to achieve a
sustainable rate of economic development. Entrepreneurial activities are the end result of
entrepreneurial behavior. This has a strong relationship with entrepreneurial intention as
reported by several studies such as Boyd and Vozikis (1994) and Krueger (2000).
Past researches have often focused on personal traits and characteristics as antecedent to
entrepreneurship, but they have not been found to be reliable predictors of future
entrepreneurial behavior. There must be some other factors which might possibly and
Page 59
The effects of self-efficacy on the development of entrepreneurial intention
Journal of Business Management Volume 3 Issue 1 2014 58
significantly influence the intention to entrepreneurship. One of these factors is self-efficacy.
As such, this study attempts to look at how the factor affects the intentionality of
entrepreneurship.
LITERATURE REVIEW
Entrepreneurship has been defined in various ways. One of the most cited definition is it is
“the creation of new enterprise” (Low & MacMillan, 1988 pg. 141). Past research has often
focused on personal traits and characteristics that distinguish an entrepreneur from the
general population rather than adapting a “process oriented” approach. Personal
characteristics such as need for achievement, locus of control, risk taking behavior and
tolerance of ambiguity have been identified and investigated as possible contributors to the
development of entrepreneurial intention. However, the findings of these researches revealed
that these personality traits have not been found to be reliable predictors of future
entrepreneurial behavior (Ajen, 1991; Ganner, 1989). In fact, these personality traits are
found to be commonly associated with successful individuals such as managers (Brockhaus
& Horwitz, 1986).
Previous literature has also attempted to identify social, cultural, political and economic
factors that contribute to the business set-up. For example, job displacement (Shapero &
Sokol, 1982), previous work experience (Mokry, 1988), quality of life (Pennings, 1982) and
ethnicity (Greenfield & Strickon, 1981) have all been identified as contributing factors for the
development of entrepreneurial intention.
Entrepreneurial intention is a state of mind that directs and guides the actions of the
entrepreneur towards the forming of an entrepreneurial activity. It is a process oriented that
focuses on a complex relationship between entrepreneurial ideas and theirs resulting outcome.
Kim and Hunter (1993) posit that intentions predict entrepreneurial behavior and attitudes
successfully influence intentions. In studying the entrepreneurial process, the act of initiating
a new entrepreneurial venture is the typical result of a planned behavior (Krueger, 2000).
Krueger (2000) demonstrated further that the constructs of entrepreneurial intention are likely
predictor of individual‟s entrepreneurial actions.
Self-efficacy is defined as a person‟s belief in his or her capability to carry out a task (Gist,
1987) and has a significant influence on the process of development of entrepreneurial
intention. Bird (1988) proposed a framework called the Entrepreneurial Intentionality Model
that suggested that the self-efficacy influences this process of new venture creation. Bandura
(1982) argued that self-efficacy influences one‟s thought which can enhance and undermine
one‟s capability to perform. In other words, if one has a high level of self-efficacy, one is
likely to set a high goal and raise the determination and achieve higher performance. Gist
(1987) concurred that a higher level of self-efficacy can help an individual maintain his/her
effort until a targeted goal is met. Stajkovic and Luthans (1998) in their meta-analysis on 114
previous studies on self-efficacy found a significant weighted average correlation between
self-efficacy and work-related performance. Such correlation raised higher levels of
motivation to initiate new ventures. Drnovšek, and Wincent (2010) found that self-efficacy
helps in bolstering positive thoughts and controlling negative thoughts that are relevant to
business start-ups.
Page 60
The effects of self-efficacy on the development of entrepreneurial intention
Journal of Business Management Volume 3 Issue 1 2014 59
Chen (1998) conducted a study of entrepreneurial self-efficacy (ESE) by developing
constructs such as marketing, innovation, management, risk-taking, and financial control
skills. Using a sample of students he found that ESE had a significant and positive effect on
the likelihood of becoming an entrepreneur. One of the most significant findings was that
innovation and risk-taking appeared to be important cognitive capabilities in the ESE study.
He found that the entrepreneurial self-efficacy formed a reliable measure to differentiate
between business founders and non-founders. Krueger (2000) found that individuals with
high self-efficacy are more willing to make an effort to overcome obstacles in business
ventures and he concluded that self-efficacy is an important antecedent of entrepreneurial
intention. Similarly, Neupert (2004) found that self-efficacy is a significant contributing
factor to start one‟s business. Chandler and Jensen (1992) found that abilities such as
recognizing opportunities and driving the business venture are critical in the entrepreneurial
process. These entrepreneurial skills can be used to create an expanded measure of ESE
developed by De Noble (1999). He contended that self-efficacy to undertake new venture
initiatives will positively influence entrepreneurial intentions. He further developed and
classified a self-efficacy measurement construct into developing new products or market
opportunities, building an innovative environment, initiating investor relationships, defining
core purpose, coping with unexpected challenges, and developing critical human resources.
From the above discussion, it is seen that ESE is important in the process of developing
entrepreneurial intention. The current study empirically analyzes the impact of these ESE
measurement constructs on entrepreneurial intentions among university students. The
following hypotheses were therefore formulated for the study.
H1: There is a significant relationship between the awareness of opportunity and
entrepreneurial intention.
H2: There is a significant relationship between the awareness of the environment and
entrepreneurial intention.
H3: There is a significant relationship between the awareness of relationship and
entrepreneurial intention.
H4: There is a significant relationship between the awareness of purpose and entrepreneurial
intention.
H5: There is a significant relationship between the awareness of the challenges and
entrepreneurial intention.
H6: There is a significant relationship between the awareness of human resources and
entrepreneurial intention.
METHODOGY
Sample design
The data collectors were deployed to various strategic locations in the College of Business
Management and Accounting, Universiti Tenaga Nasional, Muadzam Shah Campus.
Structured questionnaires were then administered to the student respondents who were
Page 61
The effects of self-efficacy on the development of entrepreneurial intention
Journal of Business Management Volume 3 Issue 1 2014 60
conveniently selected. When the questionnaires were returned, we had a total of 246 usable
sample subjects. These sample subjects were final year students of various degree programs.
Research instrument
This self-administered and structured questionnaire consists of two sections--sections A and
B. Section A extracts respondents‟ demographic characteristics such as gender, age, ethnicity
and degree program. Section B consists of measurement constructs on entrepreneurial
intention and entrepreneurial self-efficacy. To measure entrepreneurial intention, the study
used the instrument developed by Linan (2005), which consists of a set of six items that
asked the respondent to self-assess his/her intention to initiate a business set-up. The
measurement construct for entrepreneurial self-efficacy were adapted from instruments
developed by De Noble (1999), which is divided into six constructs that include the following:
1) Developing new products and market opportunities; 2) building an innovative environment;
3) Initiating investor relationships; 4) Defining core purpose; 5) Coping with unexpected
challenges; and 6) Developing critical human resources. Overall this study consists of a total
of 29 items. However, some modifications were purposely made by the researcher for reason
of clarity. Questionnaires were closed-ended questions with closed alternatives in the form of
a seven-point Likert type scale, being 1 “strongly disagrees” and 7 “strongly agree”.
The model
The model of this study is as follow:
Y = β0 + β1 X1 + β2 X2 + β3 X3 + β3 X3 + β4 X4 + β5 X5 + β6 X6 + εt (1)
where Y is the Entrepreneurial Intention as dependent variable and the independent
components are
X1 = Opportunity
X2 = Environment
X3 = Relationship
X4 = Purpose
X5 = Challenges
X6 = Human Resources
β0 is the constant term of the model. βi, i=1 to 6 as coefficients of the respective variables
for the model and εt is the error term.
Dependent variable
The dependent variable is entrepreneurial intention. It measures the degree of readiness,
determination and seriousness to be an entrepreneur.
Independent variable
Page 62
The effects of self-efficacy on the development of entrepreneurial intention
Journal of Business Management Volume 3 Issue 1 2014 61
The six independent variables were opportunity, environment, relationship, purpose,
challenges and human resources. „Opportunity‟ measures the ability of respondents to
identify, to discover, to create and design product in meeting market needs. „Environment‟
measures the capability to seize working environment to create, to encourage and to take
responsibility to initiate something new. „Relationship‟ measures ability to identify and to
develop favorable networks with potential business partners. „Purpose‟ measures how the
respondent articulates and embraces the vision and value of a business initiative. „Challenge‟
measures ability to persist, tolerate and to work out the continuous stress, pressure and
conflict. „Human resource‟ measures the ability to identify, to recruit and to develop key
management and technical staffs.
OUTPUT ANALYSIS
Table 1: Demographic Profiling
Profile Description Frequency percent
Gender Male 56 22.8
Female 190 77.2
Race Malay 181 73.6
Chinese 22 8.9
Indian 43 17.5
Age 16-20 67 27.2
21-25 175 71.1
26-30 3 1.2
Above 30 1 0.4
Program B. of Accounting 103 41.9
B. of Finance 80 32.5
BBA (Human resource) 48 19.5
BBA (Marketing) 9 3.7
BBA (ED) 4 1.6
B. of International Business 2 0.8
Table 1 show that female respondents contributed a larger percentage which is 77.2% as
compared with male respondents (22.8%). In terms of ethnicity group, Malays constituted
73.6, followed by 17.5% of Indian respondents. Chinese respondents stood at 8.9%. Such
ethnicity distribution truly reflects the actual composition of the student population. There are
71.5% respondents who were aged between 21 to 25 years old. Respondents aged between
16-20 constituted 27.2%. The respondent with ages above 26 was 1.6%. This age pattern is
expected as target respondents who were mainly final year students and the majority intended
to graduate before age 26. Also from the table, most (41.9%) respondents were from the
Bachelor Accounting program, followed by 32.5% Bachelor of Finance respondents. The rest
of the respondents were from BBA programs in various disciplines.
Page 63
The effects of self-efficacy on the development of entrepreneurial intention
Journal of Business Management Volume 3 Issue 1 2014 62
Reliability test
Table 2: Reliability of Scales
Dimension No. of Items Cronbach Alpha
Intention 6 0.933
Opportunity 7 0.929
Environment 4 0.865
Relationship 3 0.903
Purpose 3 0.918
Challenge 3 0.897
Human Resource 3 0.926
Table 2 shows the reliability coefficients of the main variables of the current study. All the 7
variables were higher than 0.7 and they all indicated that the reliability among the items was
consistent (Hair, 2006). Such a result is consistent with the study conducted by De Noble
(1999) which found internal consistency with reliability coefficients for the measurement
constructs were higher than the cutoff point of 0.7. It therefore serves as a reliable foundation
for further testing and subsequent analysis.
Exploratory Factor Analysis was conducted previously and had shown to have valid
measurement constructs. However, with a different current sample size and setting for the
sample subjects, validity, test using Kaiser-Meyer-Olkin was conducted again. The KMO test
value was found to be 0.945 which exceeds 0.5. It is therefore implied that the measurement
constructs are also valid in the current sample with no problem of multi-collinearity.
Regression result
Table 3: Standardized (Simultaneous) Regression between Entrepreneurial Intention and the
Measurement Variables
Dependent variable Entrepreneurial Intention
Independent variables β t Sig. VIF
Opportunities 0.569*** 7.856 0.000 2.987
Environment 0.028 0.187 0.852 3.904
Relationships 0.432*** 3.037 0.003 2.512
Purpose 0.200 1.119 0.264 3.793
Challenges 0.390*** 2.958 0.003 2.224
Human Resources 0.389** 2.589 0.010 2.593
Notes: The regression coefficients shown in the table are standardized regression coefficients (beta coefficients),
***, ** indicate that the estimated coefficient is significantly different from zero at 1 percent and 5 percent
respectively.
R= 0.778 R2 = 0.605 F-Value = 61.105 (P<0.01)
The general results of the linear multiple regression analysis of entrepreneurial intention
arising from opportunity, environment, relationship, purpose; challenges and human
resources are reported in Table 3. Multicollinearity test of the six independent variables
(opportunity, environment, relationship, purpose, challenges and human resources) has been
done. Using a cut-off value of VIF less than 5 (VIF for opportunity = 2.987, VIF for
Page 64
The effects of self-efficacy on the development of entrepreneurial intention
Journal of Business Management Volume 3 Issue 1 2014 63
environment = 3.904, VIF for relationships = 2.512, VIF for purpose = 3.793, VIF for
challenges = 2.224, and VIF for human resource = 2.593 respectively); no multicollinearity
among the variables is found. The coefficient of determination, R2 shows that 60.5% of the
variance of entrepreneurial intention is explained by the variance of opportunity, environment,
relationship, purpose, challenges and human resources. The F-value is statistically significant
at the 1% level, implying that the regression model is reliable for prediction.
The estimated coefficient of correlation (R = 0.778) shows a relatively strong linear
correlation between the independent and dependent variables. The regression result shows
that opportunity has a positive effect on entrepreneurial intention as the estimated coefficient
is 0.569 with the confidence level of 99%. In other words, an increase in exposure to
opportunity by 1%, the entrepreneurial intention would increase by 0.569%. The relationship
also has a positive association with the entrepreneurial intention as the estimated coefficient
is 0.432 and significant at 1% level inferring that when the degree of relationship improve by
1%, the entrepreneurial intention would increase 0.432%. Variable challenge has also shown
as significant with 99% confidence and it is positively related to entrepreneurial intention
with the estimated coefficient 0.390. Another variable that has association with the
entrepreneurial intention is human resource. It is positively and statistically significant with
entrepreneurial intention at 95% confidence level as the estimated coefficient is 0.389. This
can be explained as a 1 % increase in the human resources, the entrepreneurial intention will
increase by 0.389%.
CONCLUSION AND RECOMMENDATIONS
The general linear regression result indicates that the dimensions „opportunity‟ and
„relationship‟ were by far the strongest and positive predictors of entrepreneurial
intentionality. Other variables that have shown association with intention to entrepreneurship
are „challenges‟ and „human resource‟. They are statistically significant. Based on this
regression result, H1, H3,H5 ,H6 are well supported.
This study concerned measurement constructs of self-efficacy and their impact on
entrepreneurial intention. The fact that the intentionality examined here is dependent only on
self-efficacy may simplify the phenomenon excessively. There is likely that other factors that
exist apart from self-efficacy could be deemed as significant. A second limitation in this
study is that it only involves one particular sample from UNITEN campus and the
generalizability of the findings is limited. Future research needs to include a wider and more
representative spectrum of respondents for greater representation.
The results of this study suggest two implications. First, it can help companies implementing
entrepreneurial programs, thus retaining employees particularly those who could help
maintain the organization‟s competitive advantage. Universities may find these results
valuable in order to develop business classes on entrepreneurship. The result would also be
helpful for career counselors and coaches to utilize these findings in helping those who are
deciding if entrepreneurship is good for them.
In terms of future research, it is suggested that the research be extended by treating personal
attitude as a mediating effect to find out why nowadays people may prefer self-employment
rather than seeking employment. There are a whole lot of factors that are related to
entrepreneurial intention at various levels of analysis (e.g., family size, education level,
Page 65
The effects of self-efficacy on the development of entrepreneurial intention
Journal of Business Management Volume 3 Issue 1 2014 64
ethnicity, age ,etc.). We could not incorporate all such factors in this analysis; future
researchers may wish to broaden their inclusion of such phenomena at their respective levels
of analyses in their studies.
REFERENCES
Ajzen, I. (1991). The theory of planned behavior. Organizational Behavior and Human
Decision Processes, 50, 179-211
Bandura, A. (1982). Self-efficacy mechanism in human agency. American Psychologist, 37,
122-147
Bird, B. (1988). Implementing entrepreneurial ideas: The case of intentions, Academy of
Management Review, Vol. 13. p. 442-453
Boyd, Nancy., and Vozikis, George S. (1994). The Influence of self-efficacy on the
development of entrepreneurial intentions and actions, Entrepreneurship Theory and
Practice, Summer. pp. 63-77
Brockhaus, R.H. (1986). The Psychology of the Entrepreneur, Encyclopedia of
Entrepreneurship. Ed. C.A. Kent, D.L. Sexton, and K.H. Vesper. Englewood Cliffs,
N.J.: Prentice Hall
Chandler G. N., and Jansen E. (1992). The Founder‟s Self-assessed Competence and Venture
Performance, Journal of Business venturing, 7, 223-236
Chen, Ch. C., Greene, P. G., and Crick, A. (1998). Does entrepreneurial self-efficacy
distinguish entrepreneurs from managers? Journal of Business Venturing, 13, 295-316
De Noble, A. F., Jung, D., and Ehrlich, S. B. (1999). Entrepreneurial self-efficacy: The
development of a measure and its relationship to entrepreneurial action. Frontiers
Entrepreneurship Research, Boston: Babson College
Drnovšek, Mateja; Joakim, Wincent and Melissa S. Cardon, (2010). Entrepreneurial self-
efficacy and business start-up: developing a multi-dimensional definition,
International Journal of Entrepreneurial Behaviour & Research, Vol. 16 Iss: 4,
pp.329 – 348
Gartner, W.B. (1989). Some suggestions for research on entrepreneurial traits and
characteristics, Entrepreneurship Theory & Practice. Fall, p. 33
Gist, M. E. (1987). Self-efficacy: Implications for organizational behavior and human
resource management. Academy of Management Review, 12(3), 472-485
Greenfield, S.M. and Strickon, A. (1981) A new paradigm for the study of entrepreneuruship
and social change. Economic Development and social change, p 467-499 Hair, J.F., Black, W.C. Babin, Anderson, R.E. and Tathan, R. L (2006). Multivaraite Data Analysis.
6th Edition, New Jersey. Pearson International Edition
Kim, Min-Sun., and Hunter, John E. (1993). Relationships Among attitudes, Behavioral
Intentions, and behavior. A meta-analysis of Past Reserach. Part 2. Communication
Reserach . Vol. 20 No. 3. Pp. 331- 364
Krueger, N.F., Reily, M.D., and Carsrud, A.L. (2000). Competing models of entrepreneurial
intentions, Journal of Business Venturing 15(5/6): 411-432
Linan, F. (2005). Development and Validation of an Entrepreneurial Intention Questionnaire
(EIQ). IntEnt2005 Conference, Guildford (United Kingdom), 10-13 July
Low, M.B., MacMillan, I.C. (1988). Entrepreneurship: past research and future challenges,
Journal of management, Vol. 14 No2, p.139-161
Mokry, B. W. (1988). Entrepreneurship and public policy. New York: Quorum Books
Nuepert, K.E., Krueger, N.F., Chua, B.L (2004). Entrepreneurial self-efficacy and its
relationship to business plan competitions: an international examination. In
Page 66
The effects of self-efficacy on the development of entrepreneurial intention
Journal of Business Management Volume 3 Issue 1 2014 65
International Entrepreneurship: The Globalization of SME’s Orientation,
Environment and Strategy (Hamid Etemad, Ed), Edward Elgar Publishing Ltd, p: 126-
141
Pennings, J. M. (1982). The urban quality of life and entrepreneurship, Academy of
Management Journal, Vol. 25 p. 63-79
Shapero, A. (1982). Social dimensions of entrepreneurship. In C. A. kent et al. (Eds.),The
encyclopedia of entrepreneurship (pp. 72-89). Englewood Cilffs, NJ: Prentice-Hall
Shapero, A. (1985). Managing Professional People: Understanding Creative Performance,
Free Press, New York
Shapero, A., Sokol, L. (1985). The social dimensions of entrepreneurship. In Kent, C., Sexton,
D., Vesper, K. (eds) The Encyclopedia of Entrepreneurship. Englewood Cliffs, NJ.
Prentice-Hall, Inc. 72-90
Stajkovic, A. D., & Luthans, F. (1998). Self-efficacy and work-related performance: A meta-
analysis. Psychological Bulletin, 124, 240-261
Page 67
The relationship between firm characteristic and corporate governance mechanism with firm‟s intellectual
capital disclosure in Malaysian initial public offerings
Journal of Business Management Volume 3 Issue 1 2014 66
THE RELATIONSHIP BETWEEN FIRM CHARACTERISTIC AND CORPORATE
GOVERNANCE MECHANISM WITH FIRM’S INTELLECTUAL CAPITAL
DISCLOSURE IN MALAYSIAN INITIAL PUBLIC OFFERINGS
Zaifudin Zainol
[email protected]
Universiti Tenaga Nasional
Rashidah Abdul Rahman
[email protected]
Universiti Teknologi MARA
Shahrul Suhaimi Ab. Shokor
[email protected]
Afdzal Aizat Ramli
[email protected]
Universiti Tenaga Nasional
ABSTRACT
The development of value creation in organizations has transformed the functions of
intangible resources. Unfortunately, there has been agreement that information deficiencies
arise from the failure of the traditional financial accounting framework to reflect the value of
intangible resources of today‟s business. This study investigates the relationship between firm
characteristics, corporate governance mechanisms and firm‟s intellectual capital disclosure in
Malaysian IPOs. Correlation and multiple regression analysis are used to examine the
relationship between variables. This study found that firm age, board size, chairman duality
and audit committee size play a significant role in determining the firm‟s level of intellectual
capital disclosure.
Keywords: firm characteristic, corporate governance mechanism, intellectual capital
disclosure, initial public offerings
INTRODUCTION
The development of value creation in firms has been significantly customized through the
globalization of the economy, the advent of the internet and information technology, and also
to boost innovative developments and knowledge skills within industries. These
developments have transformed the functions of intellectual capital resources, which have
become the main factors in growing competitiveness and the strength of a firm (Cordazzo,
2007).
Page 68
The relationship between firm characteristic and corporate governance mechanism with firm‟s intellectual
capital disclosure in Malaysian initial public offerings
Journal of Business Management Volume 3 Issue 1 2014 67
Lately, a lot of companies in Malaysia have shown dedicated interest in reporting intellectual
capital in order to establish an understanding and provide disclosure of the central growth
factors of the companies. The reason for the demand of intellectual capital disclosure is to
achieve more efficient management as well as to increase the companies‟ value. It is also due
to developments in information technology, globalization, new dominating industries, greater
mobility of monetary and actual goods, tougher competition, and the integration of capital
markets (Abdul Rashid et al., 2009; Bukh et al., 2005). Consequently, the particular interest
in external communication applies to both traditional accounting and contemporary types of
reporting such as intellectual capital and supplementary business reporting as well as
prospectuses (Rimmel et al., 2009). Bontis et al. (2004) highlighted that even though the
current Malaysian business are facing a rapid rate of technology growth and increasing
industrialization, most Malaysian businesses are still using and relying on the traditional
financial accounting system and performance measurement approaches; these are suitable for
arm‟s length transactions and may not be suitable in the new competitive environment
(Mustapha & Abdullah, 2004).
Stakeholders will face difficulty to determine the company performance when looking at the
traditional financial statements. The stakeholder will also rely on narrative reporting, thus
increase the relevance of narrative reporting. On the other hand, there has been decreasing
relevance of financial statements (Lev & Zarowin, 1999). Cordazzo (2007) argues that the
insufficient level of publicly available information about these resources made available to
investors in financial markets is due to incomplete treatment of intellectual capital
information by the traditional accounting systems. This situation could have caused higher
cost of capital and information asymmetry especially for companies that have a high level of
intellectual capital information. Less information on intellectual capital will lead to
uncertainty in the marketplace. This negative relation results in higher risk and a larger
compensation required by investors who bear the risk based on low disclosure levels. Hence,
it can be implied that by providing more information, companies will pay a lower cost of
capital (Cordazzo, 2007).
The level of disclosure of intellectual capital has been debated that it is driven by a number of
firm specific variables and CG mechanism. Cordazzo (2007), Rimmel et al. (2009) and Bukh
et al. (2005) argued that firm size, firm age and industry differences play an important role in
determining the firm‟s level of intellectual capital disclosure in IPOs which is can influence
the firm cost of capital and information asymmetry whereas Williams (2000), Haniffa and
Cooke (2000), Abdul Rahman and Mohd Haniffa (2002) and Abeysekera (2010) argued that
CG mechanism is also important in examining the firm‟s level of intellectual capital
disclosure. It is argued that corporate governance has been strengthened with the introduction
of 2007 Revised MCCG in Malaysia, thus increase the level of voluntary disclosure
especially the information on intellectual capital.
The objective of this study is to examine whether the level of intellectual capital disclosure is
related with firm characteristics and corporate governance (CG) mechanisms. Specifically,
the study examines whether the level of intellectual capital disclosure is related to several
firm characteristics (firm age, firm size, industry differences) and CG mechanisms (board
structure, ethnic diversity of the boards, chairman duality, and audit committee size).
The aim of this paper is to give an indication of the relationship between firm characteristics
and CG mechanisms with intellectual capital information in the Malaysia initial public
offering (IPO) prospectuses from Bursa Malaysia in the period of 2006-2010. The rationale
Page 69
The relationship between firm characteristic and corporate governance mechanism with firm‟s intellectual
capital disclosure in Malaysian initial public offerings
Journal of Business Management Volume 3 Issue 1 2014 68
for undertaking this study is due to limited research in intellectual capital disclosure in
Malaysian IPO prospectuses. These provide the opportunity for this study to further enrich
the existing literature and have a better understanding of the current status of intellectual
capital disclosure practices in developing countries, particularly in Malaysia.
LITERATURE REVIEW
Stakeholder-agency theory
In agency theory, principals hire agents to perform some service on their behalf. Thus, the
assumption of a typical agency theory framework is that there is a conflict between the
interest of the shareholders, who are the owners, and the management, who run the
corporation, on behalf of the shareholders (Zahra & Pearce, 1989). In order to monitor the
managers more effectively, shareholders appoint board of directors who act as a link between
shareholders and managers. Thus, the board bears the responsibility to oversee the
management. As such, the agency theory assumes that the corporate board is an essential
internal governance mechanism. However, the board‟s capacity to monitor is jeopardized if
internal members (executives of the corporation or others affiliated with management) make
up the majority of the board. Thus, agency theory argues that an agency relationship has
become the principal focus in analyzing and studying corporate governance. Zahra and
Pearce (1989) explain that the boards are said to perform the critical function of monitoring
and rewarding top executives to ensure shareholders‟ wealth is maximized.
Hill and Jones (1992) argued that other contracts should be considered within an agency
framework, which includes those between managers and the different primary interest groups
of the firm or stakeholder. Stakeholders refer to the groups of constituents who possess a
legitimate claim on the firm. They consist of stockholders, creditors, managers, employees,
customers, suppliers, local communities and the general public. Hill and Jones (1992) also
explained that the managers are the only group of stakeholders who enter into a contractual
relationship with all other stakeholders and have direct control over the decision-making
device of the firm. Therefore, the unique role of managers suggests that they can be
considered to play the role as the agents of other stakeholders; hence the term stakeholder-
agency theory. Other stakeholder groups also place claims on the firm that is, if satisfied,
reduce the amount of resources that management can direct towards the pursuit of growth
through diversification (Hill & Jones, 1992). For instance, meeting employees‟ claims for
higher wages and customers‟ demands for greater quality/lower prices both involve the use of
resources that might otherwise be invested by managers to maximize the growth rate of the
firm. Hence, with higher wages, better knowledge and conducive working conditions, the
employees‟ productivity may improve and thus provide management with more resources i.e.
voluntary disclosures.
Intellectual capital disclosure in prospectuses
The Malaysian Securities Commission (2005) explained that it is mandatory for the
prospectus to include all such information that investors and their professional advisers would
reasonably require and expect to find in the prospectus. This information enables all the
interested parties to make an informed assessment of the assets, liabilities, financial position,
Page 70
The relationship between firm characteristic and corporate governance mechanism with firm‟s intellectual
capital disclosure in Malaysian initial public offerings
Journal of Business Management Volume 3 Issue 1 2014 69
profits and losses, prospects, and rights attached to the securities; it also gives them an
opportunity to evaluate the merits of investing in the securities and to assess the extent of risk
involved in doing so. Some examples of the information include a company‟s pre-listing
performances (earning per share), forecast earnings, potential and risk of the respective
markets. The study done by Abdul Rashid et al. (2009) shows that more intellectual capital
information is disclosed in prospectuses than annual reports.
This is because prospectuses offer additional information on the companies‟ long term
strategy, company risk and future profitability; they are generally more forward looking than
annual reports. Annual reports focus on historical performance while prospectuses provide
information which pertains to companies‟ future prospects (Abdul Rashid et al., 2009).
Previous literature provides examples where researchers (e.g. Bukh et al., 2005; Cordazzo,
2007; Singh and Van der Zahn, 2007; Rimmel et al., 2009) have looked at some initial public
offering (IPO) prospectuses, which were employed by management to describe the shares the
companies are offering to potential investors. It is pertinent to note that prospectuses and
annual reports are tailored to the specific needs of different users. Unlike annual reports that
focus on historical performance, prospectuses provide information that focus on companies‟
future prospects. Cordazzo (2007) asserts that prospectuses offer additional information on
companies‟ long term strategy, business risk and future profitability; it is generally more
future oriented than annual reports. These differences are likely to be reflected in the
disclosure practices of the two documents.
Intellectual capital disclosure and firm characteristics
The extent of intellectual capital disclosure in Malaysia IPO prospectuses can be explained
by three firm characteristics – Company age, company size and industry differences.
Firm age
Firm age has often been seen as a proxy for risk, in the sense that the more established
companies are generally less risky. From this perspective, the extent of a company‟s
disclosure is expected to be related to how long it has been in business. For example, a study
done by Jaggi (1997) and Rimmel et al. (2009) concluded that there were some positive
associations between intellectual capital disclosure and company age, i.e. the number of years
the company has been in business. The mature companies, i.e. companies which have been in
existence for comparatively a longer period of time, are likely to disclose more information
(Jaggi, 1997). This is because the older firms naturally have more resources such as the
number of employees compared to the younger firms to ensure better disclosure in
intellectual capital information.
Firm size
Firm sizes are also likely to influence disclosure. The study of Robb et al. (2001) found that
large firms tend to disclose more information on intellectual capital than smaller firms. This
shows that company size is related to the amount of voluntary disclosure. Another example,
Anton (1955) and Cordazzo (2007) concluded that large companies are more likely to have a
larger ownership base, and that the costs of providing information are more prohibitive for
Page 71
The relationship between firm characteristic and corporate governance mechanism with firm‟s intellectual
capital disclosure in Malaysian initial public offerings
Journal of Business Management Volume 3 Issue 1 2014 70
small companies. The latter problem tends to grow with increased disclosure. However, not
all studies conclude that the size of the company is a significant factor in explaining the
voluntary publication of information. For instance, Wallace (1988), Stanga (1976) and Bukh
et al. (2005) concluded that size is not a significant factor in explaining differences in
companies‟ reporting between Nigeria and the USA. The reason is the cost of disclosure
theory does not have significant importance in the present era of more advanced accounting
systems and instant reporting. Hence, firm size is not an important influence over a firm‟s
level of intellectual capital disclosure.
Industry differences
Industry differences has previously been used to explain differences in disclosure in annual
reports by Bukh et al (2005), Cordazzo (2007) and Rimmel et al. (2009) because there are
differences in industry disclosure norms. Bukh et al. (2005) explained that as intellectual
capital is regarded as being especially important in high-tech industries, it is anticipated that
IT and biotechnology companies will disclose more information than traditional
manufacturing and commercial companies. Furthermore, since the market-to-book values of
IT and biotechnology companies are generally higher, the disclosure of intellectual capital is
relatively important. These results are similar to the findings of Cooke (1989) which stated
that industry differences have significant effects on intellectual capital disclosure; companies
which are categorized as 'trading', disclosed less intellectual capital information than other
industry types.
Intellectual capital disclosure and CG mechanisms
The relationship between intellectual capital disclosures in Malaysia IPO prospectuses with
CG mechanism can be explained by four variables – Ethnic diversity on the board, chairman
duality role, board size and audit committee size.
Board size
Jensen (1993) pointed out that in cases where the number of board members exceeds seven or
eight, it weakens the function of the board and allows the CEO to easily gain control of the
board. When the number of board members is small, the board‟s communication improves,
and the board members are more likely to reach consensus. On the subject of IC disclosure,
Abeysekera (2010) mentioned that Board size can be a “resource” to companies that inform
investors about future earnings through intellectual capital. Such disclosures can help firms to
improve their share price by informing investors about resources not disclosed in financial
statements.
Ethnic diversity on board of directors
A study by Coffey and Wang (1998) on 98 Fortune 500 companies touched on the subjects of
the present dynamic nature of the world‟s business environment and the emergence of greater
power to a wider set of stakeholder groups. It was observed that increased diversity on boards
of directors would improve decision making. Overall, empirical findings support the general
Page 72
The relationship between firm characteristic and corporate governance mechanism with firm‟s intellectual
capital disclosure in Malaysian initial public offerings
Journal of Business Management Volume 3 Issue 1 2014 71
tenants of resource dependence theory that view human resources as the most vital firm level
resource required in establishing competitive advantage. In Malaysia, studies which explore
the connection between board diversity and intellectual capital disclosure is scarce. The study
by Haniffa and Cooke (2000) covers 167 non-unit trust and non-financial companies. The
study shows there is a significant relationship between the ratios of bumiputra directors on
the board and voluntary disclosure. The result of their study seems to be in tandem the belief
that Islamic values encourage transparency in business. Malays, who are generally Muslims,
are expected to be less secretive in terms of disclosure as compared to Chinese.
Chairman duality
Dimma (2002) explains that a widely held company will perform excellently for its
shareholders if the roles of chairman and CEO are separated. The two reasons are: 1)
separation allows the chairman to focus on the board and its members and on sound corporate
governance; 2) The corporation will perform best if power is distributed between the board
and the management. Williams (2000) also supports the separation of the roles of chairman
and CEO because it will enable the board of directors to implement their decisions related to
intellectual capital disclosure in a more effective manner. Lack of duality will also allow the
board to develop a greater affinity with a more diverse set of stakeholders, such as employees
and customers who will increase the firm‟s overall IC disclosure (Williams, 2000). A study
done by Liang and Li (1999) on 228 China private firms and Abdul Rahman and Mohd
Haniffa (2002), found that duality roles of chairman and CEO did not seem to perform as
well as their counterparts with separate board leadership based on accounting performance
measurement, Return on Total Equity (ROE) and Return on Total Asset (ROA).
Audit committee size
In a study done in South Africa by Williams (2000), they found no association between the
size of Audit Committee and firm‟s intellectual capital disclosure. In Malaysia, a study done
by Abdullah (2001) showed that the Malaysian companies which complied with the KLSE
requirement of Audit Committee have at least three members. Similarly, in another study
done by Muhammad Sori et al. (2001) on the compliance of Audit Committee requirement of
the main and second board firms, it was found that most of the Malaysian Audit Committee
fulfilled the minimum number of members required, which is three people.
Theoretical framework
The theoretical framework of this study is to examine the association between intellectual
capital disclosure and firm characteristics. This study also examines the relationship between
intellectual capital disclosure and CG mechanisms. The control variables in this study are
physical, financial performance and auditor‟s reputation.
Page 73
The relationship between firm characteristic and corporate governance mechanism with firm‟s intellectual
capital disclosure in Malaysian initial public offerings
Journal of Business Management Volume 3 Issue 1 2014 72
Independent Variable
Figure 1: The Theoretical Framework on the Relationship between Intellectual Capital
Disclosures, Firm Characteristics and CG Mechanisms in Malaysian IPO
RESEARCH METHODOLOGY
Sample firm
The main study materials are sourced from IPO prospectuses, which will be collected from
the Bursa Malaysia website. This study examines the relationship of firm characteristics and
board structures with intellectual capital disclosure. The sample comprises 130 IPOs applying
for Bursa Malaysia listing on the Main Market and ACE Market for the period from 2006 to
2010. As shown in the table below, the number of companies that were listed during the
period from 2006 to 2010 is 130 which represent the total initial sample during the
observation window.
Out of this total, 35 companies were excluded due to unavailability of prospectuses; 5
companies from Real Estate Investment Trusts (REITS) were also excluded due to lack of
information on independent variables. Hence, the final sample consists of 90 IPOs which
represent 69.23% of the total number of IPOs listed during the review period of 2006-2010.
Dependent Variable
Intellectual capital
level of disclosure
Board Size
Industry Differences
Firm Size
Firm Age
Control Variable
Physical financial
performance and
auditor‟s reputation
Chairman Duality Role
Audit Committee Size
Board Ethnic Diversity
Page 74
The relationship between firm characteristic and corporate governance mechanism with firm‟s intellectual
capital disclosure in Malaysian initial public offerings
Journal of Business Management Volume 3 Issue 1 2014 73
Table 1: Construction of Sampled Companies
Year 2010 2009 2008 2007 2006
Total 34 11 17 28 40
REITS 2 0 0 0 3
Prospectus not
available
0 0 0 6 29
Final sample 32 11 17 22 8
Hypotheses formulation
Firm age
A study done by Bukh et al. (2005) and Cordazzo (2007) found that firm age does not
influence the firm‟s level of intellectual capital disclosure. Meanwhile, Youndt et al. (2004)
argues that new firms will tend to disclose more intellectual capital than the older firms.
However, a study done by Jaggi (1997) and Rimmel et al. (2009) shows that the level of
accuracy of forecasted information disclosed in IPO prospectuses is influenced by the number
of years that a company is in business; the older companies have more accurate forecasts than
younger firms. Therefore, the hypothesis is developed:
H1: Firm age has a positive association with level of disclosure.
Firm size
Premised on the previous literature dealing with voluntary disclosure, there is an indication of
a positive association between firm size and voluntary disclosure. Bukh et al. (2005) and
Rimmel et al. (2009) found no significant relationship of firm size with level of intellectual
capital disclosure. They found that cost of disclosure theory does not have significant
importance in the present era of more advanced accounting systems and instant reporting.
Thus, firm size is not an important influence over a firm‟s level of intellectual capital
disclosure. However, Cordazzo (2007), Anton (1954), Stanga (1976), and Ahmed & Courtis
(1999) and Williams (2000) demonstrate this positive relationship in their studies. Their
results highlight that small companies show less benefits than larger companies by providing
information to their stakeholders. This is because the costs of providing information are more
than the benefits of an increased disclosure. Therefore the hypothesis is developed:
H2: Firm size has a positive association with level of disclosure
Industry differences
Amir and Lev (1996) expect the high-technology companies to disclose more information
than the low-technology firms because their assets include higher levels of intangibles such
as research and development, patents, etc. Meanwhile, Cordazzo (2007) indicates that high
technology companies have only a small effect or no effect at all on intellectual capital level
Page 75
The relationship between firm characteristic and corporate governance mechanism with firm‟s intellectual
capital disclosure in Malaysian initial public offerings
Journal of Business Management Volume 3 Issue 1 2014 74
of disclosure. Similar to a study done by Pulic (1998), the Austrian companies such as
electronics companies, the media and wholesale trade tend to disclose more intellectual
capital compared to the other industries. Bukh et al. (2005) and Rimmel et al. (2009) also
found a significant positive relationship between industry differences and firm‟s level of
intellectual capital disclosure. These bring to another hypothesis;
H3: Industry differences have a positive relationship with the level of disclosure.
Board size
There are contrasting views in respect to the size of the board on voluntary disclosure.
Empirically, Cheng and Courtenay (2006) found that board size is not associated with the
level of voluntary disclosure. Yermack (1996) presents evidence consistent with the theories
that small boards of directors are more effective; he found an inverse association between
board size and firm value. John and Senbet (1998), Williams (2000) and Abeysekera (2010),
Zainal Abidin et al. (2009) advocate that having more members on the board can help in
enhancing monitoring capacities of the board. The study done by Abeysekera (2010) in
Kenyan listed firms also found that firms disclosing more internal structure and strategic
employee competence have larger boards. Therefore, the hypothesis is developed:
H4: Board size has a positive relationship with the level of disclosure.
Ethnic diversity on board of directors
A study conducted by Haniffa and Cooke (2000) show that there is a close relationship
between the ratios of bumiputra directors on the board and voluntary disclosure. The result of
their study seems to support the idea that Islamic values encourage transparency in business.
Malays who are all Muslims, are expected to be less secretive in terms of disclosure than the
Chinese. A study done by Williams (2000) and Coffey and Wang (1998) shows there is
positive relationship between intellectual capital disclosure and the ethnic diversity on the
board of directors. Empirical findings from the study support the proposition of a significant
positive link between greater racial diversity across a board of directors and an organization‟s
intellectual capital disclosure. Therefore the hypothesis is developed:
H5: Board ethnic diversity has a positive relationship with the level of disclosure.
Chairman duality
Liang and Li (1999) found there is no connection between the duality of titles and firm‟s
performance among the small private firms in China. Williams, on the other hand, found that
there is a significant negative link between the separation of the roles of CEO and
chairperson on intellectual capital performance. A study by Haniffa and Cooke (2000) and
Abdul Rahman and Mohd Haniffa (2002) found a significant negative relationship between a
non-executive chair and voluntary disclosure. As such, there is a need to call for good
practice of separation of the roles of chairman and CEO. Based on Haniffa and Cooke‟s
findings on Malaysian corporations, it is hypothesized that an independent chairman will be
inclined to voluntarily disclose more IC. Therefore, the hypothesis is developed:
Page 76
The relationship between firm characteristic and corporate governance mechanism with firm‟s intellectual
capital disclosure in Malaysian initial public offerings
Journal of Business Management Volume 3 Issue 1 2014 75
H6: Chairman Duality role has a negative relationship with the level of disclosure.
Audit committee size
Williams (2000) and Kajola and Sunday (2008) found no association between audit
committee size and firm‟s intellectual capital disclosure. However, Ho and Wong (2001)
found that an effective audit committee should improve internal control. It also acts as a
means of overcoming agency costs. They found the presence of audit committee leads to
improved and increased disclosure. Based on this finding, it is hypothesized that a bigger
audit committee size and more frequent audit committee meetings will encourage more
voluntary disclosure of intellectual capital. Therefore, the hypothesis is developed:
H7: Audit committee size has a positive relationship with the level of disclosure.
Measurement
Disclosure score index (DSI)
The study by Guthrie and Petty (2000) adopted the 24 voluntary disclosure items which are
classified into three most common categories, namely: (i) employee competence, (ii) internal
structure, and (iii) external structure (Sveiby, 1997). Other studies that replicated or extended
the framework include studies by Abeysekera and Guthrie (2005) in Sri Lanka, Bozzolan et
al. (2003) and Cordazzo (2007) in Italy, Brennan (2001) in Ireland, Goh and Lim (2004) and
Abdul Rashid et al. (2009) in Malaysia, Guthrie and Petty (2000) in Australia, Rimmel et al.
(2009) in Japan and Vandamaele et al. (2005) in Netherlands, Sweden and the UK.
Table 2: Intellectual Capital Disclosure Items
Employee Competence Internal Structure External Structure
Know-how Patent Brands
Education Copyright Customers
Vocational qualification Trademarks Customers loyalty
Work-related knowledge Management philosophy Companies' name
Work-related competencies Corporate culture Distribution channel
Entrepreneur spirit Management processes Business collaboration
Information system Licensing agreement
Networking system Favourable contract
Financial relation Franchising agreement
This can be seen in the following formula which is used to calculate the disclosure score
index of the prospectus:
Disclosure Score Index= (
m
i
id1 /M) x 100%
Where di= 1 if the item di is disclosed in the prospectus, and otherwise 0.
M = total number of disclosure items i.e. 24 items.
Page 77
The relationship between firm characteristic and corporate governance mechanism with firm‟s intellectual
capital disclosure in Malaysian initial public offerings
Journal of Business Management Volume 3 Issue 1 2014 76
Table 3: Measurement of Independent Variables
Independent Variable Measurement
Firm Age Date of incorporation until the date of publishing the
IPO prospectuses in the current year
Firm Size Total sales
Industry Differences Dummy variables (1=Trading Service, 0=Other
Industry)
Board size Number of board of directors in a company
Ethnic Diversity on Board of Director Percentage of non-bumiputra directors on the board
Chairman Duality Dummy variables (1=Duality. 0=No Duality)
Audit committee size Number of board of directors serving on the audit
committee
Control variables
The inclusion of the control variables is to avoid intellectual capital performance from being
influenced by other factors. Based on prior research, all the regression models tested were
controlled for the following factors:
a. Physical financial performance
The physical financial performance is referred to as the return on a firm‟s physical assets. It is
anticipated that the return on a firm‟s physical assets may have a positive bearing on a
director‟s decision related to intellectual capital disclosure (Williams, 2000, Rimmel et al.,
2009). If a firm‟s physical performance is deemed satisfactory, then pressure may not be
placed on directors to undertake more immediate short-term goals to churn out financial
returns. As such, greater energy and time may therefore be allocated to the maintenance and
generation of intellectual capital assets such as research and development of patents that may
need time to produce a financial return. Physical financial performance is measured by an
entity‟s return on asset (Abdul Rahman & Haniffa, 2002; Williams, 2000).
b. Auditors reputation
Auditors that are well known and reputable may signal that information disclosed in the
financial statements is of higher quality. This goes to show that an auditor‟s reputation, to
some degree, exerts an influence on the reliability of intellectual capital disclosure in IPOs.
Hence, the choice of auditors becomes one of the controlling factors in this study. The
company will be given one if it is audited by one of the Big 4 firms and zero if it is audited by
other auditing firms, similar to the study done by Zahn et al. (2007).
Model:
DSI = α+ β1AGE+ β2FSIZE + β3INDDIFF + β4BSIZE + β5PERNONBUMI+ β6BDUAL +
β7ACSIZE + β8CONTROL VARIABLES (1)
Where:
DSI = Disclosure score index for intellectual capital disclosures in IPOs
FSIZE = Firm size measured by company's total assets
Page 78
The relationship between firm characteristic and corporate governance mechanism with firm‟s intellectual
capital disclosure in Malaysian initial public offerings
Journal of Business Management Volume 3 Issue 1 2014 77
AGE = Firm age measured by years of incorporation
INDDIF = Industry differences classified into 11 categories
BSIZE = Total number of individuals elected as directors on the firm‟s board at the
time of listing
PERNONBUMI = Percentage of Non Bumiputra directors held on the board
BDUAL = Dummy variable if the position of chairman of the board and chief
executive officer is occupied by the same individual at the time of listing is
scored as one (1); otherwise a zero (0)
ACSIZE = Number of individual elected as audit committee at the time of listing
DATA ANALYSIS AND RESEARCH FINDINGS
Spearman correlation coefficients
The results below show the correlation of disclosure score index (DSI) is significant with
firm age (AGE), board size (BSIZE), chairman duality (BDUAL) and audit committee size
(ACSIZE) but insignificant with firm size (FSIZE), industry differences (INDIFF) and
percentage of non bumiputra (PERNONBUMI). The result also shows DSI is insignificant
with control variables, namely physical financial performance (ROA) and auditor reputation
(AUREP).
For the correlation between independent variables, the study found that industry differences
(INDIFF) are negatively significant with the percentage of non bumiputra (PERNONBUMI)
and board size (BSIZE) negatively significant with chairman duality (BDUAL). For the
correlation between independent variables and control variable, the study found that firm size
(FSIZE) is positively significant with the two control variables, namely physical financial
performance (ROA) and auditor reputation (AUREP).
Table 4: Spearman Correlation Matrix (N=90)
DSI AGE FSIZE INDIFF BSIZE PERNONBUMI BDUAL ACSIZE ROA AUREP
DSI 1.000 .289** .070 -.007 .354** -.139 -.249* .270** -.058 .152
AGE .289** 1.000 -.026 .074 .147 .037 -.038 -.013 .075 .073
FSIZE .070 -.026 1.000 .051 .118 -.126 -.010 .109 .364** .397**
INDIFF -.007 .074 .051 1.000 .065 -.219* .032 -.096 .074 -.054
BSIZE .354** .147 .118 .065 1.000 -.139 -.225* .179 .057 .108
PERNONBUMI -.139 .037 -.126 -.219* -.139 1.000 .115 -.180 .145 -.151
BDUAL -.249* -.038 -.010 .032 -.225* .115 1.000 -.134 -.007 -.054
ACSIZE .270** -.013 .109 -.096 .179 -.180 -.134 1.000 -.003 .064
ROA -.058 .075 .364** .074 .057 .145 -.007 -.003 1.000 .007
AUREP .152 .073 .397** -.054 .108 -.151 -.054 .064 .007 1.000
** Correlation is significant at the 0.01 level (2-tailed)
* Correlation is significant at the 0.05 level (2-tailed)
Page 79
The relationship between firm characteristic and corporate governance mechanism with firm‟s intellectual
capital disclosure in Malaysian initial public offerings
Journal of Business Management Volume 3 Issue 1 2014 78
Regression analysis
Table 5: Multiple Regression Analysis
All years (2006-2010) Beta t Sig.
(Constant)
-2.787 0.007
Firm Characteristics
Firm age (AGE) .317 3.271 0.002*
Total Sales (FSIZE) -.127 -1.282 0.204
% type of industry (INDIFF) .026 0.265 0.792
CG Mechanisms
No. of Board of Directors (BSIZE) .250 2.449 0.017**
% of Non Bumiputra Directors (PERNONBUMI) -.049 -0.480 0.633
Chairman and Executive Director (BDUAL) -.158 -1.678 0.097***
No. of Audit Committee (ACSIZE) .172 1.789 0.077***
Control Variables
Physical Financial Performance (ROA) -.006 -0.065 0.949
Auditor Reputation (AUREP) .125 1.312 0.193
Model
Model Summary
R-Squared 0.337
Adjusted R-Squared 0.262
F-Statistics 4.517
p-value 0.00
*Significant at 0.01 level;**Significant at 0.05 level;***Significant at 0.10 level
Firm age
The results above show positively significant relationship between firm age and intellectual
capital level of disclosure at 1% level. Thus, Hypothesis 1 which states that there is a
significant positive relationship between firm age and intellectual capital disclosure is
accepted. This result is similar to the study done by Rimmel et al. (2009) in Japan and Jaggi
(1997) who found that there is positive significant relationship between firm age and
intellectual capital disclosure in IPO prospectuses. The results indicate that the history of the
company does matter to the capital market, and the track record of companies is continually
emphasized by capital market actors. The results also indicate the mature companies, i.e.
companies which have been in existence for comparatively longer periods of time, are likely
to disclose more intellectual capital. This is probably because of their experience in the
business (Jaggi, 1997).
However, the study is contrary to Bukh et al. (2005) who found that firm age does not have a
significant relationship with firm intellectual capital disclosure. Cordazzo (2007) also found
there is no significant relationship between firm age and intellectual capital disclosure in
Italian IPO prospectuses. Thus, this study indicates that the firm age has the greater impact on
Page 80
The relationship between firm characteristic and corporate governance mechanism with firm‟s intellectual
capital disclosure in Malaysian initial public offerings
Journal of Business Management Volume 3 Issue 1 2014 79
the decision making process that would lead to improvement in the level of intellectual
capital disclosure in Malaysian IPO prospectuses.
Firm size
The results of this study show negative, but no significant relationship between firm size and
intellectual capital disclosure in Malaysian IPOs. Thus, Hypothesis 2 which states that there
is a significant relationship between firm size and intellectual capital disclosure in
prospectuses is rejected. This study supports the findings from Rimmel et al. (2009) and
Stanga (1976) who found company size had no significant influence on the extent of
disclosure by Japanese companies on intellectual capital disclosure. Bukh et al. (2005) also
did not find a significant relationship between firm size and firm‟s level of intellectual capital
disclosure. This study indicates that large companies did not disclose more information and
details as compared to small companies. On the contrary, Cordazzo (2007) found that there
is evidence that firm sizes are determinants of the level of intellectual capital disclosure in
Italian IPOs. This study indicates that the cost of disclosure theory does not have a significant
importance in the present era of more advanced accounting systems and instant reporting.
Thus firm size is not an important influence over the firm‟s level of intellectual capital
disclosure.
Industry differences
The third objective of this study is to examine the relationship between industry difference of
public listed companies in Malaysia and the firms‟ level of intellectual capital disclosure in
prospectuses. The results show that there is no significant relationship between industry
difference and a firm‟s intellectual capital disclosure. As such, Hypothesis 3 is rejected.
These studies indicate that industry differences have not played a significantly important
factor on the level of intellectual capital disclosure in Malaysian IPOs.
This study is contradictory to the study done by Bukh et al. (2005), Cordazzo (2007) and
Rimmel et al. (2009) who found that industry difference has a positively significant impact
between industry difference and firm‟s intellectual capital disclosure. The result also
contradicts the findings of Cooke (1989) which stated that industry differences has significant
effects on intellectual capital disclosure and that companies categorized as trading/services
disclosed less intellectual capital information than other industry types.
Board size
The fourth objective of this study is to examine the relationship between board size and
intellectual capital level of disclosure in Malaysian IPOs. The results show that there is
positively significant relationship between board size and a firm‟s level of intellectual capital
disclosure at 5% level. Thus, Hypothesis 4 which indicates that there is positive significant
relationship between board size and firm intellectual capital disclosure is accepted.
The result is also similar to the study done by Abeysekera (2010) in Kenyan listed firms and
Zainal Abidin et al. (2009) in Malaysian public listed firms. They examine the influence of
board size on each intellectual capital disclosure outcome and find that firms disclosing more
Page 81
The relationship between firm characteristic and corporate governance mechanism with firm‟s intellectual
capital disclosure in Malaysian initial public offerings
Journal of Business Management Volume 3 Issue 1 2014 80
tactical internal capital and more strategic human capital have larger boards. The result
indicates that having more members on the board can help in enhancing monitoring
capacities of the board and there seems to be no communication and coordination problem
among the board members. These studies indicate that board size in Malaysian public listed
companies is important in influencing the firms‟ level of intellectual capital disclosure.
Ethnic diversity on board of directors
The fifth objective of this study is to examine the relationship between racial diversity of
public listed companies in Malaysia and the firms‟ intellectual capital disclosure. The results
indicate that the percentage of non-bumiputra (Malaysia non-bumiputra and foreigners)
individuals on the boards of directors of Malaysian public listed companies has positive but
no significant relationship to the firms‟ intellectual capital disclosure. As such, Hypothesis 5
which states that there is a significant relationship between the percentage of non-bumiputra
individuals on the boards of directors of Malaysian public listed companies and the firm‟s
level of intellectual capital disclosure is rejected.
These results found in this study are in contrast to the studies by Coffey and Wang (1998)
and Williams & Ho (2001) who found a significant positive relationship between diversity
across the board of directors in terms of racial diversity with the firms‟ performances. Thus,
the results in this study indicate that the existence of non-bumiputra on board have no impact
on the board of directors‟ decision making process that would lead to improvement in
intellectual capital disclosures.
Chairman duality
The results of this study also found a negatively significant relationship with regard to
separation between chairman and chief executive officer and intellectual capital disclosures at
10% level. Thus, Hypothesis 6 which states that there is a significant relationship between
role duality (same person occupying the post of Chairman and CEO) in Malaysian public
listed companies and the firms‟ intellectual capital disclosure is accepted. The results of this
study are similar to the study by Abdul Rahman and Mohd Haniffa (2002). They found the
companies with role duality seemed not to perform as well as their counterparts with separate
board leadership in disclosing intellectual capital information. However, Williams (2000) on
the other hand, found a positive significant relationship when the roles of CEO and chairman
are combined. The result of this study is also contrary to Liang and Li (1999) who also found
no relationship between role duality and a firm‟s disclosure. Thus, the results in this study
suggest that a board with role duality may be biased in its decision making that leads to
increase in the intellectual capital level of disclosure. As such, the results of the current study
imply that a clear separation of duties between the board chairman and CEO is an important
factor in determining the intellectual capital level of disclosure. The board cannot be seen as
effective and independent if the board chairman is also the CEO of the company as a conflict
of interests will inevitably arise and the risk of one person dominating the decision making
and the running of the company is high.
Page 82
The relationship between firm characteristic and corporate governance mechanism with firm‟s intellectual
capital disclosure in Malaysian initial public offerings
Journal of Business Management Volume 3 Issue 1 2014 81
Audit committee size
The results show a positive significant relationship between audit committee size and
intellectual capital level of disclosure at 10% level. Thus, Hypothesis 7 which states that there
is a significant positive relationship between the audit committee size of Malaysian public
listed companies and the firm‟s level of intellectual capital disclosure is accepted.
The results are similar to Ho and Wong (2001) who found that an effective audit committee
should improve internal control. It also acts as a means of overcoming agency costs. They
found the presence of audit committee leads to improved and increased disclosure. However,
this study is in contrast to the findings by Williams (2000); this result suggests that the audit
committee size does not have any impact on the level of intellectual capital disclosure. Thus,
these results indicate that audit committee size plays an important role in determining the
level of intellectual capital disclosure in firms. The larger the audit committee size, the higher
is the level of intellectual capital disclosure.
Control variables
Table above also shows that physical financial performance (ROA) and Auditor Reputation
(AUREP) for all years (2006-2010) has no significant relationship with the firms‟ level of
intellectual capital disclosure in Malaysian IPOs. These indicate that ROA and AUREP do
not play an important role in determining the level of intellectual capital disclosure.
CONCLUSION
The overall findings in this study do not appear to provide complete support for a stakeholder
or agency theoretical perspective to explain the association between CG mechanisms and
intellectual capital disclosure in Malaysian IPOs. The findings also do not provide complete
support of the information asymmetry theory in explaining the firm characteristics and
intellectual capital disclosure. Rather, the findings show that the Malaysian boards should
support the stakeholder-agency theory and information asymmetry theory where the directors
should be taking care of the stakeholders and not only the shareholders. The implication of
this conclusion is that the boards of directors of public listed companies in Malaysia must
adjust their decision-making processes to meet rapid changes and the importance of
disclosing intellectual capital.
Directors must address the needs of stakeholder groups such as employees, suppliers,
customers and creditors in order to disclose the firms‟ intellectual capital more efficiently. At
the same time, however, strong managerial control has to be maintained to ensure that the
firm remains focused on the dynamic changing business environment when managing and
developing their intellectual capital assets. The company also needs to disclose more
information in the intellectual capital in order to reduce the firm‟s cost of capital and thus
increase the efficiency. Overall, the statistical findings from this study have demonstrated
similar results in most areas of study as compared with previous studies. These results did not
provide any significant relationship between all the control variables with IC disclosure using
disclosure score index (DSI).
Page 83
The relationship between firm characteristic and corporate governance mechanism with firm‟s intellectual
capital disclosure in Malaysian initial public offerings
Journal of Business Management Volume 3 Issue 1 2014 82
REFERENCES
Abdul Rahman, R. & MohdHaniffa, R. (2002). CEO duality and corporate performance:
evidence in Malaysia. Paper presented at International Conference on Corporate
Governance-Trends and Challenges in the millennium, Kuala Lumpur
Abdul Rashid, A., Wan Abdullah, W. M. T., Tarmidi, M. & Zainol, Z. (2009). Voluntary
disclosure of intangible information: a comparative study between prospectuses and
annual reports. Paper presented at International Symposium on Finance and
Accounting 2009, Kuala Lumpur
Abdullah, S.N. (2001). Characteristics board directors and audit committees: among
Malaysian listed companies in period leading to 1997 financial crisis. Akauntan
Nasional, 18-21
Abeysekera, I. (2010). The influence of board size on intellectual capital disclosure by
Kenyan listed firms. Journal of Intellectual Capital, 11(4), 504-518
Abeysekera, I. and Guthrie, J. (2005).An empirical investigation of annual reporting trends of
intellectual capital in Sri Lanka.Critical Perspectives on Accounting, 16(3), 151-163
Ahmed, K. &Courtis, J.K. (1999). Associations between Corporate Characteristics and
Disclosure Levels in Annual Reports: A Meta-Analysis. British Accounting Review,
31, 35–61
Amir, E., & Lev, B. (1996). Value-relevance of nonfinancial information: The wireless
communications industry. Journal of Accounting and Economics, 22, 1-3
Anton, H.R. (1955). Funds statement practices in the United States and Canada. The
Accounting Review, 620-627
Bontis, N. (2004). National intellectual capital index. A United Nations initiative for the Arab
region. Journal of Intellectual Capital. 5(1), 13-39
Bozzolan, S., Favotto, F. &Ricceri, F. (2003). Italian annual intellectual capital disclosure:
An empirical analysis. Journal of Intellectual Capital, 4(4), 543-558
Brennan, N. (2001). Reporting intellectual capital in annual reports: Evidence from Ireland.
Accounting, Auditing and Accountability Journal, 14(4), 423-436
Bukh, P. N., Nielsen, C., Gormsen, P. &Mouritsen, J. (2005). Disclosure of information on
intellectual capital in Danish IPO prospectuses. Accounting, Auditing and
Accountability Journal, 18(6), 713-732
Bursa Malaysia Listing Announcement, Retrieved January 20, 2010 from
http://announcement.bursamalaysia.com
Cheng, E. C. M. & Courtenay, S. M. (2006). Board composition, regulatory regime and
voluntary disclosure. The International Journal of Accounting, 41, 262–289
Coffey, B. S., & Wang, J. (1998), board diversity and managerial control as predictors of
corporate social performance. Journal of Business Ethics, 17(14), 1595-1603
Cooke, T. E. (1989), Voluntary corporate disclosure by Swedish companies, Journal of
International Financial Management and Accounting, 1, 171-95
Cordazzo, M. (2007). Intangibles and Italian IPO prospectuses: a disclosure analysis. Journal
of Intellectual Capital, 8(2), 288-305
Dimma, W.A. (2002). Excellence in the boardroom: Best practices in corporate directorship,
institute of corporate directors, Ontario, John Wiley & Sons Canada Ltd, 69-94
Goh, P. C. & Lim, K. P. (2004).Disclosing intellectual capital in company annual reports:
Evidence from Malaysia, Journal of Intellectual Capital, 5(3), 500-510
Guthrie, J. & Petty, R. (2000). Intellectual capital: Australian annual reporting practices.
Journal of Intellectual Capital, 1(3), 241-250
Haniffa, R. & Cooke, T. (2000). Culture, corporate governance and disclosure in Malaysian
corporations. Paper presented at the Asian AAA World Conference, Singapore
Page 84
The relationship between firm characteristic and corporate governance mechanism with firm‟s intellectual
capital disclosure in Malaysian initial public offerings
Journal of Business Management Volume 3 Issue 1 2014 83
Hill, C.W. & Jones, T.M. (1992). Stakeholder-Agency Theory. Journal of Management
Studies, 29(2), 131-154
Ho, S. S. M. & Wong, K. S. (2001). A study of the relationship between corporate
governance structures and the extent of voluntary disclosure. Journal of International
Accounting, Auditing and Taxation, 10, 139-156
Jaggi, B. (1997). Accuracy of forecast information disclosed in the IPO prospectuses of Hong
Kong companies. The International Journal of Accounting, 32 (3), 301–319
Jensen, M.C. (1993). The Modern Industrial Revolution, Exit, and the Failure of Internal
Control Systems. Journal of Finance. 48(3), 831-880
John, K., Senbet, L. (1998). Corporate governance and board effectiveness, Journal of
Banking and Finance, 22(4), 371-403
Kajola & Sunday O, (2008). Corporate Governance and Firm Performance: The Case of
Nigerian Listed Firms, European Journal of Economics, Finance and Administrative
Sciences, 14, 16-28
Lev, B. and Zarowin, P. (1999). The boundaries of financial reporting and how to extend
them. Journal of Accounting Research, 37(2), 353-385
Liang, N. & Li, J. (1999). Board structure and firm performance: new evidence from china‟s
private firms. Paper presented at the Academy of Management Annual Conference,
Chicago
Malaysia Code of Corporate Governance (Revised 2007). Retrieved December 12, 2010 from
http://www.sc..com.my
Muhammad Sori, Z., Mohamad, S. & Abdul Hamid, M.A. (2001). Compliance of audit
committee requirements: a brief review of the practice. Akauntan Nasional, May, 4-7.
Mustapha, R. & Abdullah, A. (2004). Malaysia Transitions Toward a knowledge-based
economy. The Journal of Technology Studies, 30(3), 51-61
Pulic, A. (1998). Measuring the performance of intellectual potential in knowledge Economy.
Retrieved 1 January 2011 from http://www.measuring-ip.at
Rimmel, G., Nielsen, C. & Yosano, T. (2009). Intellectual capital disclosures in Japanese IPO
prospectuses. Journal of Human Resource Costing & Accounting. 13(4), 316-337
Robb, S. W. G., Single, L. E. & Zarzeski, M. T. (2001).Nonfinancial disclosures across
Anglo-American countries. Journal of International Accounting, Auditing & Taxation,
10 (1), 71-83
Singh, I. and Van der Zahn, J.L. W. M. (2007). Does intellectual capital disclosure reduce an
IPO‟s cost of capital? The case of underpricing. Journal of Intellectual Capital, 8(3),
494-516
Stanga, K. (1976). Disclosure in published annual reports, Financial Management, 5(4), 42-
52
Sveiby, K. E. 1997, The New Organisational Wealth: Managing and Measuring Knowledge
Based Assets, San Francisco, CA, Berrett-Koehler
Vandemaele, S. N., Vergauwen, P. G. M. C. and Smits, A. J. (2005). Intellectual capital
disclosure in The Netherlands, Sweden and the UK: A longitudinal and comparative
study. Journal of Intellectual Capital, 6(3), 417-426
Vergauwen, P., Bollen, L. and Oirbans, E. (2007). Intellectual capital disclosure and
intangible value drivers: An empirical study. Management Decision, 45(7), 1163-
1180
Wallace, R.S. (1998). Corporate Financial Reporting in Nigeria. Accounting & Business
Research, 18(72), 352-362
Williams, S.M. (2000). The association between gender and ethnic diversity of board
structure on the intellectual capital performance of publicly listed companies from an
Page 85
The relationship between firm characteristic and corporate governance mechanism with firm‟s intellectual
capital disclosure in Malaysian initial public offerings
Journal of Business Management Volume 3 Issue 1 2014 84
emerging economy: evidence from South Africa. Retrieved January 10, 2011 from
http://www.vaic-on.net
Williams, S. M. & Ho, C. A. (2001). Testing the association between gender and race
diversity on the boards of directors of publicly listed companies in South Africa and
intellectual capital performance. Area of Accounting, Faculty of Management,
University of Calgary, Canada, 1-37
Yermack, D. (1996). Higher market valuation of companies a small board of directors,
Journal of Financial Economics, 40, 185-202
Youndt M A, Subramaniam, M. & Snell, S.A. (2004). Intellectual Capital Profiles: An
Examination of Investments and Returns, Journal of Management Studies, 41(1), 335-
36
Zahn, J. L. W. M. V.d., Singh, H., & Singh, I. (2007). Association between independent audit
committee members‟ human resource features and underpricing: The case of
Singapore IPOs from 1997-2004. Paper presented at Intellectual Capital Congress
2007, Harlem
Zahra, S.A. & Pearce, J.A. (1989). Boards of directors and corporate financial performance:
A review and integrative model. Journal of Management, 15(2), 291-334
Zainal Abidin, Z., Kamal, N.M. & Jusoff, K. (2009). Board Structure and Corporate
Performance in Malaysia. International Journal of Economics and Finance, 1(1),
150-164
Page 86
Leadership behavior and organizational performance: A case of 100 best co-operatives in Malaysia
Journal of Business Management Volume 3 Issue 1 2014 85
LEADERSHIP BEHAVIOR AND ORGANIZATIONAL PERFORMANCE: A CASE
OF 100 BEST CO-OPERATIVES IN MALAYSIA
Mohd Zainal Munshid bin Harun
[email protected]
Othman B Chin
[email protected]
Sharul Nizam B Salahuddin
[email protected]
Mohd Yunus B Majid
[email protected]
Universiti Tenaga Nasional
ABSTRACT
The purpose of this study was to investigate the effect of transformational leadership
behavior on organizational performance in the case of 100 best co-operatives in Malaysia.
Data were gathered from 100 best co-operatives‟ top management. Data on the respondent‟s
transformational leadership behavior were collected using MLQ-LF. In this study, it was
found that transformational leadership was significantly correlated with organizational
performance. Specifically, the transformational leadership dimensions were found
significantly correlated with organizational performance. Ultimately, this study contributes to
the existing body of knowledge on the effect of leadership and organizational performance
within the co-operatives movement which was considered limited. As such, the results also
offer more comprehensive understanding of the transformational leadership dimensions that
effects performance in the co-operatives movement.
Keywords: leadership behavior, organizational performance, co-operative movement
INTRODUCTION
Theoretical and empirical studies conducted on organizational performance have been a focus
of many scholars over the past thirty years and had been recognized as one of the main
constructs in many business management researches and also as a tool that measures business
success (Tai & Huang, 2007). Furthermore, interdisciplinary researchers and practitioners
have devoted considerable attention to identifying determinants of organizational
performance. The organizational culture (Banton, 2002), the organizational factors (Ortega,
Azorin & Cortes 2010), the organizational learning (Lopez, Peon & Ordas, 2005) and
leadership (Rowe, Cannella, Rankin & Gorman, 2005) have all been reported to have a
connection to organizational performance. But the most prominent determinant of this
interest is the belief and importantly, the leadership behavior that had the most important
effect on the performance of the organization. The effects of leadership on performance are
important because leadership was viewed as one of the key driving forces for improving
Page 87
Leadership behavior and organizational performance: A case of 100 best co-operatives in Malaysia
Journal of Business Management Volume 3 Issue 1 2014 86
organizational performance (Zhu, Chew & Spangler, 2005; Rowe et al., 2005). Bass (1985)
identified three leadership behaviors, namely; transformational, transactional, and passive
avoidance, that have great influence on performance. Bennis (1997) described those leaders
who are adaptive transformational leadership style, the ability to work with many different
types of people, a skill that makes them more effective at creating solutions to difficult
problems while molding their followers to respond to a wide range of responsibilities much
more other leadership styles. Although there are numerous studies reporting that engaging in
transformational leadership style results in higher levels of organizational performance
(Elenkov, 2002; Dvir, Eden, Avolio, & Shamir, 2002; Avolio, 1999; Bass & Avolio, 1994)
few studies have gone so far as to detail out how transformational leadership dimensions
predict performance (Verdigets, 2008; Bass, Avolio, Jung, & Berson, 2003). Moreover,
limited empirical studies have been conducted in explaining the relationship between
transformational leadership style and performance (Jing & Avery, 2008; Elenkov, 2002).
Thus, there is a need to explore this relationship further. The purpose of this study was to
investigate the relationship between transformational leadership and performance.
Specifically, the objective of the study was to investigate the relationship between
transformational leadership dimensions and performance in the context of co-operatives
movement in Malaysia.
Co-operative movement in Malaysia
A cooperative can be described as an autonomous organization where members come
together voluntarily in order to achieve joint interests and joint aspirations in the field of
economics, social aspects and culture, regardless of gender, socio-cultural and religious
beliefs which are owned jointly and democratically controlled (Salleh, Arshad, Shaarani, &
Kasmuri, 2008). Cooperation has been based on the concept of mutual assistance and concern
for the community around it. In addition, there is also such determination of the existence of a
group of people to work together to solve problems faced without external assistance. Thus
the whole structure of the cooperatives is based on the concept of self-reliance and
cooperation in which members have the same rights, duties and responsibilities and agree to
manage it together (Tan & Selvarani, 2008). In Malaysia, co-operative movements have
played a significant economic and social role and demonstrate their relevancy to economic
and social development. Hence, it is a government aspiration to recognize co-operatives
movement to become a Malaysian fourth growth engine after manufacturing, services and
agriculture that can contribute to national economic growth (Tan & Selvarani, 2008). Even
though the cooperative movement has been experiencing a very significant performance,
especially in contributing to economic growth, but it is still unable to achieve a competitive
position in industry (Thuraisingham, 2008). A study by Sapran (2010) on co-operatives
movement from 2002-2010 highlighted that lack of competent leaders and management
practices remained unsolved toward the movement‟s performance. Yusof (2008) found that
it is an advantage to any cooperatives if they have leaders who are very creative and
innovative especially in efficiently and effectively managing organizational resources. It is
important that, the competitive and ever-changing environment in today‟s co-operatives
movement calls for the leadership style to be more flexible and adaptive to meet the ever
increasing challenges of running the co-operative to a high level of performance (Sapran,
2010).
Page 88
Leadership behavior and organizational performance: A case of 100 best co-operatives in Malaysia
Journal of Business Management Volume 3 Issue 1 2014 87
Transformational leadership dimensions and organizational performance
The study of transformational leadership has confirmed that transformational leaders are one
of the paradigms of leadership and has been the focus of various researches since the early
1980‟s (Northouse, 2004; Podsakoff, MacKenzie, & Bommer, 1996). Transformational
leadership styles have been validated against numerous variables that measure organizational
performance (Podsakoff et al., 1996). Patiar and Mia (2009) explained the relationship
between transformational leadership dimensions and performance in the hotel sector.
Performance was measured in terms of financial and non-financial aspect. The results of the
study supported that manager that exhibited transformational leadership styles played
important roles in contributing to the performance. It is noteworthy to study the effect of the
transformational leadership style of performance over a long period of time in a longitudinal
study because the improvements and deterioration in performance could be meaningfully
assessed and it is essential to replicate in other sectors. Idealized influenced leadership was
found as a predictor of financial performance in 48 Fortune 500 firms (Waldman, Ramirez,
House, & Puranam, 2001). In addition, this study found that idealized influence predicted
performance under conditions of uncertainty, but not under conditions of certainty. Another
study conducted by Purvanova and Bono (2009) also highlighted the connection between
transformational leadership dimensions and performance that involved undergraduate
students at a public university. Transformational leadership was examined in the context of
traditional team using face-to-face communication and virtual teams. The results suggested
that the leaders who enhance their transformational leadership behavior achieved higher level
of performance. However, it is possible that the study using a sample of mature respondents
i.e top managers or leaders who are familiar with the teamwork concept, will lead to a
broader explanation of transformational leadership behavior and its performance relationship.
In a longitudinal study, Elenkov (2002) investigated the effects of transformational
leadership behaviors on organizational performance of Russian companies. The sample
consisted of 253 senior managers and 498 immediate subordinates who reported directly to
the senior managers. Transformational leadership behaviors were measured by the MLQ and
the results of the correlation tests showed that the correlation between transformational
leadership factors and organizational performance were high. Overall, the results showed that
that transformational leadership directly and positively predicted organizational performance
of Russian companies over and above the effects of other leadership styles. With regard to the
transformational leadership dimensions, hypothesis from the study stated that there will be a
positive relationship between idealized influence, individualized consideration and
intellectual stimulation and organizational performance. The results indicated that the
idealized influence-organizational performance was positive; individualized consideration-
organizational performance was positive; intellectual stimulation-organizational performance
was also positive. Nemanich and Keller (2006) conducted a study that involved employees in
a major acquisition integration. The researchers addressed the relationships that
transformational leadership and climate had with performance and job satisfaction in an
uncertain environment. Generally transformational leadership was positively related to
acquisition acceptance, performance and job satisfaction. However, transformational
leadership was analyzed separately to explain more accurate findings for the study. The four
dimensions of transformational leadership: idealized influence, inspirational motivation,
intellectual stimulation and individual consideration were added to the analysis. The results
showed that all transformational leadership dimensions were positively related with
performance. In addition it showed that idealized influence had the strongest relationship
with performance. Idealized influence behavior leader has a strong moral conviction about
Page 89
Leadership behavior and organizational performance: A case of 100 best co-operatives in Malaysia
Journal of Business Management Volume 3 Issue 1 2014 88
values and beliefs in any situation and also persistent and effective in influencing positive
consequences for performance. The findings of the study provided insights into a specific
process by which transformational leadership effects subordinates by encouraging
subordinates to demonstrate new ideas, support for creative thinking and new ways to
perform tasks. Li and Hung (2009) employed the role of leader-member relationships in
explaining the relationship between transformational leadership and job performance since
these relationships remain unclear in contemporary organizational literature. Data were
collected from 1,040 teachers in 52 elementary schools in Taiwan. One of the constructs that
was used in the study to measure job performance was task performance. Results of the
hypothesis tested regarding transformational leadership dimensions and job performance
found a positive relationship between these variables. The results showed that
transformational leadership dimensions individualized consideration, inspirational motivation,
idealized influence, and intellectual stimulation all positively and significantly influenced job
performance, thus supporting the hypotheses. However, since the data was collected from
educational institutions which are different from a private organization, it will limit the
generalizability of the results to other industries. Therefore, based on the above discussion,
the following hypotheses were formulated:
H1: There is a relationship between idealized influence and organizational performance.
H2: There is a relationship between inspirational motivation and organizational performance.
H3: There is a relationship between intellectual stimulation and organizational performance.
H4: There is a relationship between individual consideration and organizational performance
METHODOLOGY
Data collection
Before distributing the questionnaire, the researchers asked for a recommendation and
support in the form of a letter from the Malaysia Co-operative Commission to conduct the
study. The justification of conducting the study was highlighted as the main content of the
letter. As such, it highlighted the benefits of this study to the Malaysia Co-operative
Commission directly and indirectly. The Commission also provides the latest directory of
100 best cooperatives in Malaysia. After permission was received from the respective sectors
to conduct the study, a total of 100 questionnaires (comprising a supporting letter from the
Malaysia Co-operative Commission, an introduction letter from the researchers and a full set
of questionnaires) were mailed to the respondents together with a completed self-addressed
envelope. The letter attached with the questionnaire also stressed that the information
provided would be treated with strictest confidence and would be used only for academic
purposes. A soft reminder letter was mailed after one week to all the respondents reminding
them to complete and return the questionnaires. The respondents in this study were
cooperative managers. In the case of 100 best cooperatives, a manager was appointed to run
the overall operational activities. They were considered as the most likely key person that can
furnish information, since they are directly involved in daily activities of the co-operative. In
addition, the influence of their decision making attributes over organizational performance
therefore their feedback is expected to be more substantial.
Page 90
Leadership behavior and organizational performance: A case of 100 best co-operatives in Malaysia
Journal of Business Management Volume 3 Issue 1 2014 89
Measures
Transformational leadership
Multifactor Leadership Questionnaire – Leader Form, a 45 item questionnaire is commonly
used to measure multiple aspects of transactional, transformational, and laissez faire
leadership styles. The validity of this Multifactor Leadership Questionnaire had been
demonstrated in various ways, including factor inter-correlations consistent with theory,
correlations of self rating of outcomes, and correlations of supervisee ratings of leader with
external criteria (Avolio & Bass, 2004). Further, the Multifactor Leadership Questionnaire
had been included in over 75 research studies with findings published in journals,
dissertations, book chapters, conference papers, and technical reports (Lowe, Kroeck, &
Sivasubramaniam, 1996). According to Lowe et al., (1996), the Multifactor Leadership
Questionnaire has been used to study leaders at all levels of both public and private
organizations in business and industry, the military, and educational and religious institutions,
as well as to study organizational measures of performance. The Multifactor Leadership
Questionnaire is the most widely used measure of transformational leadership (Northouse,
2004). For this study, the researcher adopted the questionnaire and used it to measure the
self-perceptions of manager of cooperatives on transformational leadership style. As this
study focused on evaluating transformational leadership, only 20 items were used in
evaluating transformational leadership dimensions. Furthermore, many empirical studies have
shown consistently that these dimensions are highly correlated and that they reflect a higher-
order construct of transformational leadership (Bass & Avolio, 1999). This is consistent with
theoretical developments (Bass, 1998) and empirical studies on transformational leadership
theory (Walumbwa, Wang, Lawler, & Shi 2004; Bono & Judge, 2003; Kark, Shamir, & Chen,
2003; Walumbwa & Lawler, 2003). To complete the questionnaire, each of the 20 descriptive
statement was measured on a five-point scale (1= not at all, 2 = once in a while, 3 =
sometimes, 4 = fairly often, 5 = always) regarding how frequently each statement applies to
the respondent being described.
Organizational performance
Organizational performance was measured by adopting Murphy, Trailer, & Hill (1996)
measures of efficiency, growth, profit, and size, liquidity as it is an advantage when adapting
multiple indicators that incorporates financial and non-financial performance in the
assessment (Mia & Clarke, 1999). The instrument comprised of 6 items. All items were rated
on a five-point Likert-type scale, and were coded on a scale of 5 (significantly higher) to 1
(significantly lower).
Reliability Test
The reliability tests shown in Table 1 indicated an excellent reliability for all its components with a
coefficient alpha of above 0.7 exceeding the minimum acceptable level as suggested by Nunnally
(1978).
Page 91
Leadership behavior and organizational performance: A case of 100 best co-operatives in Malaysia
Journal of Business Management Volume 3 Issue 1 2014 90
Table 1: Overall Internal Reliability
No Variables Reliability
(Cronbach‟s Alpha)
1 Idealized Influence 0.83
2 Inspirational Motivation 0.75
3 Intellectual Stimulation 0.72
4 Individual Consideration 0.72
5 Organizational Performance 0.75
RESULTS
Demographic profile of respondents
Table 1 indicates that most of the respondents were male (96%). The highest percentage of
the respondents were in the age group of 45 and above (75%), followed by the age group
range 41-45 (24%). The responses from the respondents also indicated that 95% had a degree
level of education; 3% had Master/PhD and 2% had a Diploma level of education. Majority
of the respondents have served the cooperatives 11 to 15 year (71%). Furthermore, it showed
that 77 of the cooperatives were intensively involved in credit/finance (77%) as their main
activities. With reference to the cooperative sales, the sample showed that the majority of the
cooperatives were able to generate RM301, 000- RM450, 000 (50%) annually. Finally, it
showed that those cooperatives that has 501- 1,000 members (53%) were already established
for more than 15 years (64%)
Table 2: Demographic Profile
Demographic variable Frequency Percent
Gender
Male 96 96.0
Female 4 4.0
Age
35-40 1 1.0
41-45 24 24.0
Above 45 75 75.0
Education Level
Diploma 2 2.0
Degree 95 95.0
Master /PhD 3 3.0
Services
6 – 10 year 16 16.0
11-15 year 71 71.0
Above 15 years 13 13.0
Main Activity
Credit/Finance 77 77.0
Plantation 11 11.0
Consumer 12 12.0
Yearly Sales
RM150,000 – RM300,000 19 19.0
RM301,000- RM450,000 50 50.0
More than RM451,000 31 31.0
Total Members
251-500 members 15 15.0
Page 92
Leadership behavior and organizational performance: A case of 100 best co-operatives in Malaysia
Journal of Business Management Volume 3 Issue 1 2014 91
501- 1,000 members 53 53.0
More than 1,001 members 32 32.0
Operations
6-10 years 5 5.0
11-15 years 31 31.0
More than 15 years 64 64.0
Correlations
Generally, the findings (Table 2) indicate that all transformational leadership dimensions
were significantly correlated with organizational performance with correlation coefficients
between r = 0.48 and r = 0.62. Specifically, Table 2 displays the results of testing H1 – H4. It
shows that individualized consideration (r = 0.51, p < 0.01), inspirational motivation (r = 0.62,
p < 0.01), intellectual stimulation (r = 0.48, p < 0.01), and individual consideration (r = 0.59,
p < 0.05), were positive and significantly correlated with organizational performance. These
results imply that in the cooperative movement, leaders that exhibited transformational
leadership behavior dimensions were significantly correlated with the organizational
performance.
Table 3: Descriptive Statistics and Correlation Coefficients of the Variables (N=100)
Variable Mean Std
Deviation II IM IS IC OP
II 4.06 .40 1
IM 3.63 .78 .43**
1
IS 4.11 .43 .52**
.72**
1
IC 4.15 .53 .27**
.28**
.24* 1
OP 3.54 .60 .51**
.62**
.48**
.59* 1
Notes:
**. Correlation is significant at the 0.01 level.
*. Correlation is significant at the 0.05 level.
Discussion
This study has been considered as the earliest study that tests whether transformational
leadership styles correlated with organizational performance within the cooperative
movement. Overall, the results demonstrate that cooperative leaders who exhibit
transformational leadership styles will strongly strive for performance and confirmed the
findings of previous research that transformational leadership styles will affect organizational
performance (Li & Hung, 2009; Ling, Simsek, Lubatkin, & Veiga, 2008; Elenkov, 2002).
Specifically, the current results have shown a significant relationship between
transformational leadership dimensions and organizational performance. Cooperatives leaders
who exhibit idealized influence behavior, motivate others to achieve the organization‟s
mission and vision. He/she communicates organization values, purpose and the importance of
the organization's mission to others. The ability of cooperative leaders to effectively
communicate these behaviors to others serves to internalize in the minds and hearts of others
and eventually will enhance the performance. Moreover, in cooperative movement leaders
displayed inspirational motivation by exhibiting behaviors focused on providing motivation
and inspiration to others correlated with performance. This result was also in line with Avolio,
Page 93
Leadership behavior and organizational performance: A case of 100 best co-operatives in Malaysia
Journal of Business Management Volume 3 Issue 1 2014 92
Waldman, & Yammarino (1991) findings that through inspirational motivation, the leader
portrayed commitment, presentation of innovative ideas and was likely to produce
organizational performance beyond expectations. Cooperatives leaders who intellectually
stimulated the creativity of others by encouraging them to question their own, the
organizations, and the leader's beliefs and assumptions ultimately affect group members'
well-being, and overall organizational performance. These results were similar to others
reported in the literature such as Howell and Avolio (1993) whereby they found that
intellectual stimulation were significantly correlated with consolidated performance.
Cooperatives leaders exhibited individual consideration behavior such as giving
individualized attention to others and focused on the developmental needs of the others will
strive for better performance. This implies that leaders should create a more supportive,
warmer, and friendlier atmosphere in the workplace in order to ensure others reach their
highest potential and subsequently organizational performance. Ristow, Amos, and Staude
(1999) found that individual consideration does indeed have an impact and is significantly
correlated with organizational performance.
Implications
Transforming the cooperative movement to a new paradigm in order to sustain its outstanding
performance is in line with the Malaysian government‟s aspiration and commitment to
recognize cooperative movement to be a major contributor, posed a new challenge to
leadership. Engaging in transformational leadership behavior is an effective strategy to help
managers meet these challenges. Transformational leadership behavior such as idealized
influence, inspirational motivation, intellectual stimulation, and individualized consideration
behaviors were significantly connected to better performance. In the cooperative sector,
leaders should engage in transformational behavior, such as providing individualized
attention to support others during the transformation period and should use their skills at
intellectual stimulation to encourage others to think in a new, creative and innovative ways.
This study also benefits to cooperative leaders in understanding the transformational
leadership dimensions and the necessity of adopting all the dimensions in transforming and
sustaining their performance. Following this, perhaps cooperatives can develop strategic roles
and/or make necessary changes to the current practices with regard to leadership. In addition,
this study is also meaningful to cooperative training institutions to develop such training
programs that cover transformational leadership dimensions since limited attention has been
focused on this important area. With respect to management and leadership, the study has
made an important contribution because it provided a new leadership model and possibly
validated the direct and strong correlations between leadership behaviors and organizational
performance. Possibly the study has also validated the anticipated effects of leadership styles
on the member‟s level of cohesiveness. Understanding if certain leadership styles can relate
to the cohesiveness of members is not only necessary, but also important (Senge, 2006).
LIMITATIONS OF THE STUDY
As the respondents were within the cooperative sector, the results of the study may not be
applicable in other sectors. Further, the accuracy of the findings depends upon respondents‟
full understanding of the survey questions and their complete honesty in answering the
survey questions. In addition, beyond the researcher‟s control in determining or identifying
Page 94
Leadership behavior and organizational performance: A case of 100 best co-operatives in Malaysia
Journal of Business Management Volume 3 Issue 1 2014 93
the targeted respondents really answer all the questions due to not thoroughly comprehend
the intent of the questions and therefore, provide inaccurate responses. All variables were
collected using self-reported measures; therefore the results may be inflated by same-source
bias and may have been affected by common method bias. This study does not attempt to
investigate other leadership styles i.e transactional leadership and laissez-faire, but instead
concentrated only on transformational leadership styles, whereas both leadership styles were
much needed especially in explaining the MLQ.
RECOMMENDATIONS FOR FURTHER RESEAERCH
It would also be useful to extend this study to other variables of the MLQ that predict
organizational performance in the same organization. Replication of this study with other
variables i.e transactional leadership styles might show different results. Completing a similar
study using additional measures for organizational performance might yield additional
insights into the importance of transformational leadership and organizational performance in
the context of cooperative movement in the Malaysian setting. As was evidenced in the
literature review in this study, there are numerous other organizational performance measures
that have been documented in other studies and more are being developed. One of the
problems with the current literature is that there is no standard definition or accepted
objective measure of organizational performance. It would be very interesting to repeat this
research with different clusters of cooperatives movement i.e upper, middle and lower
clusters and compare the results to this research to determine if there are differences between
them. To accomplish this research, however, future researchers should identify appropriate
clusters from the above mention sample from the population. This therefore should consider
additional knowledge for the body of literature and the researchers may find a higher
significance level or a stronger relationship between transformational leadership and
organizational performance. Future studies should consider alternative modes of enquires
such as employing the longitudinal method of data collection design (e.g. experiments,
observations or interviews) to better understand the cause and effect relationships at different
phases of time (Sekaran, 2005). It would help in gaining a better understanding of how the
relationship between the transformational leadership styles and organizational performance
within cooperative movement operate over time. Despite some positive findings, it is
important that future research extend the work to different types of organizations settings,
industries and culture in order to assess the generalizabilty of the effect transformational
leadership styles and organizational performance. This research might offer a better
perspective of the conditions that ease or hinder the effectiveness of transformational
leadership styles and organizational performance. Koh, Steers, and Terborg (1995) reported
that transformational leadership styles had a more direct effect on process variables such as
group cohesiveness, which then, in turn, predicted organization performance in a causal
model sense.
CONCLUSION
This study represents one of the first steps toward understanding the connection between
transformational leadership and organizational performance in the context of the cooperative
movement in Malaysia. This study has helped to fill the gap in an effort to improve our
understanding of the role of leadership and organizational performance in the cooperative
Page 95
Leadership behavior and organizational performance: A case of 100 best co-operatives in Malaysia
Journal of Business Management Volume 3 Issue 1 2014 94
movement in Malaysia. In summary this study shows that the relationship between
transformational leadership dimensions and organizational performance were significant.
Therefore, it provides a piece of relevant contribution to the literature with regard to these
relationships, where idealized influence, inspirational motivation, intellectual stimulation and
individual consideration are found to have significantly enhanced organizational performance
in the context of cooperative movement. Today, organizations must excel to meet the various
stakeholder expectations, and it is imperative that leaders adopt transformational leadership
styles consistently where the endurance of the organization depends largely on it.
REFERENCES
Avolio, B. J., & Bass, B. M. (2004). Multifactor leadership questionnaire, Mutual and
Sampler Set, (3rd Ed.). Redwood City, CA: Mind Gard
Avolio, B. J., Waldman, D. A., & Yammarino, F. J. (1991). Leading in 1990s: The four I‟s of
transformational leadership. Journal of European Industrial Training, 15 (4), 9-16
Avolio, B.J. (1999) Full leadership development: Building the vital forces in organizations.
Thousand Oaks, CA: Sage
Banton, M. (2002). Corporate culture and financial performance: A study of corporate culture
and its relationship to the financial performance of an organization. Digital
Dissertation, 63 (12). (UMI No. 3074870)
Bass, B. M., & Avolio, B. J. (1994). Improving organizational effectiveness through
transformational leadership. California: Sage
Bass, B. M., & Avolio, B.J. (1999). Full- range of leadership development: Manual for the
leadership questionnaire. Palo Alto, CA: Mid Garden
Bass, B. M., Avolio, B. J., Jung, D.I., & Berson, V. (2003). Predicting unit performance by
assessing transformational and transactional leadership. Journal of Applied
Psychology, 88, 207-218
Bass, B.M. (1985). Leadership and performance beyond expectations. New York: Free Press
Bass, B.M. (1998). Transformational leadership: Industry, military & educational impact.
Mahwah, NJ: Erlbaum
Bennis, W. G., & Nanus, B. (1997). Leaders: The strategies for taking charge (2nd
ed.). New
York: Harper and Row
Bono, J. E., & Judge, T. A. (2003). Self-concordance at work: Toward understanding the
motivational effects of transformational leaders. Academy of Management Journal, 46
(5), 554–571
Dvir, T., Eden, D., Avolio, B. J., & Shamir, B. (2002). Impact of transformational leadership
on follower development and performance: A field experiment. Academy of
Management Journal, 45(4), 735–745
Elenkov, D.S. (2002). Effects of leadership on organizational performance in Russian
companies. Journal of Business Research, 55, 467– 480
Howell, J.M., & Avolio, B.J. (1993). Transformational leadership, transactional leadership,
locus of control, and support for innovation: Key predictors of consolidated business
unit performance. Journal of Applied Psychology, 78, 891–902
Jing, F.F., & Avery, G.C. (2008). Missing link in understanding the relationship between
leadership and organizational performance. International Business & Economic
Research Journal, 7, 67- 78
Kark, R., Shamir, B., & Chen, G. (2003). The two faces of transformational leadership:
Empowerment and dependency. Journal of Applied Psychology, 88 (2), 246–255
Page 96
Leadership behavior and organizational performance: A case of 100 best co-operatives in Malaysia
Journal of Business Management Volume 3 Issue 1 2014 95
Koh, W. L., Steers, R. M., & Terborg, J. R. (1995). The effects of transformational leadership
on teacher attitudes and student performance in Singapore. Journal of Organizational
Behavior, 16, 319–333
Ling, Y., Simsek, Z., Lubatkin, M.H., & Veiga, J.F. (2008). The impact of
transformational CEOs on the performance of small- to medium-sized firms:
Does organizational context matter? Journal of Applied Psychology, 93 (4), 923–
934
Lopez, S.P., Peon, J.M.M., & Ordas, C.J.V. (2005). Organizational learning as a determining
factor in business performance. The Learning Organization, 12 (3), 227- 245
Lowe, K. B., Kroeck, K. G., & Sivasubramaniam, N. (1996). Effectiveness correlates of
transformational and transactional leadership: A met analytic review. Leadership
Quarterly, 7, 385–425
Mia, L., & Clarke, B. (1999). Market competition, management accounting systems and
business unit performance. Management Accounting Research, 10, 137-158
Murphy, G.B., Trailer, J.W., & Hill, R.D. (1996). Measuring performance in
entrepreneurship research. Journal of Business Research, 36, 15-23
Nemanich, L.A., & Keller, R.T. (2006). Transformational leadership in an acquisation: A
field study of employees. The Leadership Quarterly , 18, 49-68
Northouse, P. G. (2004). Leadership: Theory and Practice (3rd ed.). Thousand Oaks,
California: Sage Publications, Inc
Nunnally, J. (1978). Psychometric theory. New York: McGraw-Hill
Ortega, E.M.P., Azorin, J.F.M., & Cortes, E.C. (2010). Competitive strategy, structure and
firm performance: A comparison of the resource-based view and the contingency
approach. Management Decision, 48(8), 1282 – 1303
Patiar, A., & Mia, L. (2009). Transformational leadership styles, market competition and
departmental performance: Evidence from luxury hotels in Australia. International
Journal of Hospitality Management, 28, 254 -262
Podsakoff, P.M., MacKenzie, S.B., & Bommer, W.H. (1996). Transformational leadership
behaviors and substitutes for leadership as determinants of employee satisfaction,
commitment, trust, organizational citizenship behaviors. Journal of Management, 22,
259–298
Purvanova, R.K., & Bono, E.J. (2009). Transformational leadership in context: Face –to-face
and virtual teams. The Leadership Quarterly, 20, 343 -357
Ristow, A. M., Amos, T. L., & Staude, G. E. (1999). Transformational leadership and
organizational effectiveness in the administration of cricket in South Africa. South
African Journal of Business Management, 30(1), 1-5 Rowe, W.G., Cannella A.A., Jr., Rankin, D., & Gorman, D. (2005) Leader succession &
organizational performance: Integrating the common-sense, ritual scapegoating &
vicious-circle succession theories. The leadership Quarterly, 16, 197-219
Salleh, H.M., Arshad, A., Shaarani, A.F., & Kasmuri, N. (2008). Cooperative movement in
Malaysia. Kuala Lumpur. Gempita Maju Publishing
Sapran, A.S. (2010). Exploiting cooperative movement strengths. Pelancar, 37, 10-11
Sekaran., U. (2005). Research methods for business. India: John Wiley & Sons, Inc
Senge, P. M. (2006). The fifth discipline: The art & practice of the learning organization.
New York: Doubleday
Tai, D.W.S., & Huang, C.E. (2007). The relationship between electronic business process
reengineering and organizational performance in Taiwan. Journal of American
Academy of Business, 10 (2), 296-301
Tan, C.C., & Selvarani, P. (2008, October 15). Coping with cooperatives. New Sunday Times,
pp. 5
Page 97
Leadership behavior and organizational performance: A case of 100 best co-operatives in Malaysia
Journal of Business Management Volume 3 Issue 1 2014 96
Thuraisingham, S. (2008). Cooperatives in Limbo, Malaysian Business
Verdigets, F.L. (2008). Insights into leadership: The role of political skill, social skill and
self-monitoring in mediating the relationship between transformational leadership and
job performance. Unpublished PhD dissertation, Auburn University, Alabama, United
States
Waldman, D.A., Ramirez, G.G., House, R.J., & Puranam, P. (2001). Does leadership matter?
CEO leadership attributes and profitability under conditions of perceived
environmental uncertainty. Academy of Management Journal, 44 (3), 134-143
Walumbwa, F. O., & Lawler, J. J. (2003). Building effective organizations: Transformational
leadership, collectivist orientation, work-related attitudes, and withdrawal behaviors
in three emerging economies. International Journal of Human Resource Management,
14 (7), 1083–1101
Walumbwa, F. O., Wang, P., Lawler, J. J., & Shi, K. (2004). The role of collective
efficacy in the relations between transformational leadership and work
outcomes. Journal of Organizational and Occupational Psychology, 77(4), 515–530
Yusof, R.M. R. (2008). Leadership and challenge in cooperative management. Coop
Dimension, 1, 5-7
Zhu, W., Chew, I.K.H., & Spangler, W.D. (2005). CEO transformational leadership and
organizational outcomes: The mediating role of human-capital-enhancing human
resource management. The Leadership Quarterly, 16, 39-52
Page 98
How corporate social responsibility (CSR) contributes to customer - based brand equity among Malaysian
mobile telcos‟
Journal of Business Management Volume 3 Issue 1 2014 97
HOW CORPORATE SOCIAL RESPONSIBILITY (CSR) CONTRIBUTES TO
CUSTOMER - BASED BRAND EQUITY AMONG MALAYSIAN MOBILE TELCOS’
Abdul Rahman Zahari,
[email protected]
Elinda Esa
[email protected]
Inaliah Mohd. Ali
[email protected]
Universiti Tenaga Nasional
ABSTRACT
The purpose of this study is to analyze the role of corporate social responsibility on customer-
based brand equity. In the proposed model, corporate social responsibility is analyzed as a
source of brand equity and its dimensions. This paper studies the dimensions of customer-
based brand which had been suggested by Aaker (1991). An empirical study was conducted
among the young, adults (18 to 33 years old) in the Malaysian market. Brand equity is
analyzed through Malaysian Mobile Telcos‟ namely Maxis, Celcom, Digi, and U Mobile.
Data were collected from the subscribers of Malaysian Mobile Telcos‟ using mall intercept
sampling method. The data collected was analyzed using exploratory factor analysis,
reliability test, descriptive statistics and regression analyses. According to the findings,
corporate social responsibility shows a positive influence on all dimensions of brand equity as
well as brand equity.
Keywords: corporate social responsibility (CSR), brand equity, gen Y
INTRODUCTION
How best did global brands in 2011 i.e. Exxon Mobil, General Motors, Hawlett-Packard,
Citigroup, and General Electric, maintain their strong brands globally? They succeeded in
doing so due to understanding on the importance of brand equity. Since its appearance in
academic literature in the 1980s, brand equity has been one of the main priorities in marketing
research (Marketing Science Institute, 2002). Since then the marketers and firms have realized
that brand equity is the important stem for the firms to create a strong brand in order to
achieve product or service differentiation and competitive advantage. Thus, the use of
corporate social responsibility as a new platform to be adopted by marketers in developing
brand equity has occurred because Maignan and Ferrell (2001) explored the role of what they
then described as “corporate citizenship” as a marketing instrument. Due to this, the role of
corporate social responsibility is required to be tested in determining the development of
customer-based brand equity.
The previous Prime Minister of Malaysia, Tun Abdullah Badawi developed a „silver book‟
during his tenure to promote more transparency in the ways that companies address and
Page 99
How corporate social responsibility (CSR) contributes to customer - based brand equity among Malaysian
mobile telcos‟
Journal of Business Management Volume 3 Issue 1 2014 98
manage environmental, economic and social issues and which can help to improve
relationships with employees, customers and other stakeholders. Ernst and Young (2002)
suggest that five key drivers have influenced the increasing business focus on CSR, namely,
greater stakeholder awareness of corporate ethical, social and environmental behavior; direct
stakeholder pressures; investor pressure; peer pressure and an increased sense of social
responsibility. The Commission for the European Communities (2001) defined CSR as a
concept whereby companies unite social and environmental concerns in the business activity
and in their interactions with their stakeholders on a voluntary basis. Moreover, Wood (1991)
indicates that the basic idea of CSR is that business and society are interwoven rather than
distinct entities. Besides, Mallenbaker (2005) said that the CSR is about how companies
manage the business process to produce an overall positive impact on society. CSR is seen to
focus on a wide range of potential benefits (Bevan et al., 2004). These include improved
financial performance and profitability; reduced operating costs; long-term sustainability for
companies and their employees; increased staff commitment and involvement; enhanced
capacity to innovate; good relations with government and communities; better risk and crisis
management; enhanced reputation and brand value; and the development of closer links with
customers and greater awareness of their needs.
Resulting from the business benefits and stakeholders‟ concern, therefore the main purpose of
this current study is to analyze the role of corporate social responsibility (CSR) in developing
customer-based brand equity among Malaysian Mobile Telcos‟. The remainder of the paper is
organized as follows: The next section reviews relevant literature. The research method is
then explained. Results and discussions are then provided before concluding the paper.
LITERATURE REVIEWS
Brand equity from the financial perspective, is the total value of a brand which is a separable
asset such as when it is sold, or included in a balance sheet (Feldwick, 1996). Aaker (1991)
defined brand equity as a set of brand assets and liabilities linked to a brand, its name and
symbol that add to or subtract from the value provided by a product or service to a firm and or
to that firm‟s customers. Brand equity has many positive effects to the firms and the
stakeholders in terms of customer loyalty and firm‟s performance. Aaker (1991) proposes that
brand equity creates value for the firm as well as for the customer. This proposition has been
well supported. For example, brand equity affects merger and acquisition decision making
(Mahajan et al., 1994) and stock market responses (Lane & Jacobson 1995; Simon & Sullivan
1993) and determines the extendibility of a brand name (Rangaswamy et al., 1993).
What is more, the customer-based brand equity definitions approach the subject from the
perspective of the consumer; whether it is an individual or an organization and the power of a
brand lies in what customers have learned, felt, seen, and heard about the brand as a result of
their experiences over time (Keller, 2003). If the brand has no meaning to the consumer, none
of the other definitions are meaningful (Keller, 1993; Cobb-Walgren & Ruble, 1995; Rio et
al., 2001a).
The operationalizations of brand equity can be grouped into three different categories for
consideration: the financial aspects of the brand equity measurement, the customer-based
measurement issues, and the combined perspective. After examining the past studies, this
research tries to evaluate the brand equity from a customer‟s view due to two reasons; first,
customer-based brand equity is the driving force for incremental financial gains to the firm.
Page 100
How corporate social responsibility (CSR) contributes to customer - based brand equity among Malaysian
mobile telcos‟
Journal of Business Management Volume 3 Issue 1 2014 99
Second, managers do not have a customer-based measure to evaluate brand equity. In addition,
this study borrows the concept of brand equity initiated by Aaker in 1991.
Aaker built his model of brand equity inclusive of five dimensions; however this study only
chose four domains of brand equity and briefly reviewed below, together with the related
hypotheses which have been separately tested in the succeeding sections of this study. One
domain of brand equity called other proprietary brand assets was dropped out because
previous studies conducted by Yoo et al., (2000), Norjaya et al., (2007), and Gil et al., (2007)
only used four domains. Besides, that element also can be used as the independent variable to
test with the dimensions of brand equity. Aaker (1991) defines brand loyalty as a situation
which reflects how likely is it that a customer will switch to another brand, especially when
that brand makes a change, either in price or in product features. On the contrary, Keller
(2003) examines brand loyalty under the term “brand resonance” which refers to the nature of
the customer-brand relationship and the extent to which customers feel that they are “in sync”
with the brand. Amine (1998) in her literature distinguishes two main approaches to define the
loyalty construct: the behavioral one suggests that the repeat purchasing or uses of a brand
over the times by a consumer expresses their loyalty, and; the attitudinal perspective which
assumes that consistent buying is a necessary but not sufficient condition of „true‟ loyalty and
it must be complemented with a positive attitude towards this brand to ensure that this
behavior will be pursued further. In addition, Chaudhuri and Holbrook (2001) had proposed a
model of loyalty that suggests that purchase loyalty tends to lead to greater market share,
while attitudinal loyalty leads to higher relative services pricing.
Zeithaml (1988) defined perceived quality as the customer‟s perception of the overall quality
or superiority of a product or service with respect to its intended purpose, relative to
alternatives. It is a competitive necessity and many companies today have turned customer-
driven quality into a potent strategic weapon. They create customer satisfaction and value by
consistently and profitably meeting customer‟s needs and preferences for quality. In addition
to the above definition, Kotler (2000) mentioned that perceived quality draws attention to the
intimate connection among product and service quality, customer satisfaction, and company
profitability. Moreover, Parasuraman et al., (1985) mentioned that there are several factors to
be considered in order to analyze and measure perceived quality, such as reliability,
serviceability, appearance, performance, durability and etc. From the definitions given above,
perceived quality relates to the ability of the products or services meet the customer
satisfaction in terms of durability, performance, color, and multiple functions. In other words
the perceived quality can be explained as meeting the satisfying level of customers. From a
manufacturer‟s view, the perceived quality can be achieved through the conformance of the
design with the actual products.
Aaker (1991, p. 61) defines brand awareness as “the ability of the potential buyer to recognize
and recall that a brand is a member of a certain product category”. Moreover, brand awareness
plays an important role in consumer decision making by bringing three advantages; these are
learning advantages, consideration advantages, and choice advantages. Customer-based brand
equity occurs when the consumer has a high level of awareness and familiarity with the brand
and holds some strong, favorable, and unique brand associations in memory (Keller, 2003).
According to Chebat and Hedhli (2009), awareness is the informational node associated with
the name of the brand in the shopper's memory, representing the extent to which a customer is
able to recognize and easily recall the brand or company characteristics.
Page 101
How corporate social responsibility (CSR) contributes to customer - based brand equity among Malaysian
mobile telcos‟
Journal of Business Management Volume 3 Issue 1 2014 100
A brand association is “anything linked in memory to a brand” (Aaker, 1991, p. 109). Besides
that, brand associations may be seen in all forms and reflect characteristics of the product or
aspects independent of the product itself (Chen, 2001). In addition, Chen (2001) states that
product associations and organizational associations are taken as the two most referred to as
brand association typology. Krishnan (1996) argued that the associations could be used as a
general term to represent a link between any two nodes, which suggests an association in the
consumer‟s mind. Campbell (2002) mentions that the brand associations that practitioners
should focus on are those that are “meaningful and relevant to customers” (p. 213) and Hart
and Murphy (1998) state the successful branding is founded on creating distinctiveness in a
consumer relevant way.
Gen Y
In their study, Schiffman and Kanuk (2010) define Generation Y (Gen Y) as an age cohort of
individuals born over a relatively short and continuous period of time includes somewhere
between 80 and 100 million American ages 30 and under in 2008. They are the children of
baby boomers and depending on the source, were born between 1977 and 1994, or between
1982 and 2000. In addition, this age of group have significant buying power. Gen Y is often
typified as being highly consumption oriented and sophisticated in terms of tastes and
shopping preferences (Wolburg & Pokrywczynski, 2001). This group has had a profound
impact on retail businesses because Gen Y members love to shop. Research showed that for
members of Gen Y, social motivation predicts perceptions of atmospheric qualities of a
shopping environment, perceptions of excitement at mall and intention to return to a mall in
the future (Martin and Turley, 2004). According to Foot and Stoffman, (2000), Gen Y is the
most important demographic cohort after the baby-boomer generation. They were born
between 1980 and 1995; these young consumers are today between 13 and 28 years old, half
of which are teenagers (13–19 years old). This group was representing about 60 million
consumers in America (Neuborne & Kerwin, 1999).
Sources of brand equity
Most of the companies are fully utilizing the marketing mix variables such as product, price,
place and promotion as sources of developing brand equity (Pappu & Quester, 2008; Keller,
1993; Berry, 2000; Yoo et al., 2000; Ailawadi et al., 2003; Herrmann et al., 2007; Buil I, et al.,
2011). Furthermore, Keller (2008) mentioned that the brand equity also can be build up
through the integrated marketing communication i.e. media advertising, direct response
advertising, online advertising, place advertising, point-of-purchase advertising, trade
promotions, consumer promotions, event marketing and sponsorship, publicity and public
relation and personal selling.
According to Norjaya et al., (2007), brand equity cannot be fully understood without carefully
examining its sources, that is, the contributing factors to the formation of brand equity in the
consumer‟s mind. For this reason, the marketers need to identify new sources to facilitate the
marketing mix variables in forming the brand equity and understanding the sources makes the
marketers succeed in generating the financial gain and developing brand equity. The studies
conducted by Gil et al., (2007) and Abdul Rahman and Norjaya (2011) indicated that the
family is the source of customer-based brand equity. They had mentioned that the family can
give the useful information before the purchase decision takes place. Besides that, viral
Page 102
How corporate social responsibility (CSR) contributes to customer - based brand equity among Malaysian
mobile telcos‟
Journal of Business Management Volume 3 Issue 1 2014 101
marketing is also considered as a source of customer-based brand equity (Abdul Rahman &
Norjaya, 2011). Due to many sources of customer-based brand equity focusing on marketing
mix variables and non marketing mix variables, this study looks closely at the role of
corporate citizenship as a new source of customer-based brand equity.
Figure 1:Conceptual Framework
From the above Figure 1, the current study tests on the effects of corporate social
responsibility (CSR) on dimensions of brand equity and brand equity. In addition, the
hypotheses are as follows:
H1a : The higher allocation of corporate social responsibility among Malaysian Mobile
Telcos‟, the higher the brand loyalty linked to Malaysian Mobile Telcos‟.
H1b : The higher allocation of corporate social responsibility among Malaysian Mobile
Telcos‟, the higher the brand awareness linked to Malaysian Mobile Telcos‟.
H1c : The higher allocation of corporate social responsibility among Malaysian Mobile
Telcos‟, the higher the brand associations linked to Malaysian Mobile Telcos‟.
H1d : The higher allocation of corporate social responsibility among Malaysian Mobile
Telcos‟, the higher the perceived quality linked to Malaysian Mobile Telcos‟.
H2a : The higher the brand loyalty of Malaysian Mobile Telcos‟, the higher the brand equity.
H2b : The higher the brand awareness of Malaysian Mobile Telcos‟, the higher the brand
equity.
H2c : The higher the brand associations of Malaysian Mobile Telcos‟, the higher the brand
equity.
H2d : The higher the perceived quality of Malaysian Mobile Telcos‟, the higher the brand
equity.
H3 : Corporate social responsibility will have a positive relationship with brand equity
through the mediating effects of brand loyalty, brand awareness, brand associations,
and perceived quality.
Corporate
Social
Responsibility
Brand Equity
Brand Associations
Brand Awareness
Perceived Quality
Brand Loyalty
Page 103
How corporate social responsibility (CSR) contributes to customer - based brand equity among Malaysian
mobile telcos‟
Journal of Business Management Volume 3 Issue 1 2014 102
METHODOLOGY
Using convenience sampling (mall intercept), respondents in this study were Gen Y people
from locations of Klang Valley, Malaysia. Klang Valley was chosen because it is the largest
metropolitan areas that support the largest heterogeneous population as well as a homogenous
group of people. This research was able to obtain a sample size of 300 respondents. Their
completed questionnaires yielded a response rate of 85.71 percent. The respondents were
captured at shopping malls i.e. Mid Valley Megamall, The Mines Shopping Centre, and
Sunway Pyramid Shopping Mall. The participants were real consumers who reported their
usage experiences of Malaysian Mobile Telcos‟ namely Celcom, Digi, Maxis, and U Mobile.
This type of services was chosen because of the commonality and familiarity of these services
among targeted respondents. Furthermore, the present study uses a personally administered
questionnaire survey and the questionnaire consists of five parts: the first part is qualifying
questions about the Telco usage. The second part is dimensions of customer-based brand
equity; the third part refers to the source of customer-based brand equity, which is corporate
social responsibility (CSR). The fourth part represents questions about brand equity and the
last part is pertaining to the respondent‟s profile. Six items have been used to measure
corporate social responsibility and these were adapted from Lichtenstein et al. (2004), Dean
(2003), Berens et al. (2005) and Ricks (2005). The measurement of brand equity dimensions
and overall brand equity were adapted from Yoo, Donthu, and Lee (2000). Perceived brand
quality was adapted from Erdem et al. (2006). Thus, the resulting initial pool contained 25
items. The rating scales of these items were seven points for each. The completed instrument
was pre-tested by 30 respondents in UNITEN. Based on the feedback obtained from these
respondents, the questionnaire was subsequently refined. Data obtained from the personally
administered questionnaire was analyzed using some statistical tools contained in the
statistical software. i.e., „Statistical Package of Social Science‟ (SPSS) 19.0 for Windows.
Besides descriptive analysis, three different statistical analyses were used in this study which
includes factor analysis, a reliability test, and the regression analyses.
RESULT AND DISCUSSIONS
The study sample comprises of 300 respondents who were similar in demographic
characteristics such as gender, age, ethnic, education level, job position level, income level
and marital status. In spite of various demographic characteristics, all respondents are
generation Y. Table 1 below shows the respondents‟ profiles. The study sample constitutes
respondents who depart on such attributes as gender, age, marital status, education level, job
position, income level and ethnicity. From the total of 300 respondents, 44.7 per cent were
male respondents and the remainder 55.3 per cent were female respondents. Also, there were
about 36.0 per cent respondents in the age range between 22 to 25 years old and only 14.7 per
cent of them were in the age range from 30 to 33 years old. The majority of respondents were
not married with 70.0 per cent. Furthermore, with respect to ethnic groups, majority (62 per
cent) are Malays, the remainder of 23.3 per cent were Chinese, followed by Indian, Sabahan,
and Kadazan. Most of the respondents in this current study were degree holders with 56.0 per
cent and then followed by Diploma holders with 18.7 per cent. Moreover, with respect to job
status, the majority of the respondents were students with 32.0 percent, followed by middle
management with 16.7 per cent, and others with jobs such as rectifiers, sales assistant, and
entrepreneurs who represented the smallest percentage (2.0 per cent). On the other hand, 37.7
per cent of the respondents had an income level below than RM 1,000 per month, 66
Page 104
How corporate social responsibility (CSR) contributes to customer - based brand equity among Malaysian
mobile telcos‟
Journal of Business Management Volume 3 Issue 1 2014 103
respondents were able to have monthly salary between RM 2,001 to RM 3,000, and only 6.3
per cent respondents had a monthly salary above than RM 4000 per month.
Table 1: Description of Respondents
Item Description Frequency n = 300 Percentage
Gender Male 134 44.7
Female 166 55.3
Age
18 to 21 years old
75
25.0
22 to 25 years old 108 36.0
26 to 29 years old
30 to 33 years old
73
44
24.3
14.7
Ethnicity Malay 186 62.0
Chinese 70 23.3
Indian 42 14.0
Sabahan 1 0.3
Kadazan 1 0.3
Level of Education SPM/MCE 30 10.0
STPM/HSE 17 5.7
Diploma 56 18.7
Degree 168 56.0
Masters/PHD 25 8.3
Certificate 3 1.0
Matriculation 1 0.3
Job Position Professionals 26 8.7
Top Management 26 8.7
Middle Management 67 22.3
Lower Management 50 16.7
Admin and Technical Support 29 9.7
Student 96 32.0
Rectifier 1 0.3
Entrepreneur 2 0.7
Sales Assistant 3 1.0
Income Level Below 1000 113 37.7
1001 to 2000 58 19.3
2001 to 3000 66 22.0
3001 to 4000 44 14.7
4001 and above 19 6.3
Marital Status Single 210 70.0
Married 90 30.0
Page 105
How corporate social responsibility (CSR) contributes to customer - based brand equity among Malaysian
mobile telcos‟
Journal of Business Management Volume 3 Issue 1 2014 104
Factor analysis was used in the current study to reduce the large set of the variables into a
smaller and manageable number of dimensions or factors. There are two main approaches to
factor analysis such as exploratory and confirmatory. For this current study, the exploratory
factor analysis was selected and conducted due to the need for the researcher to examine
whether the items produce proposed factors and whether the individual items are loaded on
their appropriate factors as intended. This analysis was conducted separately for each variable
by running rotation matrix of direct oblimin. The items for every variable are grouped
separately and principle component analysis (PCA) using SPSS version 19.0 was executed on
it.
From Table 2 shown below, the overall Kaiser-Meyer-Oklin (KMO) value for all variables is
0.935, which exceeds the recommended value of 0.6 (Kaiser 1970, 1974) and the Bartlett‟s
Test of Sphericity (BTOS) reached the statistical significance, which supports the factorability
of the correlation matrix. Furthermore, the communalities value or the estimates of shared
variance among twelve items of brand equity dimensions, six items of corporate social
responsibility, and five items for brand equity are shown to be greater than 0.5. The factor
analysis for all variables revealed the presence of five components of eigenvalues exceeding 1
and contributing 71.32 per cent to item variance. One item was deleted during the process due
to redundant values for two different components. All factors are labeled as brand loyalty,
perceived quality/brand awareness/associations, brand association, corporate social
responsibility, and brand equity. Since the reliability coefficient for brand association is below
the acceptable level as suggested by Pallant.J (2007), where the values above 0.7 are
considered acceptable and values above 0.8 are considered preferable. Thus, the variable is
dropped from further analysis.
Page 106
How corporate social responsibility (CSR) contributes to customer - based brand equity among Malaysian
mobile telcos‟
Journal of Business Management Volume 3 Issue 1 2014 105
Table 2: Result of Exploratory Factor Analysis
Loading TVE KMO BTOS
Brand Awareness/Associations/Perceived Quality
I am aware of my Telco .674
I can recognize my Telco among other competing Telcos‟ .763
In terms of overall quality, I'd rate this Telco as an exceptionally good one
for the industry .679
The quality of services at my Telco is very high .733
Some characteristics of my Telco come to my mind quickly .600
My Telco's performance is first class .751
I think my Telco has far better quality than other Telcos‟ .676
I know how my Telco looks like .720
I can quickly recall the symbol or logo of my Telco .576
Brand Loyalty
I consider myself loyal to my Telco .746
My Telco would be my first choice .807
I would not switch to others, even if I had a problem with my Telco .676
Corporate Social Responsibility
My Telco has shown strong support for Malaysian traditional culture .675
My Telco devotes a lot of time and money to help wide sections of Malaysian .710
My Telco is very active in supporting environmental protection activities .712
My Telco is already committed using a substantial portion of its profits to
help community groups .686
My Telco's business practices are better than industry codes of conduct .681
My Telco's reputation for socially responsible behavior is above average for
the industry .702
Brand Equity
Even if another Telco has a better range of services as my Telco, I strongly
prefer to use my Telco .800
If there is another Telco that offers more convenient services, I still prefer to
use my Telco for everything .752
I have a very strong preference for my Telco .813
My Telco would easily be my first choice for telecommunication services .800
It makes sense to do all telecommunication with my Telco, even if other
Telcos‟ have slightly better services .690
71.32 0.935 0.000
Notes: TVE = total variance explained,
KMO = Keyser-Meyer-Oklin, BTOS = Bartlett‟s Test of Speherecity
In conjunction with the results of exploratory factor analyses, the hypotheses also were
restated as follows:
Page 107
How corporate social responsibility (CSR) contributes to customer - based brand equity among Malaysian
mobile telcos‟
Journal of Business Management Volume 3 Issue 1 2014 106
H1a : The higher allocation of corporate social responsibility among Malaysian Mobile
Telcos‟, the higher the brand awareness/associations/perceived quality linked to
Malaysian Mobile Telcos‟.
H1b : The higher allocation of corporate social responsibility among Malaysian Mobile
Telcos‟, the higher the brand loyalty linked to Malaysian Mobile Telcos‟.
H2a : The higher the brand awareness/associations/perceived quality of Malaysian Mobile
Telcos‟, the higher the brand equity.
H2b : The higher the brand loyalty of Malaysian Mobile Telcos‟, the higher the brand equity.
H3 : Corporate social responsibility will have a positive relationship with brand equity
through the mediating effects of brand awareness/associations/perceived, and brand
loyalty.
The reliability analysis was conducted to test the reliability of the variables. The results
depicted in Table 3 indicate that the variables, namely brand awareness/association/perceived
quality, corporate social responsibility, and brand equity have good internal consistency with
the Cronbach Alpha coefficient reported at 0.925, 0.902, and 0.912 respectively. These
coefficients are considered very good, as suggested by Pivot, Diener, Colvin and Sandvik
(1991) where the scale of good internal consistency is 0.85 and above. The values of
Cronbach Alpha above 0.8 are considered preferable as suggested by Pallant J. (2007). These
are the variable, namely brand loyalty.
Table 3: Summary Result of Reliability Test
Variables Cronbach Alpha Variables Cronbach Alpha
Brand Awareness/Association/
Perceived Quality 0.925
Corporate Social
Responsibility 0.902
Brand Loyalty 0.837 Brand Equity 0.912
Table 4 below summarizes the results of the regression analysis of corporate social
responsibility on dimensions of brand equity, i.e. brand awareness/associations/perceived
quality, and brand loyalty. The results show that the adjusted R2
was 31.0 per cent. This result
shows that only 31.0 percent of variation of brand awareness/associations/perceived quality is
explained by the model using corporate social responsibility as a predictor. The remaining
69.0 per cent remains unexplained and it may be due to other predictors which are more
related to brand awareness/associations/perceived quality. Furthermore, the model is
significant at p (0.01 indicating 99 per cent confidence) in explaining the dependent variable.
Thus, the results support hypothesis 1a and are in line with the previous study conducted by
Chomvilailuk and Butcher (2010). Moreover, adjusted R2
for corporate social responsibility
on brand loyalty was 27.0 per cent. This shows that only 27.0 per cent variation of brand
loyalty is explained by the model using corporate social responsibility as a predictor. The
remaining 73.0 per cent remains unexplained and may be due to other predictors which are
related to brand loyalty. Besides, the model is significant at p (0.01 indicating 99 per cent
confidence) in explaining the dependent variable. Thus, the results support hypothesis 1b.
This result shows that corporate social responsibility is contributing to brand loyalty of
Malaysian Mobile Telcos‟ among Gen Y users. Hence, the Malaysian Mobile Telcos‟ should
Page 108
How corporate social responsibility (CSR) contributes to customer - based brand equity among Malaysian
mobile telcos‟
Journal of Business Management Volume 3 Issue 1 2014 107
be able to allocate more corporate social responsibility activities in getting brand loyalty
among their users.
Table 4: The Relationship of Corporate Social Responsibility on Dimensions of Brand Equity
DV Standardized Beta T Sig. Adjusted R² Sig. F
Brand Awareness/Associations/
Perceived Quality 0.558 11.623 0.000 0.310
0.000
Brand Loyalty 0.522 10.567 0.000 0.270 0.000
The results of regression analysis of brand equity dimensions of brand equity as depicted in
Table 5 above shows that 38.3 per cent variations of brand equity are explained by the model
using brand awareness/associations/perceived quality and brand loyalty as predictors. The
remaining 61.7 percent remains unexplained. It may be due to other predictors which are
related to brand equity. Based on the result of the regression analysis, there is enough
evidence to conclude that the independent variables, i.e. brand
awareness/associations/perceived quality, and brand loyalty have significant influence on
overall brand equity. Based on the models of brand equity dimension to the overall brand
equity (refer table 4.5), this indicates that brand equity is influenced by the level of brand
awareness/associations/perceived quality. The results support hypothesis 2a and this is
consistent with the earlier studies developed by Yoo, Donthu, and Lee (2000). However, the
previous study developed by Atilgan et al., (2005), shows inconsistency with this study
pertaining to perceived quality on brand equity. Therefore, the marketers for Malaysian
Mobile Telcos‟ are encouraged to create brand awareness, brand association and provide a
high quality service to their target markets. In addition, brand loyalty is also found significant
and it may indicate that brand equity is influenced by the level of brand loyalty. Thus, the
results support the hypothesis 2b and this is consistent with the previous studies by Abdul
Rahman and Norjaya (2011), Norjaya et al., (2007), Gil et al., (2007), Atilgan et al., (2005)
and Yoo, Donthu, and Lee (2000) which found that there is a positive relationship between
brand loyalty and brand equity.
Moreover, adjusted R2
for corporate social responsibility was 42.3 per cent. This result shows
that only 42.3 per cent variation of overall brand equity is explained by the model using
corporate social responsibility as a predictor. The remaining 57.3 per cent remains
unexplained and it may be due to other predictors which are more related to brand equity.
Furthermore, the model is significant at p (0.01 indicating 99 per cent confidence) in
explaining the dependent variable and are in line with past study conducted by Ming and
Wang (2010).
Table 5: The Influence of Dimensions of Brand Equity and Corporate Social Responsibility
on Brand Equity
DV Standardized Beta T Sig. Adjusted R² Sig. F
Brand Awareness/Associations/
Perceived Quality 0.286 4.433 0.000 0.383
0.000
Brand Loyalty 0.386 5.986 0.000
Corporate social responsibility 0.652 0.000 0.423 0.000
Page 109
How corporate social responsibility (CSR) contributes to customer - based brand equity among Malaysian
mobile telcos‟
Journal of Business Management Volume 3 Issue 1 2014 108
Mediating effects of brand awareness/associations/perceived quality, and brand loyalty.
Hierarchical multiple regression was used to test the mediating effect and the results are
shown in Table 6 below.
Table 6: Relationship between Corporate Social Responsibility and Brand Equity Mediated
by the Dimensions of Brand Equity
Independent
Variable
Mediating Variable (Dimensions
of Brand Equity)
Model 1
(IV and DV)
Std. Beta
Model 2
(IV and DV with MV)
Std. Beta
CSR Brand awareness/associations/
perceived quality
0.652* 0.118**
CSR Brand Loyalty 0.652* 0.274* Note: * p < 0.001; ** p < 0.05
Model 1 shows the relationship between corporate social responsibility and brand equity.
Model 2 is the mediated regression that shows the relationship between corporate social
responsibility and brand equity with the inclusion of the mediating variable (brand
awareness/associations/perceived quality, and brand loyalty). For mediating effect to exist, the
beta coefficients in Model 2 should be less in Model 1. From the results shown in Table 6,
corporate social responsibility is found to be significant in the regressions mediated by brand
awareness/associations/perceived quality, and brand loyalty, with a decrease in the beta
coefficients. This indicates that brand awareness/associations/perceived quality, and brand
loyalty have partial mediating effects on the linkages between corporate social responsibility
and brand equity. Therefore, this result supports hypothesis 3.
LIMITATION AND FUTURE RESEARCH
Based on the results discussed above, several limitations must be acknowledged for future
study. With regards to the generalizations of the study, the sample of 300 (limited to Gen Y)
is not considered sufficient to represent a full or total Malaysian perspective. However, this
study can be used as a basis to employ generalization purposes of study. Future research
should add more constructs or statements on each variable to ensure that all the dimensions
can be measured in order to support the hypotheses and gain parallel results with previous
studies. Besides, identifying the new non marketing mix elements can also be added in order
to have the customer-based brand equity measurement. Finally, future research should
consider the applicability of findings in other countries and cultures.
CONCLUSION
The result shows that corporate social responsibility has a significant influence on dimensions
of brand equity, i.e. brand awareness/associations/perceived quality, brand loyalty, and as
well as brand equity. In addition, all dimensions of brand equity have a significant influence
in developing brand equity. This study has provided managerial implications that benefit to
Malaysian Mobile Telcos‟ operators in many ways. First, corporate social responsibility is an
important marketing tool for companies as it influences brand equity dimensions. Second, this
study provides them with a tool to measure the brand equity of their current subscribers from
Page 110
How corporate social responsibility (CSR) contributes to customer - based brand equity among Malaysian
mobile telcos‟
Journal of Business Management Volume 3 Issue 1 2014 109
the view of corporate social responsibility. Third, a customer-based brand equity measure
may help Malaysian Mobile Telcos‟ marketers to investigate the effectiveness of their
marketing programs through the implementation of corporate citizenship activities. Fourth,
this kind of measurement (customer-based brand equity) is reasonable and useful for
managers to measure the brand equity over time and may help the Mobile Telcos‟ operators to
surpass the competitors. Furthermore, an understanding of the dynamics between marketing
actions (corporate social responsibility) and brand equity from a customer perspective could
help the Malaysian Mobile Telcos‟ operators in managing and rebuilding the brand equity.
REFERENCES
Aaker, D (1991), Managing Brand Equity: Capitalizing on the Value of a Brand Name, Free
Press, New York, NY
Aaker, D (1993), “Are brand equity investments really worthwhile?'', in Aaker D.A. and
Biel,A. (Eds), Brand Equity and Advertising; Advertising's Role in Building
Strong Brands, Erlbaum, Hillsdale, NJ, pp. 333-41
Aaker, D (1996), Building Strong Brands, Free Press, New York, NY, p. 150
Ailawadi KL, Lehmann DR, Neslin SA. (2003) Revenue premium as an outcome measure of
brand equity. Journal of Marketing, Vol. 67(October), pp. 1–17
Amine, A. (1998), “Consumers‟ True Brand Loyalty: The Central Role of Commitment”,
Journal of Strategic Marketing, 6, 305-319
Atilgan, E., Aksoy, S. and Akinci, S. (2005), “Determinants of the brand equity. A
verification approach in the beverage industry in Turkey”, Marketing Intelligence and
Planning, Vol. 23 No. 3, pp. 237-48
Berens, G., van Riel, C.B.M. and van Bruggen, G.H. (2005), „„Corporate associations and
consumer product responses: the moderating role of corporate brand dominance‟‟,
Journal of Marketing, Vol. 69, pp. 35-48
Berry LL., (2000), Cultivating service brand equity. Journal of the Academy of Marketing
Science, Vol. 28(1), pp. 128–37
Bevan, S., Isles, N., Emery, P. and Hoskins, T. (2004), “Achieving high performance: CSR at
the heart of business”, available at: www.theworkfoundation.com [Accessed 3 April
2012]
Buil I, et al, (2011), “Examining the role of advertising and sales promotions in brand equity
creation”, Journal of Business Research, doi:10.1016/j.jbusres.2011.07.030
Campbell, M.C. (2002), “Building brand equity”, International Journal of Medical Marketing,
Vol. 2 No. 3, pp. 208-18
Chaudhuri, A. and Holbrook, M. B. (2001) The Chain of Effects from Brand Trust and Brand
Effect to Brand Performance: The Role of Brand Loyalty, Journal of Marketing, 65,
81-93
Chebat, J.C., El Hedhli, K., Sirgy M. J. (2009), “How does shopper-based mall equity
generate mall loyalty? A conceptual model and empirical evidence”, Journal of
Retailing and Consumer Services, Vol. 16, pp. 50-60
Chen, H. (2001). “Using Free Association to Examine the Relationship between the
Characteristics of Brand associations and Brand Equity”. Journal of Product and
Brand Management, Vol. 10, No. 7, pp. 439-51
Cobb-Walgren, C.J., Ruble, C.A. and Donthu, N. (1995), “Brand equity, brand preference and
purchase intent”, Journal of Advertising, Vol. 24 No. 3, pp. 25-41
Page 111
How corporate social responsibility (CSR) contributes to customer - based brand equity among Malaysian
mobile telcos‟
Journal of Business Management Volume 3 Issue 1 2014 110
Commission of the European Communities (2001), Promoting a European framework for
Corporate Social Responsibility, available at: http://europa.eu.int/eur-
lex/en/comgpr/2001/ [Accessed 4 April 2012]
Chovilailuk, R. and Butcher, K. (2010), “Enhancing brand preference through corporate
social responsibility initiatives in the Thai banking sector”, Asia Pacific Journal of
Marketing and Logistics, Vol. 22, No. 3, pp. 397-418
Dean, D.H. (2003/2004), „„Consumer perception of corporate donations‟‟, Journal of
Advertising, Vol. 32, No. 4, pp. 91-102
Delgado-Ballester, E. and Munuera-Aleman, J. (2005), “Does brand trust matter to brand
equity?”, Journal of Product & Brand Management, Vol. 14 No. 3, pp. 187-96
Erdem, T., Swait, J. and Valenzuela, A. (2006), „„Brands as signals: a cross-country
validation study‟‟, Journal of Marketing, Vol. 70, pp. 34-49
Ernst & Young (2002), “Corporate social responsibility”, available at: www.ey.nl/download/
publication/download/corporate_social_responsibility.pdf
Fang, Y. C., Yu, H. C., and Yi, H. L. (2012), “Customer perceptions of airline social
responsibility and its effect on loyalty”, Journal of Air Transport Management, Vol 20,
pp. 49-51
Farquhar, P.H. (1989), ``Managing brand equity'', Marketing Research, Vol. 1 pp. 24-33
Farquhar, Peter H., Julia Y. Han, and Yuji Ijiri. (1991). "Recognizing and Measuring Brand
Assets" Marketing Science Institute Working Paper Series. Report No. 91-119.
Cambridge,/VIA: Marketing Science Institute
Feldwick P. Do we really need „brand equity‟? Journal of Brand Management 1996;4(1):9–
29
Foot and Stoffman, (2000), Entre le Boom et L‟Écho. Éditions du Boréal: Collection Info
Presse
Gil, R. B., Andres, F.E., and Salinas M. E. (2007), “Family as a source of customer-based
brand equity”, Journal of Product & Brand Management, Vol.16, No. 3, pp. 188-189
Hart, S. and Murphy, J. (Eds) (1998), Brands: The New Wealth Creators, New York
University Press, New York, NY
Herrmann A, Huber F, Shao AT, Bao Y. (2007), Building brand equity via product quality.
Total Quality Management, Vol. 18(5), pp. 531–44
Keller, K.L. (1993), “Conceptualizing, measuring, and managing customer-based brand
equity'', Journal of Marketing, Vol. 57, pp. 1-22
Keller, K. L. (2003), Strategic Brand Management: Building, Measuring and Managing
Brand Equity. Prentice Hall: New Jersey
Keller, K. L. (2008), Strategic Brand Management: Building, Measuring and Managing
Brand Equity. Prentice Hall: New Jersey
Kim, H. B., & Kim, W. G. (2005). The relationship between brand equity and firms‟
performance in luxury hotels and chain restaurants. Tourism Management, Vol. 26, pp.
549-560
Kotler P. and Armstrong G. (2001), “Principles of Marketing”, Ninth Ed., Prentice Hall
International Inc
Krishnan, H.S. (1996), “Characteristics of memory associations: a consumer-based brand
equity perspective”, International Journal of Research in Marketing, Vol. 13, pp. 389-
405
Lane, V. & Jacobson, R. (1995). “Stock Market Reactions to Brand Extension
Announcements: The Effects of Brand Attitude and Familiarity”. Journal of
Marketing, Vol. 59, No.1
Lassar, W., Mittal, B. and Sharma, A. (1995), “Measuring customer-based brand equity”,
Journal of Consumer Marketing, Vol. 12 No. 4, pp. 11-19
Page 112
How corporate social responsibility (CSR) contributes to customer - based brand equity among Malaysian
mobile telcos‟
Journal of Business Management Volume 3 Issue 1 2014 111
Lee, J. S., & Back, K. J. (2008). Attendee-based brand equity. Tourism Management, Vol. 29,
pp. 331-344
Lichtenstein, D.R., Drumwright, M.E. and Braig, B.M. (2004), „„The effect of corporate
social responsibility on consumer donations to corporate-supported nonprofits‟‟,
Journal of Marketing, Vol. 68 No. 4, pp. 16-32
Mahajan, V., Rao, V. R., and Srivastara, R. K. (1994). “An approach to assess the importance
of brand equity in acquisition decisions”. Journal of Product Innovation Management,
Vol. 11, Issue 3, June 1994, Pages 221-35
Maignan, I. and Ferrell, O.C. (2001), “Corporate citizenship as a marketing instrument”,
European Journal of Marketing, Vol. 35 Nos 3/4, pp. 457-84
Mallenbaker (2005), Corporate Social Responsibility – What Does it Mean?, available at:
www.mallenbaker.net/csr/CSRfiles/definition.html
Marketing Science Institute (2002), “Research priorities 2004-2006”, Marketing Science
Institute, Cambridge, available at: www.msi.org/msi/pdf/MSI_RP04-06.pdf
Martin Craig A, Turley LW. (2004). Malls and consumption motivation: an exploratory
examination of older Generation Y consumers. International Journal of Retail
Distribution Management, 32(10):464–75
Ming, H., and Wang, D. (2010), “Corporate social performance and financial-based brand
equity”, Journal of Product & Brand Management, Vol. 19, No. 5, pp. 335-345
Moore, E.S., Wilkie, W.L. and Lutz, R.J. (2002), “Passing the torch: intergenerational
influences as a source of brand equity”, Journal of Marketing, Vol. 66, April, pp.17-
37
Neuborne Ellen, Kerwin Kathleen, (1999).GenerationY. Business Week:81–8 (February 15).
Norjaya Mohd Yasin, Mohd Naseer Noor and Osman Mohamad (2007), “Does image of
country of origin matter to brand equity?”, Journal of Product & Brand Management,
No. 16/1, pp. 38-48
Norjaya Mohd Yasin and Abdul Rahman Zahari (2011), “Does family and viral marketing
have any effect on brand equity?”, Contemporary Marketing Review, Vol. 1 (8), pp. 1-
13: Available online at http://www.businessjournalz.org/cmr
Pallant J. (2007), “SPSS Survival Manual”, 3rd
Ed., Mc Graw Hill
Pappu R, Quester PG. (2008), Does brand equity vary between department stores and clothing
stores? Results of an empirical investigation. The Journal of Product and Brand
Management, Vol. 17(7), pp. 425–35
Parasuraman, A., Zeithaml, V.A. and Berry, L.L. (1985), “A conceptual model of service
quality and its implications for future research”, Journal of Marketing, Vol. 49 No. 4,
pp. 41-50
Pavot, W., Diener, E., Colvin, C.R. & Sandvik, E. (1991). Further Validation of the
Satisfaction with Life Scale: Evidence for the Cross Method Convergence of
Wellbeing Measures. Journal of Personality Assessment, 57, 149-61
Rangaswamy, A., Burke, R., and Oliva A. (1993), “Brand Equity and the extendibility of
brand names”. International Journal of Research in Marketing, Vol. 1, Issue 1, pp.
61-75
R. Bravo Gil, E. Fraj Andres and E. Martinez Salinas, (2007) “Family as a source of
consumer based brand equity”, Journal of Product & Brand Management, pp. 188-
199
Ricks, J.M. (2005), „„An assessment of strategic corporate philanthropy on perceptions of
brand equity variables‟‟, Journal of Consumer Marketing, Vol. 22 Nos. 2/3, pp. 121-
34
Page 113
How corporate social responsibility (CSR) contributes to customer - based brand equity among Malaysian
mobile telcos‟
Journal of Business Management Volume 3 Issue 1 2014 112
Rio, A., Vazquez, R., and Iglesias, V. (2001), “The Effects of Brand Associations on
Consumer Response”. Journal of Consumer Marketing, Vol. 18, No. 5, pp. 410-25
Schiffman L.G. & Kanuk L.L. (2010), Consumer Behavior, 10th
Edition, Pearson Education,
Inc., Upper Saddle River, New Jersey
Shocker, A. and Weitz, B. (1988), “A perspective on brand equity principles and issues”,
Defining, Measuring and Managing Brand Equity: Conference Summary (Report no
88-104), Marketing Science Institute, Cambridge, MA
Simon CJ, Sullivan NW. The measurement and determinants of brand equity: a financial
approach. Marketing Science 1993;12, (November):28–52
Wolburg Joyce M, Pokrywczynski James (2001). A psychographic analysis of Generation Y
college students. Journal of Advert Res., 2001;41(5):33–53
Wood, D.J. (1991), “Corporate social performance revisited”, Academy of Management
Review, Vol. 16, pp. 691-718
Yoo, B., Donthu, N. and Lee, S. (2000), “An examination of selected marketing mix elements
and brand equity”, Journal of the Academy of Marketing Science, Vol. 28 No. 2, pp.
195-211
Zeithaml, V.A. (1988), “Consumer perceptions of price, quality and value: a means end
model and synthesis of evidence”, Journal of Marketing, Vol. 52, July, pp. 2-22