Assessing the fiscal sustainability of health and long-term care: the EU methodology Christoph Schwierz European Commission Directorate General for Economic and Financial Affairs OECD Paris, 16-17 February 2015
Transcript
Assessing the fiscal sustainability of health and
long-term care: the EU methodology
1
Christoph Schwierz European Commission
Directorate General for Economic and Financial Affairs
OECD Paris, 16-17 February 2015
2
Outline • Context
• Multidimensional approach
• What's next?
The concept of fiscal sustainability
3
• Sustainability of public finances traditionally viewed as solvency of public sector: gov't solvent if expected to honour current and future financial obligations (on time), incl. implicit commitment to continue providing certain public goods, services and transfers
• Present value of gov't disboursements (incl. interest expenditure) not exceeding present value of gov't revenues
or: • Present value of gov't revenues net of non-interest expenditure
(primary balances) at least covering existing public debt ("gov't intertemporal budget constraint")
The concept of fiscal sustainability
4
• Gov't implicit liabilities related to population ageing (pensions, healthcare) accounted for in intertemporal budget constraint • ageing cost projections (EC–MSs) from 2012 Ageing
Report • key for fiscal sustainability analysis/advice in the
frame of European Semester
Why health /long-term care spending poses a fiscal challenge
5
• Most Member States face significant challenges to the sustainability of public finances in medium and/or long-term
• Risk associated with health care (and long-term care) spending is large:70% of the increase in age-related expenditure between 2010-2060 is due to health care and long-term care
• Public spending on health care and long-term care projected conservatively to increase by 2.7 – 3.4 pp. of GDP until 2060 creating substantial fiscal gaps
• Therefore, for many the adjustment passes by looking at the structural component health/long-term care in addition to pensions or education
• Question of affordability: the level of spending depends on preferences but also whether
• S1: Required PB adjustment to reach 60 % debt ratio in 2030
• S2: Required PB adjustment to keep debt bounded over an infinite horizon (intertemporal budget constraint of general government)
6
7
Decomposing the S1 and S2 indicators: sustainability gap indicators depend on
- the short-term fiscal conditions (IBP and debt level); and, - the long-term budgetary developments (CoA)
=2S
Required PB adjustment given the initial budgetary position
(IBP)
Required adjustment to reach debt to GDP ratio
of 60% in 2060 (DR)
Required adjustment due to the cost of ageing
(CoA)
S1= Gap to the debt-stabilising
primary balance + Additional adjustment
until 2020 required to reach a debt target of 60% of GDP in 2030
+ Additional adjustment required to finance the
increase in public expenditure due to ageing up to 2030
S2= Gap to the debt-stabilising primary balance
+ 0 + Additional adjustment required to finance the
increase in public expenditure due to
ageing over an infinite horizon
Structural primary balance, 2014 and average 1998-2012 - IT, PL, HU, MT, SK, RO, LV more than 2 pp. of GDP above the long-term average in 2014 - Fiscal tightening of 3 3/4 pp. of GDP between 2011 and 2014 in IT and ES - BE, DK, FI more than 2 pp. of GDP below the long-term average in 2014
(Healthy) life expectancy in the EU – 2010 and 2060
10
Graph: Healthy life expectancy in the EU – 2010/2060
Graph: Number of dependent people in the EU – 2010/2060, in millions
Gross debt as % of GDP and cost of ageing, AWG baseline and risk scenarios
Cost of ageing – expected increase in health and long-term care public expenditure is a major challenge
11
FSR2012 : Medium term challenges (S1) • 3 Components: CoA=cost of ageing DR= Debt ratio IBP= Initial Budgetary position
12
EU: 1.8% of GDP
FSR2012 : Long term challenges (S2) • Long-term challenges influenced by population ageing
remain important in most countries (S2 indicator)
13
EU: 2.6% of GDP
-2.3
-0.7
0.51.2 1.4 1.5 1.6 1.7
2.12.6 2.6 2.8
3.74.1
4.7 4.85.2
5.55.8 5.8 5.9
6.97.4 7.6
8.2
9.7
-6
-4
-2
0
2
4
6
8
10
12
IT LV HU EE DE PL FR SE EA DK EU27 BG RO AT LT ES UK CZ FI MT NL SK BE SI CY LU
Sustainability indicator (S2)
CoA - Others CoA - HC<C CoA - Pensions IBP S2
FSR2012 : Long term challenges (S2) • Differences in composition of the long-term challenges
14
EU: 2.6% of GDP
Flagging of sustainability challenge on basis of S1 and S2
When do we conclude that there is a challenge in the field of health
or long-term care? 1. Medium term high or medium risk: S1 > 0 and health care or
long-term care contributes significantly to that risk (above the (equally-weighted) average); or
2. Long term high or medium risk: S2 > 2 and and health care or long-term care contributes significantly to that risk (above the (equally-weighted) average).
15
16
Structural fiscal reforms: indicators
Notes: Yellow = CSR not recommended by FS TAF; Orange = No CSR, although recommended by FS TAF
Health care Long-term care
Health care Long-term care
Health care Long-term care
BE 5.4 0.1 0.3 7.2 0.3 1.9 X BEBG -1.2 0.2 0.0 3.4 0.4 0.2 X BGCZ 0.6 0.3 0.1 5.3 1.1 0.4 X CZDK -2.1 0.3 0.5 2.2 0.7 2.6 DKDE 0.1 0.4 0.1 2.1 0.9 0.1 X X DEEE -2.8 0.2 0.0 1.9 0.7 0.2 EEIE 5.2 0.3 0.1 3.2 1.1 1.2 X IEES 0.2 0.2 0.0 0.3 1.2 0.4 X ESFR 2.6 0.3 0.0 1.6 1.0 -0.1 X FRHR 2.2 0.3 -0.1 2.2 2.2 0.0 X HRIT 1.5 0.2 0.1 -1.6 0.6 0.6 ITLV -2.4 0.1 0.0 -0.1 0.4 0.2 X LVLT -1.0 0.1 0.1 4.3 0.4 0.7 LTLU 0.4 0.1 0.2 10.2 0.7 1.5 X LUHU -0.8 0.2 0.1 0.6 0.7 0.3 HUMT 1.6 0.6 0.2 6.2 1.9 0.6 X MTNL 1.2 0.4 0.5 5.3 0.7 2.7 X NLAT 1.7 0.4 0.2 3.5 1.1 0.8 X X ATPL 0.2 0.4 0.1 2.5 1.5 0.6 X PLPT 2.6 0.3 0.0 -0.8 1.3 0.2 X PTRO -0.5 0.2 0.1 4.5 0.7 0.6 X ROSI 1.9 0.3 0.2 6.6 0.8 1.1 X X SISK -0.1 0.5 0.0 4.3 2.0 0.2 X SKFI 2.1 0.3 0.5 6.0 0.7 1.9 X FISE -1.6 0.2 0.4 3.4 0.5 2.0 SEUK 4.3 0.2 0.1 4.9 0.8 0.5 UK
hresho 0.0 0.3 0.1 2.0 0.9 0.8
Actual CSR 2014Sustainability indicator
(S1)
2016-2030, of which:Sustainability indicator (S2)
2016-2060, of which:
Upside and downside risks Initial budgetary position
• What is the structural balance in 2014? • Will countries be able to keep the high level of SPB for
a long period?
Medium- to long-term impact of the crisis on potential growth and interest rates • This is not cycle as usual
Are long-term expenditure trends underestimated? • Very large uncertainty in relation to health care (non-
demographic drivers?)
Demography-related risks • Are we underestimating gains in longevity? • Are we underestimating migration flows?
17
What's next ?
18
• CRs in end February, with IDR and debt analysis
• CSRs in May • Ageing Report 2015 in May • Fiscal Sustainability Report in
end 2015
Council conclusions on the FSR 2012 (12/2/2013)
• WELCOMES the work of the Commission on the multidimensional approach for assessing fiscal sustainability, based on short-, medium- and long-term challenges developed in the Commission "Fiscal Sustainability Report 2012";
• UNDERLINES the need to return to sustainable positions through determined action to improve fiscal positions further in a continuous and steadfast manner in line with the Stability and Growth Pact;
• UNDERLINES that comprehensive and adequate reforms, notably of pension, health care and long-term care systems, can have a substantial positive impact on long-term fiscal Sustainability;
• [REAFFIRMS] Ensuring the sustainability of public finances is a challenge which should be reflected in economic policy coordination in the EU.
The Fiscal Sustainability Report 2012 can be found on DG ECFINs website:
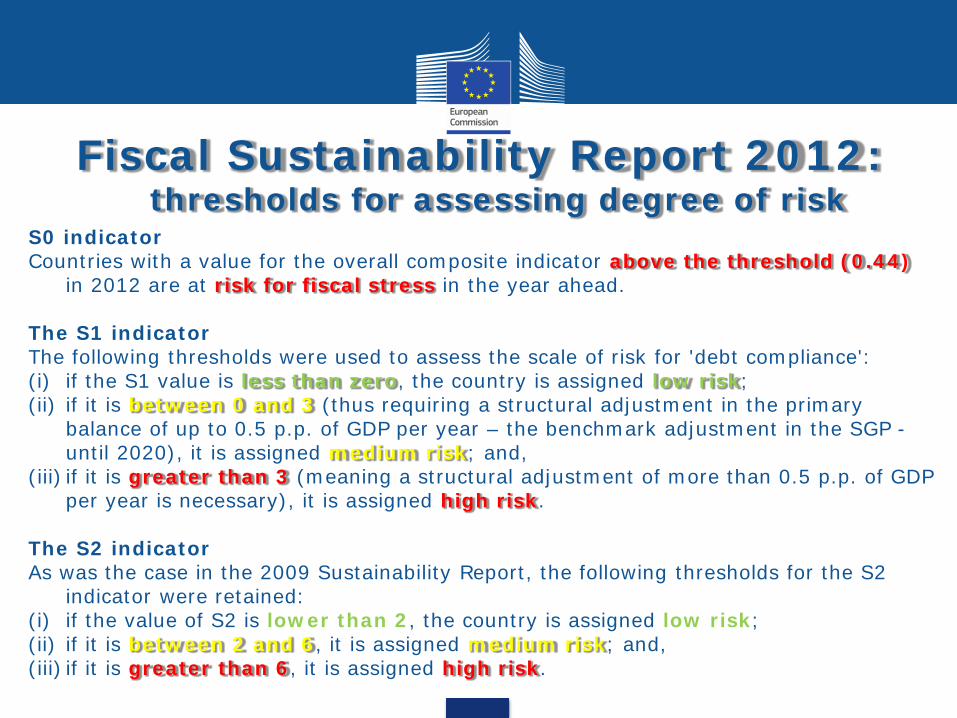
Fiscal Sustainability Report 2012: thresholds for assessing degree of risk
S0 indicator Countries with a value for the overall composite indicator above the threshold (0.44)
in 2012 are at risk for fiscal stress in the year ahead. The S1 indicator The following thresholds were used to assess the scale of risk for 'debt compliance': (i) if the S1 value is less than zero, the country is assigned low risk; (ii) if it is between 0 and 3 (thus requiring a structural adjustment in the primary
balance of up to 0.5 p.p. of GDP per year – the benchmark adjustment in the SGP - until 2020), it is assigned medium risk; and,
(iii) if it is greater than 3 (meaning a structural adjustment of more than 0.5 p.p. of GDP per year is necessary), it is assigned high risk.
The S2 indicator As was the case in the 2009 Sustainability Report, the following thresholds for the S2
indicator were retained: (i) if the value of S2 is lower than 2, the country is assigned low risk; (ii) if it is between 2 and 6, it is assigned medium risk; and, (iii) if it is greater than 6, it is assigned high risk.
Assessing the medium- and long-term sustainability of public finances
23
Initial Level- Level of Debt- Structural Primary Balance
Sustainability Indicators
Projected development - S1
- Structural Primary balance
- S2
- Property Income
Age-related Expenditure
- Pensions
- Health Care
- Long-term Care- Education- Unemployment
Macroeconomic Variables
- Real Interest Rate- Potential GDP Growth
EURO
STAT
Dem
ogra
phic
Pro
ject
ion
Com
mis
sion
For
ecas
tAg
eing
Rep
ort
Required Adjustment Given the Initial
Budgetary Position
Required Adjustment Given the Cost of
Ageing
Required Adjustment Given the Debt Requirement
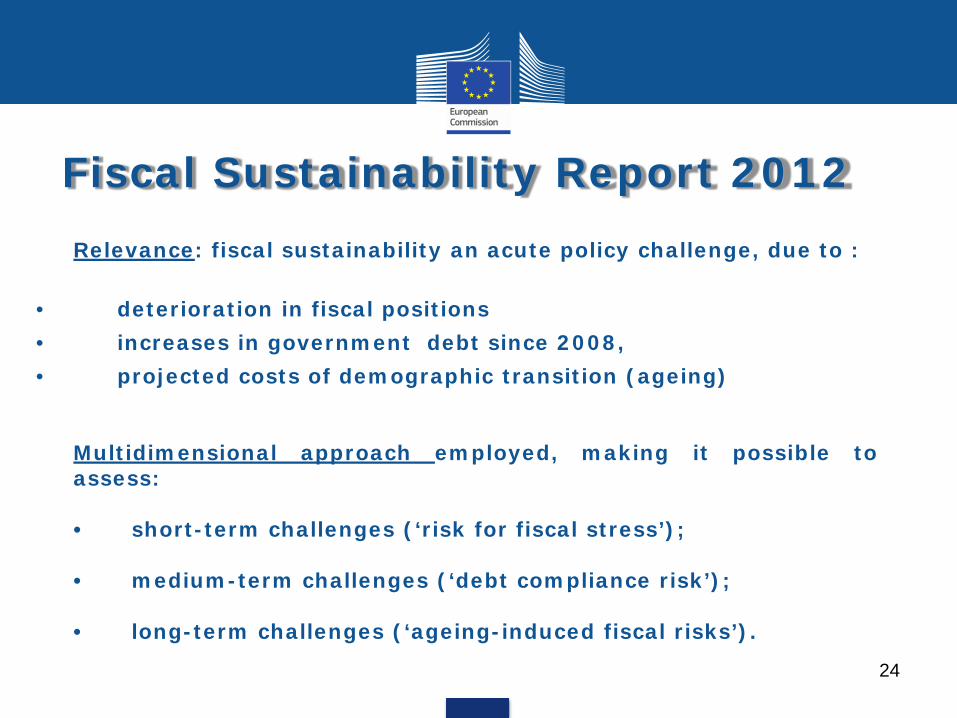
Fiscal Sustainability Report 2012
Relevance: fiscal sustainability an acute policy challenge, due to : • deterioration in fiscal positions • increases in government debt since 2008, • projected costs of demographic transition (ageing) Multidimensional approach employed, making it possible to
assess:
• short-term challenges (‘risk for fiscal stress’);