22/01/2014 1 Assessing the Impact of Household Water Treatment and Safe Storage (HWTS) Learning Expectations By the end of this module, participants will be able: • Discuss the differences between direct and indirect assessments of the health impact of HWTS • Explain the challenge in undertaking direct health impact studies • Describe the three key areas of focus for the indirect assessment of HWTS • Discuss appropriate data collection methods and indicators for use in an HWTS impact assessment.
Transcript
22/01/2014
1
Assessing the Impact of Household Water
Treatment and Safe Storage(HWTS)
Learning ExpectationsBy the end of this module, participants will be able:
• Discuss the differences between direct and indirect
assessments of the health impact of HWTS
• Explain the challenge in undertaking direct health
impact studies
• Describe the three key areas of focus for the
indirect assessment of HWTS
• Discuss appropriate data collection methods and
indicators for use in an HWTS impact
assessment.
22/01/2014
2
Session Flow
Part 1: What impacts do we expect from HWTS?
Part 2: The challenge of direct health impact assessments.
Part 3: Alternatives to direct health impact assessments.
Part 4: Sampling and presenting results.
Part 5: Group practical activity.
Part I
What Impacts Do We Expect from HWTS?
22/01/2014
3
What impacts (changes) do we expect to see as a result of
HWTS projects?
Photo Credits: CAWST
What is the difference between an outcome and a purpose?
22/01/2014
4
Outcome versus Purpose
• Outcome – A direct result of the project that has been implemented. – e.g. A project to distribute filters and train on filter use should
lead to people using the filters and therefore having better water quality.
• Purpose – The reason for which the project has been implemented. We expect that the results of the project will contribute to achieve this change but the project alone may not be sufficient to achieve this, other factors will also contribute. – e.g. A project to distribute filters is hoped to contribute to reduced
diarrhoea BUT is not guaranteed to do so unless hygiene and sanitation practices are improved.
* Based on Blum D & Feachem RG (1983). Measuring the impact of water supply
and sanitation investments on diarrhoeal diseases: problems in methodology.
International J Epidemiology 12(3): 357-65.
Assessing Impact
There are two possible areas of focus
when assessing the impact of HWTS.
Measuring:
1. Direct Impact (Health)
2. Indirect Impact – Impacts which might contribute to overall
health impact.
22/01/2014
5
Part 2
The Challenge of Direct Health Impact Assessments of HWTS
What methods might be used to measure the direct health impact
of HWTS?
22/01/2014
6
How difficult it would be to collect data for these methods?
How easy is to ensure we are measuring changes in diarrhoea that are only a direct result of
HWTS and not some other factor?
e.g. another factor could be a national campaign to promote hand washing.
22/01/2014
7
Methods to Study Health Impacts (Epidemiological Studies)
• Ecological Studies
• Cross-Sectional Studies
• Longitudinal Studies
• Case-Control Studies
• Cohort Studies
• Intervention Studies.
Challenges in Assessing Direct Health
• Need to study a sample of households from several populations to ensure results are statistically significant
• Need to take into account variables which could affect results – Hygiene practices, age, vulnerability, water source,
other disease, season, etc.
• People do not always remember how much diarrhoea they have had (especially after 48 hours)
• Definition of diarrhoea varies from person to person (even when defined as 3 or more loose stools in 24 hours).
22/01/2014
8
Epidemiological Studies
Are they expensive?
Are they cost-effective?
Can they be justified?
Key Messages
• Assessing direct health impact is difficult, time consuming and costly.
• It should not be done routinely for the assessment of the impact of HWTS.
• They should ONLY be considered if
– there is a specific research question that
needs to be answered, and
– they are done by experienced
epidemiologists.
.
22/01/2014
9
Part 3
Alternatives to Measuring Direct Health Impact
Optimizing Impact of HWTS
• Achieve coverage among target populations
– Children <5 years, elderly, people living with
HIV/AIDS (Who?)
– Populations relying on poor water quality
(Where?)
• Use an HWTS option that removes
pathogens (What?)
• Ensure HWTS option is used correctly and
consistently (How?)
22/01/2014
10
Indirect Assessments
• An alternative to epidemiological studies
• Should focus on the same 3 key aspects:
1. Coverage - the extent to which HWTS is targeting vulnerable populations
2. Performance - ensuring that the HWTS option is safe and microbiologically effective
3. Adoption - correct, consistent, exclusive and sustained use of HWTS.
Indicators
• What does the term “indicator” mean?
22/01/2014
11
Indicators
• An indicator is something easy to measure
which suggests the presence of something
else more difficult to measure
Smelling Fruit
– An indicator of good water quality in our
rivers might be the number of fish it has.
– An indicator you have malaria might be
that you have a high fever.
– An indicator of whether fruit is ripe might
be its smell or feel.
Key Characteristics of Indicators
• What makes a good indicator?
22/01/2014
12
Key Characteristics of Indicators
• Good indicators are:
– Objective
– Measurable
– Practical
– Validated association with outcome of interest.
Assessing Coverage
1. What is coverage?
22/01/2014
13
Assessing Coverage
1. What is coverage?
The extent to which the intervention is targeting
vulnerable populations.
Assessing Coverage
1. What is coverage?
The extent to which the intervention is targeting
vulnerable populations.
2. What indicators might we use to measure change in HWTS coverage?
22/01/2014
14
Sample Indicators of Change in HWTS Coverage
• % of households• % of PWLHA, children <5, elderly, rural, other target population • % of population with unimproved water sources• % of villages with source water quality > xxx cfu/100 ml
that…
• …report boiling their drinking-water today or yesterday andcan show equipment/fuel and safe storage used• …report treating their water with chlorine today or yesterday and can show the chlorine product at time of visit• …report filtering their water today or yesterday and can show filter with water or wet.
PWLHA – People living with HIV/AIDS
Assessing Coverage
1. What is coverage?
The extent to which the intervention is targeting
vulnerable populations.
2. What indicators might we use to measure change in HWTS coverage?
3. What methods might we use to collect this data?
22/01/2014
15
Methods for Assessing HWTS Coverage
• Cross-sectional surveys
– Baseline/post-intervention or intervention/control
• Existing demographic data
– Children < 5 years
– People living with HIV/AIDS
• Water sampling or indicators of water quality level, etc.
Results should be separated into groups where necessary
to assess equity of coverage
– Socioeconomic groups, education level, etc.
Assessing Performance
1. What is performance?
22/01/2014
16
Assessing Performance
1. What is performance?
Ensuring that the HWTS option used is safe and
microbiologically effective.
Assessing Performance
1. What is performance?
Ensuring that the method used is safe and
microbiologically effective.
2. What indicators can we use to measure HWTS performance?
22/01/2014
17
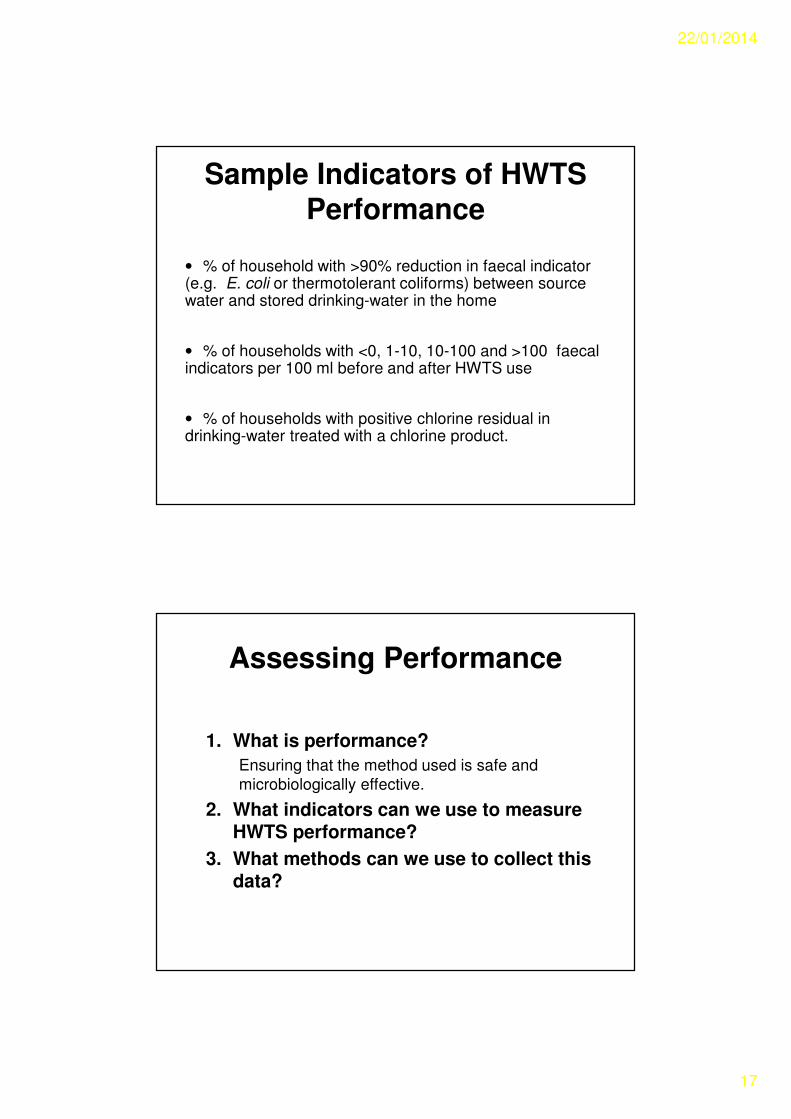
Sample Indicators of HWTS Performance
• % of household with >90% reduction in faecal indicator (e.g. E. coli or thermotolerant coliforms) between source water and stored drinking-water in the home
• % of households with <0, 1-10, 10-100 and >100 faecal indicators per 100 ml before and after HWTS use
• % of households with positive chlorine residual in drinking-water treated with a chlorine product.
Assessing Performance
1. What is performance?
Ensuring that the method used is safe and
microbiologically effective.
2. What indicators can we use to measure HWTS performance?
3. What methods can we use to collect this data?
22/01/2014
18
Methods for Assessing HWTS Performance
• Using existing lab and field study results
• Testing of HWTS in the laboratory
– This may be better than the
performance that can be achieved in
the field
• Testing of HWTS in the field:
– New interventions
– Testing existing users
• Indirect assessment based on indicators
– Turbidity, chlorine residual.
Assessing Adoption
1. What is adoption?
22/01/2014
19
Assessing Adoption
1. What is adoption?
Securing correct, consistent and sustained use.
This requires:
i.Availability of all the tools required to carry out the HWTS (This may be durables, consumables or services)
ii.Affordability, having the necessary resources to continue investing in the practice
iii.Actual correct, consistent, exclusive and sustained use.
Assessing Adoption
1. What is adoption?
Securing correct, consistent, exclusive and
sustained use.
2. What indicators can we use to measure HWTS adoption?
Focus on availability, affordability and actual use.
22/01/2014
20
Sample Indicators of HWTS Adoption
• Availability/Affordability:
– % change in the number of distribution points for
effective HWTS product
– % of households that know of one location where
they can obtain a HWTS product
– % of households that report that they have
purchased a HWTS product in the last month
– Number of products sold in the last month.
Sample Indicators of HWTS Adoption
•Correct, consistent, exclusive and sustained use
– Unreliability of self-reported use
– Impossible to observe without influencing
– Need for objective assessment• Thermolerant coliforms, E. coli• Residual chlorine, turbidity• Presence of product (e.g. chlorine solution, filter, boiling
pot) and equipment in the home, plus demonstration of correct use
• Key parameters of correct use
– Need for assessment over time
22/01/2014
21
Assessing Adoption
1. What is adoption?
Securing correct, consistent and sustained use.
2. What indicators can we use to measure HWTS adoption?
Availability, affordability and actual use.
3. What methods can we use to collect this data?
Methods for Assessing HWTS Adoption
• Cross-sectional surveys
– Household surveys (with a focus on
observation)
– Market survey
• Existing data on population characteristics
• Manufacturers records
• Water sampling or indicators of water
quality
Separate the results by important groups to assess equity of coverage
– Geographical, socioeconomic, education level, etc.
22/01/2014
22
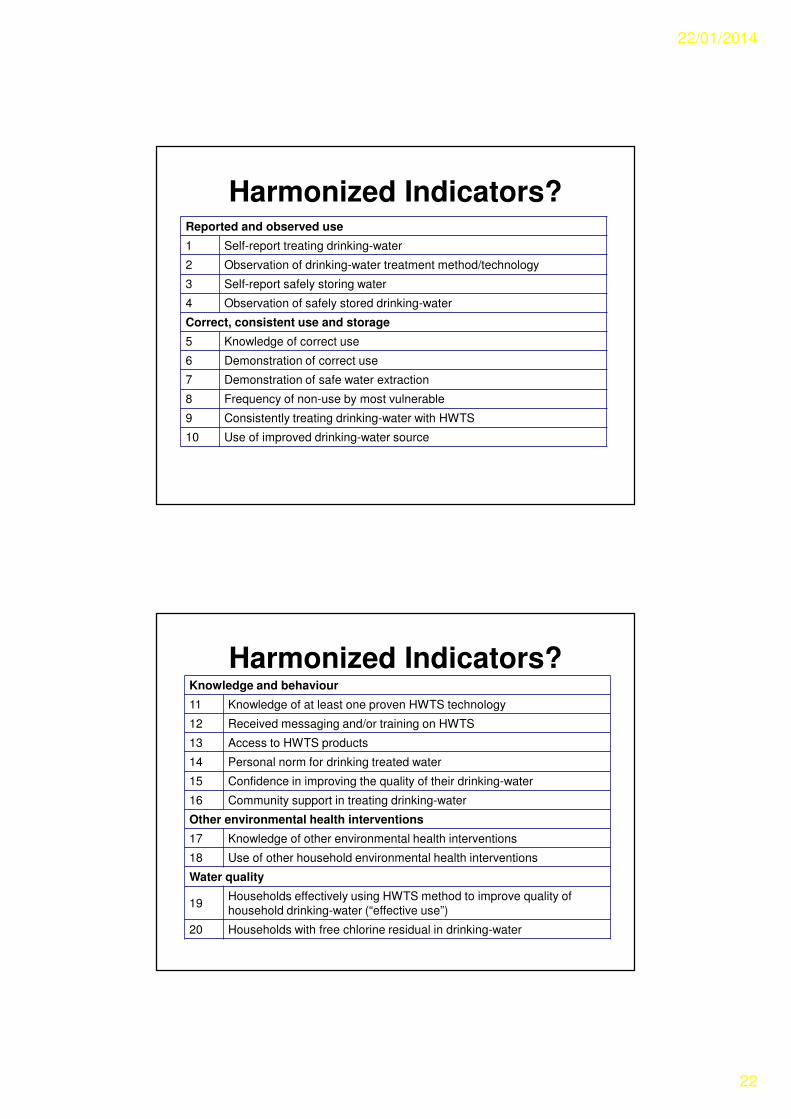
Harmonized Indicators?Reported and observed use
1 Self-report treating drinking-water
2 Observation of drinking-water treatment method/technology
3 Self-report safely storing water
4 Observation of safely stored drinking-water
Correct, consistent use and storage
5 Knowledge of correct use
6 Demonstration of correct use
7 Demonstration of safe water extraction
8 Frequency of non-use by most vulnerable
9 Consistently treating drinking-water with HWTS
10 Use of improved drinking-water source
Harmonized Indicators?Knowledge and behaviour
11 Knowledge of at least one proven HWTS technology
12 Received messaging and/or training on HWTS
13 Access to HWTS products
14 Personal norm for drinking treated water
15 Confidence in improving the quality of their drinking-water
16 Community support in treating drinking-water
Other environmental health interventions
17 Knowledge of other environmental health interventions
18 Use of other household environmental health interventions
Water quality
19Households effectively using HWTS method to improve quality of
household drinking-water (“effective use”)
20 Households with free chlorine residual in drinking-water
22/01/2014
23
Part 4
Sampling and Presenting Results
Sampling Strategy
• Why sample?
– Often the population we want to study is too large for us to cost-effectively test each individual.
– We need a smaller population that is representative of the study population.
– The information from the sampled population is similar to that of the study population.
22/01/2014
24
Sampling Strategy
• Steps to ensure sample is representative:
1. Defining the study population
2. Determining a representative sample size
3. Deciding the sampling method.
Questions
1. Did you think the methods gave a representative
sample?
2. How might you carry out this method in a project with
100 beneficiary households in one location?
3. How might you carry out this method in a district
containing several villages and over 1,000 people who
have benefitted from HWTS?
4. Are there any situations where this method would be
particularly useful?
5. What do you think the method might be called?
22/01/2014
25
Sampling Strategy
• Sample size calculations– Large enough that the researcher can say the
results have detected a statistically meaningful difference (statistical significance)
– This is a function of i. the size of the expected change and
ii. the variation of that change across the study population
– Consult with statisticians, where possible, or calculate sample size using formulae or published tables
Sampling Strategy
WHO (2006): Guidelines for Drinking Water Quality, 3rd Ed.
22/01/2014
26
Communicating Results
Stakeholder Information to be
communicated
Method of
communication
Part 5
Group Practical Activity
22/01/2014
27
Group Practical Activity
Group Practical Activity
Key Factors to
Assess
22/01/2014
28
Group Practical: Key Areas
• Indirect assessment should focus on 3 key
areas:
1. Coverage - the extent to which HWTS is targeting vulnerable populations
2. Performance - ensuring that the HWTS option is safe and microbiologically effective
3. Adoption - correct, consistent and sustained use
Group Practical Activity
Key Factors to
Assess
Measurable
Indicators
22/01/2014
29
Group Practical: Indicators
• Good indicators are:
– Objective
– Measurable
– Practical
– Validated association with outcome of interest
Group Practical
Key Factors to
assess
Measurable
Indicators
Data Collection
Methods
22/01/2014
30
Group Practical: Collection Methods
• Cross-sectional surveys
– Household
– Market
– Focus on observation of presence and correct use