26
Assessing the Impact of Interactive Sampling Using Audience Response Systems Irina Ghilic, Michelle L. Cadieux, Joseph A. Kim & David I. Shore McMaster University

Assessing the Impact of Interactive Sampling Using Audience Response Systems Irina Ghilic, Michelle L. Cadieux, Joseph A. Kim & David I. Shore McMaster University

Published by
The Higher Education Quality Council of Ontario
1 Yonge Street, Suite 2402
Toronto, ON Canada, M5E 1E5
Phone: (416) 212-3893
Fax: (416) 212-3899
Web: www.heqco.ca
E-mail: [email protected]
Cite this publication in the following format:
Ghilic, I., Cadieux, M. L., Kim, J. A., & Shore, D. I. (2014). Assessing the Impact of Interactive Sampling Using Audience Response Systems. Toronto: Higher Education Quality Council of Ontario.
The opinions expressed in this research document are those of the authors and do not necessarily represent the views or official policies of the
Higher Education Quality Council of Ontario or other agencies or organizations that may have provided support, financial or otherwise, for this project.
© Queens Printer for Ontario, 2014

Assessing the Impact of Interactive Sampling Using Audience Response Systems
Higher Education Quality Council of Ontario 1
Acknowledgements We would like to thank Dr. Sue Becker for her contribution to the design of the study, Deanna Minervini, the IntroPsych coordinator, for her help with data organization and management, and all of the IntroPsych teaching assistants for their assistance with data collection. Additionally, we would like to thank the iclicker company for supplying us with the iclicker 2 devices that were used for this project.
Assessing the Impact of Interactive Sampling Using Audience Response Systems
Higher Education Quality Council of Ontario 2
Table of Contents
Executive Summary ........................................................................................................................................... 4
Current Study ................................................................................................................................................4
Methods ........................................................................................................................................................4
Results ..........................................................................................................................................................5
Conclusions ..................................................................................................................................................5
Introduction ........................................................................................................................................................ 7
How can ARS be used more effectively? .....................................................................................................8
Using ARS rather than Pen and Paper to Collect Interactive Sampling .......................................................9
Current Study ............................................................................................................................................. 10
Technology: Iclicker Description ................................................................................................................ 10
The Purpose of Our Study ......................................................................................................................... 10
Research Questions .................................................................................................................................. 11
Methods............................................................................................................................................................. 11
Overview of General Methods ................................................................................................................... 12
Brief Explanation of Teaching Concepts.................................................................................................... 12
Concept 1: Normal Distribution .................................................................................................................. 12
Concept 2: Forming Rules ......................................................................................................................... 13
Concept 3: Availability Heuristic ................................................................................................................ 13
Participants ................................................................................................................................................ 13
Data Collection ........................................................................................................................................... 13
Results .............................................................................................................................................................. 14
Participation ............................................................................................................................................... 14
Scores ........................................................................................................................................................ 15
Survey data ................................................................................................................................................ 17
Discussion ........................................................................................................................................................ 17
Using audience response systems ............................................................................................................ 18
Integration .................................................................................................................................................. 18
Set-up Time ............................................................................................................................................... 18
Recommendation 1 .................................................................................................................................... 19
Data Collection ........................................................................................................................................... 20
Recommendation 2 .................................................................................................................................... 20
Overall Enjoyment ...................................................................................................................................... 20

Assessing the Impact of Interactive Sampling Using Audience Response Systems
Higher Education Quality Council of Ontario 3
Recommendation 3 .................................................................................................................................... 20
Conclusions ...................................................................................................................................................... 21
References ........................................................................................................................................................ 22
List of Tables Table 1: Schedule of Experimental Concepts ................................................................................................... 12
Table 2: Number of Quiz and Exam Scores used for each Experimental Concept .......................................... 14
Table 3: Review of Assessment Measures used for each Experimental Concept ........................................... 14
List of Figures
Figure 1: Example of a Serial Position Curve ......................................................................................................8
Figure 2: Concept Two for Quiz Data ............................................................................................................... 15
Figure 3: Concept Two for Exam Data .............................................................................................................. 16
Figure 4: Concept Three for Exam Data ........................................................................................................... 16
Figure 5: Questionnaire Responses ................................................................................................................. 17

Assessing the Impact of Interactive Sampling Using Audience Response Systems
Higher Education Quality Council of Ontario 4
Executive Summary Audience response systems (ARS) are electronic applications in which a receiver captures information entered by students via keypads or hand-held devices. Students’ responses can be displayed instantly, usually in the form of a histogram. Professors typically use ARS to increase student interaction and for formative assessment (to measure students’ understanding of material during a lecture; Micheletto, 2011). In some cases, audience response systems have also been used to pose real research questions and follow an interactive sampling approach (not to be confused with experiment data collection). For example, imagine that a research study concluded that females respond more quickly to red stimuli than do males. An interactive sampling session in the classroom would present students with coloured stimuli, and the instructor would ask students to respond, as quickly as possible and using the ARS, when they see the red stimuli. The instructor would then display the students’ responses and compare the students’ data to results from the published research study. Barnett & Kriesel (2003) propose three criteria that classroom interactive sampling should meet if it is to stimulate discussion among students:
1. Interactive sampling should be conducted to demonstrate class concepts. 2. Students should be providing responses in a controlled setting. 3. Students’ responses should be compared to behavioural hypotheses derived from theory.
The practice of conducting interactive sampling during class creates opportunities for hands-on learning, which could increase student engagement and exposure to research methods. By using ARS, interactive sampling can remain anonymous, and the process becomes less time-consuming than the alternative “pen and paper” or “show of hands” methods.
Current Study The goal of our study was to test the effectiveness of ARS for interactive sampling in the classroom and to bring the “real-data feeling” to the largest undergraduate course at McMaster University, Introductory Psychology 1X03, in the Fall 2012 semester. The course has an enrolment of approximately 3,000 students and employs a blend of online web modules and weekly face-to-face tutorials led by undergraduate teaching assistants (TAs). Tutorial groups consist of approximately 25 students each. In order to turn these tutorials into a “hands-on” learning environment, we used iclickers to facilitate in-class interactive sampling.
Methods Consenting participants were all enrolled in the Introductory Psychology course. Only students who were present on the day in which the “experimental” concepts were taught had their data included in the study. The experiment focused on teaching three different “experimental” concepts (normal distribution, categorization, availability heuristic) throughout the term by employing three different teaching methods:
1. Traditional lecture: Students were presented with information drawn from textbooks or journal articles, following a passive learning approach.
2. Pen and paper lecture: Interactive sampling was conducted during tutorial by having students write
responses on paper and hand them in to the TA. The TA later analyzed the data and posted the results the day before the weekly quiz. This method followed an active learning approach, with delayed feedback. Active learning refers to experiences in which students are actively thinking about the subject matter as they interact with the instructor or their peers (McCarthy & Anderson, 2000).

Assessing the Impact of Interactive Sampling Using Audience Response Systems
Higher Education Quality Council of Ontario 5
3. Iclicker lecture: Interactive sampling was conducted during the tutorial by having students answer the demo question with the iclickers. The TA immediately provided students with the interactive sampling results (a tutorial-specific, personalized teaching example). This method followed an active learning approach, with instant feedback.
Each tutorial section was exposed to all three teaching conditions by the end of the term. To assess students’ learning, we included one experimental concept question in the weekly quizzes and a different question on the final exam. At the end of the term, students also completed a brief questionnaire about their experience with the hands-on teaching methods. We were interested to determine if the hands-on use of audience response systems would lead to better learning, as determined by student’s quiz and final exam scores, and if concepts would be better understood when taught with ARS demos than with “pen and paper” demos or traditional lecturing.
Results Data from students who did not attend class or who did not write the quiz/exam were excluded from the analysis. Due to some TAs not handing in their attendance forms, we lost approximately 1,000 quiz scores for each concept. Data were analyzed using a one-way ANOVA with the factor of learning condition (traditional, pen and paper, iclickers). No data from concept 1 was used due to errors in the presentation of course material, technological issues and lack of participation in the quiz. For concept 2, 1,575 scores were analyzed from the quiz and 1,612 scores from the final exam. We found no difference between any of the lecture conditions for both the quiz data (F(2, 74) = 0.20, p = 0.82) and exam data (F(2, 74) = 1.75, p = 0.18). The style of lecture did not influence students’ understanding of those concepts as reflected in their quiz and exam grades. For concept 3, we were unable to use the quiz data due to the low number of students who selected the correct answer. However, 1,558 scores were analyzed from the final exam. There was still no significant difference in learning condition for the exam data (F(2, 75) = 0.31, p = 0.73). As with concept 2, the method used to teach the concept did not affect performance on the final exam. The responses to the survey asking students about their experience with pen and paper and iclicker conditions showed that, on average, the pen and paper condition (mean = 3.1) was judged to be more helpful than the iclickers (mean = 2.9, t (451) = 3.02, p = 0.003).
Conclusions Within the framework of this study, the learning method had no effect on quiz/exam performance, and students did not appear to enjoy the iclicker lectures. Reflecting on our study’s shortcomings, we recommend the following:
1. Iclickers should be used either regularly or not at all. The set-up required to use iclickers on a single occasion is more of a distraction to both the students and instructor than a benefit.
2. Set-up time is increased when audience response systems are employed by novice users and
when there are technical problems. Teaching with ARS should require prior planning and time commitment from instructors.

Assessing the Impact of Interactive Sampling Using Audience Response Systems
Higher Education Quality Council of Ontario 6
3. Teaching a variety of topics for each learning method would increase the number of data points and allow for iclicker use to be evaluated more fully and on a variety of topics.

Assessing the Impact of Interactive Sampling Using Audience Response Systems
Higher Education Quality Council of Ontario 7
Introduction The rapid adoption of learning technologies in higher education gives instructors access to a wide array of tools for teaching complex information more efficiently. One such learning tool allows students to respond to and interact with instructor prompts via hand-held devices. Similar to the “Ask the Audience” lifeline from the television game show “Who Wants to be a Millionaire?”, audience response systems (ARS) allow instructors to collect student responses to a posted question instantaneously (Caldwell, 2007). In higher education, ARS can also be referred to as clickers or electronic voting systems, student response systems (SRS), personal response systems, classroom communication systems or audience voting systems (Premkumar & Coupal, 2008). All of these designations describe an electronic application where a receiver captures information entered by students via keypads or hand-held devices (Caldwell, 2007). After students select their responses using the ARS devices, the results are instantly collected, summarized, and can be presented to the entire class as a histogram (Kay & LeSage, 2009). Some university lecture halls come equipped with the technology, and the instructor only needs to connect the ARS interface to their computer using a USB cord. If the instructor has the ARS software installed on their computer, they can use it to collect and save student responses. Otherwise, the lecture hall computer comes with the software already available. If the lecture hall does not come equipped with an ARS, the university’s audio-visual department could provide the portable version of the system, which often involves a small receiver (which plugs into any computer with a USB port), a USB key containing the software and an instructor’s ARS remote. Audience response systems are malleable. Instructors have reported using ARS in classes ranging from 15 to more than 200 students (Caldwell, 2007). ARS such as clickers have been incorporated in nursing, engineering, computer science, mathematics, chemistry, philosophy, biology, communications, physics, premedical education, medicine, business, economics and psychology courses (Caldwell, 2007). ARS can be used in many ways. In a higher education setting, these might include (Caldwell, 2007):
1) To increase or manage student interaction 2) To assess student lecture preparation 3) To find out more about the students 4) For formative assessment (students’ understanding of material in lecture) 5) For quizzes or tests 6) To complete practice problems 7) To guide thinking or review, or to teach 8) To conduct experiments or illustrate human responses 9) To implement periodic breaks in the lecture 10) To make lectures fun
The most common use of ARS is to obtain formative feedback from students (McGowan & Vaughan, 2011). For example, the instructor might ask a multiple-choice question on the material that they have just covered. The performance of the class on the question can provide the instructor with feedback on whether the students understand the concepts (Premkumar & Coupal, 2008). Based on this feedback, the instructor can decide whether to spend more time of the concept or to move on. The system can also provide students with the correct answer to questions that it asks, allowing the instructor to explain why this answer is correct. This allows students to verify their knowledge of lecture content. Some positive effects that arise from this interaction between the students and course material include (Premkumar & Coupal, 2008):
1) Increased active participation of students during lecture 2) Removal of the “house of cards effect” (students understand new material poorly because it builds on
previous content that was also poorly understood) 3) Instructor receives feedback on their students’ understanding on the lecture, which helps guide
further instruction
Assessing the Impact of Interactive Sampling Using Audience Response Systems
Higher Education Quality Council of Ontario 8
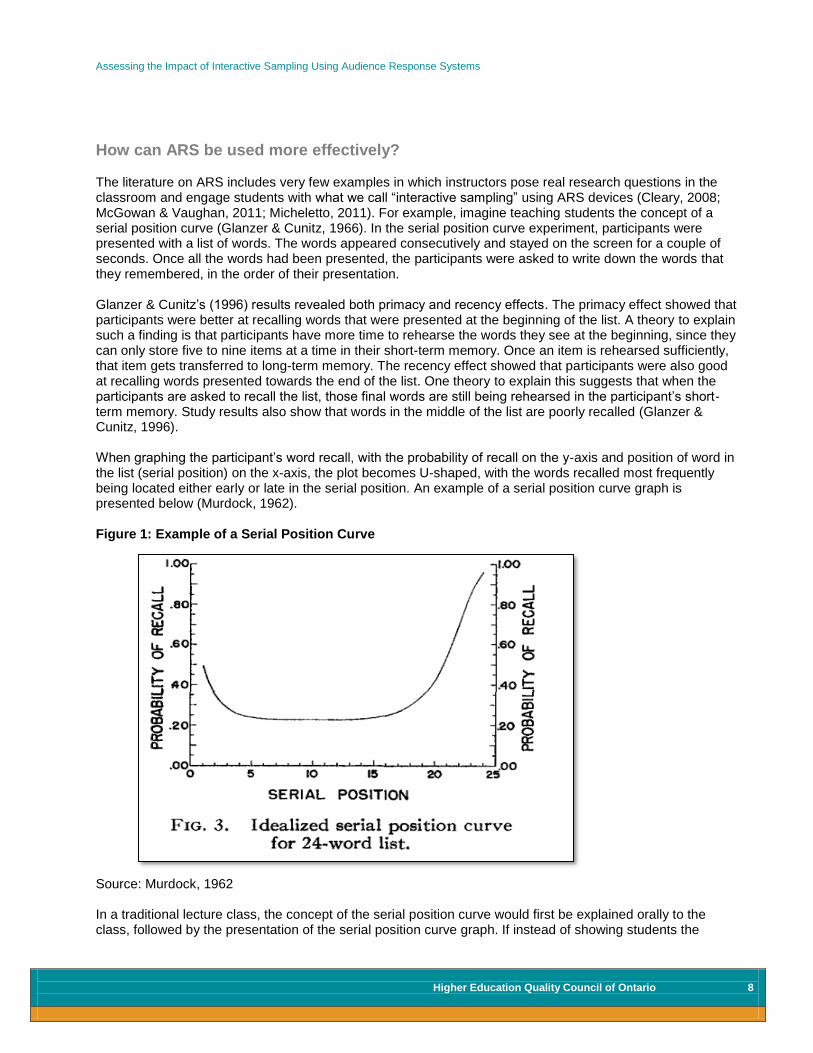
How can ARS be used more effectively? The literature on ARS includes very few examples in which instructors pose real research questions in the classroom and engage students with what we call “interactive sampling” using ARS devices (Cleary, 2008; McGowan & Vaughan, 2011; Micheletto, 2011). For example, imagine teaching students the concept of a serial position curve (Glanzer & Cunitz, 1966). In the serial position curve experiment, participants were presented with a list of words. The words appeared consecutively and stayed on the screen for a couple of seconds. Once all the words had been presented, the participants were asked to write down the words that they remembered, in the order of their presentation. Glanzer & Cunitz’s (1996) results revealed both primacy and recency effects. The primacy effect showed that participants were better at recalling words that were presented at the beginning of the list. A theory to explain such a finding is that participants have more time to rehearse the words they see at the beginning, since they can only store five to nine items at a time in their short-term memory. Once an item is rehearsed sufficiently, that item gets transferred to long-term memory. The recency effect showed that participants were also good at recalling words presented towards the end of the list. One theory to explain this suggests that when the participants are asked to recall the list, those final words are still being rehearsed in the participant’s short-term memory. Study results also show that words in the middle of the list are poorly recalled (Glanzer & Cunitz, 1996). When graphing the participant’s word recall, with the probability of recall on the y-axis and position of word in the list (serial position) on the x-axis, the plot becomes U-shaped, with the words recalled most frequently being located either early or late in the serial position. An example of a serial position curve graph is presented below (Murdock, 1962). Figure 1: Example of a Serial Position Curve
Source: Murdock, 1962 In a traditional lecture class, the concept of the serial position curve would first be explained orally to the class, followed by the presentation of the serial position curve graph. If instead of showing students the
Assessing the Impact of Interactive Sampling Using Audience Response Systems
Higher Education Quality Council of Ontario 9
textbook or literature data and graphs, the students were presented with the words themselves, asked to enter those they recalled using an audience response system device and had their actual data presented to them, the students might feel more involved with the research, interpreting data and the concept being taught. When students get involved with their own learning, they go from being passive receivers of information to active participants in the learning process. Active learning refers to experiences in which students are actively thinking about the subject matter as they interact with the instructor, their peers and the course material (McCarthy & Anderson, 2000). Active learning encourages students to connect and summarize concepts, engage in discussions and challenge the theories discussed in lecture (Yoder & Hochevar, 2005). University courses in certain disciplines often present students with research studies as means of teaching a concept. However, merely presenting the data from a research study does not actively engage students and facilitate learning (Cleary, 2008). Psychology students, for example, demonstrate increased understanding of experimental studies after research participation (Rosell, Beck, Luther, Goedert, Shore & Anderson, 2005). This participation can come in the form of attending research colloquia and participating in experiments. Students show increased awareness of current psychological research procedures if they are actively involved in the research (Rosell et al., 2005). By turning the classroom into an experiential learning environment, one might expect students to be better equipped to understand the concepts being taught (Micheletto, 2011). Although there is no definition for a “successful” classroom experiment, Barnett & Kriesel (2003) propose that classroom data collection should meet the following conditions:
1. Interactive sampling should be conducted to demonstrate class concepts 2. Students should be providing responses in a controlled setting (i.e., with the instructor guiding the
students through the lesson) 3. Student responses should be compared to behavioural hypotheses derived from theory (i.e., to data
from the literature) Slamecka & Graf (1978) also write about the importance of information generation. In their study, five experiments compared subjects’ ability to remember words that they themselves had generated to their ability to remember these same words when they were presented on a screen. In all experiments, recall in the “generate” condition was higher to that in the “read” condition. A possible explanation for this result is that generation requires more cognitive effort than reading information, and the effort increases the memorability of the generated information. The practice of providing one’s own data could make the information more memorable than simply reading the data from an article.
Using ARS rather than Pen and Paper to Collect Interactive Sampling Audience response systems can be used to facilitate active learning in the classroom. Instructors can use ARS to replicate known findings from the literature, even in large classrooms (Cleary, 2008), without the hassle of having students write down their answers and collecting the papers or of participating in a “show of hands” discussion. Bringing real data to the classroom provides students with much-needed hands-on learning, especially since large classes do not always have the benefit of conducting research or participating in lab work. Qualitative reports indicate that students find the collection and presentation of data on a screen more compelling than a show of hands or textbook graphs and tables (Cleary, 2008; Micheletto, 2011). Data collected in class using ARS can also be saved and used again for class assignments. Moreover, student responses can remain anonymous, and the data collection process takes less time than the alternative “pen and paper” or “show of hands” methods.
Assessing the Impact of Interactive Sampling Using Audience Response Systems
Higher Education Quality Council of Ontario 10
Current Study Our goal was to promote an active learning approach in the largest undergraduate course at McMaster University, Introductory Psychology 1X03 (IntroPsych). This course uses a blended learning environment that combines learning technology with traditional face-to-face instruction. The primary course material for IntroPsych is delivered via online web modules. Students can access these online lectures anytime and anywhere they have internet access. Students are expected to attend weekly tutorials that are led by an undergraduate teaching assistant (TA), who is enrolled in Applied Educational Psychology 3TT3. The 3TT3 class is offered to the IntroPsych teaching assistants and although it is not a mandatory course, 95% of TAs complete 3TT3. This course explores the meaning of being a good educator, how pedagogy research informs education practice, and how cognitive models help instructors understand how students learn complex information effectively. The overall goal of the course is to bridge the two aspects of educational psychology – theory and practice – through discussions on how to assess and implement theory in the classroom (Kim, 2012). The TA component provides these students with an additional opportunity to put theory into practice. In the small-group (25 student) IntroPsych tutorials, newly hired TAs review challenging material, guide discussion, lead activities and answer questions. Introductory Psychology 1X03 introduces students to the scientific investigation of problems in psychology, neuroscience and behaviour. This course uses a framework grounded in psychological research methods to help students understand higher-level processes such as learning, cognition, social psychology, personality and psychopathology. Students focus on developing skills such as:
1) Applying terms used in psychology and evaluating research methods 2) Integrating knowledge from several key areas in psychology 3) Researching and critically evaluating scientific information
In order to turn the classroom into an active learning environment, we used iclickers as our audience response system to facilitate interactive sampling. Since the practice of interactive sampling promotes experiences in which students are thinking about the lecture material while interacting with the instructor, peers or the concepts being taught (McCarthy & Anderson, 2000), the iclickers were used to promote an active learning environment.
Technology: Iclicker Description Students used iclicker 2 as their ARS. The iclicker 2 expands on the simple design of the iclicker+ remote by adding LCD capabilities and “cross” navigation. The features of iclicker 2 provide more extensive options and greater flexibility for engaging participants in a group setting. The clickers have a simple five-button A-E entry, which makes it easy for participants to answer multiple-choice questions. Iclicker 2 participants can also answer both numeric and alphanumeric questions, including fill in the blank, yes/no, true/false, ranking, short answer of up to 16 characters, and multiple correct responses. The LCD display allows participants to visualize their response with confirmation that the response was received.
The Purpose of Our Study The goal of this study was to test the effectiveness of ARS (by looking at quiz and final exam scores) not only for formative assessment, the purpose for which ARS is most often used, but to pose real research questions and collect interactive sampling in class. Our hope was that this approach would make first-year students feel more involved with the course material by bringing real data to the classroom. We wanted to compare the effectiveness of ARS used for interactive sampling with other teaching methods. We used a total of three teaching methods and three experimental concepts throughout the 12 weeks of IntroPsych. Each concept was taught using each of the three teaching conditions. The tutorials, however, did
Assessing the Impact of Interactive Sampling Using Audience Response Systems
Higher Education Quality Council of Ontario 11
not experience all three teaching conditions for every concept. Each tutorial, however, did experience all three teaching methods, with three different concepts, throughout the term. Due to the size of the class, coordinating and counter balancing more than three concepts per term would have been very difficult to organize. Moreover, the concepts were chosen based on their adaptability to the different teaching methods. The teaching conditions were:
1) Traditional lecture: Example drawn from textbook or literature 2) Pen and paper: Collect data in class, show textbook example, present “personal” data before the
Friday quiz 3) Iclicker: Collect data using iclickers and provide instant feedback by showing students their data in
the same class and by linking the class data to the literature and concept being taught To assess the impact of ARS on student learning, we included an experimental concept question in the weekly quiz, as well as on the final exam. Students also completed a brief questionnaire about their experience with each of the three teaching methods. We wanted to see whether the use of iclickers would lead to better learning, and if teaching in a traditional lecture style or pen and paper method would lead to poorer understanding of the lecture material than when using the ARS.
Research Questions Our research questions included:
1) Does the use of audience response systems to collect and present classroom demonstration data lead to better learning?
2) Do students understand concepts better when they are taught with ARS demonstration data than with pen and paper data or traditional lecturing?
We were unable to use the data from the first concept of the term because there were serious technical difficulties with the ARS and poor participation in the weekly quiz. We assume that the poor participation in the first quiz stemmed from it being administered after only two weeks of class, when students were still unfamiliar with the online quiz system or had not yet completed the necessary work to access their first quiz. As such, we treated this experience as a rehearsal for the TAs, but did not present the data. We employed the following methods to answer our research questions.
Methods The experiment focused on teaching three different "experimental" concepts throughout the term by using three teaching methods:
1) Traditional lecture: Students were presented with information drawn from textbooks or journal articles, thus following a passive learning approach in which students were not actively engaged with the concepts being taught. Within the context of a lecture, passive learning constitutes a practice in which students are not actively thinking about the subject matter, and they do not interact with the instructor or their peers (McCarthy & Anderson, 2000).
2) Pen and paper demonstration: Interactive sampling data were collected during the tutorial by having
students write their responses on paper and hand them in to the teaching assistant. The TA analyzed the data after class and provided a tutorial-specific, personalized teaching example on the tutorial's private, online course management system (called AVENUE to Learn) discussion board. This method

Assessing the Impact of Interactive Sampling Using Audience Response Systems
Higher Education Quality Council of Ontario 12
followed an active learning approach since it encouraged students to engage with the concept being explained by providing their own data and replicating a study’s results. This method provided delayed feedback since the tutorial’s data results were not presented immediately.
3) Iclicker demonstration: Interactive sampling data were collected during the tutorial by having students answer the experimental concept questions with their iclickers. The TAs immediately analyzed the data and provided a tutorial-specific, personalized teaching example during the tutorial. This method followed an active learning approach and provided instant feedback.
Each IntroPsych tutorial was exposed to all three teaching conditions by the end of the term. Table 1 presents a schedule of the experimental concepts and their respective tutorial and teaching method. Table 1: Schedule of Experimental Concepts
Concept 1 Concept 2 Concept 3
Traditional Lecture Tutorial sections 1 - 38 Tutorial sections 77 - 116 Tutorial sections 39 - 76
Pen and Paper Tutorial sections 39 - 76 Tutorial sections 1 - 38 Tutorial sections 77 - 116
iClicker Tutorial sections 77 - 116 Tutorial sections 39 - 76 Tutorial sections 1 - 38
Overview of General Methods TAs were instructed to take attendance before the beginning of each tutorial and to hand in the attendance sheet to the experimenter by the end of the week. If they were teaching the iclicker condition, TAs handed out iclickers at the beginning of the tutorial and collected them at the end. TAs were instructed to arrive ten minutes prior to the beginning of the tutorial to help them stay on schedule with their lesson plan. All TAs were provided with an "ARS Research Project" experiment booklet (see Appendix 1), which included standardized information and instructions for the experiment. The booklet thus created uniform conditions between experimental sessions, since it provided all TAs with identical instructions for each experimental tutorial and condition. The booklet also provided TAs with background information about the study, a schedule of concepts and teaching methods, and emergency contacts in case of questions or concerns about the study. Briefnotes and PowerPoint slides for each of the experimental concept tutorials were also included in the booklet. The TAs were instructed to prepare for their teaching condition ahead of time to avoid last-minute issues with the lesson plan.
Brief Explanation of Teaching Concepts The experimental concepts were standard concepts that had been taught every year as part of IntroPsych. The only difference in this iteration of the course consisted in teaching those concepts in three different ways across tutorial groups. TAs were instructed to spend an average of 5 to 10 minutes on these concepts, which is the typical time spent on a concept in IntroPsych, and not to exaggerate their importance. Students were aware that some concepts were experimental concepts but were not explicitly told which concepts were being used for the purpose of the experiment, since we wanted students to experience a smooth and normal transition between reviewed concepts. Teaching materials for each concept can be found in Appendix 1.
Concept 1: Normal Distribution This concept was taught during the second week of IntroPsych. As discussed above, there were technical difficulties which prevented us from using these data in our analysis. The technology did not work properly for some tutorials, since the tutorial room computers were old and prone to malfunction when they interacted with new technology. Whereas loading the receiver and the software would have taken only seconds with an

Assessing the Impact of Interactive Sampling Using Audience Response Systems
Higher Education Quality Council of Ontario 13
updated computer, it took approximately 3 to 5 minutes with our tutorial computers. This is very valuable time, given that tutorial sessions are only 50 minutes long. We rectified this issue for concepts two and three by purchasing new computers. The concept of a normal distribution can be explained by showing students a data set that represents the heights of several individuals. When the data are plotted, they can form a bimodal distribution, which tells students that the data are centered around two values instead of one, possibly differentiating between the heights of females versus males, in a given group. Each teaching condition presented this concept using the three different teaching methods, due to its adaptability to different teaching styles.
Concept 2: Forming Rules This concept was taught during the sixth week of IntroPsych. The concept of forming rules can be taught by recalling an experiment in which participants were asked to form rules for several categories. For example, participants came up with a rule for categorizing “fruit”. The participants were then asked if the rule included items such as melons, coconuts and grapes but excluded items such as squash and almonds. When looking at the results, the more ambiguous the category, the lower the percentage of “yes” responses and the more complicated the rules. This would show students that rules cannot account for all variation within a category and that categorizing based on rules is illogical. Categories are far too complex and have too much overlap to be exclusive. Each lecture style followed the same format as concept 1.
Concept 3: Availability Heuristic This concept was taught during the tenth week of IntroPsych. The concept of availability heuristic can be taught by looking at examples of how availability heuristics change our perceptions of medical diagnoses. A study (Young, Norman & Humphreys, 2008) showed that the use of medical language in the communication of diagnoses can induce bias in the perception of the diagnosis. A simple switch in terminology can result in diseases being perceived as more serious, more likely to be a disease and more likely to be a rare condition. For example, if we hear “seborrheic dermatitis” for the first time, we may perceive this diagnosis as something serious simply because we are unfamiliarly with the name. This term simply refers to dandruff. Each lecture style followed the same format as concepts 1 and 2.
Participants Participants were all students enrolled in Psychology 1X03. All participants were informed about the experiment prior to their first tutorial. A description of the experiment and consent forms were provided during the students' first mandatory IntroPsych quiz, which is administered every year. The quiz was for training purposes only and students did not receive any marks for it. Moreover, students had the option to decline their participation in the study without any penalty. The class demonstrations were a part of the course curriculum. All students were provided with the option to participate, as any instructor provides students with the opportunity to engage in class activities. If the students did not wish to engage in the class demonstrations, it reflected solely on their class participation and not their experiment participation. The experiment part came into play when the experimenter connected their participation in the class demo to their test scores. Aside from that, all class demonstrations were part of the regular IntroPsych curriculum and students were made aware of that in the first mandatory quiz.
Data Collection Quantitative data. The IntroPsych course administered 12 weekly quizzes. Only the results from questions related to the three main experimental concepts were matched to the participants' scores. For example, since concept 2 was taught using all three teaching methods, we looked at the question responses for concept 2 and analyzed which teaching method (if any) was more conducive to learning by comparing average quiz
Assessing the Impact of Interactive Sampling Using Audience Response Systems
Higher Education Quality Council of Ontario 14
scores. The same score matching process was performed with the final exam scores. We ran a mixed measures analysis of variance (ANOVA) and we looked at quiz scores between groups in relation to the teaching method applied in their class. These concepts were chosen based on their malleability to be taught using all three teaching concepts and were already a part of the tutorial curriculum. We cannot attest whether a concept was more difficult to learn than the other, but we tried to find concepts that we felt were similar in terms of difficulty. Due to the size of the class, coordinating and counter balancing more than three concepts per term would have been very difficult to organize.
1) Concept 1: Due to technical difficulties, no data were analyzed. This was treated as a pilot study. 2) Concept 2: Both quiz data and final exam data were analyzed (two questions in total for concept 2). 3) Concept 3: Due to discrepancies between lecture content and the quiz question, we disregarded the
data for the quiz question. The final exam data were analyzed (one question in total for concept 3). Qualitative data. At the end of the term, students were provided with a questionnaire asking them about their learning experience with each teaching method. Please see Appendix 4 for the questionnaire.
Results
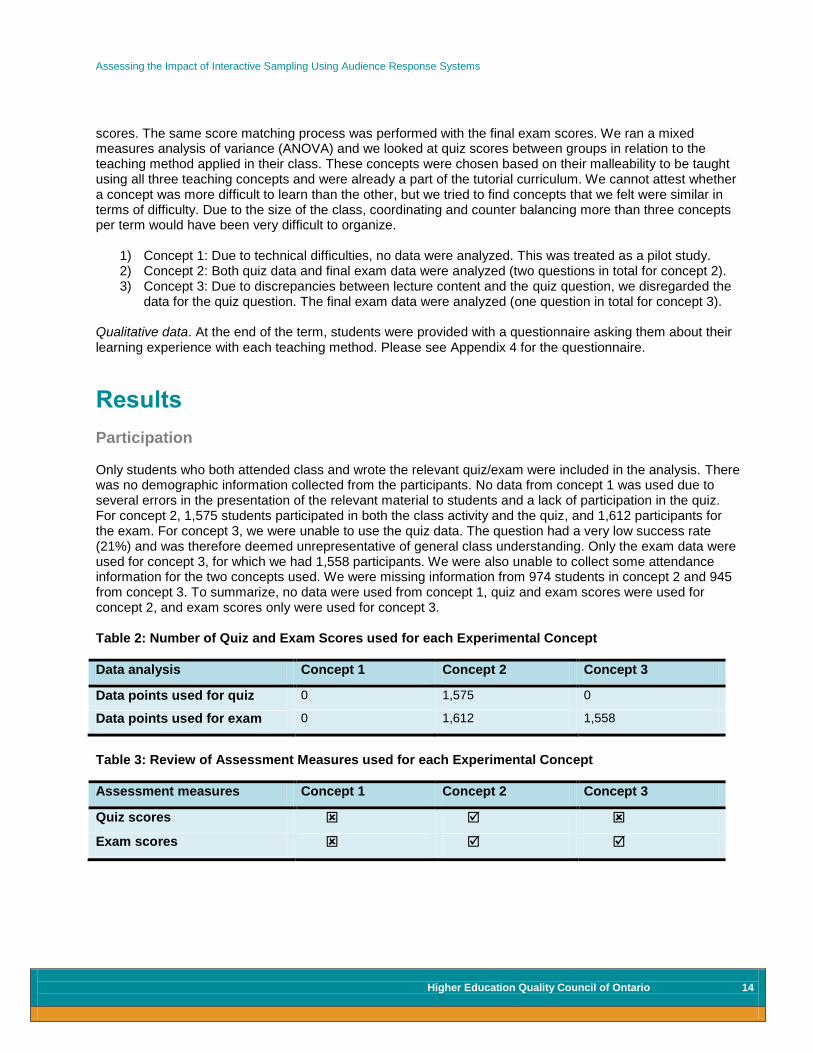
Participation Only students who both attended class and wrote the relevant quiz/exam were included in the analysis. There was no demographic information collected from the participants. No data from concept 1 was used due to several errors in the presentation of the relevant material to students and a lack of participation in the quiz. For concept 2, 1,575 students participated in both the class activity and the quiz, and 1,612 participants for the exam. For concept 3, we were unable to use the quiz data. The question had a very low success rate (21%) and was therefore deemed unrepresentative of general class understanding. Only the exam data were used for concept 3, for which we had 1,558 participants. We were also unable to collect some attendance information for the two concepts used. We were missing information from 974 students in concept 2 and 945 from concept 3. To summarize, no data were used from concept 1, quiz and exam scores were used for concept 2, and exam scores only were used for concept 3. Table 2: Number of Quiz and Exam Scores used for each Experimental Concept
Data analysis Concept 1 Concept 2 Concept 3
Data points used for quiz 0 1,575 0
Data points used for exam 0 1,612 1,558
Table 3: Review of Assessment Measures used for each Experimental Concept
Assessment measures Concept 1 Concept 2 Concept 3
Quiz scores
Exam scores

Assessing the Impact of Interactive Sampling Using Audience Response Systems
Higher Education Quality Council of Ontario 15
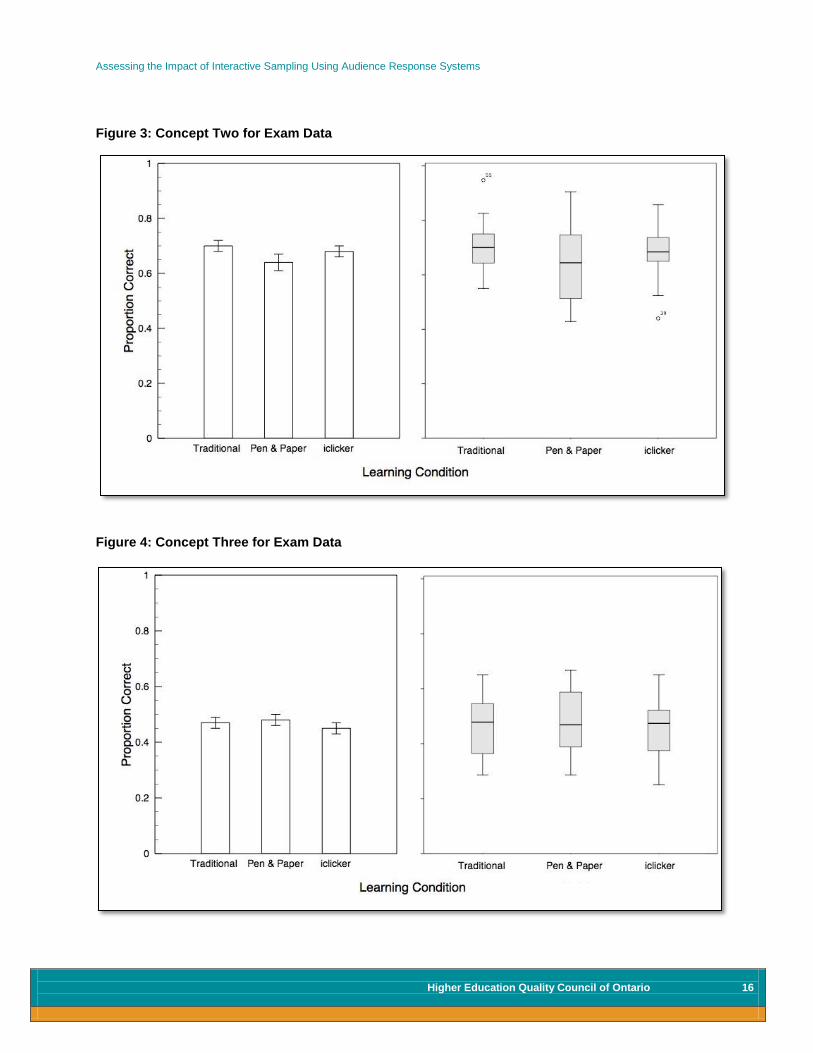
Scores Average accuracy scores were calculated for each tutorial session for both quiz and exam data in both concepts. Data were analyzed using a one-way ANOVA with the factor of learning condition (traditional, pen and paper, and iclickers). Graphs depict performance, represented by proportion correct, across the three learning conditions. The left panel of each graph shows the average performance in each condition. The right panel contains boxplots illustrating the median, along with the upper and lower quartiles. In concept 2 there was no difference between any of the conditions for both the quiz data (F(2, 74) = 0.20, p = 0.82; Figure 2) or the exam data (F(2, 74) = 1.75, p = 0.18; Figure 3). For session 3 there was also no significant difference in learning type for the exam data (F(2, 75) = 0.31, p = 0.73; Figure 4). In all cases, student accuracy on the relevant test questions was not influenced by the presentation method. Figure 2: Concept Two for Quiz Data
Assessing the Impact of Interactive Sampling Using Audience Response Systems
Higher Education Quality Council of Ontario 16
Figure 3: Concept Two for Exam Data
Figure 4: Concept Three for Exam Data

Assessing the Impact of Interactive Sampling Using Audience Response Systems
Higher Education Quality Council of Ontario 17
Survey data Three questions on the qualitative survey were used to rate student reactions to both the pen and paper and iclicker learning methods:
1) Please rate the helpfulness of pen and paper in comprehension of 1X03 course concepts. 2) Please rate the helpfulness of iclickers in comprehension of 1X03 course concepts. 3) Based on your 1X03 experience, would you advocate the use of iclickers in demonstrating course
concepts?
Questions were rated on a scale of 1 to 5 (1=not very helpful and 5=very helpful).
787 surveys were completed. Data from students who did not remember experiencing both the pen and paper and iclicker learning methods were excluded from the analysis. 452 surveys were included in the data analysis. An overall distribution of the results can be seen in Figure 5. On average, the pen and paper method (mean = 3.1) was judged to be more helpful than the iclickers (mean = 2.9, t (451) = 3.02, p = 0.003). The students did not recommend the iclickers overall. 67.7% of student rated the iclicker as neutral or below, with only 8.2% strongly recommending the use of iclickers as they were used in IntroPsych. Figure 5: Questionnaire Responses
Discussion Our primary goal was to assess the benefits of student poling technology, specifically ARS. We compared students’ test scores across three learning conditions: (1) traditional lectures; (2) pen and paper; and (3) iclickers. The learning method had no effect on quiz/exam performance. In addition, students did not appear
Assessing the Impact of Interactive Sampling Using Audience Response Systems
Higher Education Quality Council of Ontario 18
to enjoy the iclicker lessons, which is reflected in their poor rating and recommendation of the technology. We review below some of the shortcomings of our methods, as well as of the technology itself. We also provide recommendations for both future studies involving the iclickers and their general use as a learning aid.
Using audience response systems
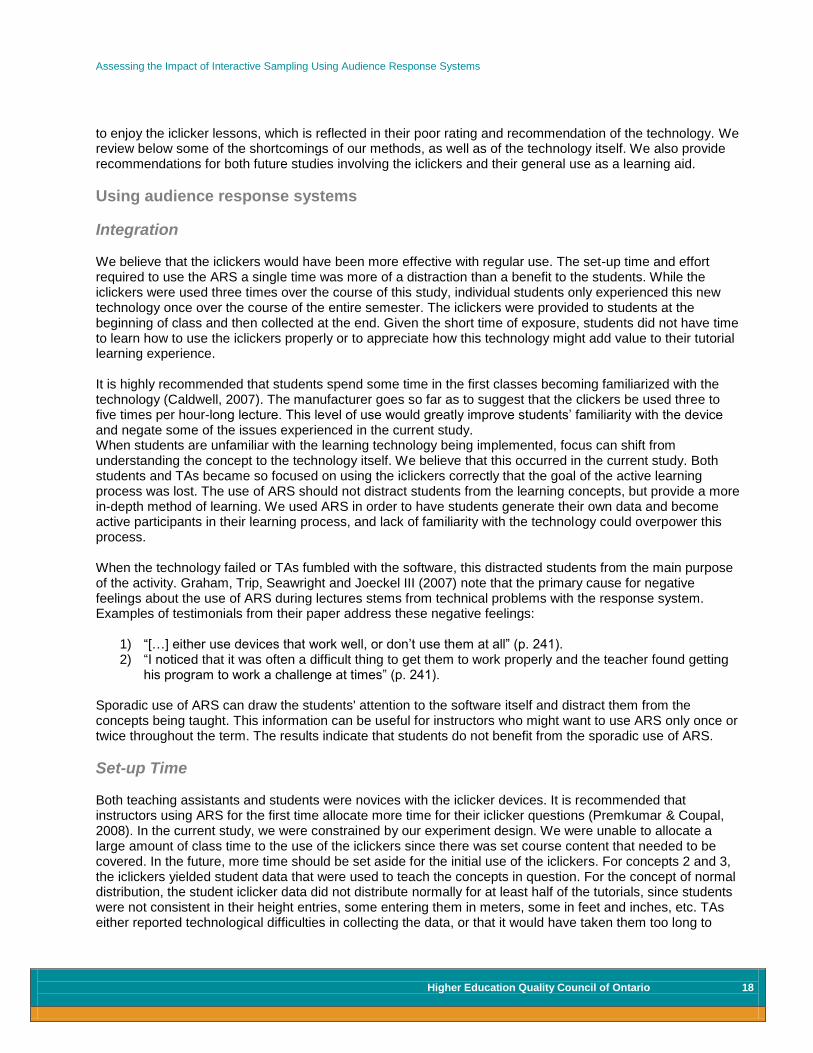
Integration We believe that the iclickers would have been more effective with regular use. The set-up time and effort required to use the ARS a single time was more of a distraction than a benefit to the students. While the iclickers were used three times over the course of this study, individual students only experienced this new technology once over the course of the entire semester. The iclickers were provided to students at the beginning of class and then collected at the end. Given the short time of exposure, students did not have time to learn how to use the iclickers properly or to appreciate how this technology might add value to their tutorial learning experience. It is highly recommended that students spend some time in the first classes becoming familiarized with the technology (Caldwell, 2007). The manufacturer goes so far as to suggest that the clickers be used three to five times per hour-long lecture. This level of use would greatly improve students’ familiarity with the device and negate some of the issues experienced in the current study. When students are unfamiliar with the learning technology being implemented, focus can shift from understanding the concept to the technology itself. We believe that this occurred in the current study. Both students and TAs became so focused on using the iclickers correctly that the goal of the active learning process was lost. The use of ARS should not distract students from the learning concepts, but provide a more in-depth method of learning. We used ARS in order to have students generate their own data and become active participants in their learning process, and lack of familiarity with the technology could overpower this process. When the technology failed or TAs fumbled with the software, this distracted students from the main purpose of the activity. Graham, Trip, Seawright and Joeckel III (2007) note that the primary cause for negative feelings about the use of ARS during lectures stems from technical problems with the response system. Examples of testimonials from their paper address these negative feelings:
1) “[…] either use devices that work well, or don’t use them at all” (p. 241). 2) “I noticed that it was often a difficult thing to get them to work properly and the teacher found getting
his program to work a challenge at times” (p. 241). Sporadic use of ARS can draw the students' attention to the software itself and distract them from the concepts being taught. This information can be useful for instructors who might want to use ARS only once or twice throughout the term. The results indicate that students do not benefit from the sporadic use of ARS.
Set-up Time Both teaching assistants and students were novices with the iclicker devices. It is recommended that instructors using ARS for the first time allocate more time for their iclicker questions (Premkumar & Coupal, 2008). In the current study, we were constrained by our experiment design. We were unable to allocate a large amount of class time to the use of the iclickers since there was set course content that needed to be covered. In the future, more time should be set aside for the initial use of the iclickers. For concepts 2 and 3, the iclickers yielded student data that were used to teach the concepts in question. For the concept of normal distribution, the student iclicker data did not distribute normally for at least half of the tutorials, since students were not consistent in their height entries, some entering them in meters, some in feet and inches, etc. TAs either reported technological difficulties in collecting the data, or that it would have taken them too long to

Assessing the Impact of Interactive Sampling Using Audience Response Systems
Higher Education Quality Council of Ontario 19
figure out how to show students their distributions (especially if they did not prepare and read their instructions before class). We intended to have the three learning methods taught under the same time constraints. This was done to ensure that any results we found could be explained based on the learning method and not on any additional time allotted to the concept. This decision limited our iclicker condition, since the time required for students to enter their answers and to present the data was greater than that of a traditional lecture (Micheletto, 2011; Yoder & Hochevar, 2005). We believed that this may have reduced the benefits of using ARS. This time limitation, combined with the technological problems experienced, might have influenced the students’ perception of the usefulness of the iclickers. Using ARS requires prior planning and time commitment from instructors (Premkumar & Coupal, 2008). The instructors need to spend time learning to navigate the software (Premkumar & Coupal, 2008). Our TAs were given step-by-step, illustrated instructions on how to use the software, but due to limited resources, the TAs did not actually operate the ARS system until they had to use it in class. The instructor should always prepare an alternative to the ARS demo in case of technical difficulties (Premkumar & Coupal, 2008). Our TAs were instructed to teach the concept using a traditional lecture style if the clickers experienced technical issues. However, not all TAs were prepared to switch teaching conditions, as most were confident that they could use the technology effectively. The struggles that some TAs encountered during their first hands-on iclicker experience could have led to some negative feelings towards iclickers. Students could have perceived the unpreparedness of the TA as a general issue with the iclickers, making them appear more complex and cumbersome than they actually are. There were several technical issues related to the iclickers that could have been resolved with more detailed set-up or better TA training. The receivers from adjacent rooms interfered with the transmission frequencies of other base stations. TAs should have been provided with a base station setting that would not interfere with those in rooms nearby. TAs should also have been trained to change the base station settings to a different frequency. Also, many TAs’ computers did not recognize the iclicker software quickly. Some took upwards of five minutes to connect properly, a process that should only take a few seconds. To avoid this problem, TAs should have been required to connect their computers to the iclicker system before the beginning of the lecture to avoid the breaks in teaching that the iclickers created in those instances.
Recommendation 1 If iclickers are going to be used as an effective learning tool, we recommend the complete integration of the iclickers into the course design, or at least their regular use. Instructors, TAs and students should be provided with detailed training. In our case, while TAs were trained on the material to be taught, they were only given minor training on the use of the iclickers themselves. Some TAs received no training at all (i.e., TAs from the previous year did not have to attend the Applied Educational Psychology class). As a general recommendation, any study requiring the use of a large group of experimenters (TAs in our case) requires extensive planning and organization. Technology and procedures not only need to be demonstrated, but each experimenter needs to be provided with the opportunity to practice before the actual experiment begins. In our case, TAs were inconsistent in their ability to use the iclickers, and this resulted in a wide range of student enjoyment (reflected in questionnaire data). With such a varied group of experimenters, it becomes even more important to establish strict guidelines. This is not only true for the procedures but for certain methods of data collection, including attendance. These issues could be addressed further in future TA training sessions and included in the ARS training booklet.

Assessing the Impact of Interactive Sampling Using Audience Response Systems
Higher Education Quality Council of Ontario 20
Data Collection While there was some difficulty with data collection, we were able to collect data from an average of 1,582 participants. This is an extraordinary number compared to most studies of this kind. However, we were limited to only one data point per student for each learning condition. Having only a single measure per participant per condition severely limited the power of our statistical tests. To address this issue, we would need to have a variety of topics for each learning method and a variety of assessment questions for each tested concept. This would not only increase the number of collected data points, but also allow us to examine the iclickers’ use on a variety of topics. TA compliance with returning student attendance sheets was also responsible for a loss of data. Missing attendance resulted in the loss of almost 1,000 data points for each concept. This level of loss is unacceptable for a study of this magnitude. While it is impossible to control the actions of all experimenters, the importance of certain experimental elements should be stressed. In our case, if a TA performed the procedure perfectly but did not hand in their attendance, their data could not be used. Their added effort in the tutorial section, while benefiting the students, would not have been able to contribute to this project. Some TAs put more effort into the project than others. A number of TAs prepared for their tutorial only hours/minutes before it began. Not all TAs understood the negative consequences of not being properly prepared with regards to both student learning and this study.
Recommendation 2 Primarily, iclickers should be integrated into the course on a greater level to test their value across different topics. As mentioned in the previous section, integrating iclickers more fully into the class will resolve some of the training and timing issues with the technology. This suggestion is also valid here. Full integration of the iclickers would allow for a wider range of topics to be tested. Micheletto (2011) also recommends integrating a discussion component using ARS after collecting and showing data. In order to facilitate this type of active learning, students should be given the opportunity to discuss and reflect on their ARS experience and compare class data with published source data. This would naturally result in a greater number of data points per student participant. To address our issues with TA compliance with attendance sheets, a set method of TA attendance collection should have been used. We believe an electronic method would be best for a study of this size. This would not only reduce the time required to input the data (several hours for this study) but would also allow for a more reliable record of which TAs had and had not submitted attendance.
Overall Enjoyment Students did not enjoy the use of the iclickers. In general, they did not find the iclickers helpful and would not recommend them for further use. We believe that this attitude stems from many of the problems outlined above, primarily the fact that TAs were not properly trained in the use of the technology, resulting in an unharmonious blend of the iclickers into the lectures.
Recommendation 3 We believe that if the recommendations of the previous two sections are taken into account, the iclickers can be a useful and enjoyable learning tool for students. We believe that students were frustrated with the iclickers due to a lack of training on the part of the TAs. The struggles with set-up and the actual use of the iclicker were difficult for students to endure.

Assessing the Impact of Interactive Sampling Using Audience Response Systems
Higher Education Quality Council of Ontario 21
Conclusions Based on the results of both the quantitative and qualitative data, our sporadic experimental use of audience response systems to collect and present demonstration data in the classroom did not lead to better learning. Concepts taught with ARS demos were not better understood by students than those taught with pen and paper demos or traditional lecturing. Moreover, students did not appear to enjoy the iclicker lessons, as reflected by their poor rating and recommendation of the technology. We do believe, however, that our study’s shortcomings can be avoided. We recommend the following:
1. Iclickers should be used either regularly or not at all. The set-up required to use iclickers a single time is more of a distraction than a benefit.
2. Set-up time is increased when audience response systems are used by novices and when there are technical problems. Teaching with ARS should require prior planning and time commitment from instructors.
3. Teaching a variety of topics for each learning method would increase the number of data points and
allow for iclicker use on a variety of topics.

Assessing the Impact of Interactive Sampling Using Audience Response Systems
Higher Education Quality Council of Ontario 22
References Barnett, B. J., & Kriesel, W. (2003). Agricultural economists’ use of classroom economic experiments. Journal
of Agricultural and Applied Economics, 35(2), 321-335. Caldwell, J. (2007). Clickers in the large classroom: Current research and best-practice tips. Life Sciences
Education, 6(1), 9-20. Cleary, A. M. (2008). Using wireless response systems to replicate behavioural research findings in the
classroom. Teaching of Psychology, 35, 42-44. Doucet, M., Vrins, A., & Harvey, D. (2009). Effect of using an audience response system on learning
environment, motivation and long-term retention, during case-discussions in a large group of undergraduate veterinary clinical pharmacology students. Medical Teacher, 31, 570-579.
Glanzer, M., & Cunitz, A. R. (1966). Two storage mechanisms in free recall. Journal of Verbal Learning and
Verbal Behavior, 5, 351-360. Graham, C. R., Tripp, T. R., Seawright, L., & Joeckel III, G. L. (2007). Empowering or compelling reluctant
participators using audience response systems. Active Learning in Higher Education, 8(3), 233-258. Kay, R. H., & LeSage, A. (2009). Examining the benefits and challenges of using audience response systems:
a review of the literature. Computers & Education, 53, 819-827. Kim, J. A. (2012). Course description. In Applied Educational Psychology 3TT3 (September 2012 edition, p.
3). Hamilton, ON: McMaster University. McCarthy, J. P., & Anderson, L. (2000). Active learning techniques versus traditional teaching styles: two
experiments from History and Political Science. Innovative Higher Education, 24(4), 279-294. McGowan, H. M., & Vaughan, J. (2011). Testing a student generated hypothesis using student data.
Teaching Statistics, 34(2), 61-64. Micheletto, M. J. (2011). Conducting a classroom mini-experiment using an audience response system:
demonstrating the isolation effect. Journal of College Teaching and Learning, 8(8), 1-13. Murdock, B. B., Jr. (1962). The serial position effect of free recall. Journal of Experimental Psychology, 64(5),
482-488. Premkumar, K., & Coupal, C. (2008). Rules of engagement – 12 tips for successful use of “clickers” in the
classroom. Medical Teacher, 30, 146-149. Rosell, M. C., Beck, D. M., Luther, K. E, Goedert, K. M., Shore, W. J., & Anderson, D. D. (2005). The
pedagogical value of experimental participation paired with course content. Teaching of Psychology, 32(2), 95-99.
Slamecka, N. J., & Graf, P. (1978). The generation effect: delineation of a phenomenon. Journal of
Experimental Psychology, 4(6), 592-604. Yoder, J. D., & Hochevar, C. M. (2005). Encouraging active learning can improve students’ performance on
examinations. Teaching of Psychology, 32(2), 91-95.

Assessing the Impact of Interactive Sampling Using Audience Response Systems
Higher Education Quality Council of Ontario 23
Young, M. E., Norman, G. R., & Humphreys, K. R. (2008). The Role of Medical Language in Changing Public Perception of Illness. Teaching Statistics, 34(2), 61-64. PLoS ONE, 3(12), e3875.