International Journal of Academic Research in Business and Social Sciences July 2014, Vol. 4, No. 7 ISSN: 2222-6990 184 www.hrmars.com Assessing the Impact of Size on the Capital Structure Choice for Listed Nigeria Firms A.O. Olakunle 1 and P.L. Jones 2 1. Directorate for Collaborations, Affiliations and Linkages, Federal University of Technology, P.M.B. 65, Minna, Niger State, Nigeria. 2. Aberdeen Business School, The Robert Gordon University, Garthdee Road, Aberdeen, Scotland, UK. DOI: 10.6007/IJARBSS/v4-i7/998 URL: http://dx.doi.org/10.6007/IJARBSS/v4-i7/998 ABSRTACT This paper seeks to examine the impact of size on the capital structure choice of listed Nigeria firms in influencing their corporate financing strategy and performance analysis. The research work examines the applicability of western capital structure theories (static trade-off, agency cost and pecking order theories) on listed firms on the Nigeria Stock Exchange. The research study analysed 47 listed firms on the Nigeria Stock Exchange over the period 1997 – 2007 using the OLS regression analysis of natural log of sales (size of the firm), against leverage (total debt to total asset and short-term debt to total asset)with the objective of size effect on leverage on observed firms. Results shows that listed firms on the Nigeria stock exchange have positive Beta value of 0.055 between total debt and size and 0.048 between short-term debt and size. The observed positive correlation between leverage of Nigerian firms in relation to size, however, is not statistically significant. This implies that size of the firm can be said to have a positive influence on the leverage ratio of listed Nigeria firms. KEYWORDS: Capital Structure, Trade-off Theory, Agency Cost Theory, Pecking Order Theory, Corporate Financing Strategy, Nigeria Stock Exchange. INTRODUCTION The discussion on how firms raise capital with regards to instruments used to finance investment decisions have generated a lot of academic debate amongst scholars of finance in recent past, with scholar’s examining plausible reasons why listed firms raise capital through primary listing, secondary listing or issuing debt using different combinations of instruments such as ordinary equity, debt and hybrid securities which includes; preference shares, convertible and warrant debt. The management of a firm in this context has to decide what appropriate level of borrowing will be given to its equity capital base. To assist in this decision, it would be useful to know if by varying the debt-equity ratio it could increase shareholders wealth. A firm, in financing its operations will use a combination of debt and equity that best maximises the value of the firm. In the past four decade, much of the research on capital structure by scholars have advanced theoretical models to explain the capital structure patterns for firms and also to provide
Transcript
International Journal of Academic Research in Business and Social Sciences July 2014, Vol. 4, No. 7
ISSN: 2222-6990
184 www.hrmars.com
Assessing the Impact of Size on the Capital Structure Choice for Listed Nigeria Firms
A.O. Olakunle1 and P.L. Jones2 1. Directorate for Collaborations, Affiliations and Linkages, Federal University of Technology,
P.M.B. 65, Minna, Niger State, Nigeria. 2. Aberdeen Business School, The Robert Gordon University, Garthdee Road, Aberdeen, Scotland, UK.
ABSRTACT This paper seeks to examine the impact of size on the capital structure choice of listed Nigeria firms in influencing their corporate financing strategy and performance analysis. The research work examines the applicability of western capital structure theories (static trade-off, agency cost and pecking order theories) on listed firms on the Nigeria Stock Exchange. The research study analysed 47 listed firms on the Nigeria Stock Exchange over the period 1997 – 2007 using the OLS regression analysis of natural log of sales (size of the firm), against leverage (total debt to total asset and short-term debt to total asset)with the objective of size effect on leverage on observed firms. Results shows that listed firms on the Nigeria stock exchange have positive Beta value of 0.055 between total debt and size and 0.048 between short-term debt and size. The observed positive correlation between leverage of Nigerian firms in relation to size, however, is not statistically significant. This implies that size of the firm can be said to have a positive influence on the leverage ratio of listed Nigeria firms. KEYWORDS: Capital Structure, Trade-off Theory, Agency Cost Theory, Pecking Order Theory, Corporate Financing Strategy, Nigeria Stock Exchange. INTRODUCTION The discussion on how firms raise capital with regards to instruments used to finance investment decisions have generated a lot of academic debate amongst scholars of finance in recent past, with scholar’s examining plausible reasons why listed firms raise capital through primary listing, secondary listing or issuing debt using different combinations of instruments such as ordinary equity, debt and hybrid securities which includes; preference shares, convertible and warrant debt.
The management of a firm in this context has to decide what appropriate level of borrowing will be given to its equity capital base. To assist in this decision, it would be useful to know if by varying the debt-equity ratio it could increase shareholders wealth. A firm, in financing its operations will use a combination of debt and equity that best maximises the value of the firm.
In the past four decade, much of the research on capital structure by scholars have advanced theoretical models to explain the capital structure patterns for firms and also to provide
International Journal of Academic Research in Business and Social Sciences July 2014, Vol. 4, No. 7
ISSN: 2222-6990
185 www.hrmars.com
empirical evidence concerning whether the theoretical models have explanatory power when applied in real business world. Examining reasons behind the preference of firms choosing their financing patterns, Modigliani and Miller's (1958, 1963) contribution on the irrelevance of capital structure and tax shield advantage sets the stage upon which several capital structure theories have been developed. Aim To examine the impact of size on the choice of capital structure for listed Nigeria firms in influencing their corporate financing strategy and performance analysis. Objectives 1. To determine whether the main theories of capital structure (trade-off, agency and pecking order theories) explains financing behaviour for listed firms in Nigeria. 2. To examine the impact of size on the choice of capital structure for listed firms in Nigeria. BACKGROUND ON THE NIGERIA STOCK EXCHANGE The Nigeria Capital Market is a financial market that provides facilities for mobilising and dealings in medium and long term funds. The players on the market are the operators who act as intermediaries between the providers of the funds and the fund users. They include, Securities Exchanges, Brokers/Dealers, Issuing Houses, Registrars and Investment Advisors. In pursuance of making funds available for economic development and growth; the Securities and Exchange Commission was established in 1979 by the Securities and Exchange Commission Decree (this decree was re-enacted in 1988 as Securities and Exchange Commission Decree no. 29 of 1988), for the purpose of protecting the investors as well as developing the capital market. A detailed review of the Nigerian Capital Market was carried out in 1996. This led to the enactment of the "Investment Securities Act (ISA) No.45 of 1999 (and the regulations made there-under). This Act replaced the Securities and Exchange Commission Decree No.29 of 1988. It aimed at providing a more efficient and viable capital market positioned to meet the country's economic and developmental needs of the nation. The Nigerian Stock Exchange (NSE) is one of the biggest equity market place in Africa, being rated as one of the fastest growing market among the world’s developing and emerging economies in early 2008. As at 28th March, 2014, it recorded; 204 listed companies, 276 listed securities, market capitalisation was N16.63trillion and an All-Share Index (ASI) of 38,697.49. The stock exchange was established in 1960 as the Lagos Stock Exchange and was transformed to The Nigerian Stock Exchange in December 1977, with branches established in some of the major commercial cities of the country. Presently, there are thirteen branches of The Nigerian Stock Exchange with Lagos branch as the Corporate Headquarters while Abuja serves as the area office. Each branch has an electronic trading floor. The branch in Lagos was opened in 1961 and upgraded to a world class trading floor in 2009; Kaduna, 1978; Port Harcourt, 1980; Kano, 1989; Onitsha, February 1990; Ibadan August 1990; Abuja, October 1999; Yola, April 2002; Benin January, 2005; Uyo, May 2007; Ilorin, January 2008; Abeokuta, November 2008; Owerri, February 2009 and Bauchi, March 2009.
International Journal of Academic Research in Business and Social Sciences July 2014, Vol. 4, No. 7
ISSN: 2222-6990
186 www.hrmars.com
Trading activity is concentrated in Lagos and is undertaken by an Automated Trading System (ATS) on a daily basis from 11:00 am to 14:00 pm. Settlement is partially G30 compliant, with a CSD created in 1992 and international custodian banks (Nigerian stock exchange website, 2014). In an effort to deepen the Capital Market and expand the product range, The Stock Exchange in 2008 created five new tradable indices, which was launched in the first quarter of 2009. These indices namely are:
NSE 30 Index NSE Banking 10 Index NSE Insurance 10 Index NSE Food/Beverage 10 Index NSE Oil/Gas 5 Index
Prices of new issues on the exchange are determined by issuing houses/stockbrokers, while on the secondary market prices are made by stockbrokers only. The market/quote prices, along with the All-Share Index, are published daily in The Stock Exchange Daily Official List, The Nigerian Stock Exchange CAPNET (an intranet facility), The Nigerian Stock Exchange website, Newspapers and on the stock market page of the Reuters Electronic Contributor System. The Exchange maintains an All-Share Index formulated in January 1984 (January 3, 1984 = 100). Only common stocks (ordinary shares) are included in the computation of the index. The index is value-relative and is computed daily. Transactions in the stock market are guided by the following legislations, among others:
THEORITICAL FRAMEWORK For over four decades, literature on corporate finance has profound different theories to identify and explain determinants factor for a firms financing policy and capital structure. These theories span across various aspects of the firm that can explain how firms choose their capital structure. The Modigliani and Miller (M&M (1958, 1963) irrelevance capital structure theory preposition set the precedence in the development of alternative theories on capital structure. In seeking possible explanation on how financing decisions (debt-equity mix) informs the firm’s capital structure, Modigliani and Miller (1958) in their seminar paper examined the relationship between the firm financing choice and its value. Modigliani and Miller (1963) explored the relevance of taxation in determining the firm’s financing behaviour which they stated given a world devoid of taxation, the firm’s value will be independent of its debt-equity mix. The theory holds that the firm’s market value is calculated by the risk associated with the underlying assets of the firm and also on the earning capacity of the firm. However due to criticism of these assumptions, M&M in their 1963 paper “Corporate income taxes and the cost of capital” addressed the issue of no taxation cost. This they did by acknowledging that individuals and companies do pay taxes and made adjustment for this.
International Journal of Academic Research in Business and Social Sciences July 2014, Vol. 4, No. 7
ISSN: 2222-6990
187 www.hrmars.com
These assumptions have been criticized by scholars on its relevance. For example, conventional capital structure theories (Myers, 1997, Jensen, 1986) suggest that firms optimal capital structure is related to costs and benefits associated with debt and equity financing. With the optimal debt-to-equity mix, firms could achieve the lowest financing costs and consequently increase the value of shareholders Sheel (1994). Although the optimal mix varies from industry to industry Kim (1997) and from country to country Wald (1999), previous researchers have constantly found capital structure theories applicable when explaining financing decisions. However, the alternative theories that have been developed to explain a firms financing choice with regards to its debt-equity mix include the trade-off theory, the pecking order/asymmetric information theory and agency cost theory. All these theories have been subjected to extensive empirical testing in the context of developed countries, particularly the United States (US), however not much research has been done with respect to developing countries. Some of the reasons that account for this are clear; many developing countries initially opted for a state-sponsored route to development, with a relatively insignificant role assigned to the private corporate sector (Prasad 2001). Theoretical Contribution of the Static Trade-off Theory The trade-off hypothesis, suggests that the optimal financing policy consists of making adjustments toward the target debt level provided that deviation costs exceed adjustment costs. The target leverage ratio balances the marginal tax benefit with the marginal financial distress cost of debt. Indicatively, the trade-off model predicts that the trade-off between the benefits of debt financing (e.g., the tax deductibility of interest and reduced agency costs through the monitoring role of debt) and debt-related costs (e.g., bankruptcy costs and agency costs of debt) creates an optimal capital structure towards which firms move over time (Myers, 1977). Ngugi (2008) submits that there are benefits and cost associated with the use of debt as against equity, thus the firm will only choose an optimal capital structure that trades off between the tax advantages of debt against bankruptcy cost. This benefit was later extended to cover benefits and costs associated with the use of debt in mitigating the conflicts among agent groups associated firm i.e. managers, equity-holders and debt-holders (Jensen and Meckling, 1976 and Jensen, 1986). Scott (1977) claimed that a firm’s optimal debt ratio is determined by the trade-off between the bankruptcy cost and tax advantage of borrowing. Higher profitability decreases the expected costs of distress and let firms increase their tax benefits by raising leverage. Firms would prefer debt over equity until the point where the probability of financial distress starts to be important. Similarly, Myers (1997) and Jensen (1986) examined the impact of corporate income tax on the capital structure and suggested that firm’s optimal capital structure is related to cost and benefits associated with debt and equity financing. Myers (1984), suggest that the trade-off between the tax advantage of debt and cost of financial distress is expected to yield the optimal level of debt that maximizes the value of the firm. The static trade-off theory predicts in this context that more profitable firms should have more debt since they have more profits that could be shielded from taxes without incurring an undue
International Journal of Academic Research in Business and Social Sciences July 2014, Vol. 4, No. 7
ISSN: 2222-6990
188 www.hrmars.com
cost of bankruptcy. However, the empirical evidence is the opposite (Myers, 1984; Titman and Wessels, 1988; Fama and French, 2002). Empirical Evidence of Static Trade-off Theory from Developed and Developing Countries Several studies have been conducted on developed and a few on developing countries to examine capital structure theories. Titman and Wessels (1988) using data from US industrial companies analyzed the impact of unobservable attributes on the choice of corporate debt ratios. They regressed the collateral value of assets, non-debt tax shields, growth, uniqueness of business, industry classification, firm-size, volatility of earning and profitability on three separate measures of short-term, long-term, and firm growth. They found a negative relationship between debt levels and uniqueness of business. Profitability was negatively related to all measures of debt. Finally, short-term debt ratios are found to be negatively related to a firm’s size. Similarly, Booth et al, (2001) carried out studies in ten (Malaysia, Zimbabwe, Mexico, Brazil, Turkey, Jordan, India, Pakistan, Thailand, and Korea) developing countries to assess whether capital structure theories are applicable across developing countries with different institutional structures. Booth et al. (2001) use three measure of debt ratio; total debt ratio, long-term book debt ratio, and long-term market debt ratio with average tax rate, assets tangibility, business risk, size, profitability, and the market to book ratio as explanatory variables. The study showed that the more profitable the firm, the lower the debt ratio, regardless of how the debt ratio was defined. It also showed that the more the tangible assets, the higher the long-term debt ratio but the smaller the total debt ratio. Booth et al. (2001) conclude that the debt ratio in developing countries seemed to be affected in the same way by the same types of variables that were significant in developed countries. However, they pointed out that the long-term debt ratios of those countries are considerably lower than those of developed countries. Theoretical Contribution of Agency Cost Theory The theory examined the conflict of interest that arises between shareholders, managers and debt holders. In this case, the shareholders and debt holders are referred to as the principal while the managers are regarded as the agent acting on behalf of the principal. The need to ensure that agent act in the best interest of the principal to avoid conflict was examined in the contributions of; Ross (1973), Shavel (1979), Fama (1980, 1990), Arrow (1985) and Jensen and Meckling (1992). They all debate that conflict arises if the firm issues equity, the proportion of owners-manager’s interest within the firm minifies, this invariably encourages the owner-managers to engage in activities that might not be beneficial in the long run because of the reduced equity stake. Jensen and Meckling (1976) examined the question of asset substitution that arises when share holders decides to seize wealth from debt-holders by investing in riskier projects which if successful offers high returns benefits to owners-mangers solely but with a high possibility of failure. The switching from a safer to a more risky investment portends potential conflict that may arise between shareholders and debt holders. Reason for this is simple, in the event the project fails the owner-managers exposure is mild because his equity holding in the firm has been reduced. Similarly, Myers (1977) identified firms in financial difficulties to have incentive
International Journal of Academic Research in Business and Social Sciences July 2014, Vol. 4, No. 7
ISSN: 2222-6990
189 www.hrmars.com
to sacrifice low positive net present value (NPV) projects whose benefits accrue mainly to debt-holders. This results in under-investment by the firm. He then postulates that the greater the investment opportunity in a firm, the greater is the potential conflict of interest between shareholders and debt-holders. Smith and Warner (1979) also identified four major sources of conflict: (i) Dividend payments: Here bonds are priced according to the level of dividends paid by the firm. In the limit, a firm could sell all its assets and pay a liquidating dividend to its shareholders with the bondholders being left with valueless claims. (ii) Claim dilution: Bonds are normally priced assuming that the firm will not carry any more leverage. If the firm does issue additional debt, then existing debt will fall in value if the newly issued debt has higher priority. Even if it does not, existing debt will fall in value if the risk of bankruptcy is perceived to have increased. (iii) Asset substitution: Bonds are priced in relation to the risk of the project which is being financed. Thus, lenders' claims are reduced if the firm substitutes projects that increase the firm’s variance. This transfers wealth from bondholders to shareholders. (iv) Under-investment and mis-investment: Here, a firm in financial difficulties has an incentive to reject low-risk, low (positive) net present value projects whose benefits accrue mainly to bondholders, in favour of high-risk, high net present value projects, thus creating under-investment or misallocation of investment. To moderate such conflicts, Smith and Warner (1979) opined using restrictive covenants on debt such as interest coverage requirement or prohibitions against investing in new unrelated lines of business. It should be noted that restrictive covenants’ involves cost as they restrict the firm’s investing and financing opportunities. Diamond (1989) suggested an alternative approach where managerial reputation plays an important role in mitigating conflicts between shareholders and debt-holders. Galai and Masulis (1976) utilised an option model where stock of a levered firm is analogous to a European call option on the firm's cash flows, with an exercise price equal to the face value of the debt to show that a redistribution of wealth from bondholders to shareholders will result from any of: an increase in the risk of the firm, an increase in debt, or a distribution (payout) of assets to shareholders. However, Jensen and Meckling (1976) posit that if investors are aware of the conflict between stockholders and bondholders and discount any bonds which are issued, stockholders will not gain from such actions since any ex-post transfers to stockholders will be suboptimal to the firm. Conversely, Galai and Masulis (1976) observed that the problem of conflict can always be circumvented if investors hold an equal proportion of their portfolio in equity and debt. Given the analogy, Jensen and Meckling (1976) addressed the incentive problems that could arise due to the separation between ownership and control and suggested that the use of secured debt could help in reducing the cost of debt. This separation may provide them with the incentive to maximize their wealth in a way that may harm stockholders by either over-investing in managerially rewarding but unprofitable activities or to overvalue the investment requirements and to take the difference between the dummy value and real value of investment Zuriagat (2009). Gillan and Starks (2003) noted that the separation between ownership and control is not the only factor that gives rise to the agency problems, the diffuse nature of corporate ownership may motivate the agency problem, where no incentive exists for small shareholders to bear the cost of monitoring the management behaviour.
International Journal of Academic Research in Business and Social Sciences July 2014, Vol. 4, No. 7
ISSN: 2222-6990
190 www.hrmars.com
The theoretical contribution of Pecking Order Theory Pecking order theory predicts that due to the information asymmetry between the firm (mangers/insiders) and outside investors regarding the real value of both current operations and future income stream and prospects, external capital (debt and equity) will always be relatively costly compared to internal capital (retained earnings). In this context equity will only be issued by the firm due to duress or in an event where the benefit of investments exceeds earnings that debt financing would have produced to put the firm at leverage. Two main literature approaches have been advanced that examined the impact of information asymmetry on firm’s capital structure. The contribution of Myers and Majluf (1984) and Myers (1984) posits that capital structure is designed to mitigate inefficiencies in the firm’s investment decisions that are caused by information asymmetry, by following a pecking order in their investment decisions. They argued that managers use private information to issue risky securities when they are overpriced. Investors are aware of this asymmetric information problem, and the prices of risky securities fall when new issues are announced. Managers anticipate the price declines, and may forego profitable investments if they must be financed with risky securities. Managers must therefore follow a pecking order in issuing securities of the firm to avoid this type of distortions. Given this view, Myers was able to demonstrate that given asymmetry of information between investors and firm insiders, firm equity may be underpriced by the market and this will result in new equity being under-priced. For managers to act in the best interest of shareholders, managers will refuse to issue equity even if it means passing up a positive Net Present Value (NPV) projects because the possible net loss to existing shareholders will outweigh its possible gain. This suggest that firms would prefer to use internally generated funds as a means of financing and only resorts to external funds only if the need for funds is unavoidable. Contrary to Myers postulation, Fama and French (2005) argues that if firms find ways to issue equity without creating asymmetric problems, then asymmetric information may not constrain equity issues. As a result, pecking order financing can disappear; that is, financing with equity is not a last resort, the incentive to avoid repurchases to maintain debt capacity is gone, and asymmetric information problems do not drive capital structures. This does not mean asymmetric information is irrelevant. But its implications become quite limited. Firms do avoid issuing risky securities in ways that involve asymmetric information problems, but financing decisions do not follow the pecking order. However, Myers (2001) contends that the equity issues occur only when debt is costly, i.e. at a dangerously high debt ratio where managers and investors foresee costs of financial distress. Myers demonstrates that equity issues are spurned by investors if debt is available on fair terms, and in equilibrium only debt is issued. Therefore, he argues that debt has the prior claim on assets and earnings, while equity is the residual claim. In the context of pecking order theory, firms should issue equity when they experience high stock’s valuation for two reasons: firstly, the asymmetric information costs to the firm are expected to be low when shares are overvalued, secondly, these firms are expected to have higher growth opportunities which induce them to finance their financing needs with equity in order to maintain their borrowing capacity for the future (see, Titman and Wessels, 1988 and Rajan and Zingles, 1995).
International Journal of Academic Research in Business and Social Sciences July 2014, Vol. 4, No. 7
ISSN: 2222-6990
191 www.hrmars.com
Empirical Evidence of Pecking Order Theory from Developed and Developing Countries Several studies have adopted different techniques and models in testing the relevance of the pecking order theory on the capital structure to the firm. Notably, the study of Shyam-Sunder and Myers (1999), Frank and Goyal (2003) submits that internal funds deficit is the main determinant of the change in debt level. Similarly, Allen (1993), Baskin (1989), and Adedeji (1998) tested the prediction power of the pecking order theory on the firm capital structure by examining some explanation variables such as profitability, size and growth and pointed out that there is a negative sign of profitability coefficient to leverage. Similarly, Mayer (1990) examined the source of industry finance in eight developed countries. His study reveals a number of stylised facts regarding corporate financing behaviour, which support the existence of financing hierarchies. He finds:
Retentions are the dominant source of financing in all countries. The average firm in any of these countries does not raise substantial amounts of
financing from securities markets in the form of short term securities, bonds, or equity. Small and medium size firms are considerably more reliant on external finance than
large firms. The majority of external financing comes from bank loans in all countries.
Mayer found evidence that bank loans are the primary source of external finance for firms in developed countries. He interprets his findings as showing that banks perform a central function in eliminating asymmetric information in financial markets by playing a vital role in collecting and processing information that markets are unable to do or only do so at high cost. METHOD OF ANALYSIS This study makes use of econometric approach in estimating the relationship between capital structure theories (the static trade-off theory, agency cost theory and the pecking order model) and financing choice of listed Nigeria firms from 1997 to 2007. The three main theories examined postulates that there is a positive relationship between the leverage ratio of a firm and its size, hence: H1: There is a positive relationship between leverage ratios and size. To test the hypothesis the relationships between the level of debt (leverage) and explanatory variable size is examined using the ordinary least square regression. For the purpose of this study size is defined as the natural logarithm of sales. This implies that the size effect on leverage is non-linear. Here sales rather than total assets are used to avoid the probability of spurious correlation. This can be represented as; LOGSALE = Ln (Sales) The research will analyze data samples of 216 listed firms on the Nigeria stock exchange from 1997 to 2007 using secondary data sources mainly from OSIRIS which contains financial information data on 62,000 listed and major unlisted/delisted companies worldwide and African Financial Markets. Data set used for the purpose of this research work were obtained from both balance sheet and income statements of selected firms and by averaging these data over the ten years period of analysis the researcher was able to smoothen the leverage and explanatory variables. The criteria used for selecting chosen companies were the availability of relevant information in the financial statements of each firm in the sample for the time period of 10 years (1997-2007).
International Journal of Academic Research in Business and Social Sciences July 2014, Vol. 4, No. 7
ISSN: 2222-6990
192 www.hrmars.com
In this view, the final sample set consists of a 47 firms spanning across all the major sectors on the stock exchange. This accounts for about 22 percent of the relevant population of listed firms on the exchange, however given the wide spread of observed firms across various sectors listed on the stock exchange, research sample can be viewed to be a good representative of firms listed on the stock exchange as it all classified sectors on the stock exchange was captured. Given the focal point of the research are listed firms on the Nigeria stock exchange, all non-publicly quoted firms were excluded from the research. The proposed relationship for this study is depicted by these models; MODEL 1
Tot = α + β1nXn + Et
Where: Tot = Trade-off theory is the dependent variable. Xn = Size of the firm is the Independent variables α = Intercepts Et = Random Error MODEL 2
Ag = α + β1nXn + Et Where: Ag = Agency theory is the dependent variable. Xn = Size of the firm is the Independent variables α = Intercepts Et = Random Error MODEL 3
Po = α + β1nXn + Et
Where: Po = Pecking Order theory is the dependent variable. Xn = Size of the firm is the Independent variables α = Intercepts Et = Random Error Dependent Variable This is the measure of the firms’ performance. The proxy used to denote these within the context of Tot, Ag and Po in the assessment of capital structure theories is leverage (Li). Leverage can be defined as the amount of debt in the capital structure of the firm. There exists a choice of approach to use in computing leverage i.e. the book leverage and market leverage. Elkamhi et al (2010) identified reasons to support the use of book and market leverage. They reasoned that book leverage supports assets in place while market leverage in addition supports growth opportunities. Graham and Harvey (2001) acknowledged that managers tend to track book leverage more closely than market leverage. This they attributed to ability of managers to control the extent of book leverage by the issuance and retirement of debt or issuance and repurchasing of equity.
International Journal of Academic Research in Business and Social Sciences July 2014, Vol. 4, No. 7
ISSN: 2222-6990
193 www.hrmars.com
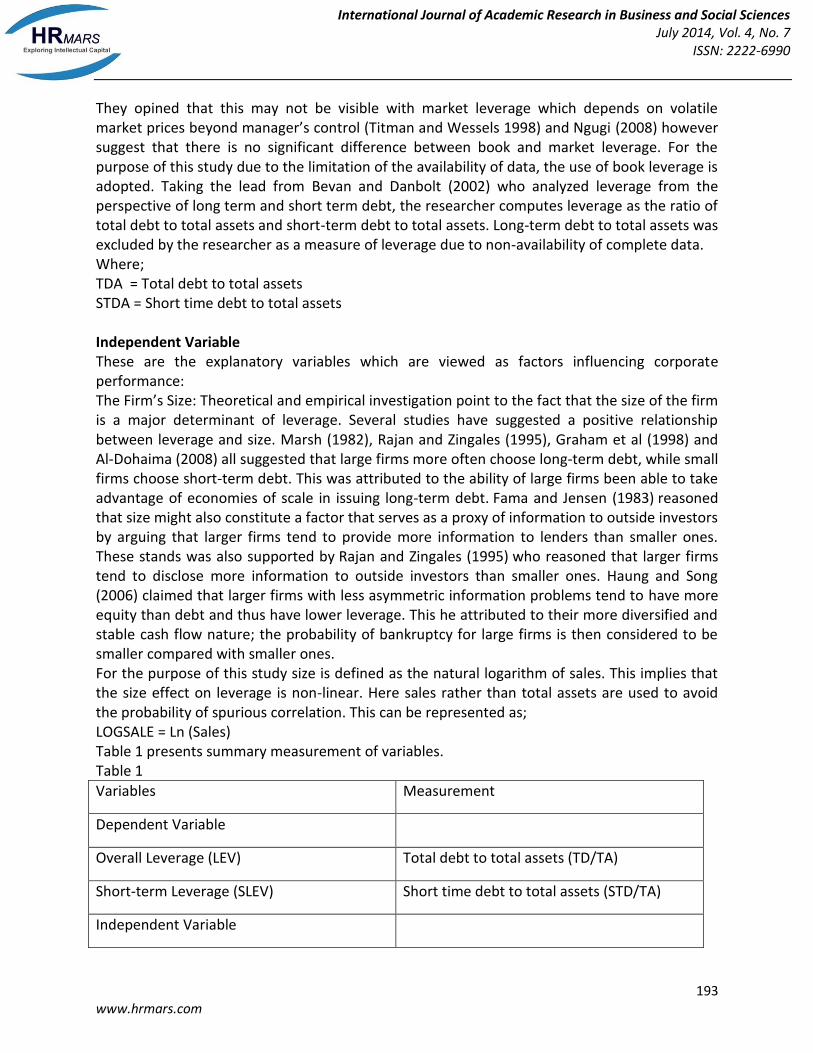
They opined that this may not be visible with market leverage which depends on volatile market prices beyond manager’s control (Titman and Wessels 1998) and Ngugi (2008) however suggest that there is no significant difference between book and market leverage. For the purpose of this study due to the limitation of the availability of data, the use of book leverage is adopted. Taking the lead from Bevan and Danbolt (2002) who analyzed leverage from the perspective of long term and short term debt, the researcher computes leverage as the ratio of total debt to total assets and short-term debt to total assets. Long-term debt to total assets was excluded by the researcher as a measure of leverage due to non-availability of complete data. Where; TDA = Total debt to total assets STDA = Short time debt to total assets Independent Variable These are the explanatory variables which are viewed as factors influencing corporate performance: The Firm’s Size: Theoretical and empirical investigation point to the fact that the size of the firm is a major determinant of leverage. Several studies have suggested a positive relationship between leverage and size. Marsh (1982), Rajan and Zingales (1995), Graham et al (1998) and Al-Dohaima (2008) all suggested that large firms more often choose long-term debt, while small firms choose short-term debt. This was attributed to the ability of large firms been able to take advantage of economies of scale in issuing long-term debt. Fama and Jensen (1983) reasoned that size might also constitute a factor that serves as a proxy of information to outside investors by arguing that larger firms tend to provide more information to lenders than smaller ones. These stands was also supported by Rajan and Zingales (1995) who reasoned that larger firms tend to disclose more information to outside investors than smaller ones. Haung and Song (2006) claimed that larger firms with less asymmetric information problems tend to have more equity than debt and thus have lower leverage. This he attributed to their more diversified and stable cash flow nature; the probability of bankruptcy for large firms is then considered to be smaller compared with smaller ones. For the purpose of this study size is defined as the natural logarithm of sales. This implies that the size effect on leverage is non-linear. Here sales rather than total assets are used to avoid the probability of spurious correlation. This can be represented as; LOGSALE = Ln (Sales) Table 1 presents summary measurement of variables. Table 1
Variables Measurement
Dependent Variable
Overall Leverage (LEV) Total debt to total assets (TD/TA)
Short-term Leverage (SLEV) Short time debt to total assets (STD/TA)
International Journal of Academic Research in Business and Social Sciences July 2014, Vol. 4, No. 7
ISSN: 2222-6990
194 www.hrmars.com
Firm’s Size Logarithm of sales [Ln(Sales)]
Beta Coefficients: This variable is used to examine the strength of relationship between the dependent variable (leverage) and the independent variable (size). The relationship between the dependent and independent variable was measured using the book value of leverage. Sig: These represent t-test level of significance. When the value of “Sig” is below 0.01, 0.05 and 0.1 it implies that at 99%, 95% and 90% confidence intervals respectively the relationship between relevant independent variables i.e. size, is a good proxies that explains the leverage ratio for the firms been considered. Hence we cannot accept the null hypothesis. While when the value obtained is above 0.01, 0.05 and 0.1 we cannot reject the null hypothesis at 99%, 95% and 90% confidence interval, which infers that the relationship between variables occurred coincidentally. RESULTS AND DISCUSSION Table 2.0: presents the descriptive statistics for the explanatory variable and leverage measures for the entire sample of Nigeria companies. Leverage was measured as short-term debt scaled by total asset and total debt scaled by total assets (both book values). A descriptive statistic for the variable being examined is presented in the table blow. Table 2
International Journal of Academic Research in Business and Social Sciences July 2014, Vol. 4, No. 7
ISSN: 2222-6990
195 www.hrmars.com
2006 15.66 2.05 0.60 0.26 0.82 0.28
2007 16.09 1.64 0.56 0.23 0.75 0.30
(Source: Survey Data)
The leverage ratio’s results from the Table 2 indicates that over the entire period (1997-2007) under consideration there was successive decrease in both short-term debt and total debt ratio of the firms except year 2000 and 2001 where values obtained were uptrend. This indicates that there has been successive decrease in the ability of Nigerian firms to use increased debt to finance their activities. The double digit inflation rate, lack of adequate support infrastructure for businesses, lack of uniform accounting reporting standard and unstable government policies in the country are part of the reasons why it is increasingly difficult for firms to use debts in financing its activities over the years. The slight increase in total debt witnessed in the year 2000 and 2001 can be attributed to the economic boom witnessed in the country as a result of earnings in the oil sector (noting that the Nigerian economy is largely dependent on the income proceeds from sales of its crude oil). The graph below gives a pictorial view of the analysis above
Fig 1: Leverage of the firms
From Table 2, the relationship between size and leverage has been positive although decreasing over the years with an exception of a peak of 2.05 in 2006 for the period considered. This confirms the assertion of a positive relationship between leverage and size. Generally for the period examined there was successive marginal increase in the size of firms examined without a corresponding increase in leverage. This indicates that investors are more interested on certain variables as a pointer to a healthy firm. There is therefore a need to re-examine this variable more closely. The graph below presents a graphical analysis of the argument just espoused.
International Journal of Academic Research in Business and Social Sciences July 2014, Vol. 4, No. 7
ISSN: 2222-6990
196 www.hrmars.com
Fig 2: Size of the firm
Given an overview of the relationship between the factor identified as determinants of capital structure in Nigeria (i.e. size) and leverage, the researcher used the SPSS program in running regression analysis of natural log of sales (size of the firm), against leverage (total debt to total asset and short-term debt to total asset) of 47 selected companies listed on the Nigeria stock exchange. The use of t-test statistic was employed by the researcher to determine if the results of the analysis are truly relevant or if they occurred due to coincidence. The relationship between output of the dependent and independent variable was measured by standardized coefficient (Beta). Table 3 and 4 below presents the output of the regression analysis. Table 3
Model Unstandardized
Coefficients Standardized Coefficients t Sig.
B Std. Error Beta B Std. Error
1 (Constant) -0.183 2.377 -0.077 0.939
LNSALES 0.051 0.151 0.055 0.341 0.736
Dependent Variable: Total debt (total debt to total assets) Independent Variable: Size (LNSALES) Table 4: Regression Analysis
International Journal of Academic Research in Business and Social Sciences July 2014, Vol. 4, No. 7
ISSN: 2222-6990
197 www.hrmars.com
Model R R Square Adjusted R
Square Std. Error of the Estimate
1 0.577(a) 0.333 0.256 1.3054124
(Source: output of SPSS Computation) Table 5: Strength of relationship between the dependent variable (leverage) and independent variable (size)
Model Unstandardized
Coefficients Standardized Coefficients t Sig.
B Std. Error Beta B Std. Error
1 (Constant) -0.183 2.120 -0.086 0.932
LNSALES 0.040 0.135 0.048 0.294 0.771
Dependent Variable: Total debt (total debt to total assets) Independent Variable: Size (LNSALES) Table 6: SPSS Computation
Model R R Square Adjusted R Square Std. Error of the
Estimate
1 0.561(a) 0.315 0.236 1.1642648
(Source: Output of SPSS Computation) Definition of Key Variables used in Analysis Beta Coefficients: This variable is used to examine the strength of relationship between the dependent variable (leverage) and independent variables (size). The relationship between the dependent and independent variable was measured using the book value of leverage. Adjusted R-Square: Table 6 is used to give computed R-square more honest/fair value (where r-squared reflects the explanatory power of independent variable in predicting the dependent variable). For analysis the use of adjusted R-squared was adopted because the linear model being explained constitutes a sample of listed firms on the Nigeria stock exchange. This makes the use of R-squared more relevant. T-test Statistic: The use of t-test statistic was employed by the researcher to determine if the results of the analysis are truly relevant or if they occurred due to coincidence. Sig: These represent t-test level of significance. When the value of “Sig” is below 0.01, 0.05 and 0.1 it implies that at 99%, 95% and 90% confidence intervals respectively the relationship between relevant independent variables i.e. size, volatility and asset tangibility are good proxies that explains the leverage ratio for the firms been considered. Hence we cannot accept the null hypothesis. While when the value obtained is above 0.01, 0.05 and 0.1 we cannot reject the null hypothesis at 99%, 95% and 90% confidence interval, which infers that the relationship between variables occurred coincidentally.
International Journal of Academic Research in Business and Social Sciences July 2014, Vol. 4, No. 7
ISSN: 2222-6990
198 www.hrmars.com
Estimation and Testing of Results Influence of Size on Leverage of Firms Examining the preposition of the trade-off theory which analysed the benefits and cost of issuing debt for corporate firms asserting that firms tend to observe a target corporate debt ratio that is defined by a trade-off between tax deductibility of interest and costs of financial distress with an objective of achieving an optimal capital structure through adjustment of debt in relation to equity. Findings from previous research work reveals mixed result on the influence of size of a firm to its leverage ratio. Titman and Wessels (1988), Booth et al, (2001), Pandey (2001), and Al-Sakran (2001) all reported a positive relationship between leverage ratio and size while Bevan and Danbolt (2002) reports that size is negatively related to short-term debt and positively related to long-term debt. The agency theory and pecking order theory both postulate a positive relationship between leverage and size. While the agency theory examined the conflict of interest that arises between stock holders/ debt holders (principals’) and managers (agent) who act on-behalf of the principal, the pecking order theory examined the concept of information asymmetry in an organization where managers/insiders are assumed to have private information about the firms return income stream and investment opportunity not usually known to an ordinary investor. The pecking order theory then argued that large firms tend to have less volatile earnings because of their size, hence information asymmetric problem can be mitigated, and size is therefore expected to have a positive impact on leverage. The research analysis will however examine the overall size of listed companies under review with the objective of asserting the impact of the size of the firms on their general leverage level. The regression results of listed firms on the Nigeria stock exchange show a positive correlation (Beta value) of 0.055 between total debt and size and 0.048 between short-term debt and size. This means that a 1 unit increase in size of the firm will lead to 0.055 and 0.048 increase in total debt and short-term debt respectively. Hence size of the firm can be said to have a positive influence on the leverage ratio of listed Nigeria firms. The result obtained is in consonance with research work carried out on other developing countries by Booth et al, (2001), Pandey (2001), and Al-Sakran (2001) and Rajan and Zingales (1995) on G-7 countries who found a positive relationship between size and leverage. Given the obtained Sig values (0.736 and 0.771) were greater than 0.01, 0.05 and 0.1 then it can be stated that the null (H0), that the regression coefficient = 0 CANNOT be rejected i.e. the null hypothesis is not statistically different from zero at 99%, 95% and 90% level of confidence. The observed positive correlation between leverage of Nigerian firms in relation to size can be said not to be statistically significant, part of the reason that can be attributed to the observed positive correlation between leverage and size is the lack of constant periodic publication of financial information and uniform accounting reporting standard for financial reporting by listed firms, this give room for firms to use varied accounting reporting standard to mutilate some of their financial figures. Invariably, these tend to give firms a balance sheet size usually above their actual state. This is partly responsible for the crash in the market values of firms on the Nigerian stock exchange in 2008. We can identify these factors to be responsible for
International Journal of Academic Research in Business and Social Sciences July 2014, Vol. 4, No. 7
ISSN: 2222-6990
199 www.hrmars.com
inhibiting Nigerian firms taking advantage of their size for leverage, as investors tend not to trust completely financial information in the balance sheet and income statements of these firms. Hence, they (investors) evaluate other key variables in the financial statements of the firms. It was in an effort to curtail this sharp practice that the Dotun Sulaiman Committee was constituted in 2009 by the Nigerian Security and Exchange Commission to reposition the Nigeria capital market for greater efficiency. Decision: CANNOT Reject H0 which implies that there is no positive relationship between leverage ratios and size of the firms. CONCLUSION This study examines the determinants of capital structure decisions for listed firms on the Nigeria stock exchange. Previous research work have focused mainly on western countries, the objective of the research work is to examine the applicability of postulated capital structure theory (trade-off, agency and pecking order theory) in western countries to observed trend on listed firms in Nigeria. The research discussed how the capital structure decisions of firms are influenced, with focus on a sample of 47 out of 216 listed firms on the Nigerian stock exchange. The use of short-term and total debt was adapted as a proxy for determining leverage. We analyze the impact of firm’s size on choice of capital structure for observed listed firms. The following major deduction can be inferred from obtained results. Firstly, observing impact of size on firms’ leverage, result reflects a non-statistically significant positive correlation between size and firms leverage (short-term and total debt) for trade-off, agency and pecking order theory. Observed results however contradict findings of Rajan and Zingales (1995) assertion of a significant positive correlation between leverage and size in G-7 Countries and Titman and Wessels (1988) submission of negative correlation between short-term debt (leverage) and size for observed US industrial firms. However Chen (2003), using fixed effect model in analysing Chinese firms found a non-statistical positive correlation between size and leverage. This supports findings observed for listed Nigerian firms. Observed results for Nigerian firms suggest that there are significant constraints that restrict Nigerian firms from taking full advantage of their size for leverage. RECOMMENDATIONS This study generally provided a number of insights which could form the basis of further research on Nigerian firms.
1) Sourcing for other data base where more information could be extracted to increase sample size of observable firms will make results findings more accurate for generalization.
2) Carrying out a market leverage analysis to make comparison with book leverage will be useful in testing the robustness of observed results. Also using different proxies for size can be adopted i.e. analysing size using logarithm of sales and logarithm of total assets as a size proxy and the use of Tobin Q ratio to measure industry effect.
International Journal of Academic Research in Business and Social Sciences July 2014, Vol. 4, No. 7
ISSN: 2222-6990
200 www.hrmars.com
3) It will be useful to investigate correlation between observed dependent and independent variables by conducting studies based on interviews, questionnaire surveys and case studies.
4) Further research is required in developing new hypothesis for financing choice of listed Nigerian firms and designing new variables to capture institutional influence.
5) The use of alternative methodology should be adopted i.e. panel data technique to take into account time variance observed in the result.
REFERENCES ADEDEJI, A., (1998). Does the pecking order hypothesis explain the dividend payout ratios of firms in the UK. Journal of Business Finance and Accounting. Vol. 25, pp. 1127-157. AL-DOHAIMAN, M.S., (2008). Capital structure in Saudi Arabian listed and unlisted companies. [online]. PhD thesis, University of Wisconsin. Available from: https://dspace.stir.ac.uk/dspace/handle/1893/350 [Accessed 23rd February, 2014]. ALLEN, D., (1993). The pecking order hypothesis: Australian evidence. Applied Financial Economics Vol. 3, pp. 101-120. AL-SAKRAN, S., (2001). Leverage determinants in the absence of corporate tax system: the case of non-financial publicly traded corporation in Saudi Arabia. Managerial Finance, Vol. 27, pp. 58-86. Arrow, K. J. (1985). The economics of agency. In J. W. Pratt & R. J. Zeckhauser (Eds.), Principals and agents: The structure of business Boston: Harvard Business School Press pp. 37-51. BASKIN, J. (1989). An empirical investigation of the pecking order theory. Financial Management, Vol. 8, pp. 26-35. BEVAN, A. and DANBOLT, J., (2002). Capital structure and its determinants in the UK- a decompositional analysis. Applied Financial Economics Vol. 12, pp. 159-170. BOOTH, L., AIVAZIAN, V., DEMIRGUC-KUNT, A. and MAKSIMOVIC, V., (2001). Capital structures in developing countries. Journal of Finance, Vol. 56, Issue 1, pp. 87–130. DIAMOND, D.W., (1989). Reputation acquisition in debt markets. Journal of Political Economy, Vol. 97, pp. 828-862. ELKAMHI, R., PUNGALIYA, R.S. and VIJH, A.M., (2010). Do firms have a target leverage? evidence from credit markets. FAMA, E., (1980). Agency problems and theory of the firm. Journal of Political Economy, Vol. 88, Issue 2, pp. 288-307. FAMA, E., (1990). Contract costs and financing decisions. Journal of Business, Vol. 63(1), pp. 71-91. FAMA, E.F. and FRENCH, K.R., (2002). Testing trade-off and pecking order predictions about dividends and debt. Review of Financial Studies, Vol. 15, Issue 1, pp. 1-33. FAMA, E.F. and FRENCH, K.R., (2005). Financing decisions: who issues stock. Journal of Financial Economics, Vol. 76, Issue 3, pp.549-582. FAMA, E.F. and JENSEN, M., (1983). Agency problem and residual claims. Journal of Law and Economics, Vol. 26, pp. 327–349. FRANK, M. & GOYAL, V., (2003). Testing the Pecking Order Theory of Capital Structure. Journal of Financial Economics, Vol. 67, pp. 217-248.
International Journal of Academic Research in Business and Social Sciences July 2014, Vol. 4, No. 7
ISSN: 2222-6990
201 www.hrmars.com
GALAI, D. and MASULIS, R. (1976). The option pricing model and the risk factor of stock. Journal of Financial Economics, Vol. 3, pp. 631- 644. GILLAN, S. AND STARKS, L.T., (2003). Corporate Governance, Corporate Ownership, and the Role of Institutional Investors: A Global Perspective. Journal of Applied Finance, Vol. 13, No. 2, Fall/Winter 2003. Available at SSRN: http://ssrn.com/abstract=480983 GRAHAM, J. R. and HARVEY, C. R., (2001). The theory and practice of corporate finance: evidence from the field. Journal of Financial Economics, Vol. 60, Issue 2, pp. 187-243. GRAHAM, J. R., LEMMON, M. L., and SCHALLHEIM, J. S., (1998). Debt, leases, taxes, and the endogeneity of corporate tax status. Journal of Finance, Vol. 53, Issue 1, pp. 131-162. HUANG, G. and SONG, F. M., (2006). The determinants of capital structure: evidence from china. China Economic Review, Vol. 17, Issue 1, pp. 14-36. JENSEN, M. & MECKLING, W., (1976). The theory of the Firm: Managerial behaviour, agency costs, and ownership structure. Journal of Financial Economics, Vol. 3, Issue 4, pp. 305-360. JENSEN, M., (1986). Agency Cost Free Cash Flow, Corporate Finance, and Takeovers. American Economic Review, Vol. 76, Issue 2, pp. 323-329. JENSEN, M.C. and MECKLING, W.H., (1992). Specific and general knowledge, and organizational structure in L. Werin and H. Wijkander (eds.). Contract Economics, Massachusetts, Blackwell. KIM, W.G., (1997). The determinants of capital structure choice in the US restaurant industry. Tourism Economics, Vol. 3, Issue 4, pp. 329–340. MAYER, C., (1990). Financial systems, corporate finance and economic development, in R.G. Hubbard (ed.), Asymmetric Information, Corporate Finance and Investment, Chicago: University of Chicago Press, USA. MODIGLIANI, F. and MILLER, M., (1958). The cost of capital, corporate finance, and the theory of investment. American Economic Review, 48(4), pp. 261–297. MODIGLIANI, F. and MILLER, M.H., (1963). Corporate income taxes and the cost of capital: a correction. American Economic Review, Vol. 53, pp. 433–492. MYERS, S. C. (1984). The capital structure puzzle. Journal of Finance, Vol. 39, Issue 3, pp. 575-592. MYERS, S. C. and MAJLUF, N., (1984). Corporate financing decisions and investment decisions when firms have information that investors do not have. Journal of Financial Economics, Vol. 13, pp. 187-221. MYERS, S., (1997). Determinants of corporate borrowing. Journal of Financial Economics, Vol. 5, Issue 2, pp. 147–176. MYERS, S.C., (1977). Determinants of corporate borrowing. Journal of Financial Economics, Vol. 5, pp. 147- 175. Myers, S.C., (2001). Capital structure. Journal of Economic Perspectives, Vol. 15, Issue 2, pp. 81-102.
NGUGI, R.W. (2008). Capital financing behaviour: evidence from firms listed on the Nairobi Stock Exchange. The European Journal of Finance, Vol. 14, Issue 7, pp. 609 – 624. NIGERIA STOCK EXCHANGE WEBSITE, 2014. [online]. Available from: http://www.nigerianstockexchange.com/the_exchange.htm. [Accessed 28 March 2014].
International Journal of Academic Research in Business and Social Sciences July 2014, Vol. 4, No. 7
ISSN: 2222-6990
202 www.hrmars.com
PANDEY, M., (2001). Capital structure and the firm characteristics: evidence from an emerging market, working paper, Indian Institute of Management Ahmedabad. RAJAN, R., and ZINGALES, L., (1995). What do know about capital structure? some evidence from international data. The Journal of Finance Vol. 50. pp. 1421-1460. ROSS, S.A., (1973). The economic theory of agency: the principal’s problem. American Economic Review, Vol. 63, Issue 2, pp. 134-139. SCOTT, J., (1977). Bankruptcy, secured debt and optimal capital structure. Journal of Finance, Vol. 32, pp. 1-19. SHAVELL, S., (1979). Risk Sharing and Incentives in the Principal and Agent Relationship. The Bell Journal of Economics Vol. 10, pp. 55-73. SHEEL, A., (1994). Determinants of capital structure choice and empirics on leverage behavior: a comparative analysis of hotel and manufacturing firms. Hospitality Research Journal, Vol. 17, Issue 3, pp. 3–16. SMITH, C. and WARMER, J. (1979). On financing contracting: an analysis of bond covenants. Journal of Financial Economics, 7, pp. 117-161. TITMAN, S. and WESSELS, R., (1988). The determinants of capital structure choice. Journal of finance Vol. 43, pp.1-19. WALD, J., (1999). How firm characteristics affect capital structure: an international comparison. Journal of Financial Research, Vol. 22, pp. 161–187. ZURIGAT, Z., (2009). Pecking order theory, trade-off theory and determinants of capital structure: empirical evidence from Jordan. [online]. PhD thesis, Heriot-Watt University. Available from: http://www.ros.hw.ac.uk/bitstream/10399/2244/1/ZurigatZ_0309_sml.pdf [Accessed 28th February 2014].