44
ASSESSING THE MACROECONOMIC IMPACT OF STRUCTURAL REFORMS IN ITALY: THE NRP APPROACH Barbara Annicchiarico, Fabio Di Dio, Francesco Felici 24 January 2014 – Bruxelles, LIME Meeting

ASSESSING THE MACROECONOMIC IMPACT OF STRUCTURAL REFORMS IN ITALY: THE NRP APPROACH
Barbara Annicchiarico, Fabio Di Dio, Francesco Felici
24 January 2014 – Bruxelles, LIME Meeting

Motivation: Importance of Quantifying the Impact ofStructural Reforms
I An intensive reform agenda requires economic policyinstitutions to quantify the possible effects of single policyinterventions and of complex reform scenarios
I in April EU MS submit their plans for reforms towards smart,sustainable and inclusive growth (National ReformProgrammes); quantitative assessment of the effects throughmodels is explicitly required by the Commission
I all year long to assess the effects of reform proposalsI understanding the potential impact of structural reformsnecessary for an optimal implementation of reforms themselves

Macro Impact of Structural Reforms: A Model-BasedApproach
I The DGE modeling approach to economic policy modeling v.the macroeconometric approach (models used in conjunction)
I Rigidities, frictions, imperfect competition, extra costs(ineffi ciencies, i.e. room for improvement through reforms)
I Ad hoc models designed to capture specific features of theeconomy under study
I Examples: GEM - Global Economy Model (Bayoumi et al.2004, Everaert, and Schule 2008); EAGLE - Euro Area andGlobal Economy (Gomes et al. 2013); IdEA - Italian and Euroarea Economy Model (Forni et al. 2010 ); QUEST III (Roegeret al. 2009); GIMF - Global Integrated Monetary and Fiscalmodel (e.g. Lusinyan and Muir 2013); NAWM - NewArea-Wide Model (Coenen et al. 2008)
Tools of Analysis
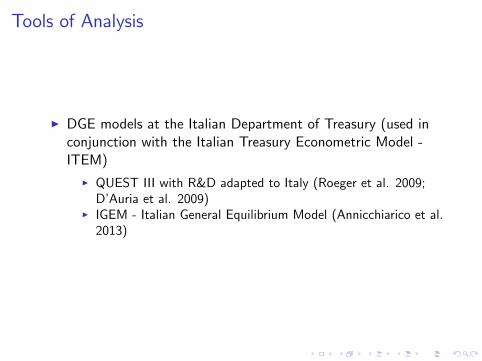
I DGE models at the Italian Department of Treasury (used inconjunction with the Italian Treasury Econometric Model -ITEM)
I QUEST III with R&D adapted to Italy (Roeger et al. 2009;D’Auria et al. 2009)
I IGEM - Italian General Equilibrium Model (Annicchiarico et al.2013)

Tools of AnalysisQUEST III with R&D - Italy
I This model embodies endogenous growth in the spirit ofRomer (1990) and Jones (1995, 2005)
I Suitable to study the impact of structural reforms accordingto Europe 2020 strategy:
I R&D sector =⇒ smart growthI imperfectly competitive product markets, entry andadministrative burden costs =⇒ internal market
I imperfectly competitive labour markets, benefit replacementrates, labour taxes =⇒ inclusive growth
Tools of AnalysisQUEST III with R&D - Italy
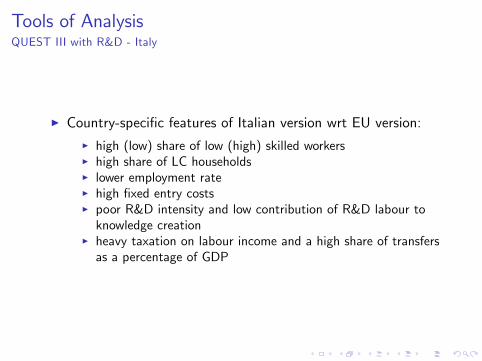
I Country-specific features of Italian version wrt EU version:I high (low) share of low (high) skilled workersI high share of LC householdsI lower employment rateI high fixed entry costsI poor R&D intensity and low contribution of R&D labour toknowledge creation
I heavy taxation on labour income and a high share of transfersas a percentage of GDP

Tools of AnalysisIGEM
I Why a new model at the Department of Treasury?I Ad hoc model designed to capture specific features of theItalian economy
I Many fiscal instruments and modular approachI This version focuses on the dualism of the Italian labourmarket
I The resulting model as a compromise between theoreticalconsistency and the needs of the Department of Treasury
Tools of AnalysisIGEM - Labour Market Structure
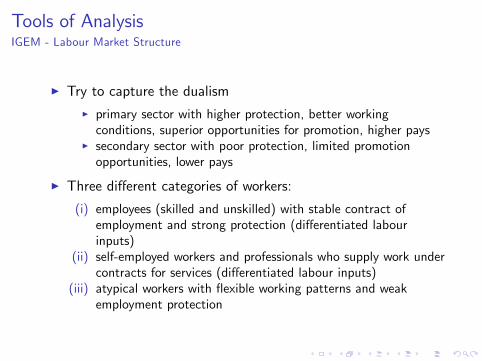
I Try to capture the dualismI primary sector with higher protection, better workingconditions, superior opportunities for promotion, higher pays
I secondary sector with poor protection, limited promotionopportunities, lower pays
I Three different categories of workers:
(i) employees (skilled and unskilled) with stable contract ofemployment and strong protection (differentiated labourinputs)
(ii) self-employed workers and professionals who supply work undercontracts for services (differentiated labour inputs)
(iii) atypical workers with flexible working patterns and weakemployment protection
Tools of AnalysisIGEM - Labour Market Structure
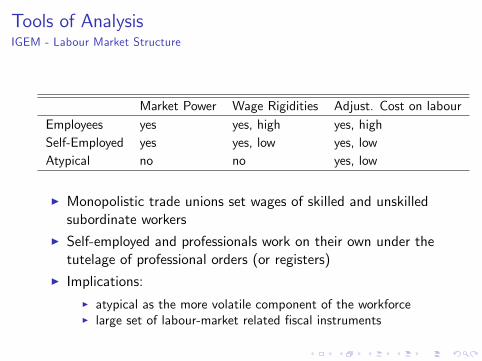
Market Power Wage Rigidities Adjust. Cost on labourEmployees yes yes, high yes, highSelf-Employed yes yes, low yes, lowAtypical no no yes, low
I Monopolistic trade unions set wages of skilled and unskilledsubordinate workers
I Self-employed and professionals work on their own under thetutelage of professional orders (or registers)
I Implications:I atypical as the more volatile component of the workforceI large set of labour-market related fiscal instruments
Tools of AnalysisIGEM - Households
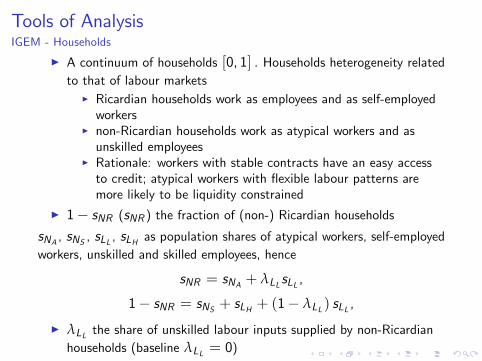
I A continuum of households [0, 1] . Households heterogeneity relatedto that of labour markets
I Ricardian households work as employees and as self-employedworkers
I non-Ricardian households work as atypical workers and asunskilled employees
I Rationale: workers with stable contracts have an easy accessto credit; atypical workers with flexible labour patterns aremore likely to be liquidity constrained
I 1− sNR (sNR ) the fraction of (non-) Ricardian householdssNA , sNS , sLL , sLH as population shares of atypical workers, self-employedworkers, unskilled and skilled employees, hence
sNR = sNA + λLLsLL ,
1− sNR = sNS + sLH + (1− λLL ) sLL ,
I λLL the share of unskilled labour inputs supplied by non-Ricardianhouseholds (baseline λLL = 0)

Structural Reforms and Model-Based EvaluationProblems
I Model-based evaluation of structural reforms presents aninput assessment problem
I Mapping of policy interventions is not (always) obvious andtheory and/or judgement are needed
I Five-step procedure:
1. Model choice (tool problem)2. Map indicators onto the model (mapping problem)3. Need a quantitative indicator of each reform effort (sizeproblem)
4. Timing of implementation (timing problem)5. Simulate the model (computational problem)
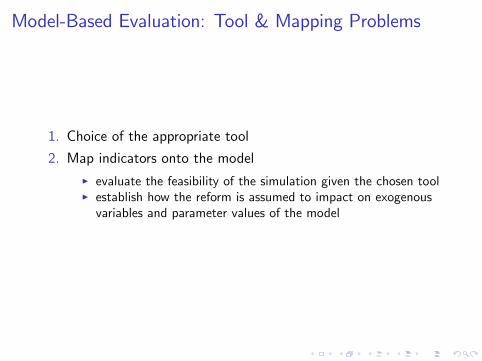
Model-Based Evaluation: Tool & Mapping Problems
1. Choice of the appropriate tool
2. Map indicators onto the modelI evaluate the feasibility of the simulation given the chosen toolI establish how the reform is assumed to impact on exogenousvariables and parameter values of the model
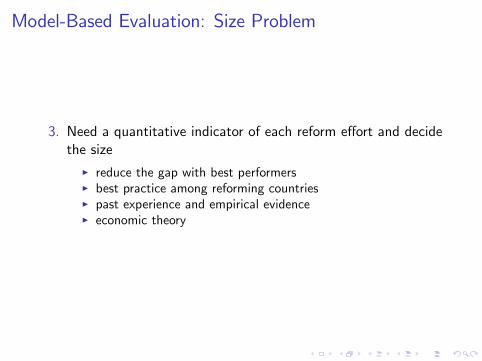
Model-Based Evaluation: Size Problem
3. Need a quantitative indicator of each reform effort and decidethe size
I reduce the gap with best performersI best practice among reforming countriesI past experience and empirical evidenceI economic theory
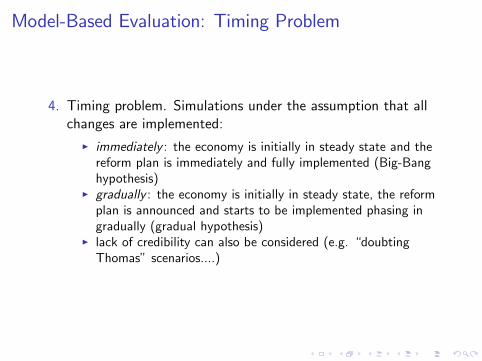
Model-Based Evaluation: Timing Problem
4. Timing problem. Simulations under the assumption that allchanges are implemented:
I immediately : the economy is initially in steady state and thereform plan is immediately and fully implemented (Big-Banghypothesis)
I gradually : the economy is initially in steady state, the reformplan is announced and starts to be implemented phasing ingradually (gradual hypothesis)
I lack of credibility can also be considered (e.g. “doubtingThomas” scenarios....)
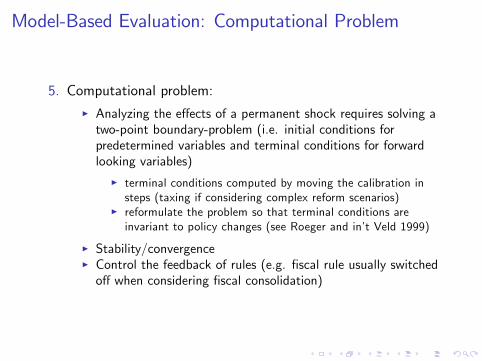
Model-Based Evaluation: Computational Problem
5. Computational problem:I Analyzing the effects of a permanent shock requires solving atwo-point boundary-problem (i.e. initial conditions forpredetermined variables and terminal conditions for forwardlooking variables)
I terminal conditions computed by moving the calibration insteps (taxing if considering complex reform scenarios)
I reformulate the problem so that terminal conditions areinvariant to policy changes (see Roeger and in’t Veld 1999)
I Stability/convergenceI Control the feedback of rules (e.g. fiscal rule usually switchedoff when considering fiscal consolidation)
Reform Scenarios in the NRP 2012
I Quantifying the impact of product market reforms aimed atI improving competition in product markets - liberalization (Law27/2012)
I improving the effi ciency of PA services and reduction ofadministrative burden - simplification (Law 35/2012)
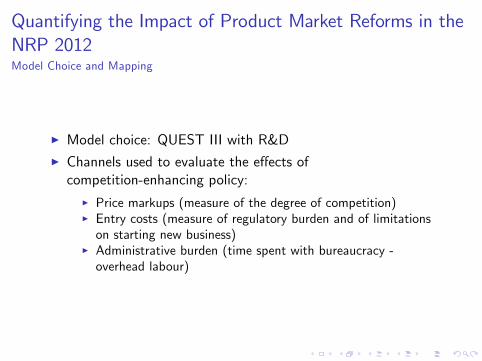
Quantifying the Impact of Product Market Reforms in theNRP 2012Model Choice and Mapping
I Model choice: QUEST III with R&DI Channels used to evaluate the effects ofcompetition-enhancing policy:
I Price markups (measure of the degree of competition)I Entry costs (measure of regulatory burden and of limitationson starting new business)
I Administrative burden (time spent with bureaucracy -overhead labour)
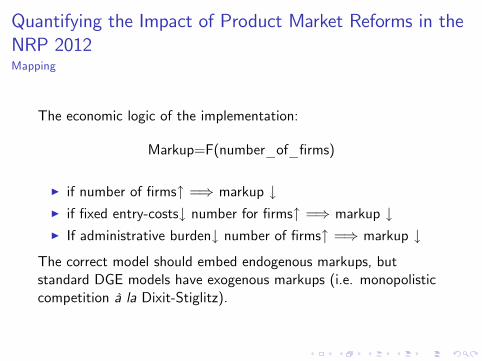
Quantifying the Impact of Product Market Reforms in theNRP 2012Mapping
The economic logic of the implementation:
Markup=F(number_of_firms)
I if number of firms↑ =⇒ markup ↓I if fixed entry-costs↓ number for firms↑ =⇒ markup ↓I If administrative burden↓ number of firms↑ =⇒ markup ↓
The correct model should embed endogenous markups, butstandard DGE models have exogenous markups (i.e. monopolisticcompetition à la Dixit-Stiglitz).

Quantifying the Impact of Product Market Reforms in theNRP 2012Mapping
I Need a quantitative indicator of each reform effort and decidethe size
I Adopted strategy:I Set exogenously the changes in the fixed costsI Set exogenously the changes in the overhead labour(administrative burden indicator)
I Link the changes of the price markup to the changes in thefixed costs and in the overhead labour.
I Two problems remain:I What the size of each exogenously set changes?I How to relate the changes in the markup to changes in theoverhead labour and in the fixed costs?
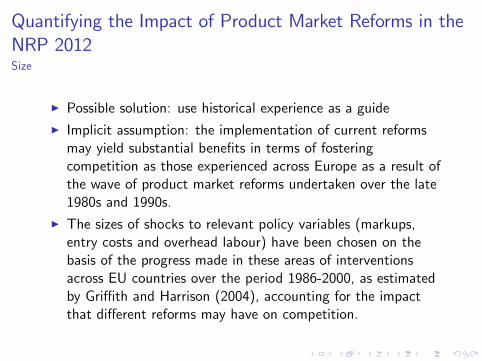
Quantifying the Impact of Product Market Reforms in theNRP 2012Size
I Possible solution: use historical experience as a guideI Implicit assumption: the implementation of current reformsmay yield substantial benefits in terms of fosteringcompetition as those experienced across Europe as a result ofthe wave of product market reforms undertaken over the late1980s and 1990s.
I The sizes of shocks to relevant policy variables (markups,entry costs and overhead labour) have been chosen on thebasis of the progress made in these areas of interventionsacross EU countries over the period 1986-2000, as estimatedby Griffi th and Harrison (2004), accounting for the impactthat different reforms may have on competition.
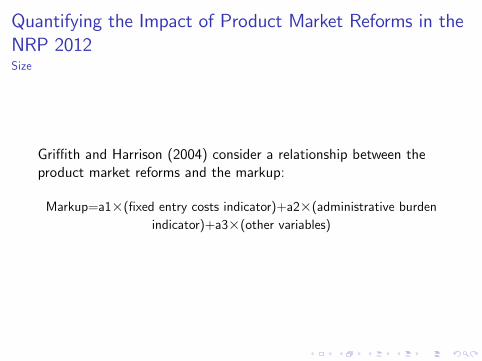
Quantifying the Impact of Product Market Reforms in theNRP 2012Size
Griffi th and Harrison (2004) consider a relationship between theproduct market reforms and the markup:
Markup=a1×(fixed entry costs indicator)+a2×(administrative burdenindicator)+a3×(other variables)
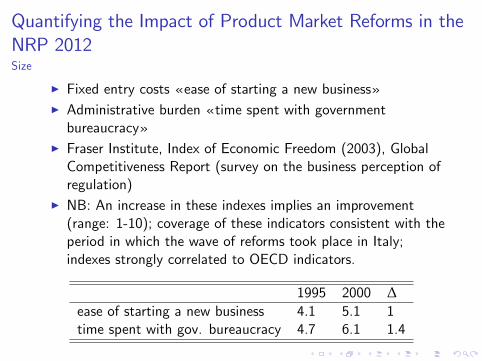
Quantifying the Impact of Product Market Reforms in theNRP 2012Size
I Fixed entry costs « ease of starting a new business»I Administrative burden « time spent with governmentbureaucracy»
I Fraser Institute, Index of Economic Freedom (2003), GlobalCompetitiveness Report (survey on the business perception ofregulation)
I NB: An increase in these indexes implies an improvement(range: 1-10); coverage of these indicators consistent with theperiod in which the wave of reforms took place in Italy;indexes strongly correlated to OECD indicators.
1995 2000 ∆ease of starting a new business 4.1 5.1 1time spent with gov. bureaucracy 4.7 6.1 1.4
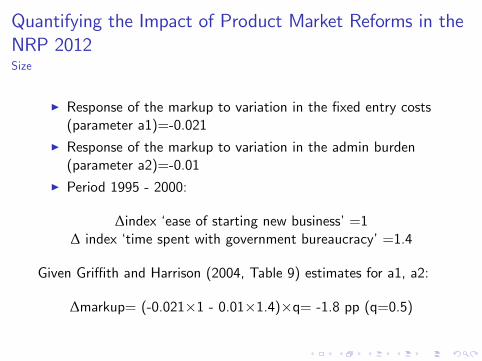
Quantifying the Impact of Product Market Reforms in theNRP 2012Size
I Response of the markup to variation in the fixed entry costs(parameter a1)=-0.021
I Response of the markup to variation in the admin burden(parameter a2)=-0.01
I Period 1995 - 2000:
∆index ‘ease of starting new business’=1∆ index ‘time spent with government bureaucracy’=1.4
Given Griffi th and Harrison (2004, Table 9) estimates for a1, a2:
∆markup= (-0.021×1 - 0.01×1.4)×q= -1.8 pp (q=0.5)
Quantifying the Impact of Product Market Reforms in theNRP 2012Size
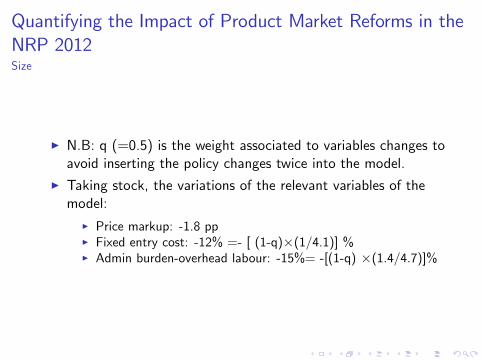
I N.B: q (=0.5) is the weight associated to variables changes toavoid inserting the policy changes twice into the model.
I Taking stock, the variations of the relevant variables of themodel:
I Price markup: -1.8 ppI Fixed entry cost: -12% =- [ (1-q)×(1/4.1)] %I Admin burden-overhead labour: -15%= -[(1-q) ×(1.4/4.7)]%
Quantifying the Impact of Product Market Reforms in theNRP 2012Timing
I Fully credible policy reform planI Degree of gradualism: 10 yearsI Starting from 2012
Quantifying the Impact of Product Market Reforms in theNRP 2012Results
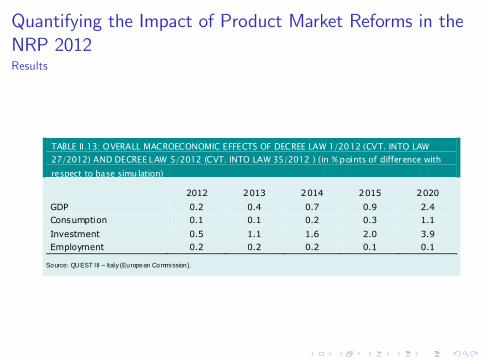
TABLE II.13: OVERALL MACROECONOMIC EFFECTS OF DECREE LAW 1/2012 (CVT. INTO LAW27/2012) AND DECREE LAW 5/2012 (CVT. INTO LAW 35/2012 ) (in % points of difference withrespect to base simulation)
2012 2013 2014 2015 2020
GDP 0.2 0.4 0.7 0.9 2.4Consumption 0.1 0.1 0.2 0.3 1.1
Investment 0.5 1.1 1.6 2.0 3.9Employment 0.2 0.2 0.2 0.1 0.1
Source: QUEST III –Italy (European Commission).
Quantifying the Impact of Product Market Reforms in theNRP 2012Results
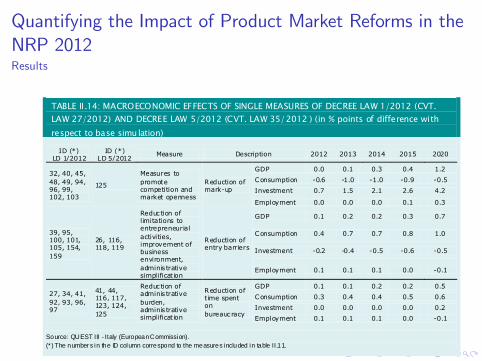
TABLE II.14: MACROECONOMIC EFFECTS OF SINGLE MEASURES OF DECREE LAW 1/2012 (CVT.LAW 27/2012) AND DECREE LAW 5/2012 (CVT. LAW 35/2012 ) (in % points of difference withrespect to base simulation)
ID (*)LD 1/2012
ID (*)LD 5/2012
Measure Description 2012 2013 2014 2015 2020
32, 40, 45,48, 49, 94,96, 99,102, 103
125
Measures topromotecompetition andmarket openness
Reduction ofmarkup
GDP 0.0 0.1 0.3 0.4 1.2
Consumption 0.6 1.0 1.0 0.9 0.5
Investment 0.7 1.5 2.1 2.6 4.2
Employment 0.0 0.0 0.0 0.1 0.3
39, 95,100, 101,105, 154,159
26, 116,118, 119
Reduction oflimitations toentrepreneurialactivities,improvement ofbusinessenvironment,adminis trativesimplification
Reduction ofentry barriers
GDP 0.1 0.2 0.2 0.3 0.7
Consumption 0.4 0.7 0.7 0.8 1.0
Investment 0.2 0.4 0.5 0.6 0.5
Employment 0.1 0.1 0.1 0.0 0.1
27, 34, 41,92, 93, 96,97
41, 44,116, 117,123, 124,125
Reduction ofadminis trativeburden,adminis trativesimplification
Reduction oftime spentonbureaucracy
GDP 0.1 0.1 0.2 0.2 0.5
Consumption 0.3 0.4 0.4 0.5 0.6
Investment 0.0 0.0 0.0 0.0 0.2
Employment 0.1 0.1 0.1 0.0 0.1
Source: QUEST III Italy (EuropeanCommission).(* ) The number s in the ID column correspond to the measures included in table II.11.
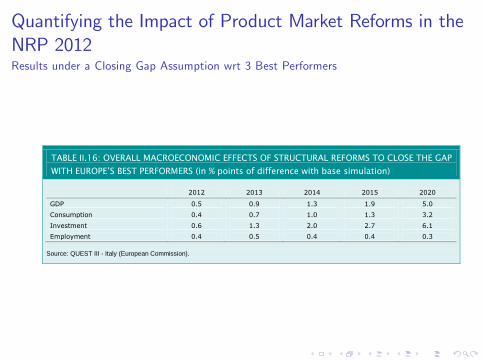
Quantifying the Impact of Product Market Reforms in theNRP 2012Results under a Closing Gap Assumption wrt 3 Best Performers
TABLE II.16: OVERALL MACROECONOMIC EFFECTS OF STRUCTURAL REFORMS TO CLOSE THE GAPWITH EUROPE’S BEST PERFORMERS (in % points of difference with base simulation)
2012 2013 2014 2015 2020
GDP 0.5 0.9 1.3 1.9 5.0
Consumption 0.4 0.7 1.0 1.3 3.2
Investment 0.6 1.3 2.0 2.7 6.1
Employment 0.4 0.5 0.4 0.4 0.3
Source: QUEST III Italy (European Commission).
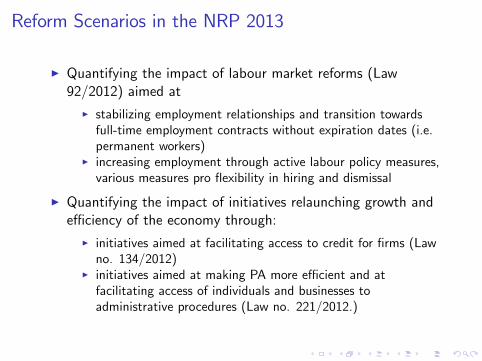
Reform Scenarios in the NRP 2013
I Quantifying the impact of labour market reforms (Law92/2012) aimed at
I stabilizing employment relationships and transition towardsfull-time employment contracts without expiration dates (i.e.permanent workers)
I increasing employment through active labour policy measures,various measures pro flexibility in hiring and dismissal
I Quantifying the impact of initiatives relaunching growth andeffi ciency of the economy through:
I initiatives aimed at facilitating access to credit for firms (Lawno. 134/2012)
I initiatives aimed at making PA more effi cient and atfacilitating access of individuals and businesses toadministrative procedures (Law no. 221/2012.)
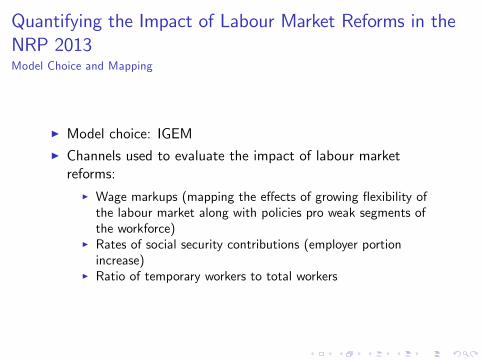
Quantifying the Impact of Labour Market Reforms in theNRP 2013Model Choice and Mapping
I Model choice: IGEMI Channels used to evaluate the impact of labour marketreforms:
I Wage markups (mapping the effects of growing flexibility ofthe labour market along with policies pro weak segments ofthe workforce)
I Rates of social security contributions (employer portionincrease)
I Ratio of temporary workers to total workers
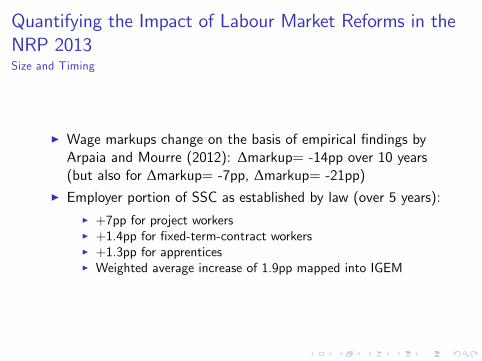
Quantifying the Impact of Labour Market Reforms in theNRP 2013Size and Timing
I Wage markups change on the basis of empirical findings byArpaia and Mourre (2012): ∆markup= -14pp over 10 years(but also for ∆markup= -7pp, ∆markup= -21pp)
I Employer portion of SSC as established by law (over 5 years):I +7pp for project workersI +1.4pp for fixed-term-contract workersI +1.3pp for apprenticesI Weighted average increase of 1.9pp mapped into IGEM
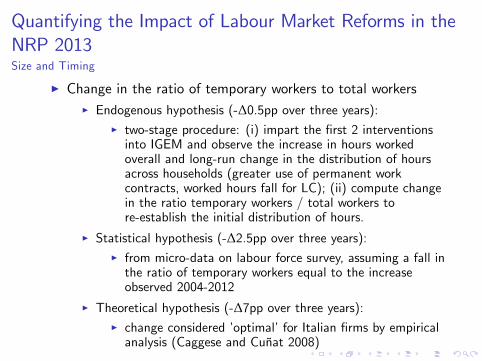
Quantifying the Impact of Labour Market Reforms in theNRP 2013Size and Timing
I Change in the ratio of temporary workers to total workersI Endogenous hypothesis (-∆0.5pp over three years):
I two-stage procedure: (i) impart the first 2 interventionsinto IGEM and observe the increase in hours workedoverall and long-run change in the distribution of hoursacross households (greater use of permanent workcontracts, worked hours fall for LC); (ii) compute changein the ratio temporary workers / total workers tore-establish the initial distribution of hours.
I Statistical hypothesis (-∆2.5pp over three years):I from micro-data on labour force survey, assuming a fall inthe ratio of temporary workers equal to the increaseobserved 2004-2012
I Theoretical hypothesis (-∆7pp over three years):I change considered ’optimal’for Italian firms by empiricalanalysis (Caggese and Cuñat 2008)
Quantifying the Impact of Labour Market Reforms in theNRP 20135 Scenarios
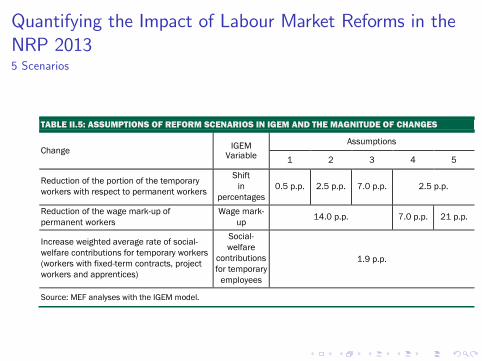
TABLE II.5: ASSUMPTIONS OF REFORM SCENARIOS IN IGEM AND THE MAGNITUDE OF CHANGES
Change IGEMVariable
Assumptions
1 2 3 4 5
Reduction of the portion of the temporaryworkers with respect to permanent workers
Shiftin
percentages0.5 p.p. 2.5 p.p. 7.0 p.p. 2.5 p.p.
Reduction of the wage markup ofpermanent workers
Wage markup 14.0 p.p. 7.0 p.p. 21 p.p.
Increase weighted average rate of socialwelfare contributions for temporary workers(workers with fixedterm contracts, projectworkers and apprentices)
Socialwelfare
contributionsfor temporary
employees
1.9 p.p.
Source: MEF analyses with the IGEM model.
Quantifying the Impact of Labour Market Reforms in theNRP 2013Results
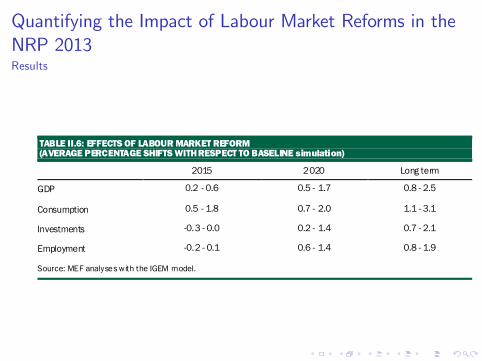
TABLE II.6: EFFECTS OF LABOUR MARKET REFORM(AVERAGE PERCENTAGE SHIFTS WITH RESPECT TO BASELINE simulation)
2015 2020 Long term
GDP 0.2 0.6 0.5 1.7 0.8 2.5
Consumption 0.5 1.8 0.7 2.0 1.1 3.1
Investments 0.3 0.0 0.2 1.4 0.7 2.1
Employment 0.2 0.1 0.6 1.4 0.8 1.9
Source: MEF analyses with the IGEM model.
Quantifying the Impact of Initiatives Relaunching Growthand Effi ciency in the NRP 2013Model Choice and Mapping
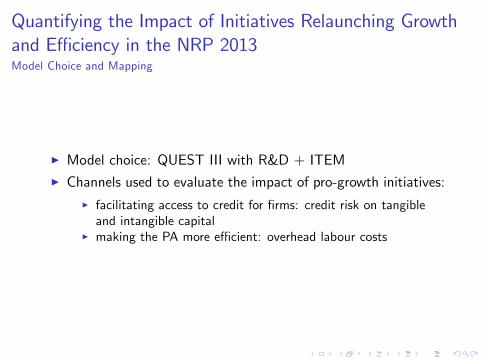
I Model choice: QUEST III with R&D + ITEMI Channels used to evaluate the impact of pro-growth initiatives:
I facilitating access to credit for firms: credit risk on tangibleand intangible capital
I making the PA more effi cient: overhead labour costs
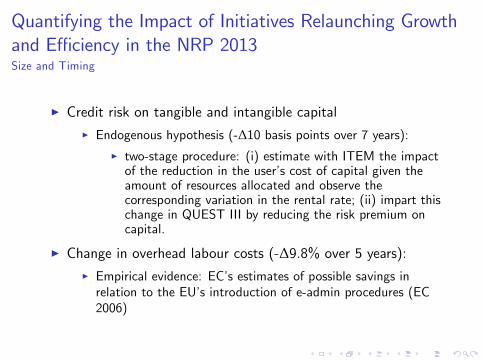
Quantifying the Impact of Initiatives Relaunching Growthand Effi ciency in the NRP 2013Size and Timing
I Credit risk on tangible and intangible capitalI Endogenous hypothesis (-∆10 basis points over 7 years):
I two-stage procedure: (i) estimate with ITEM the impactof the reduction in the user’s cost of capital given theamount of resources allocated and observe thecorresponding variation in the rental rate; (ii) impart thischange in QUEST III by reducing the risk premium oncapital.
I Change in overhead labour costs (-∆9.8% over 5 years):I Empirical evidence: EC’s estimates of possible savings inrelation to the EU’s introduction of e-admin procedures (EC2006)
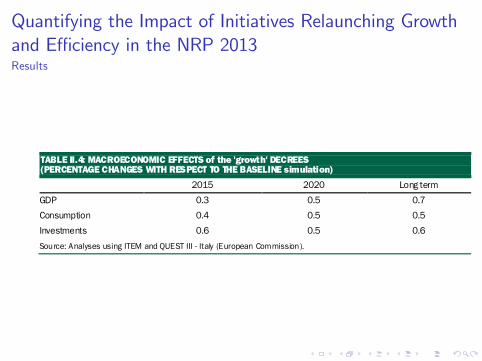
Quantifying the Impact of Initiatives Relaunching Growthand Effi ciency in the NRP 2013Results
TABLE II.4: MACROECONOMIC EFFECTS of the 'growth' DECREES(PERCENTAGE CHANGES WITH RESPECT TO THE BASELINE simulation)
2015 2020 Long termGDP 0.3 0.5 0.7Consumption 0.4 0.5 0.5Investments 0.6 0.5 0.6Source: Analyses using ITEM and QUEST III Italy (European Commission).
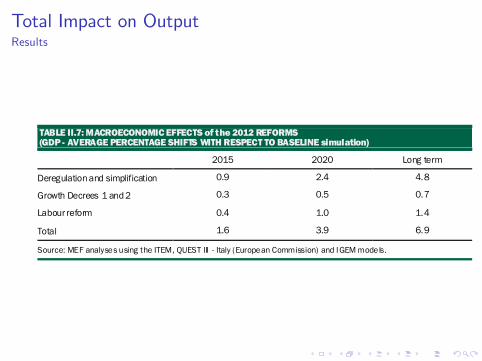
Total Impact on OutputResults
TABLE II.7: MACROECONOMIC EFFECTS of the 2012 REFORMS(GDP AVERAGE PERCENTAGE SHIFTS WITH RESPECT TO BASELINE simulation)
2015 2020 Long term
Deregulation and simplification 0.9 2.4 4.8
Growth Decrees 1 and 2 0.3 0.5 0.7
Labour reform 0.4 1.0 1.4
Total 1.6 3.9 6.9
Source: MEF analyses using the ITEM, QUEST III Italy (European Commission) and IGEM models.
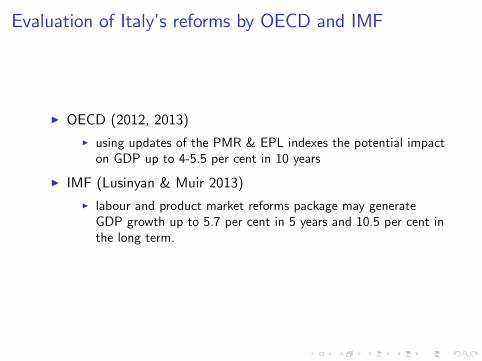
Evaluation of Italy’s reforms by OECD and IMF
I OECD (2012, 2013)I using updates of the PMR & EPL indexes the potential impacton GDP up to 4-5.5 per cent in 10 years
I IMF (Lusinyan & Muir 2013)I labour and product market reforms package may generateGDP growth up to 5.7 per cent in 5 years and 10.5 per cent inthe long term.

Caveats
I Quantifying the impact of structural reforms is an extremelydiffi cult and delicate exercise
I All results generated through models constrained by tighttheoretical assumptions
I Simulation results should be interpreted in the light of model’sstructure
Further Complications
I Time lags in reforms implementation, cross-country spilloversand complementarities, trade-offs between reforms in differentdomains
I Effects of short-term economic fluctuations make it diffi cultto disentangle the effects of reforms undertaken from othersdeterminants
I Credit crunch problems and fiscal consolidation measures mayhinder and/or delay the beneficial effects of reforms
I Credibility of reforms programmeI Political economy interactions (e.g. more competition inproduct markets generates support for labour marketderegulation)

References
I Annicchiarico, B., Di Dio, F., Felici, F., Monteforte, L., (2013a). IGEM:
A Dynamic General Equilibrium Model for Italy, Working Paper no. 4,
Department of the Treasury, Ministry of the Economy and of Finance.
I Arpaia and Mourre, 2012. ‘Institutions and Performance in European
Labour Markets: Taking a Fresh Look at Evidence’, Journal of Economic
Surveys, vol. 26(1), 1-41.
I Bayoumi T., Laxton D., & Pesenti P. (2004). Benefits and Spillovers of
Greater Competition in Europe: A Macroeconomic Assessment, ECB
Working Paper no. 341.
I Caggese-Cuñat, (2008). ‘Financing Constraints and Fixed-term
Employment Contracts‘Economic Journal, vol. 118(533), 2013-2046
I Coenen, G. & McAdam, P. & Straub, R., (2008). Tax reform and
labour-market performance in the euro area: A simulation-based analysis
using the New Area-Wide Model, Journal of Economic Dynamics and
Control, Elsevier, vol. 32(8), pages 2543-2583, August. Wiley Blackwell,
vol. 16(1), pages 23-44, 02.
References
I D’Auria, F., Pagano, A., Ratto, M., & Varga,J. (2009). A Comparison of
Structural Reform Scenarios across the EU Member States:
Simulation-Based Analysis Using the QUEST Model with Endogenous
Growth, European Economy —Economic Paper no. 392.
I European Commission, (2006),i2010 eGovernment Action Plan:
Accelerating eGovernment in Europe for the Benefit of All
(Communication from the Commission to the Council, the European
Parliament, the European Economic and Social Committee and the
Committee of the Region)’, COM(2006) 173 final.
I Everaert, L., & Schule W. (2006). Structural Reforms in the Euro Area:
Economic Impact and Role of Synchronization Across Markets and
Countries, IMF Working Paper no. 06/137.
I Forni, L., Gerali, A., & Pisani, M. (2010). Macroeconomic Effects Of
Greater Competition In The Service Sector: The Case Of Italy,
Macroeconomic Dynamics, 14(5), 677-708.

References
I Gomes, S., acquinot, P. Mohr , M. &Pisani, M., (2013). Structural
Reforms and Macroeconomic Performance in the Euro Area Countries: A
Model-Based Assessment, International Finance, 16(1), 23-44.
I Lusinyan, L., Muir, D. (2013). Assessing the Macroeconomic Impact of
Structural Reforms The Case of Italy. IMF Working Paper No. 13/22.
I OECD (2012).Better Policies Series — Italy —Reviving growth and
productivity.
I OECD (2013). Economic Survey of Italy 2013.
I Roeger, W., Varga, J., & in’t Veld, J. (2008). Structural Reforms in the
EU: A Simulation-Based Analysis Using the QUEST Model with
Endogenous Growth, European Economy —Economic Paper no. 351.
I Roeger, W., in’t Veld, J. (1999). The Sensitivity of Solutions to Terminal
Conditions: Simulating Permanent Shocks with QUEST II, in J. Hughes
Hallet & P. Mc Adam (Eds.), Analysis in Macroeconomic Modelling,
Boston/Dordrecht/London: Kluver Academic Publishers.


