Kidney International, Vol. 47 (1995), pp. 1187—1198
TECHNICAL NOTE
Assessing the peritoneal dialysis capacities of individual patientsBöRJE HARALDSSON
Departments of Nephrology and Physiology, University of Goteborg Gotebo, Sweden
Assessing the peritoneal dialysis capacities of individual patients. Amethod for measuring the peritoneal dialysis capacity (PDC) of theindividual patient has been developed as an aid to treatment of patientswith renal failure and peritoneal dialysis. The patient collects the data himor herself during an almost normal CAPD day using a carefully designedprotocol whereby the nursing time is kept to a minimum. The three-poremodel is used to describe the PDC with three physiological parameters:(1.) the 'Aiea' parameter (Ajx), which determines the diffusion of smallsolutes and the hydraulic conductance of the membrane (LS); (2.) thefinal reabsorption rate of fluid from the abdominal cavity to blood (JvAR)when the glucose gradient has dissipated; and (3.) the large pore fluid flux(of plasma, JvL), which determines the loss of protein to the PD fluid. Inthe adult PD population (age 60, N = 97) the normal 'Area' parameterwas 23,600 cm/1.73 m2, with an SEM of 650. The JVAR was 1.49 ml/min/1.73m2 and JvL was 0.078 ml/min/1.73 m2. The PDC parameters werereproducible and could adequately predict the concentrations of the testsQiutes as well as that of 132-microglobulin. The results in terms ofclearance, 'UF volume' and nutritional consequences were presented oneasily understandable graphs, whereby patient compliance was improved,These physiological parameters are highly dynamic, as evidenced by themarked increases observed during peritonitis. It seems safe to concludethat PDC is a useful tool to achieve adequate dialysis and to enhance theunderstanding of PD exchange.
Peritoneal dialysis (PD) is an increasingly popular life-support-ing therapy for patients with chronic renal failure. In contrast tothe membranes used in hemodialysis, the functional characteris-tics of the individual PD membrane are unknown. indeed, it wasrecognized early that there are large differences in solute and fluidexchange between individual patients treated with continuousambulatory peritoneal dialysis (CAPD) [1]. Moreover, the conse-quences of inadequate, or rather insufficient, dialysis appeargradually over a long period of time and include the reappearinguremic symptoms as well as increased morbidity and mortality.The effects appear in patients as the residual renal functiondeclines, a phenomenon often denoted "the end of the honey-moon period." Previously, infections were the major complica-tions of PD. However, the risk of peritonitis has been reduced inthe last few years and other problems such as underdialysis arenow evident. Against this background, it is not surprising thatthere is growing interest in methods of measuring PD exchangeand providing adequate dialysis.
In 1987, Twardowski et al introduced a simple peritonealequilibration test (PET) which greatly improved our knowledge of
Received for publication June 6, 1994and in revised form November 8, 1994Accepted for publication November 14, 1994
the individual patients and what dialysis treatment to use [2, 3}.Due to the variability of the PET, it has been suggested thatpredictions should be based on four to five exchanges [4]. In orderto reduce the variability, the patient can roll from side to side toachieve better mixing of PD fluid [2, 3]. It is evident, however, thatthis procedure creates an artificial situation different from theordinary CAPD day. The exchange is most probably affected byshaking, as has been seen in rats [5, 6], and the procedure hasbeen criticized [4]. There are also reports of exceptionally lowvariability of PET in selected patients [7]. No doubt, PET can beused to select patients more suitable for automated peritonealdialysis (APD, the so-called high transporters), or to ktentifr lowtransporters less suitable for PD Another, perhaps better, way toimprove PET is the APEX, where the APEX time is the pointwhere the concentrations of glucose (CD/CDO dialysate concen-tration at time t over initial dialysate concentration) and urea(CD/CP = dialysate over plasma concentration ratio) cross [8].Albeit attractive in their simplicity, the semiquantitative nature ofPET and APEX cannot give any details of the physiologicalproperties of the PD membrane. Moreover, whereas some au-thors find PET to be of clinical value [7, 9], others have reportedthat PET is incapable of predicting PD exchange [10]. Naturally,the latter objection is also valid for more sophisticated predictionsbased on PET data [11].
How much is adequate dialysis? This pertinent question is noteasily answered. There are guidelines that recommend a weeklyKt/V (= clearance multiplied with time over distribution volume)for urea of 1.7 and a weekly creatinine clearance of 50 liter/week[12] or 55 liter/week [13]. Indeed, clinical studies have suggestedthat weekly creatinine clearance, creatinine Kt/V or urea Kt/V areuseful to assess the effectiveness of PD in the individual patient[14, 151. Some authors have found statistical correlation to oneparameter only [16, 17]. On the other hand, there are studiessuggesting that there is a poor correlation between urea kineticindices and the clinical outcome in CAPD patients [18]. Onemajor problem is to design studies that fully take into account thecomorbid conditions since these may confound the analysis. Atpresent, it seems safe to conclude that there is a need for a goodnoninvasive technique to measure the transperitoneal passage offluid and solutes under normal PD conditions.
In a previous study, transport was simulated during PD using asmall computer to illustrate the importance of various factors inthe three-pore model [19]. In the present paper, the peritonealdialysis membrane characteristics (PDC) of individual patientswere assessed using a structured test protocol and a computerprogram to improve our understanding of PD and to ensureadequate dialysis.
1187
1188 Haraldsson: Individual PD capacity
Methods
Theoretical background of the three-pore model
Ernest Starling [20] studied the peritoneum one century agowhen he formulated the forces behind the transcapillary passageof fluid, and this so-called "Starling balance" seems to be univer-sal for all microvascular beds. Landis and Pappenheimer extendedour knowledge of the transcapillary exchange of fluid and solutesand introduced the pore concept using elegant, carefully designedstudies [21]. A second pore population (large pores or "leaks"with a radius of 25 nm) was postulated by Grotte [221 based onstudies on the lymph composition of dextran fractions withdifferent molecular weights. Moreover, Yudilevich and Alvarez[231 presented evidence for a third water-exclusive pathway in doghearts in 1967. Thus, the components of the modern "three-pore"theory were already known 25 years ago. More recently, Rippeand Haraldsson [24] showed that the transport of solutes andwater across heteroporous membranes could be expressed inexplicit terms using irreversible thermodynamics and nonlinearflux equations. indeed, almost all vascular beds seem to beheteroporous [25, 26]. In addition, proteins have been identifiedas water-exclusive channels in different cell membranes, forexample, CHIP 28 [27].
In a series of articles, Rippe and coworkers have introducedmodern theories of capillary physiology to the field of peritonealdialysis. The three-pore model of fluid and solute transport (or"two-pore" model of solute transport) across the peritonealmembrane has been documented in a series of articles [19,28—30]. According to this model, the PD membrane can beregarded as a (capillary) membrane with three equivalent (func-tional) pore populations. The small pore with a Stokes-Einsteinradius around 4.7 nm represents the major pathway for smallsolutes. Macromolecules are transported by convection through afew large pores, SE radius 25 nm. Finally, a third water-exclusivecell pathway is present through which almost 40% of the waterpasses during an average PD dwell with glucose as osmotic agent.The large pores account for 5% of the hydraulic conductance(L,S, or UF coefficient), the cell pores 1% of LS while more than90% of LS is due to the small pores. The apparent contradictionof the latter two sentences are due to the fact that glucose exerts100% of its osmotic force across the cell pore pathway and only afew percent across the small pore equivalent.
Patient selection
All patients treated with CAPD at the Department of Ncphrol-ogy, Sahlgrenska Hospital, Goteborg, Sweden from May 1991were invited to use the PDC test in order to ascertain adequacy ofdialysis and gain insight into the physiological properties of theirPD membrane. The test was done at home by the patient in themajority of cases. Apart from their renal insufficiency the patientswere healthy, except those patients who were included in theperitonitis group (see below). The study was approved by theethical committee of the University of Goteborg.
The protocol for PDC determinations
The test was designed to: (i) mimic the ordinary CAPD day, (ii)be performed by the patient with a minimum of nursing time; (iii)yield data from different dwell times and glucose strengths; and(iv) allow calculations of mass balance during a 24 hour period.
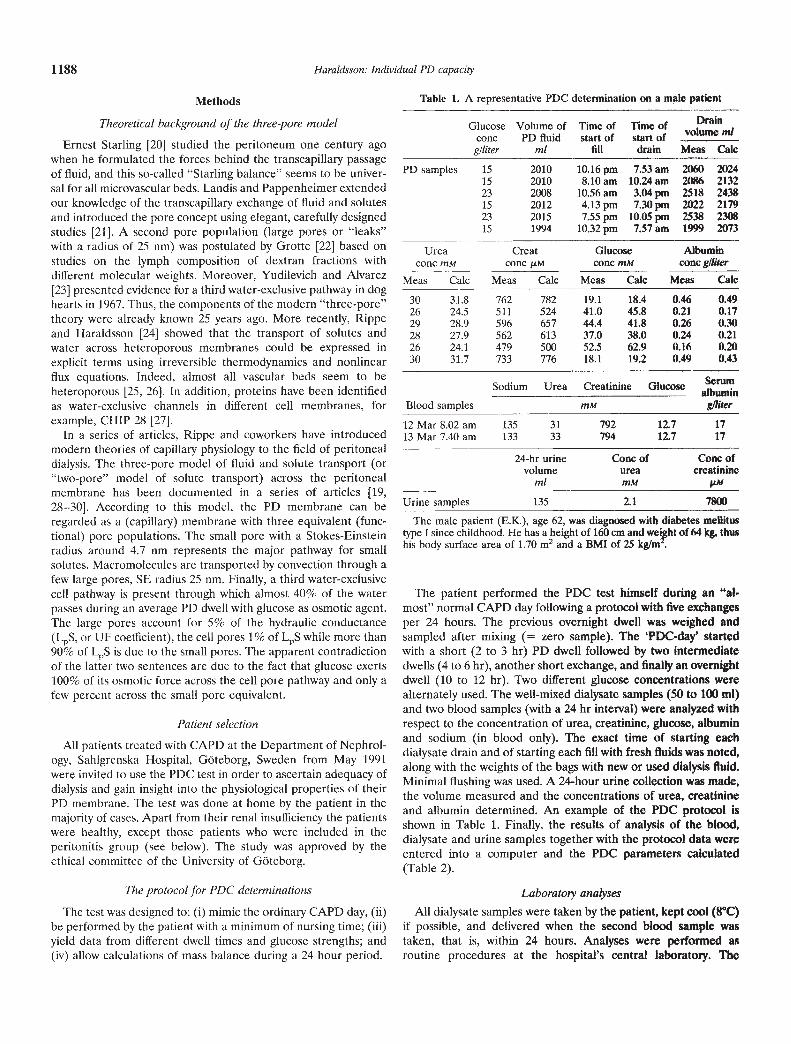
Table 1. A representative PDC determination on a male patient
Glucose Volume ofcone PD fluidgiliter ml
Time of Time of Drain
start of start of '0me mlfill drain Meas Cale
PD samples 15 2010 10.16 pm 7.53 am 2060 202415 2010 8.10 am 10.24 am 2086 213223 2008 10.56 am 3.04 pm 2518 243K15 2012 4.l3pm 7.3Opm 2022 217923 2015 7.55 pm 10.05 pm 2538 230815 1994 10.32 pm 7.57 am 1999 2073
Urea Creat Glucose Albumincone mM cone LM cone mM cone gluier
12 Mar 8.02 am 135 31 792 12.7 1713 Mar 7.40 am 133 33 794 12.7 17
24-hr urine Cone of Cone ofvolume urea creatinine
ml mM MUrine samples 135 2.1 7800
The male patient (E.K.), age 62, was diagnosed with diabetes mellitustype I since childhood. He has a height of 160cm and wepht of 64kg, thushis body surface area of 1.70 m2 and a BMI of 25 kg/rn
The patient performed the PDC test himself during an "al-most" normal CAPD day following a protocol with five exchangesper 24 hours. The previous overnight dwell was weighed andsampled after mixing (= zero sample). The 'PDC-day' startedwith a short (2 to 3 hr) PD dwell followed by two intermediatedwells (4 to 6 hr), another short exchange, and finally an overnightdwell (10 to 12 hr). Two different glucose concentrations werealternately used. The well-mixed dialysate samples (50 to 100 ml)and two blood samples (with a 24 hr interval) were analyzed withrespect to the concentration of urea, creatinine, glucose, albuminand sodium (in blood only). The exact time of starting eachdialysate drain and of starting each fill with fresh fluids was noted,along with the weights of the bags with new or used dialysis fluid.Minimal flushing was used. A 24-hour urine collection was made,the volume measured and the concentrations of urea, creatinineand albumin determined. An example of the PDC protocol isshown in Table 1. Finally, the results of analysis of the blood,dialysate and urine samples together with the protocol data wereentered into a computer and the PDC parameters calculated(Table 2).
Laboratory analyses
All dialysate samples were taken by the patient, kept cool (8°C)if possible, and delivered when the second blood sample wastaken, that is, within 24 hours. Analyses were performed asroutine procedures at the hospital's central laboratoiy The
concenttation of creatinine (Cr) was automatically corrected forthe amount of glucose in the samples
[rki.r = [Cr] — 0.35 [Glue]
where the factor (0.35) was dependent on the analytical procedureof the laboratory. The concentration of creatinine is in mol/1iterand glucose mmol/liter.
Calculations of the PDC parameters
The three PDC parameters are:(1.) The area parameter. The unrestricted pore area available for
exchange over the difihision distance (A0/x) defines the areaparameter. The magnitude of the area parameter is dependent onthe assumptions of the present three-pore model (Discussion).
(2.) The absoiption. The absorption is the final reabsorptionrate of fluid from the abdominal cavity to blood (JvAR). Theabsorption is rather independent of the theoretical model used,
since it reflects the last phase of the drain volume versus timecurve (for details see Appendix Eq. 16).
(3.) The large pore flow. The large pore flow is the flux of plasmathrough the large pores (JYL) and is a parameter unique to thethree-pore model. Only the larger plasma proteins are subjectedto any significant sieving across the large pores. does notinfluence the transport of small solutes or fluid. The JVL is quiteindependent of the assumptions in the model since it is given bythe actual 'loss' of plasma proteins (see Appendix Eq. 13 fordetails).
The three PDC parameters are obtained as the best fit betweentheory and experimental data using non-linear regression anditerative calculations of the three-pore equations of transcapillaryexchange analysis [31]. The diffusive capacity of any given solutecan be predicted based on its molecular size and the A0/.x, (Eq.6). The hydraulic conductance (LS) is calculated from A0/&, andthere is an uncoupling of LS from A0/z.x only if the calculated UFvolume deviates more than 10% from that measured, (Eq. 7). Thewater-exclusive (cell) pathway is assumed to have a constantfraction of LS (f = 1.0%), while the large pore fraction of LSis obtained from the PDC parameter JVL and Equation 13.Moreover, the small and large pore radii are assumed to beconstant (4.7 and 25 nm, respectively), assumptions that seemvalid [25, 321. In addition, the hydrostatic pressures in thecapillaries (Pcapjii = 15 mm Hg) and intraperitoneally (P1 = 6mmHg) are constant (Discussion).
The PD exchange is less effective during the phases of fluid filland drain due to the smaller i.p. volumes. This effect is accountedfor in the analysis by calculating the time of dialysis from the startof the fill to the start of drain. The residual intraperitoneal volumeis considered to be 250 ml for a patient weight of 70 kg, and scaledto the individual patient weight (Appendix). The changes of i.p.fluid volume and solute concentration with time are also shown inthe Appendix. These calculations are repeated for each solute, forevery second minute (for the first hour) then every tenth minuteduring the dwell time and for all exchanges during the day. Afteradjustment of the PDC parameters, the procedure is repeatedanother 3 to 10 times until the "best fit" between experimentaland calculated data is obtained. If the calculated UF volume isdifferent from the measured UF volume, there is uncoupling ofthe LS (= UF coefficient) from the area parameter (Eq. 7). The
Table 2. Results of the PDC calculations for the patient in Table 1
The uverage time of drain was 34 mm. Abbreviations are in theAppendix.
1190 Haraldsson: Individual PD capacily
calculation procedure takes approximately four seconds with anaverage 486DX processor.
PDC during peritonitis
A PDC test was performed on patients who were admitted intothe hospital for episodes of peritonitis. Measurements were madeduring one of the first two days, using the protocol given above.
Results
General
The PDC measurements were performed by 97 stable adulturemic patients treated with peritoneal dialysis, mainly CAPD.The average age was 60 1 years (range 20 to 85; Fig. 1). Allpatients were able to follow the protocol. The underlying diseaseof the uremic condition showed the panorama that is common ina dialysis population.
Accuracy of the PDC calculations
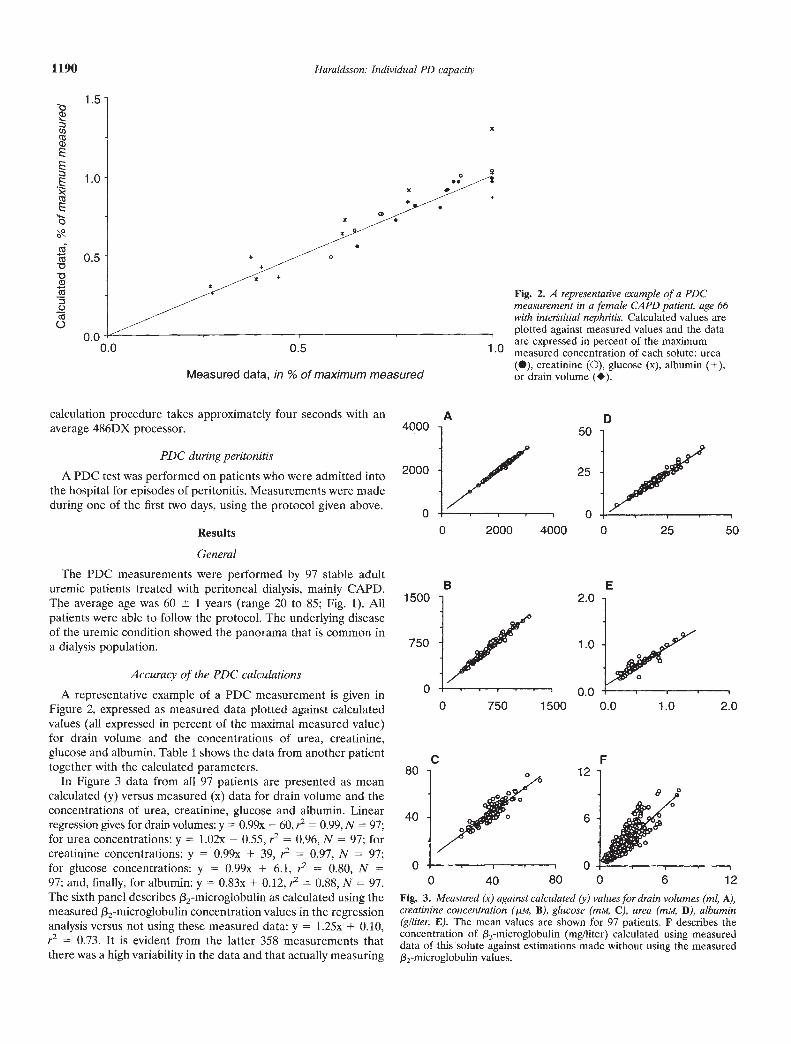
A representative example of a PDC measurement is given inFigure 2, expressed as measured data plotted against calculatedvalues (all expressed in percent of the maximal measured value)for drain volume and the concentrations of urea, creatinine,glucose and albumin. Table 1 shows the data from another patienttogether with the calculated parameters.
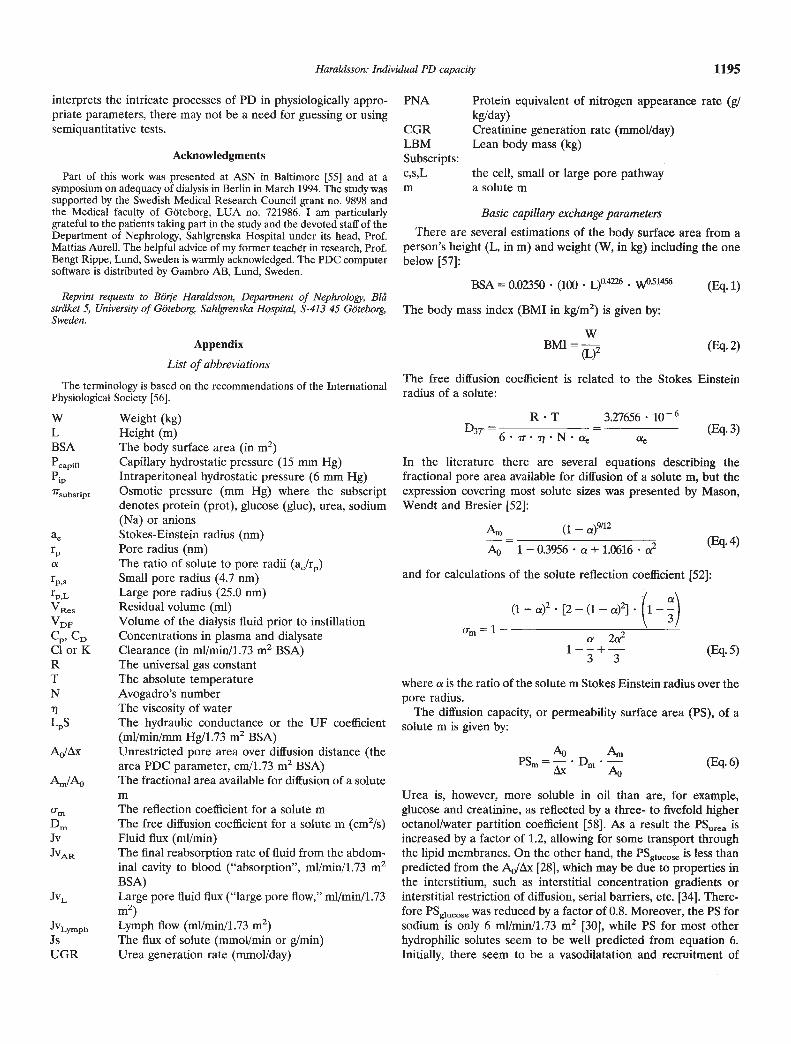
In Figure 3 data from all 97 patients are presented as meancalculated (y) versus measured (x) data for drain volume and theconcentrations of urea, creatinine, glucose and albumin. Linearregression gives for drain volumes: y = 0.99x — 60, r2 = 0.99,N = 97;for urea concentrations: y = 1.02x — 0.55, r = 0.96, N = 97; forcreatinine concentrations: y = 0.99x + 39, r = 0.97, N = 97;for glucose concentrations: y = 0.99x + 6.1, r2 0.80, N =97; and, finally, for albumin: y = 0.83x + 0.12, r2 = 0.88, N = 97.The sixth panel describes /32-microglobulin as calculated using themeasured f32-microglobulin concentration values in the regressionanalysis versus not using these measured data: y = 1.25x + 0.10,
= 0.73. It is evident from the latter 358 measurements thatthere was a high variability in the data and that actually measuring
80
40
0
Fig. 2. A representative esample of a PDCmeasurement in a female CAPD patient, age 66with interstitial nephritis. Calculated values areplotted against measured values and the dataare expressed in percent of the maximum
.U measured concentration of each solute: urea(S), creatinine (0), glucose (x), albumin (+),or drain volume (•).
Fig. 3. Measured (x) against calculated (y) values for drain volumes (ml, A),creatinine concentration (psi, B), glucose (mAt, C), urea (mM, D), albumin(giliter, E). The mean values are shown for 97 patients. F describes theconcentration of /32-microglobulin (mg/liter) calculated using measureddata of this solute against estimations made without using the measured132-microglobulin values.
q)EE:3E
E.4-.
V
00
1.5
1.0
0.5
0.0
x0
0.0 0.5
Measured data, in % of maximum measured
A D50
25
0 2000 40000
4000
2000
0
1500
750
0
C
B E2.0
1.0
0.0
0 25 50
0 750 1500 0.0 1.0 2.0
F
0 40 80 0 6 12
Haraldsson: Individual PD capacity 1191
20 304050Area, A0i2,,ix 1000 cm/i. 7 m2
Fig. 4. The unrestricted pore area over diffusion distance, A0Ix, in apopulation of 97 patients treated with peritoneal dialysis.
the f32-microglobulin concentration did not improve the analysisto any significant degree.
Distribution of the PDC parameters
(1.) The area parameter or the unrestricted pore area overdiffusion distance, A1)/zx, had a mean value of 23,590 cm/1.73 m2with an SEM of 653 (N = 97, range 8,012 to 47,475) and adistribution as shown in Figure 4. The highest A0/& (47,475cmIl.73 m2) was found in a patient with secondary amyloidosisdue to ankylosing spondilitis with no signs of peritonitis. He did,however, have active arthritis and two other measurements within18 months showed similar values (51,780 and 51,120). The lowestvalue was obtained in a man (age 42) with chronic glomerulone-phritis and no history of intraabdominal infections or previous PDepisodes; again, repeated measurements a few months later gavesimilar results (8,880 and 8,770).
The mean (23,600) 1 SD (6,400) data give an opportunity tocompare the area parameter to the PET nomenclature. Thus, apatient with a large area parameter (AcJLS.X >30,000) would bedenoted a 'high transporter' according to PET, 23,600 to 30,000would be 'high average', 17,200 to 23,600 would be 'low average',and a small Area parameter (A0/.x <17,200) would be a 'lowtransporter' (Table 3).
(2.) The final reabsorption rate of fluid from the abdominalcavity, JVAR, was 1.49 ml/min/1.73 m2 (SEM = +0.09, —0.08, N =
97), calculated as the geometric mean due to the skew distribution(Fig. 5). The range was 0.13 to 3.77 ml/min/1.73 m2. Note that thisrepresents the reabsorption rate when there is no crystalloidosmotic pressure difference at all across the peritoneal membrane,
(Eq. 16).(3.) The fluid flux through the large pores, JvL, was 0.078
ml/min/1.73 m2 with an SEM of + 0.005, —0.005, N = 97, calculatedas the geometric mean due to the skew distribution. The rangewas 0.008 to 0.284 mi/mm/i .73 m2. Figure 6 gives the distributionprofile for JVL.
Other calculated parameters
The calculated capillary hydrostatic pressure, P , was constantat 15 mm Hg in 89 patients. In 7 patients, the P was automaticallyelevated 5 to 17 mm Hg since the lymph flows must exceed zero.
Area % ofArea parameter, the normal
A(/&, cm values in theper 1.73 m2 adult population PET
> 30,000 > 127 High transport23,600 —30,000 100—127 High average transport17,200—23,600 73—100 Low average transport<17,200 <73 Low transport
The hydraulic conductance, LS, was strictly coupled to theA0/Ax in roughly one half of the patients. However, the LS couldbe reduced to only 40% or raised to 250% of the value expectedfrom AW.X if an uncoupling was needed to adequately describethe 'UF volume' (Eq. 7). The average LS was 0.069 0.03mi/mm Hg/min/1.73 m2. Several of the patients with low LScompared to the area parameter had problems with overhydrationand were identified as certain or potential "UF loss" patients.
The theoretical lymph flow calculated in the analysis was 0.41ml/minhl.73 m2 BSA (geometrical mean), with an SEM of 0.06 anda range of 0.00 to 2.21.
Reproducibility of PDCIn 15 patients it was possible to repeat the determinations
within a few days. Figure 7 shows the area parameters from thefirst PDC measurement against the second, third and fourthregistrations. Standard deviations were calculated for each indi-vidual patient. The coefficient of variation (CV% = sD/mean)wasused as a measure of the variability. The A0/zx had a coefficient ofvariation of 7% with an SEM of 1%; for JVAR the CV% was 16%with an SEM of 3% and for JvL CV% was 20% with an SEM = 4%,N 15. The AJx showed little variation from time to time, whileJVL, reflecting protein loss, was less stable as previously noted [33].
PDC during peritonitisThe PDC test was performed in 11 patients with acute perito-
nitis. Nine patients were infected by Staphylococci (aureus orcoagulase negative) and one patient had a fungal peritonitis(Candida Albicans). All parameters were higher in the group with
>0Ca)
a)LL
40
30
20
10
I.'
Table 3. Area parameter conversion to PET
0 10
20
10
>0cG)
0a)
U-
rnr in0 1.2 2.4 3.6 4.8
Absorption, JVAR mi/mini1.73 in2
Fig. 5. The final reabsoiption rate of fluid from the abdominal cavity toblood when there is no crystalloid osmotic pressure gradient left, N = 97.
1192 Haraldsson: Individual PD capacity
0 0.1 0.2 0.3
Large pore flow, JVL ml/min/1.73 m2
Fig. 6. The large pore fluid flux, Jv1, in the PD population of 97 patients.
60000c)1*
CCC')N 40000
o.Oc)20000
,<
00 2000 4000 6000
Fig. 7. The reproducibility of the area parameter is shown by repeateddeterminations of PDC within a week in the same patient (N = 15). Thesecond (•, N = 15), the third (0, N = 7) and the fourth (, N I PDCmeasurements are plotted against the first. The coefficient of variation forthe area parameter is 7% in these 15 patients (± 1%).
peritonitis compared to control (Fig. 8). In the early phase ofperitonitis A0/zx was 48,650 cm/1.73 m2 (geometric mean, SEM =+3370, —3150, range 31,200 to 68,600, N 11), JVAR was 1.78ml/min/1.73 m2 (range 0.91 to 3.64, SEM = +0.27, —0.24) and Jv1was 0.19 ml/min/I.73 m2 (range 0.06 to 0.43, SEM = +0.04, —0.03,N = ii). In 6 patients PDC had been measured within a six monthperiod prior to the infection. In these patients the peritonitisinduced an 81% increase in the area parameter (range 40 to120%). Two months after the peritonitis, the area returned toprevious values or less. In the patient with fungal peritonitis, thearea parameter was extremely small two months after the perito-nitis, only 8087 cm/I .73 m2. He had been treated with HD andcould not return to PD.
Discussion
This project started with the idea of developing a method ofestimating the true PD capacities of individual patients based oncurrent theories of transcapillary exchange. Furthermore, astraightforward experimental protocol should allow the patientsto collect the data themselves to mimic the normal PD day. Thestudy is not aimed to validate the three-pore model, but is a
pragmatic attempt to make clinical use of basic physiologicaltransport equations. Naturally, the success of such a venturedepends on the validity of the underlying mathematical model, aswell as the design of the protocol.
The three-pore model
Albeit somewhat simplistic, the three-pore model [19, 28] isprobably the best description of the peritoneal membrane to date[34]. One of its major merits is that it seems to be universal for themicrovasculature of all organs [25, 32, 35]. Solutes are restricteddepending on their molecular size, whereas possible electricalcharge interactions are not accounted for in the present analysis.This is mainly due to the ambiguity of data for the peritoneum, cf.[36, 37]. Moreover, the pore dimensions were considered to beconstant in all patients, which is most likely close to reality, cf.[25]. The area parameter, AJx, was 23,600 cm/1.73 m2 BSA andfor the studied adult population is a value similar to thosepreviously reported [281. In the present model, the capillary andi.p. hydrostatic pressures were kept constant in all patients, exceptin seven (7%) where the CapiJI was automatically raised to givelymph flows above zero. However, Capi11 is most likely reduced ifthe patient is hypotensive (for example dehydrated) and increasedin case of overhydration. Such alterations ii 1capi)l are notaccounted for in the present analysis, nor are changes due to bodyposition or alterations in the i.p. pressure. In the literature, thereare studies that could allow P1, to change with the intra-abdom-inal volume [38]. The diffusion of sodium is less than expectedfrom the three-pore model, cf. [30]. Finally, there may beinterstitial concentration gradients or barriers [34, 39] reducingthe PS of glucose. It should be emphasized, however, that themodel works with remarkable precision for the vast majority ofsolutes as well as for fluid transport. As an illustration of thepotentials of the present model, Figure 9 shows the predictedeffects of various osmotic agents on the drain volume plottedagainst time for a patient with normal PDC pavamewrs. Thesimulated effects are close to the values publishedin the.llturature[40].
25
20
15>C.)Ca)
a)U-
10 j5
lnnfln
300
C0C.)
0200
C')
a)
;100
Fig. 8. Effects of peritonitis on the three PDC parameters. In accordancewith inflammatory reactions in other vascular beds, there are signs ofvasodilation, capillary recruitment, opening of large pores giving highprotein losses, mean SEM, N = 11.
Area' "Absorption' 'LargePoreFlow'
9e
"Area" for PDC #1, A0/1,, cm/1.73 m2
Haraldsson: Individual PD capacity 1193
Eli. . The osmotic effects of different Osmotic agents are simulated for apatient with an average area = 24,100, slightly high JVAR = 1.6, JVL = 0.14
and L4.S 0.067. Theosmotic agents are: (solid curves) glucose 15, 25 and40 glItter; (solid curve with filled circles) amino acid solution 10 g/liter;(hatched curve) small peptides 40 glliter, molecular wt = 800, SE radius =0.64 nm; (open circles) glucose-polymer 75 g/liter + glucose 3.5 g/liter,molecular wt = 18700, SE radius 2.10 nm. The osmotic agents are allassumed to have a reduced PS analogous to i.p. glucose (Eq. 6).
How to interpret the PDC parameters
What is the morphological counterpart to the physiologicalexpression AjAx or the area parameter? The area represents theunrestricted area (A0) of the pores in all capillaries perfused at agiven time normalized with respect to the diffusion distance (z.x).The functional term 'pore' is probably equivalent to the interen-dothelial junction at the microscopical level [41] and shows littlevariation in its size or number. In most other organs, and mostlikely the peritoneum, there is heterogeneity of perfusion, withinterrupted flow in some capillaries and high flows in otherschanging with time [42], with only one out of four to six of thecapillaries being adequately perfused at any given time, ci. [431.Hence, a large capillary reserve exists whereby the area parametercan be increased several-fold, for example, during an inflamma-tory reaction. Moreover, drugs and other conditions that affect therecruitment of capillaries may affect the area parameter. Suchconditions include over/underhydration with subsequent involve-ment of the sympathetic nerves, as well as certain vasodilators[44) The instillation of acidic, lactate-containing hyperosmolarsolutions may also induce (short-lasting) recruitment of capillariesand hence increase th area parameter.
The second PDC parameter, Jv, represents the sum of thelymphatic flow and the transcapillary Starling forces (Eq. 16). Thelatter also include the hydraulic conductance, LS, which iscalculated from the area parameter for most patients. The LScan be uncoupled from A0IAx if needed to get an acceptabledescription of the UF volumes (Eq. 7). Note that JvAR per se isnot dependent on any assumption of the underlying transportroute. The JVAR only reflects the last part of the drain volumeversus time curve. High rates of Jv were seen in the patientswith large area parameters, due to a more rapid dissipation ofglucose, but could also be seen in patients with a normal areaparameters.
The large pore fluid flux (JvL) determines the loss of proteinsfrom blood to the abdominal cavity. It is almost pure plasma thatflows through the large pore system with size discrimination forthe larger proteins only. The JVL is dependent on the hydrostatic
pressure gradient and the LS is accounted for by the large pores(Eq. 13). There is no strict coupling of LS since an increase inLS will be counterbalanced by an apparent reduction in thenumber of large pores. An increased number of large poresrepresents a true increase in the (capillary) permeability since itaffects the selectivity of the (PD) membrane. Indeed, inflamma-tory reactions increase the number of large pores.
Comparison between the area parameter and PET
Most PD clinics are familiar with the PET terminology, wherethe patient population is divided into four groups: high, high-average, low and low-average transporters. The PET classificationis not corrected for the influence of the UF rate, but for most ofthe cases it is possible to express the PETs in terms of the areaparameter according to Table 3. The term 'permeability' issometimes used to interpret PET instead of 'transporters,' but it isnot adequate in this situation, since 'high permeability' impliesaltered membrane selectivity which has not occurred. It is there-fore recommended that the use of (high/low) permeability shouldbe avoided.
Inflammatoty reactionsThe typical inflammatory reaction is characterized by vasodila-
tation, capillary recruitment, opening of large pores (or 'leaks')with a higher protein loss, increased lymph flow and pain. Thereactions observed in the acute phase of peritonitis are inaccordance with such an inflammatory reaction (Fig. 8). In somepatients the inflammatory reaction was rather weak, while inothers there were marked changes.
Nutritional aspectsAs is shown in Table 2, the computer calculates the amounts of
calories and protein required for the particular patient duringalmost resting conditions (Eq. 24). Moreover, the PD uptake ofcalories with a given regimen is calculated together with theestimated loss of proteins. The urea and creatinine generationrates (UGR, CGR) are those obtained on the day of measure-ment and are valid if that was a representative day, that is, normalfood intake, no infection, etc. This also applies to the proteinequivalent of nitrogen appearance rate, PNA [45] (previouslydenoted protein catabolic rate, PCR), and to the estimation oflean body mass, LBM. The PNA is calculated from UGR andfrom the losses of protein in urine and PD fluid (Eq. 21). Notethat falsely high values of LBM can be obtained if the foodcontains a significant amount of creatinine (that is, meat), an errorthat has been calculated to be small [46] but probably significant(Note added in proof).
Adequacy of dialysisThe calculated PD membrane characteristics can be used to
simulate any PD treatment. The results are presented as easilyunderstandable graphs showing the estimated values for clearance(PD alone and PD + renal), the resulting removal of fluid (PDand PD + renal) and the nutritional consequences (see above).An example of the results in terms of clearance and 'UF-volume'is shown in Figure 10. The clearance of the renal replacementtherapy is calculated for a solute the size of creatinine and issuggested to be at least 5.5 ml/min/1.73 m2, corresponding to aweekly creatinine clearance (PD + GFR, not PD + renalcreatinine clearance) of 55 liters [13]. There is considerable
800
02 4
-400Dwelt time, hours
1194 Haraldsson: Individual PD capacity
experience of measuring the glomerular filtration rate of nondi-alysis patients with renal insufficiency [471, and many centersrecommend that dialysis should be started at a renal residualfunction (RRF) of 5 ml/min or more to prevent the loss ofimportant body functions [48]. It therefore seems logical toascertain that the dialysis clearance reaches the minimal level of5.5 mI/mm at least for creatinine, since the clearance of largersolutes will be lower with PD than the renal clearance (highervalues will be seen for urea). The computer can easily calculatethe predicted clearance of any solute based on its molecular sizeand several other solutes are presented on the screen on demand.The resulting Kt/V value for urea is also calculated, using V =58% of the body weight.
Pedagogical aspectsA subjective experience of PDC is that both physicians and
nurses have gained insight into the physiological properties of thePD membrane and how PD works. Several patients have alsotaken an active part in the interpretation of the PDC results,giving an improved patient motivation, knowledge and compli-ance although these effects have not been quantified. The issue ofpatient compliance is often neglected. However, recent studieshave suggested that almost one fourth of the patients use a lowerdose of dialysis than prescribed, and the total dialysis dose isapproximately three fourths of that expected [49, 50]. Therefore,it is essential to optimize the patient motivation and hence patientcompliance in order to ensure adequate dialysis. The PDCprogram seems to be useful in this respect as well.
Urea kinetic modeling
There have been attempts to use urea kinetic modeling basedon the Pyle, Moncrief and Popovich model [51] as a prescriptionaid in PD [11]. This widely used model has important drawbacks:(i) The membrane is considered to be extremely permeable tosmall solutes, allowing almost free diffusion. (ii) On the otherhand, the membrane is highly selective with respect to osmosis,showing high 'apparent' reflection coefficients for small solutes,for example, 0.5 for glucose. Note that these two properties areincompatible. (iii) Using current irreversible thermodynamics tocalculate pore radii [52], the apparent pore radius in that model
seems to increase with increasing solute size. (iv) Finally, largersolutes are not more effective osmotic agents than glucose accord-ing to the model [53], but actual measurements show that they aremore effective [54]. In contrast, the three-pore model givespredictions close to those observed in vivo (Fig. 9). Naturally,there are limitations with the present three-pore model, but it isinternally more consistent and offers a universal description of thefluxes of fluids and solutes across microvasculature in almost allorgans [26]. More studies are required, however, to improve theanalysis further. Hopefully, the PDC method can stimulate suchefforts and be used to better quantify the effects of various drugs,osmotic agents, etc.
Economical aspectsThe nursing time required for PDC include giving adequate
instructions, handing over a standardized PDC kit, taking twoblood samples, sending the samples to the laboratory and enteringthe data into the computer. The patients perform the PDC testthemselves, which makes the nursing time less than with tradi-tional PET. A total of six PD samples (5 during the PDC day +the start sample), one urine sample and two blood samples arecollected. The cost of the chemical analyses varies betweenlaboratories and therefore it seems suitable to make a relativecomparison. Thus, in Goteborg the cost of the PDC test is lessthan half of a renal clearance measurement (Cr-EDTA), 10%more than the cost of PD fluids during one day, 50% more thanthe cost of a chest X-ray, or about the same as one injection oferythropoetin (5400 units).
Conclusion
Basic physiology can be utilized for the description of the PDexchange in individual patients. The patient can perform the PDCmeasurements himself during an almost normal CAPD day thusrequiring a minimum of nursing time. The resulting peritonealdialysis capacities are reproducible and can be used to ascertainadequate dialysis and to predict the effects of any dialysis treat-ment. Hence, PDC seems to be useful in the management of thePD patients. Moreover, the dramatic microvascular changes in-duced by peritonitis are in total agreement with the inflammatoryreaction observed in other vascular beds. With a tool that
A B20 2
15 1
10 0
5 -..----. -1
-2
PD PD + urine
PD PD+RRF
Fig. 10. The results in terms of clearance for asolute the size of creatinine A and fluid removalB are presented graphically. RRF is residualrenal function. The hatched line represents theminimal clearance level of 5.5 ml/min/1.73 m2BSA.
Haraidsson: Individual PD capacity 1195
interprets the intricate processes of PD in physiologically appro-priate parameters, there may not be a need for guessing or usingsemiquantitative tests.
Acknowledgments
Part of this work was presented at ASN in Baltimore [55] and at asymposium on adequacy of dialysis in Berlin in March 1994. The study wassupported by the Swedish Medical Research Council grant no. 9898 andthe Medical faculty of GOteborg, LUA no. 721986. I am particularlygrateful to the patients taking part in the study and the devoted staff of theDepartment of Nephrology, Sahlgrenska Hospital under its head, Prof.Mattias Aurell. The helpful advice of my former teacher in research, Prof.Bengt Rippe, Lund, Sweden is warmly acknowledged. The PDC computersoftware is distributed by Gambro AB, Lund, Sweden.
Reprint requests to Bode Haraldsson, Department of Nephroiogy, Bidstrdket 5, University of Goteboig, Sahigrenska Hospital, S-413 45 GOteboi,Sweden.
AppendixList of abbreviations
The terminology is based on the recommendations of the InternationalPhysiological Society [56].
Weight (kg)Height (m)The body surface area (in m2)Capillary hydrostatic pressure (15 mm Hg)Intraperitoneal hydrostatic pressure (6 mm Hg)Osmotic pressure (mm Hg) where the subscriptdenotes protein (prot), glucose (gluc), urea, sodium(Na) or anionsStokes-Einstein radius (nm)Pore radius (nm)The ratio of solute to pore radii (ae/rp)Small pore radius (4.7 nm)Large pore radius (25.0 nm)Residual volume (ml)Volume of the dialysis fluid prior to instillationConcentrations in plasma and dialysateClearance (in ml/min/1.73 m2 BSA)The universal gas constantThe absolute temperatureAvogadro's numberThe viscosity of waterThe hydraulic conductance or the UF coefficient(ml/min/mm Hg/1.73 m2 BSA)Unrestricted pore area over diffusion distance (thearea PDC parameter, cm/I .73 m2 BSA)
Am/AO The fractional area available for diffusion of a solutemThe reflection coefficient for a solute mThe free diffusion coefficient for a solute m (cm2/s)Fluid flux (ml/min)The final reabsorption rate of fluid from the abdom-inal cavity to blood ("absorption", ml/min/1.73 m2BSA)Large pore fluid flux ("large pore flow," ml/min/1.73m2)Lymph flow (ml/min/1.73 m2)The flux of solute (mmol/min or g/min)Urea generation rate (mmol/day)
PNA Protein equivalent of nitrogen appearance rate (g/
Subscripts:
kg/day)Creatinine generation rate (mmol/day)Lean body mass (kg)
c,s,L the cell, small or large pore pathwaym a solute m
Basic capillary exchange parametersThere are several estimations of the body surface area from a
person's height (L, in m) and weight (W, in kg) including the onebelow [57]:
BSA = 0.02350 (100 L)°4 (Jq 1)
The body mass index (BMI in kg/rn2) is given by:
W
BM1= (Eq.2)
The free diffusion coefficient is related to the Stokes Einsteinradius of a solute:
R T 327656 10D37'= = (Eq.3)67r'ii'N'ae ae
In the literature there are several equations describing thefractional pore area available for diffusion of a solute rn, but theexpression covering most solute sizes was presented by Mason,Wendt and Bresier [52]:
=(1 — a)9112
A0 1—0.3956' a+1.0616 q.4)
and for calculations of the solute reflection coefficient [52]:
(1_a)2. [2_(1_a)2]. (i_l3)
a2a21——+-— (Eq.5)33
where a is the ratio of the solute m Stokes Einstein radius over thepore radius.
The diffusion capacity, or permeability surface area (PS), of asolute m is given by:
P'Dm (Eq.6)
Urea is, however, more soluble in oil than are, for example,glucose and creatinine, as reflected by a three- to fivefold higheroctanol/water partition coefficient [58]. As a result the PSurea isincreased by a factor of 1.2, allowing for some transport throughthe lipid membranes. On the other hand, the PSgiucose is less thanpredicted from the A0/& [28], which may be due to properties inthe interstitiurn, such as interstitial concentration gradients orinterstitial restriction of diffusion, serial barriers, etc. [34]. There-fore SgjucoSe was reduced by a factor of 0.8. Moreover, the PS forsodium is only 6 ml/min/1.73 m2 [30], while PS for most otherhydrophilic solutes seem to be well predicted from equation 6.Initially, there seem to be a vasodilatation and recruitment of
CGRLBM
WLBSA
'capi1lPipsubsript
rpare,,rPLVReS
VDFC, CCl or KRTN
LS
DmJvJv
JVL
"Lympl,JsUGR
1196 Haraldsson: Individual PD capacity
capillaries that transiently increased PS of allsolutes with a factor known, using the following non-linear fluxequation. Thus, clear-of 1 + e004, t is in minutes. ance of a solute m through the small pores is:
The hydraulic conductance L S or thenormally close to 0.070 mI/mm/mm Hg/1.73LS was calculated from the A,Jzx as:
IS= 23000 (Eq. 7) JVs (1 — °s,m)Pe = (Eq. 15)No more than a 5% deviation of "UF volume" is accepted, PSs,motherwise there is uncoupling of LS from the A0/.x. Thisdeviation is calculated as (VUF/VDF), where ZWUF is the differ- The concentration ratio (CD/CP) in equation 14 is inverted if theence between measured and calculated UF volume and VDF the concentration in the dialysate exceeds that of plasma, whichinfused volume of dialysis fluid. Plasma proteins exert a colloid normally is the case solely for glucose. Similar calculations areosmotic pressure which can be calculated [21] as: made for the clearance of solutes through the large pores. The
total clearance is merely the sum of the small and the large pore
= 2.1 + 0i6(S2
irot3 (Eq. 8)clearances.
)+ 0 The final reabsorption rate of fluid from the abdominal cavi
occurs when the crystalloid osmotic gradients have dissipated andwhere Cprot is the total protein concentration in glliter. Several is thus given by:laboratories do not analyze total protein in serum (Sprot) andapproximate Sprøt concentrations can be calculated from mea- Jv1 = — LpS[Pcapiii —
I)jp—
oprot(1Tp— )J+ Jvh (Eq. 16)
sured Saib values: Cprot = Caib/O.4783, based on 78 patients. The Note that lymph flow is only one (minor) component of JVAR.ratio of the two calculated osmotic pressures (prot/alb) is 1.0000.0195 (N = 78).
Each solute exerts a crystalloid osmotic pressure (in mm Hg) Changes of intraperitoneal volume and solute concentrations
according to van't Hoffs law: with time
= R T 19.33 • (Eq 9) The following equations are used to estimate the initial soluteconcentration i.p. at the start of the PD cycle:
where C is given in mmol/liter.According to the three-pore concept, the reflection coefficient VDF CDF + VRe5 CRes
for the membrane as a whole is the result of the characteristics ofCD(O) = (Eq. 17)
VDF + VReS
three independent pore populations. Thus, the weighted averagereflection coefficient for solute m (o-,) is:
LpS LS5 LpSL= 0c,m + + I,m (Eq. 10)tot LS505 LpS0
where LS505 is the hydraulic conductance of the entire mem-brane.
The fluid flux through the cell pathway is:
Jv LpS (Pcapiii — lTprot—
gluc— urea — Na —
iranions)
where LS is 1.0% of total hydraulic conductance (LS0) of themembrane.
The fluid flux through the small pores are given by:
resetjv5 = LpS (Pcapiii — sprot —Pip
—OsgJuc
— 0surea — sWa (Eq. 18)
Finally, the fluid flux through the large pores is:
where CDF stands for the concentration of solutes in the dialysisfluid prior to instillation. The residual volume is scaled to the bodyweight as: VReS -- that is, 250 ml for a 70 kg human. CRe5is the concentration in the residual volume, which is unknown atthe start of the PDC protocol but thereafter is given by thepreviously drained fluid. As reasonable estimates of CRCS at thestart of the protocol the following expression was used: CRCS =k C; where k is 1 for glucose and sodium, k is 0.8 for urea andcreatinine and k is 0.05 for albumin. Note that this approximationis needed only for the start of the PDC protocol, not the
(Eq. 11)subsequent 4 or 5 exchanges.
Numerical integration was used to obtain the changes ofvolume and concentration with time, using two minute steps forthe first hour followed by steps of 10 minutes. Thus, the i.p.volume after a short time interval is:
— osirions)
V(t + t) = V(t) + zt (Jv + Jv5 + JVL — JVLPh)
(Eq. 12) The concentration of a solute m after a short time interval is:
JVL = LPSL (Peapiti — P1) (Eq. 13)
CD,m(t) V(t) + (s + L),m t Cp,m(t)CD,m(t + t) = (Eq.19)
V(t + zt)
since no significant osmotic gradients can be maintained across The residual renal function (RRF) can be estimated from thethese pores. mean of the clearances of urea and creatinine with reasonable
The transport ofeasily obtained once
different solutes across the membrane arethe partial fluid fluxes through the pores are
accuracy if RRF is less than 15 ml/min [471. The clearance forurea or creatinine (in mI/mm/I .73 m2 BSA) is given by:
Haraldsson: Individual PD capacity 1197
a c1j Vj 1.73 Note added in proof
Cp 24 60 BSA Creatinine kinetics cannot be used due to variabilities in meat intake.HARALDSSON B, JoHANssoN A-C, Armw'l P-O: Creatmine generationrate—A blunt tool for assessments of lean body mass, (abstract) JAm SocNephrol 5:492, 1994
References0urea + CLereat
RRF 1. SMEBY LC, WIDEROE TE, JORSTAD S: Individual differences in watertransport during continuous peritoneal dialysis.ASAIO Trans 4:17—27,1981
3. TWARDOWSKI ZJ: Clinical value of standardized equilibration tests inCAPD patients. Blood Purif 7:95—108, 1989
4. GOTCH F: The Peritoneal Equilibration test (PET) is not a realisticmeasure of peritoneal clearance. JAm Soc Nephrol 2:361—361, 1991
5. RUBIN J, JONES 0, PLANCH A, LOCKARD V, BOWER J: Enhancement ofperitoneal transport in rats by disrupting stagnant fluid films. Am JMed Sd 295:108—113, 1989
6. LEvrrr MD, KNEIP JM, OVERDAHL MC: Influence of shaking onperitoneal transfer in rats. Kidney mt 35:1145—1150, 1989
7. Lo W-K, BRENDOLAN A, PROWANT BF, MOORE HL, KEANNA R,(Eq. 22) TWARDOWSKI ZJ, NOLPH KD: Changes in the peritoneal equilibration
test in selected chronic peritoneal dialysis patients. JAm Soc Nephml4:1466—1474, 1994
8. VERGER C, LARPENT L, VENIEZ G, BRUNETOT N, CORVAISIER B:L'APEX. ... description et utilisation. Bull Dial Pent 1:36—40, 1991
9. DAVIES SJ, BROWN B, BRYAN J, RUSSELL GI: Clinical evaluation of theperitoneal equilibration test: A population-based study. Nephrol DialTransplant 8:64—70, 1993
(Eq. 23) io, BURKART JM, JORDAN JR, Rocco MV: Assessment of dialysis dose bymeasured clearance versus extrapolated data. Pent Dial mt 13:184—188, 1993
11. Vorsi-i EF, LYSAGI-IT MJ, MoRAN J, FARRELL P: Kinetic modeling asa prescription aid in peritoneal dialysis. (see comments) Blood Purif9:246—270, 1991
12. KEsHAvIAH PR, NOLPH KD, PRO WANT B, MOORE H, PONFERRADA L,VAN STONE J, TWARDOWSKI ZJ, KHANNA R: Defining adequacy ofCAPD with urea kinetics. Adv Pent Dial 6:173—177, 1990
13. TZAMALOUKAS AH, MURATA OH, SENA P: Assessing the adequacy of
Urea kinetic analysis and clinical outcome on CAPD. A five yearlongitudinal study. Adv Pent Dial 6:181—185, 1990
15. TArFERSALL JE, DOYLE S, GREENWOOD RN, FARRINGTON K: Kineticmodelling and underdialysis in CAPD patients. Nephrol Dial Trans-
plant 8:535—538, 199316. BLAKE PG, BALASKAS EV, IZATF S, OREOPOULOS DG: Is total
creatinine clearance a good predictor of clinical outcomes in contin-uous ambulatory peritoneal dialysis? (see comments). Pent Dial mt12:353—358, 1992
17. SELGAS R, BMO MA, FERNANDEZ-REYES MJ, BOSQUE E, LOPEZ-REVUELTA K, JIMENEZ C, BORREGO F, DE AivAKo F: An analysis ofadequacy of dialysis in a selected population on CAPD for over 3years: The influence of urea and creatinine kinetics. Nephrol DialTransplant 8:1244—1253, 1993
18. BIxE PG, SOMBOLOS K, ABRAHAM G, WEISSGARTEN J, PEMBERTONR, CHU GL, OREoPOuLoS DG: Lack of correlation between ureakinetic indices and clinical outcomes in CAPD patients (erratum inKidney mt 40:388, 1991) Kidney mt 39:700—706, 1991
19. RIPPE B, STELIN G, HARALDSSON B: Computer simulations of perito-neal fluid transport in CAPD. Kidney mt 40:315—325, 1991
20. STARLING EH: On the absorption of fluids from the connective tissuespaces. J Physiol ('Lond) 19:312—326, 1896
21. LANDIS EM, PAPPENHEIMER JR: Exchange of substances through the(Eq. ) capillary walls, in Handbook of Physiology. Circulation, edited by
HAMILTON WF, Dow P, Washington D.C., Am Physiol Soc, 1963, vol2, pp 961—1034
22. GROTFE G: Passage of dextran molecules across the blood-lymphbarrier. Acta Chin Scand (Suppl) 211:1—84, 1956
(Eq. 20)
where C and C are the concentrations in urine and plasma andV is the 24-hour urine volume.
(Eq.21)
19+0.272• UGR + ProtLoss
w
as:
2
The generation rates of urea and creatinine are calculated apply-ing the principles of conservation of mass. Thus, two bloodsamples are taken with a 24 hour interval and the total lossesthrough urine and dialySate are measured. The blood concentra-tions are also allowed to change. From the urea generation rate(UGR) the protein equivalent of the nitrogen appearance rate(PNA, previously called the protein catabolic rate, PCR) can becalculated according to the relation observed in stable patients onAPD [45]:
PNA=
where ProtLoss is the sum of protein losses in dialysate and urine.The creatinirse generation rate, CGR can be used to estimate leanbody mass [46]:
LBM = 7.38 + (3.278W CGR)
Note, however, that the calculations of LBM from CGR neglectsthe food intake of creatinine [46], which must be controlled ifLBM is to be used to follow patients over time (Note added inproof).
The basal metabolic rate during slight activity can be estimated
where k is 33 kcal/kg/day for the ages 30 to 70, 10% more in theage grOup 16 to 30 and 10% less above 70 years of age. Forchildren k is 84 kcal/kglday if the weight is less than 10 kg, 66kcal/kg/day for W = 10 to 15 kg, 54 kcal/kg/day for weights 15 to25 kg, 48 kcal/kg/day for W = 25 to 35, 42 kcal/kg/day for weights35 to 60 kg, and k is 36 kcal/kg/day for higher weights. The proteinrequirements are estimated as 0.8 g/kg/day for adults (above 15years of age) and 1.5 g/kg/day for children. The presented valuesfor protein and caloric requirements are adjusted (± 10%) in caseof over/underweight, where underweight is equivalent to a BMIless than 20 for men and less than 18.5 for women, whileoverweight means a BMI >25 for men and >24 for women.
Note that the aqueous solute concentrations [59] were usedwhereby the space in serum occupied by lipids and proteins areaccounted for. Thus, serum aqueous concentrations C' for aneutral solute with the serum concentration C is:
C' =(1
— 0.016 0.000718 Cprot)
where 0.016 is the lipid factor and Cproi is the concentration ofproteins or SaIb/O.40.
bmr = k W
C
1198 Haraldsson: individual PD capacity
23. YUDILEVICH DL, ALVAREZ OA: Water sodium and thiourea transcap-illaiy diffusion in the dog heart. Am J Physiol 213:308—314, 1967
24. RIPPE B, HARALDSSON B: Fluid and protein fluxes across the micro-vasculature. Application of two-pore equations. Acta Physiol Scand131:411—428, 1987
25. TAYLOR AE, GRANGER DN: Exchange of macromolecules across themicrocirculation, in Handbook of Physiology. The Cardiovascular Sys-tem. Microcirculation, edited by RENKIN EM, MICI-IEL CC, Bethesda,Am Physiol Soc, 1984, vol 4, pp 467—520
26. RIPPE B, HARALDSSON B: Transport of macromolecules across micro-vascular walls: The two-pore theory. Physiol Rev 74:163—219, 1994
27. DEMPSTER JA, VAN HOEK AN, VAN Oss CH: The quest for waterchannels. News Physiol Sci 7:172—176, 1992
28. RIPPE B, STELIN G: Simulations of peritoneal solute transport duringCAPD. Application of two-pore formalism. Kidney mt 35:1234—1244,1989
29. ZAKARIA ER, RIPPE B: Osmotic barrier properties of the rat perito-neal membrane. Acta Physiol Scand 149:355—364, 1993
30. VONESH EF, RIPPE B: Net fluid absorption under membrane transportmodels of peritoneal dialysis. Blood Putif 10:209—226, 1992
31. BOOTH GW, PETERSON TI: Non-linear estimation, in Mathematics andApplication Reports, (vol 3) IBM, New York, 1960
32. RIPPE B, HARALDSSON B: Transport of macromolecules across micro-vascular walls. The two-pore theory. Physiol Rev 74:163—219, 1994
33. ZEMEL D, KREDJET RT, KOOMEN GC, STRUIJK DG, ARISZ L: Day-to-day variability of protein transport used as a method for analyzingperitoneal permeability in CAPD. Petit Dial mt 11:217—223, 1991
34. FLESSNER MF: Peritoneal transport physiology: Insights from basicresearch. JAm Soc Nephrol 2:122—135, 1991
35. RENKIN EM: Capillary transport of macromolecules: Pores and otherendothelial pathways. J AppI Physiol 58:315—325, 1985
37. HARALDSSON B: The peritoneal membrane acts as a negativelycharged barrier restricting anionic proteins. JAm Soc Nephrol 4:407,1993
38. TWARDOWSKI ZJ, KHANNA R, NOLPH KD, SCALAMOGNA A, METZLERMH, SCI-INEIDER TW, PROWANT BF, RYAN LP: lntraabdominal pres-sures during natural activities in patients treated with continuousambulatory peritoneal dialysis. Nephron 44:129—135, 1986
39. FLESSNER MF, FENSTERMACHER JD, DEDRICK RL, BLASBERG RU: Adistributed model of peritoneal-plasma transport: Tissue concentra-tion gradients. Am J Physiol 248:F425—F435, 1985
40. MISTRY CD, GOKAL R: Glucose polymer as an osmotic agent inCAPD. Adv Exp Med Biol 260:149—156, 1989
41. BUNDGAARD M: The three-dimensional organization of tight junctionsin a capillary endothelium revealed by serial-section electron micros-copy. J Ultrastruct Res 88:1—17, 1984
42. RENKIN EM: Control of microcirculation and blood - tissue exchange,in Handbook of Physiology. The Cardiovascular System. Microcircula-tion (vol 4), edited by RENKIN EM, MICHEL CC, Bethesda, Am PhysiolSoc, 1984, pp 627—687
43. Fouow B, HALICKA HD: A comparison between 'red' and 'white'muscle with respect to blood supply capillary surface area and oxygenuptake in rest and exercise. Microvasc Res 1:1—14, 1968
44. FAVAZZA A, MOTANARO D, MESSA P, ANTONLJCCI F, GROPUZZO M,MIONI U: Peritoneal clearances in hypertensive CAPD patients afteroral administration of clonidine, enalapril, and nifedipine. Petit Dialmt 12:287—291, 1992
45. BERGSTROM 3, FURST P, ALVESTRAND A, LINDHOLM B: Protein andenergy intake, nitrogen balance and nitrogen losses in patients treatedwith continuous ambulatory peritoneal dialysis. Kidney mt 44:1048—1057, 1993
46. KESHAVIAH PR, NOLPH KD, MOORE HL, PROWANT B, EMERSON PF,MEYER M, TWARDOWSKI ZJ, KHANNA R, PONFERRADA L, COLLINS A:Lean Body mass estimations by creatinine kinetics. JAm Soc Nephrol4:1475—1485, 1994
47. LEVEY AS, MADAIO MP, PERRONE RD: Laboratory assessment ofrenal disease: Clearance, urinalysis, and renal biopsy, in The Kidney,edited by BRENNER BM, RECTOR FC, Philadelphia, W.B. SaundersCompany, 1991, pp 919—968
48. MITCH WE, WALSER M: Nutrional therapy of the uremic patient, inThe Kidney (vol 2), edited by BRENNER BM, RECTOR FC, Philadelphia,W.B. Saunders Co., 1991, pp 2186—2222
49. KEEN M, LIFt'S B, GOTCI-I F: The measured creatinine generation ratein CAPD suggests only 78% of prescribed dialysis is delivered. AdvPent Dial 3:73—75, 1993
50. WARREN PJ, BRANDES JC: Compliance with the peritoneal dialysisprescription is poor. JAm Soc Nephrol 4:1627—1629, 1994
51. PYLE WK, MONCRIEF JW, POPOVICH RP: Peritoneal evaluation inCAPD, in Proceedings of the 2nd International Symposium on CAPD,edited by MONCRIEF JW, PoPovIcu RP, New York, Masson, 1981, pp35—5 2
53. RIPPE B: A three-pore model of peritoneal transport. Pent Dial mt 13(Suppl 2):S35—S38, 1993
54. MISTRY CD, Goici. R: Single daily overnight (12-h dwell) use of 7.5%glucose polymer (Mw 18700; Mn 7300) +0.35% glucose solution: A3-month study. Nephrol Dial Transplant 8:443—447, 1993
55. HARALDSSON B: Quantitative measurements of the peritoneal dialysiscapacities (PDC) of individual patients. (abstract) JAm Soc Nephrol2:361, 1991
56. BASSINGTHWAIGHTE JB, CHINARD FP, CRONE C, GORESKY CAL,RENEMAN RS, ZIERLER KL: Terminology for mass transport andexchange. Am J Physiol 250:H539—H545, 1986
57. GEHAN EA, GEORGE SL: Estimations of human body surface areafrom height and weight. Cancer Chemother Rep 54:225—235, 1970
58. FENSTERMACHER JD, RAPOPORT SI: Blood brain barrier, in Handbookof Physiology, Bethesda, Am Physiol Soc, 1984, pp 969—1000
59. WANIEWSKI J, HEIMBORGER 0, WERYNSKI A, LINDHOLM B: Aqueoussolute concentrations and evaluation of mass transport coefficients inperitoneal dialysis. Nephrol Dial Transplant 7:50—56, 1992