Page 1
March 2016 | Frontier Economics i
© Frontier Economics Ltd, London.
Assessing the productivity benefits of
improving inter-city connectivity in
Northern England A REPORT PREPARED FOR THE NATIONAL INFRASTRUCTURE
COMMISSION
March 2016
Page 3
Assessing the productivity benefits of
improving inter-city connectivity in
Northern England
Executive summary 9
Chapter 1: The policy context 19
Chapter overview ................................................................................ 19
1.1 Northern Powerhouse policy .................................................... 19
1.2 Growth aspirations for Northern cities ...................................... 20
1.3 Governance and policy responsibility in Northern cities ........... 23
1.4 Transport investment in Northern England to facilitate local
growth aspirations .................................................................... 24
Chapter 2: Transport and economic performance 28
Chapter overview ................................................................................ 28
2.1 The drivers of economic performance in cities ......................... 28
2.2 Benefits from improved transport connectivity ......................... 37
2.3 Evidence of benefits from improved transport connectivity ...... 43
2.4 Implications for the strategic corridors that offer the greatest
opportunity ............................................................................... 59
Chapter 3: Local economic geography 60
Chapter overview ................................................................................ 60
3.1 The Northern Powerhouse ....................................................... 60
3.2 Comparison of the city regions ................................................. 66
3.3 Key observations to inform the strategic case .......................... 76
Chapter 4: Overview of the Strategic Transport Network in the
North 79
Chapter overview ................................................................................ 79
4.1 Overview of the current strategic rail network in the Northern
Powerhouse ............................................................................. 79
4.2 Overview of the current strategic road network in the Northern
Powerhouse ............................................................................. 88
Page 4
4 Frontier Economics | March 2016
4.3 Comparison of the strategic road and rail networks in the
Northern Powerhouse .............................................................. 93
4.4 Road and rail data limitations ................................................... 96
4.5 Overview of freight activity in the Northern Powerhouse .......... 97
4.6 Key observations for the strategic case ................................... 99
Chapter 5: Estimating the productivity gains from improving inter-
city rail connectivity in the north 103
Chapter overview .............................................................................. 103
5.1 Objective of the modelling analysis ........................................ 103
5.2 Modelling approach ................................................................ 107
5.3 Results ................................................................................... 115
5.4 Implications ............................................................................ 129
Chapter 6: Summary and case for change 132
Overview of this Chapter .................................................................. 132
6.1 The question addressed by this study .................................... 132
6.2 What aspirations does TfN have for economic performance in
the Northern city regions? ...................................................... 133
6.3 What do we know about the drivers of economic performance?
............................................................................................... 134
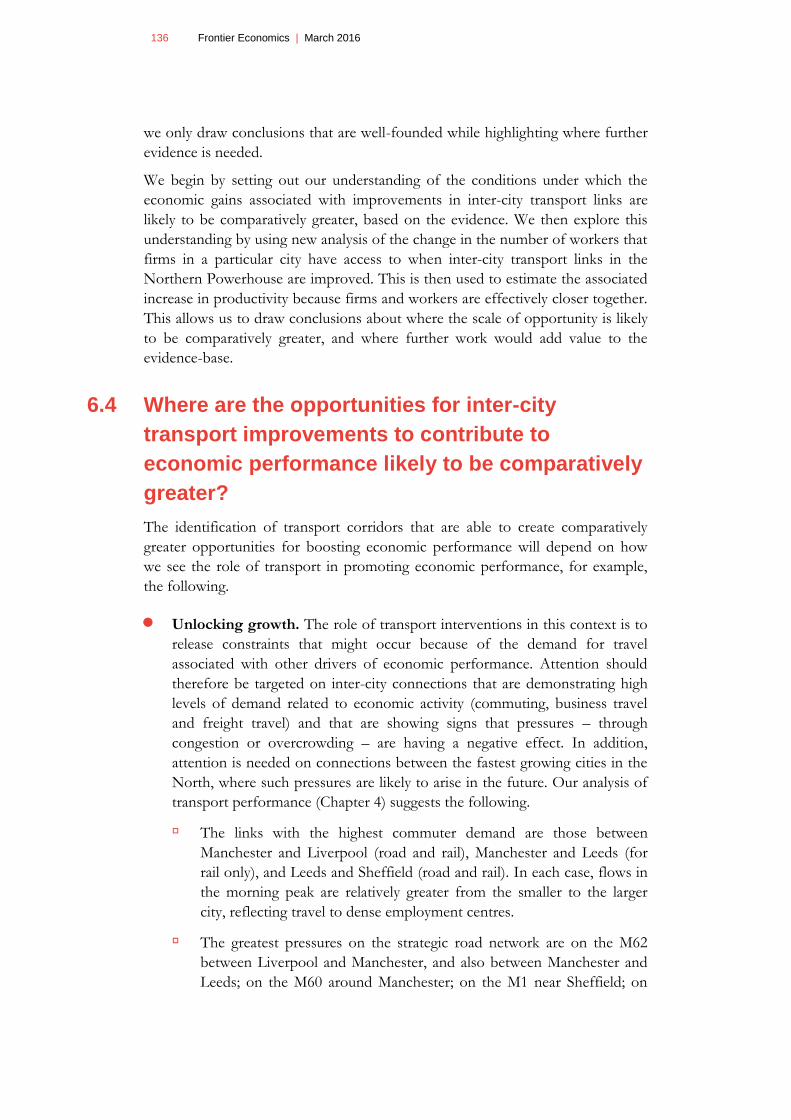
6.4 Where are the opportunities for inter-city transport improvements
to contribute to economic performance likely to be comparatively
greater? .................................................................................. 136
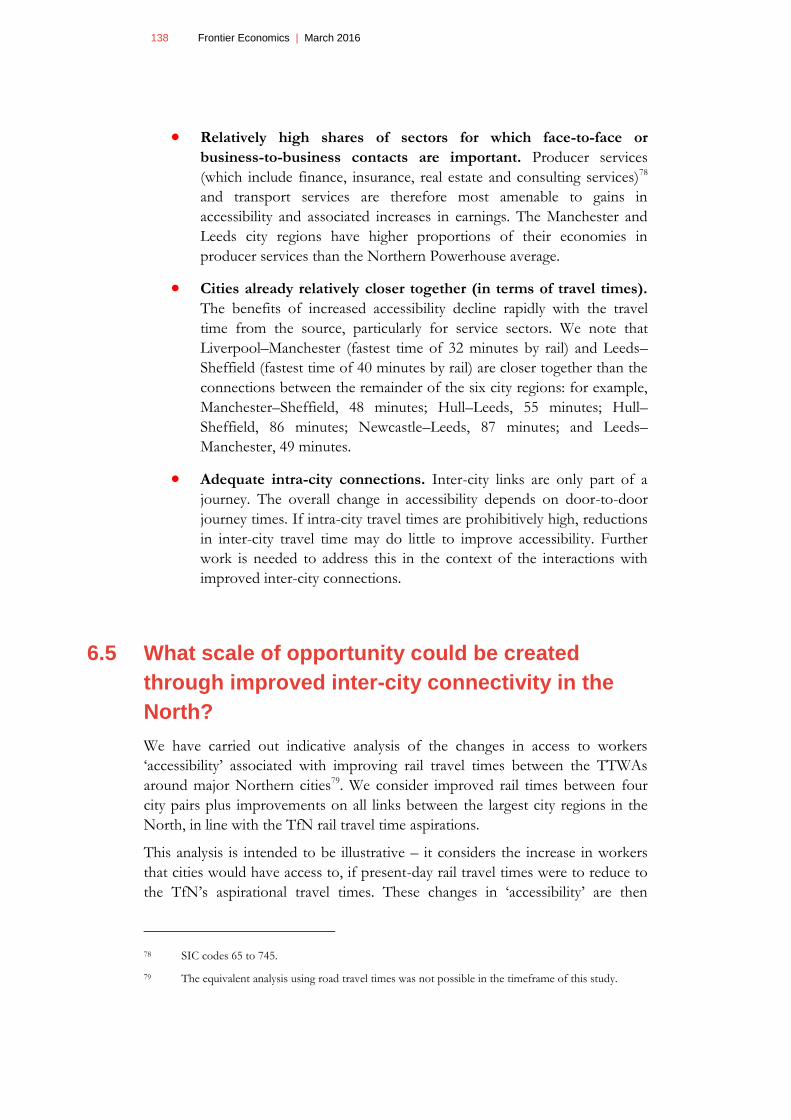
6.5 What scale of opportunity could be created through improved
inter-city connectivity in the North? ........................................ 138
6.6 What does this suggest for policy makers? ............................ 141
Annex: Additional material 144
City analysis for Chapter 3................................................................ 144
Gravity modelling assumptions in Chapter 4 .................................... 167
Technical Annex: Northern Powerhouse inter-city rail connectivity
methodology .......................................................................... 170
Bibliography 178
Page 5
Assessing the productivity benefits of
improving inter-city connectivity in
Northern England
Figure 1. Understanding the potential role of inter-city transport
connections in enhancing economic performance of the
Northern Powerhouse. 11
Figure 2. Transport interventions and economic performance 12
Figure 3. Key drivers of economic performance in cities 30
Figure 4. Role of transport in promoting economic growth 32
Figure 5. First- and second-order effects of transport connectivity
on productivity 42
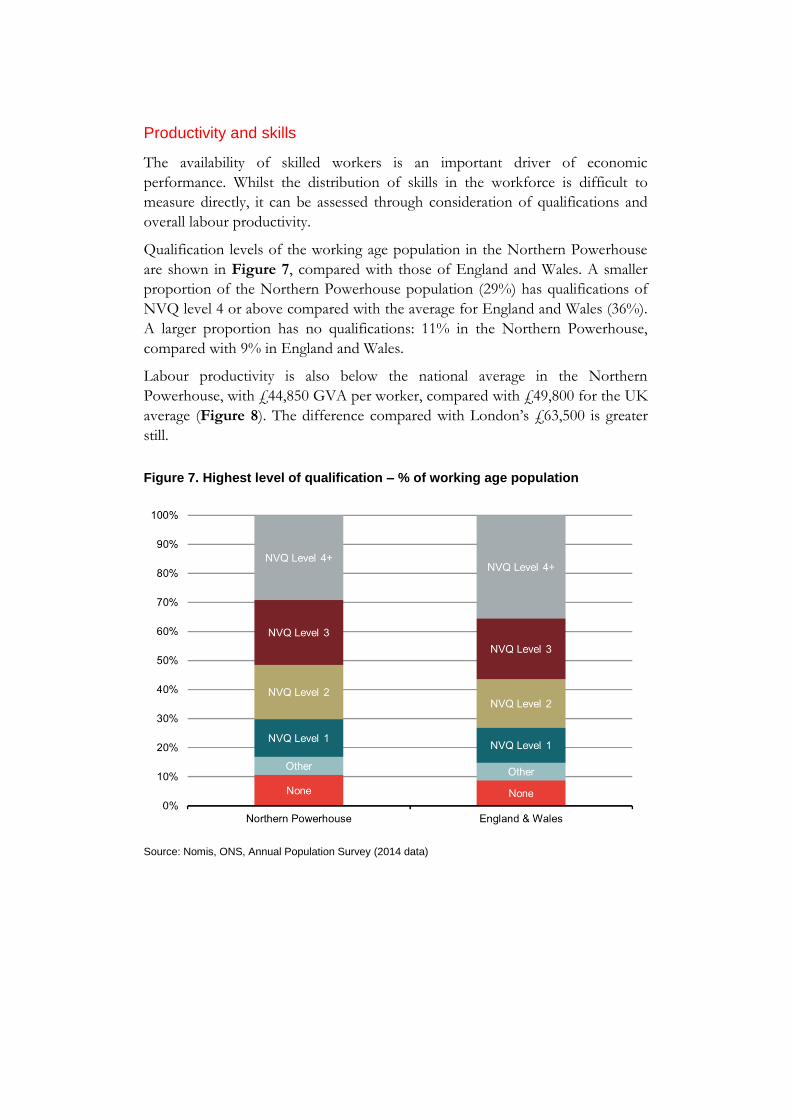
Figure 6. Proportion of GVA by industry 64
Figure 7. Highest level of qualification – % of working age
population 65
Figure 8. Labour productivity – GVA per worker 66
Figure 9. Populations of city regions over time 67
Figure 10. Economic performance of city regions over time (GVA,
£bn) 68
Figure 11. Distribution of jobs across city regions 70
Figure 12. Difference in industries compared to Northern
Powerhouse average 72
Figure 13. Proportion of working age population qualified NVQ
level 4 or above 74
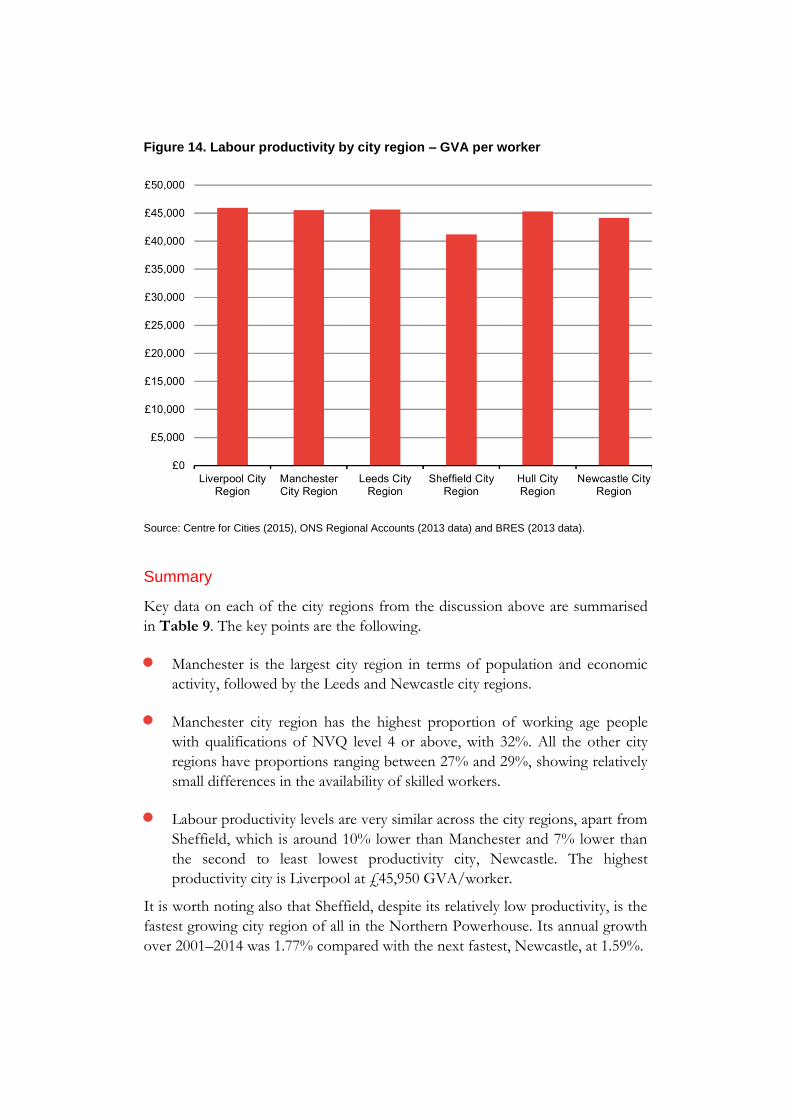
Figure 14. Labour productivity by city region – GVA per worker 75
Figure 15. Northern inter-city train routes and journey times 80
Figure 16. Northern inter-city commuting by rail: number of
people who commute by city (inbound and outbound
commuters combined) 81
Figure 17. Northern inter-city commuting by rail: number of
people who live in one city and commute to a different city 82
Figure 18. Northern inter-city rail routes: speed and frequency of
fast trains 86
Page 6
6 Frontier Economics | March 2016
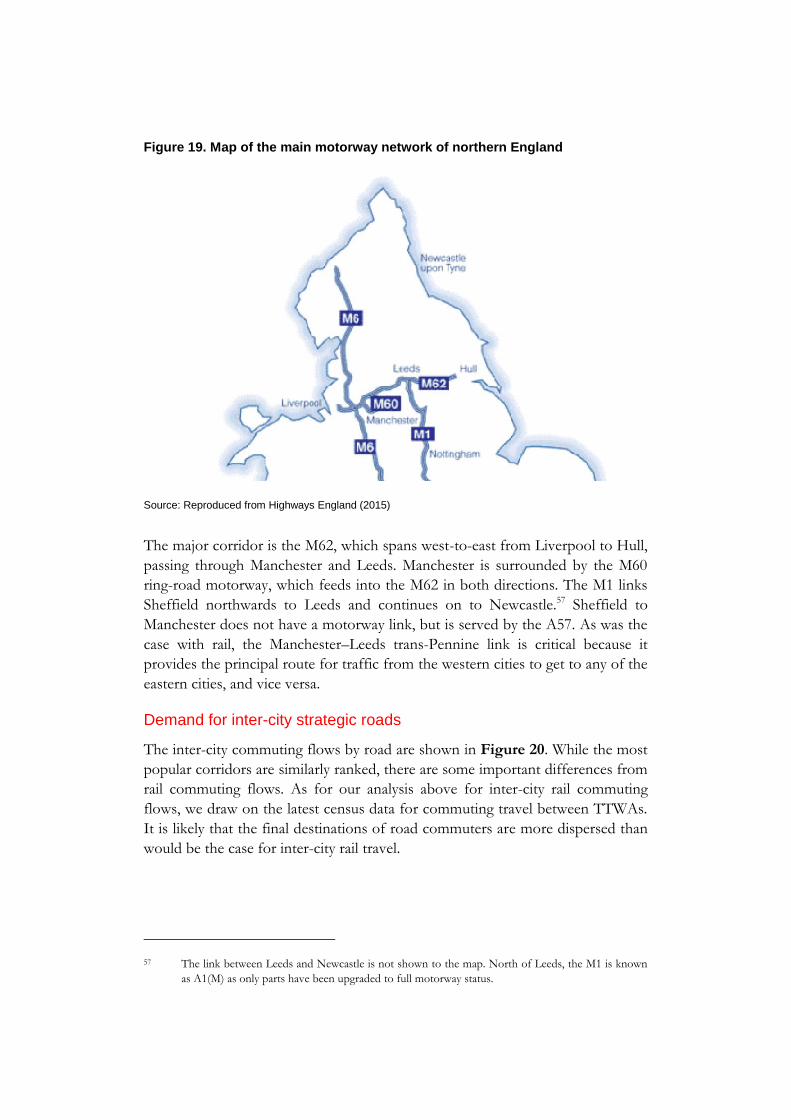
Figure 19. Map of the main motorway network of northern England
89
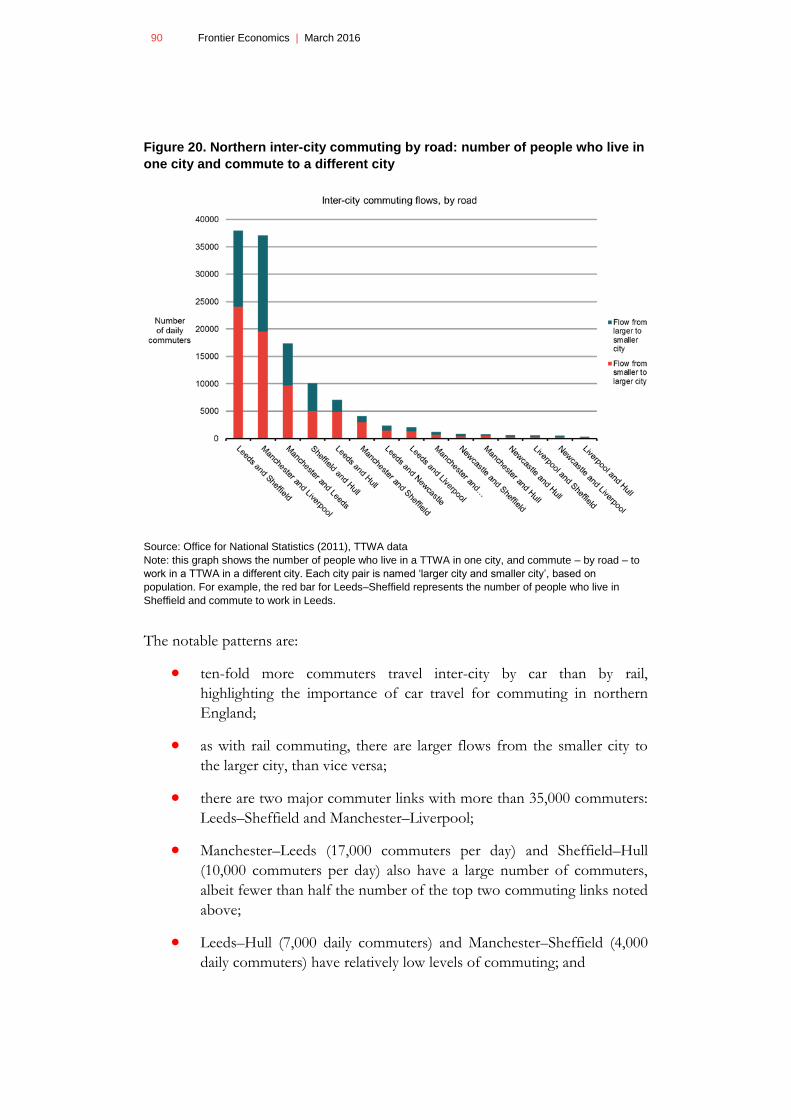
Figure 20. Northern inter-city commuting by road: number of
people who live in one city and commute to a different city 90
Figure 21. Northern inter-city road routes: distance and journey
times 92
Figure 22. Current congestion on the strategic road corridors in
the north of England, 2012–2013 93
Figure 23. Warehousing density in the North (2012) 98
Figure 24. Aspirational rail journey times between Northern cities
106
Figure 25. Modelling total journey times 108
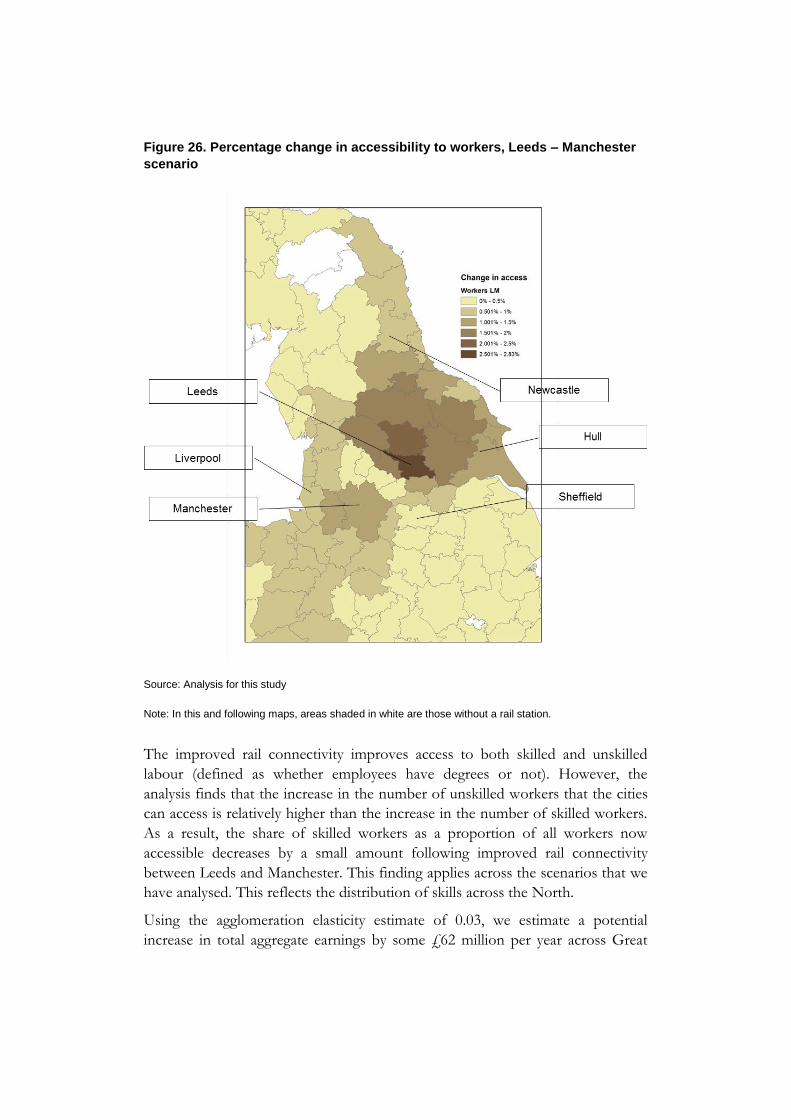
Figure 26. Percentage change in accessibility to workers, Leeds –
Manchester scenario 119
Figure 27. Implied aggregate change in earnings at TTWA level:
Leeds–Manchester cities only linked 121
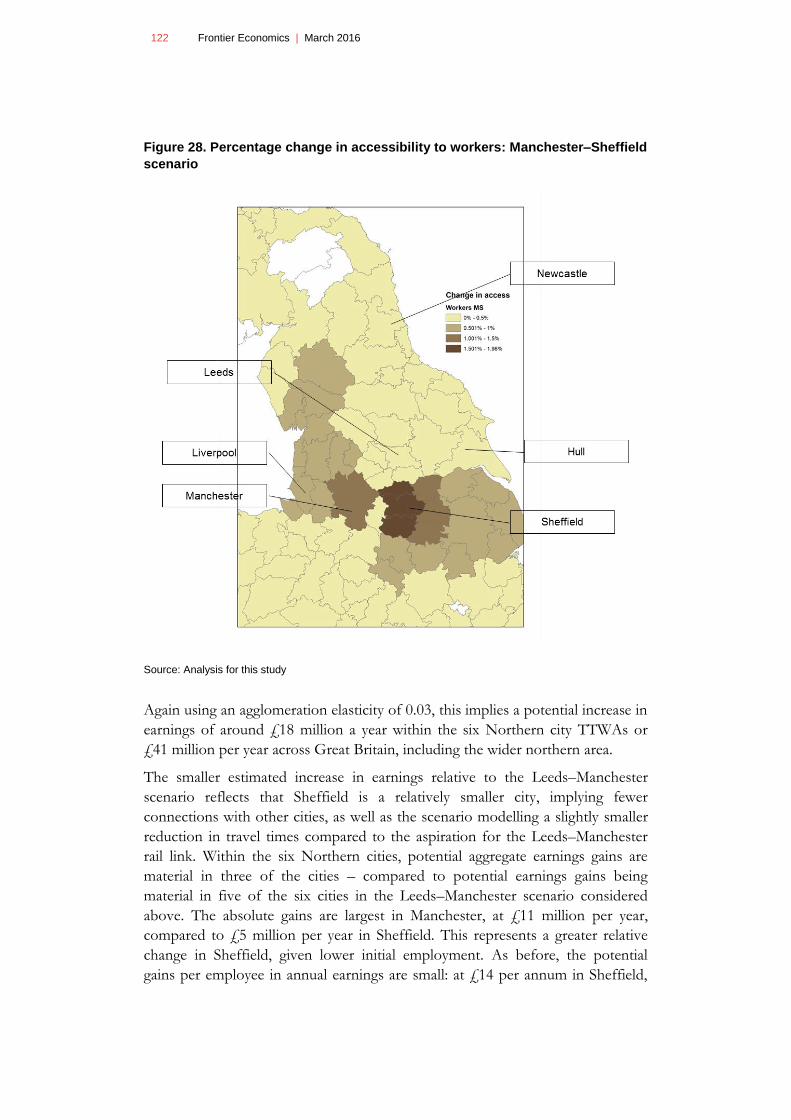
Figure 28. Percentage change in accessibility to workers:
Manchester–Sheffield scenario 122
Figure 29. Implied aggregate change in earnings at TTWA level:
Sheffield–Manchester cities only linked 123
Figure 30. Percentage change in accessibility to workers:
Manchester–Liverpool 124
Figure 31. Implied aggregate change in earnings at TTWA level:
Liverpool–Manchester cities only linked 125
Figure 32. Percentage change in accessibility to workplace
workers: Hull–Leeds scenario 126
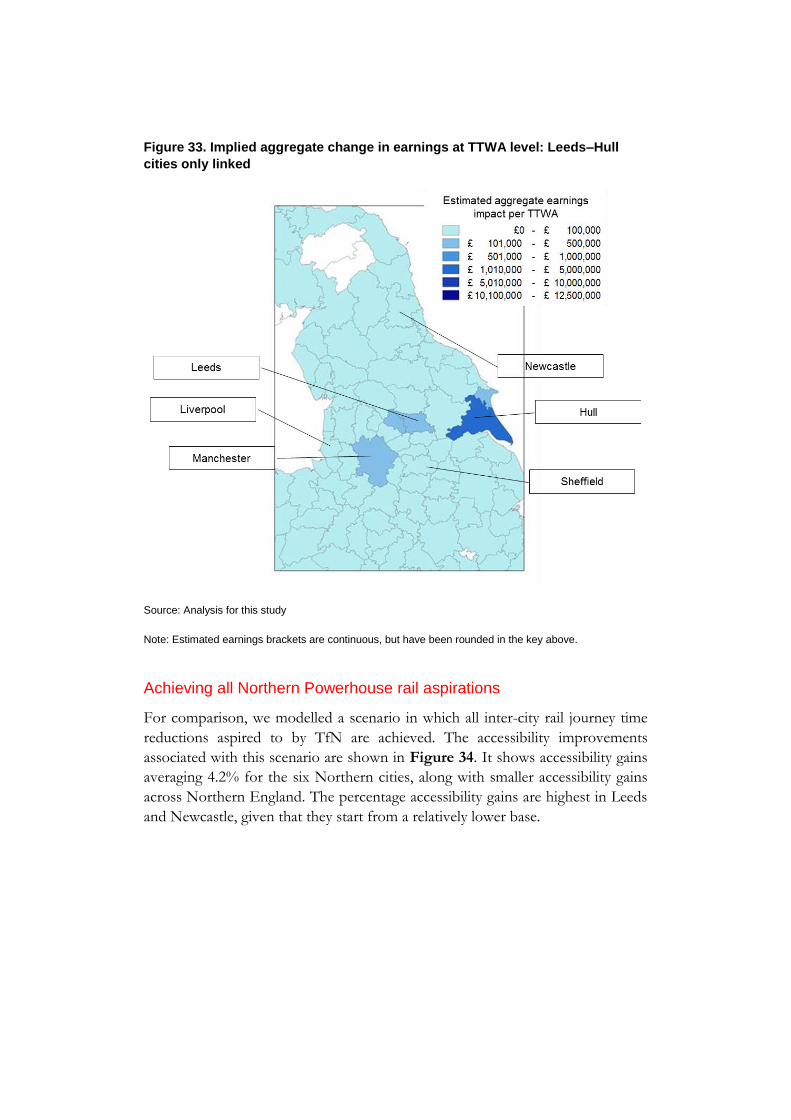
Figure 33. Implied aggregate change in earnings at TTWA level:
Leeds–Hull cities only linked 127
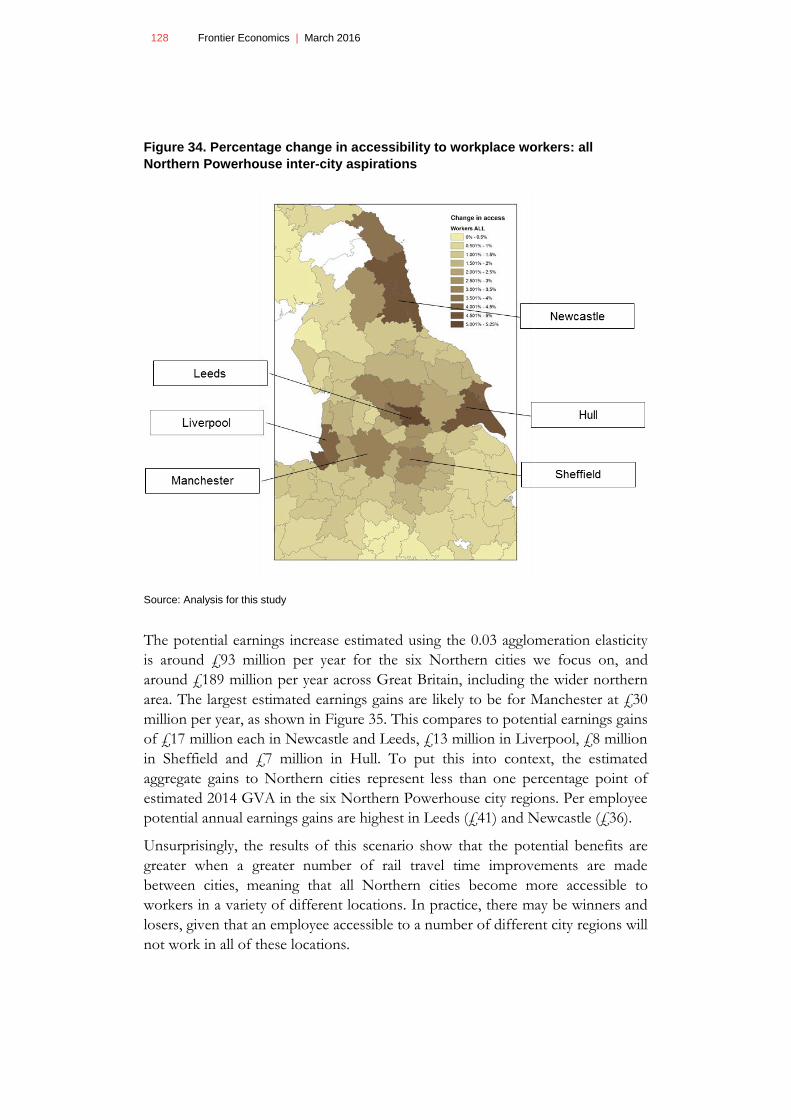
Figure 34. Percentage change in accessibility to workplace
workers: all Northern Powerhouse inter-city aspirations 128
Figure 35. Implied aggregate change in earnings at TTWA level: all
Northern Powerhouse cities linked 129
Figure 36. Understanding the potential role of inter-city transport
connections in enhancing economic performance of the
Northern Powerhouse. 133
Figure 37. Liverpool city region population 144
Page 7
Figure 38. Liverpool city region economy – GVA £bn (2014 prices)
145
Figure 39. Proportion of GVA by industry 146
Figure 40. Manchester city region population 148
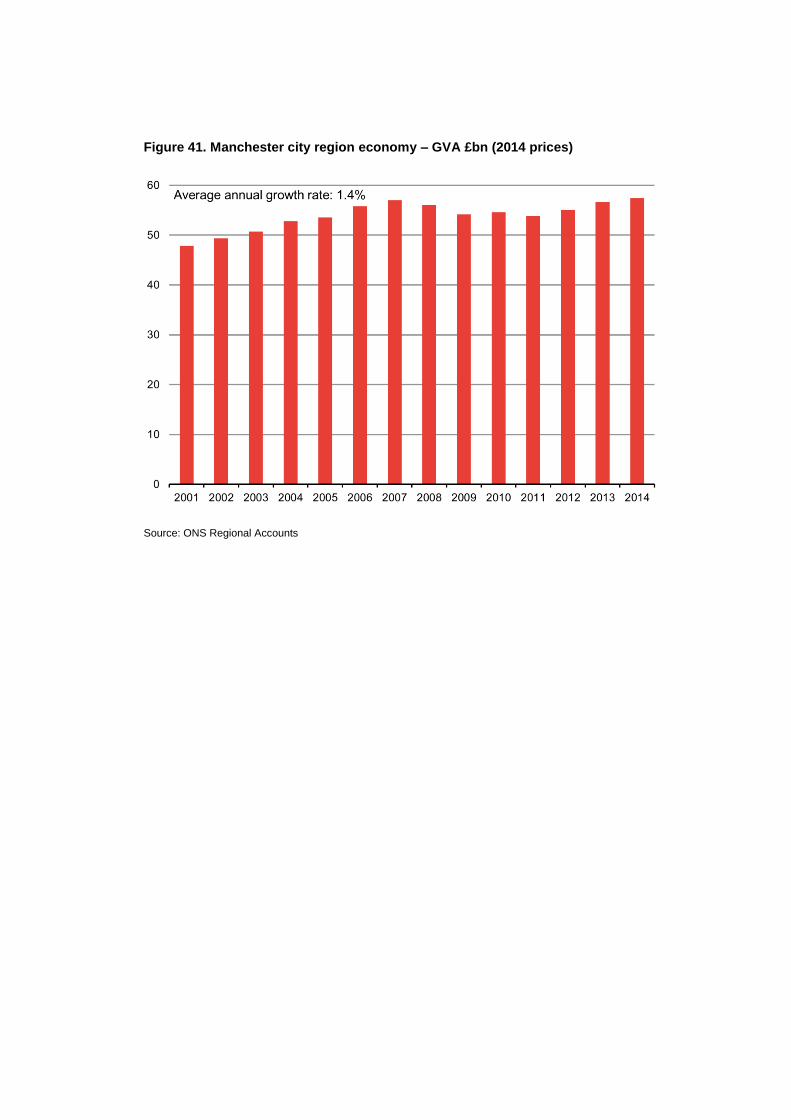
Figure 41. Manchester city region economy – GVA £bn (2014
prices) 149
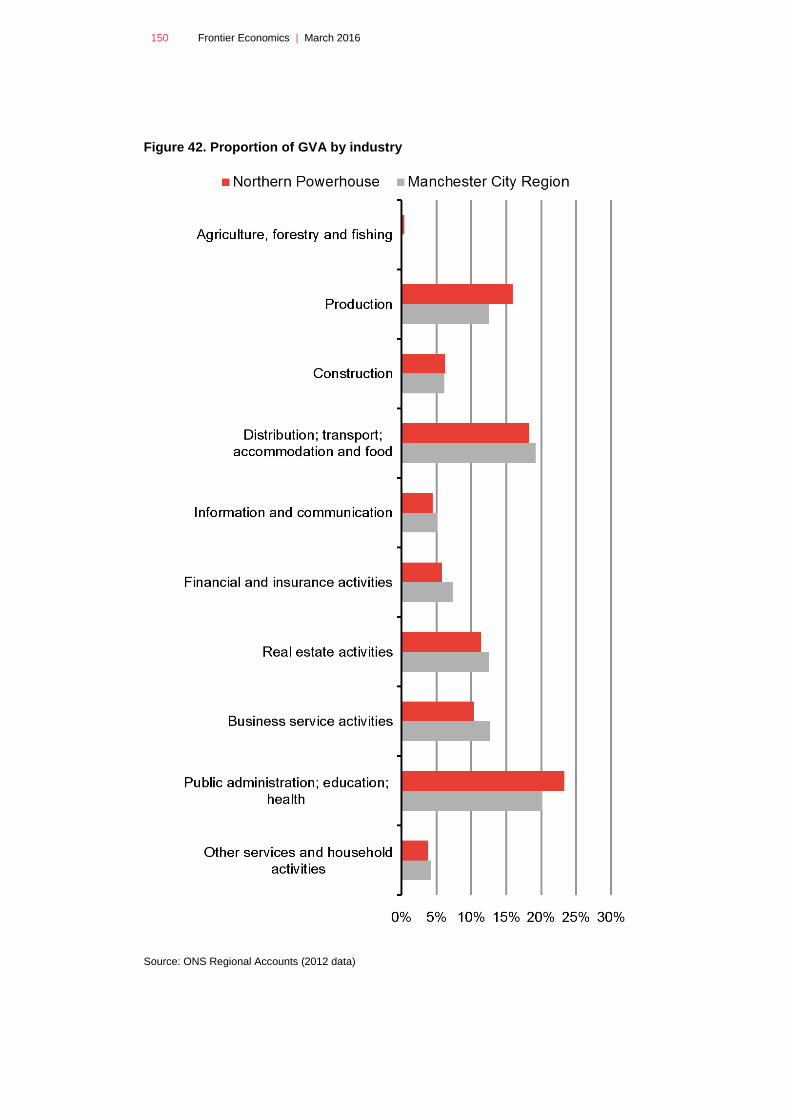
Figure 42. Proportion of GVA by industry 150
Figure 43. Leeds city region population 152
Figure 44. Leeds city region economy – GVA £bn (2014 prices) 153
Figure 45. Proportion of GVA by industry 154
Figure 46. Sheffield city region population 156
Figure 47. Sheffield city region economy – GVA £bn (2014 prices)
157
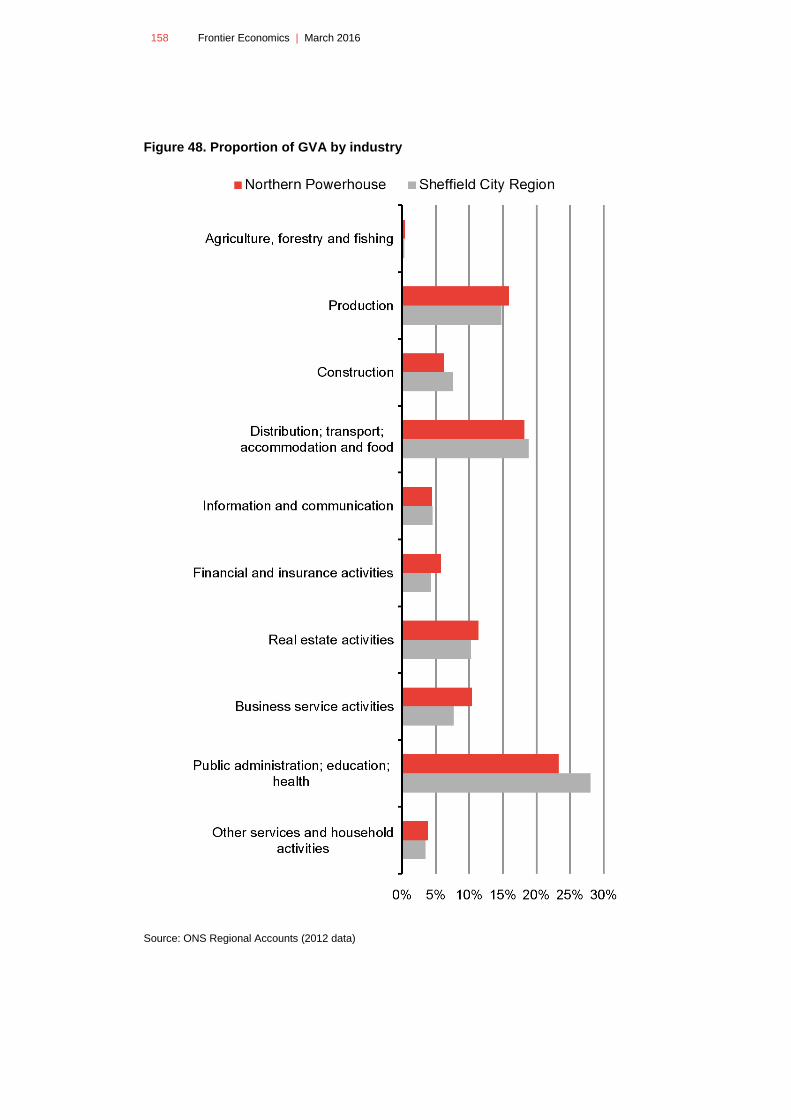
Figure 48. Proportion of GVA by industry 158
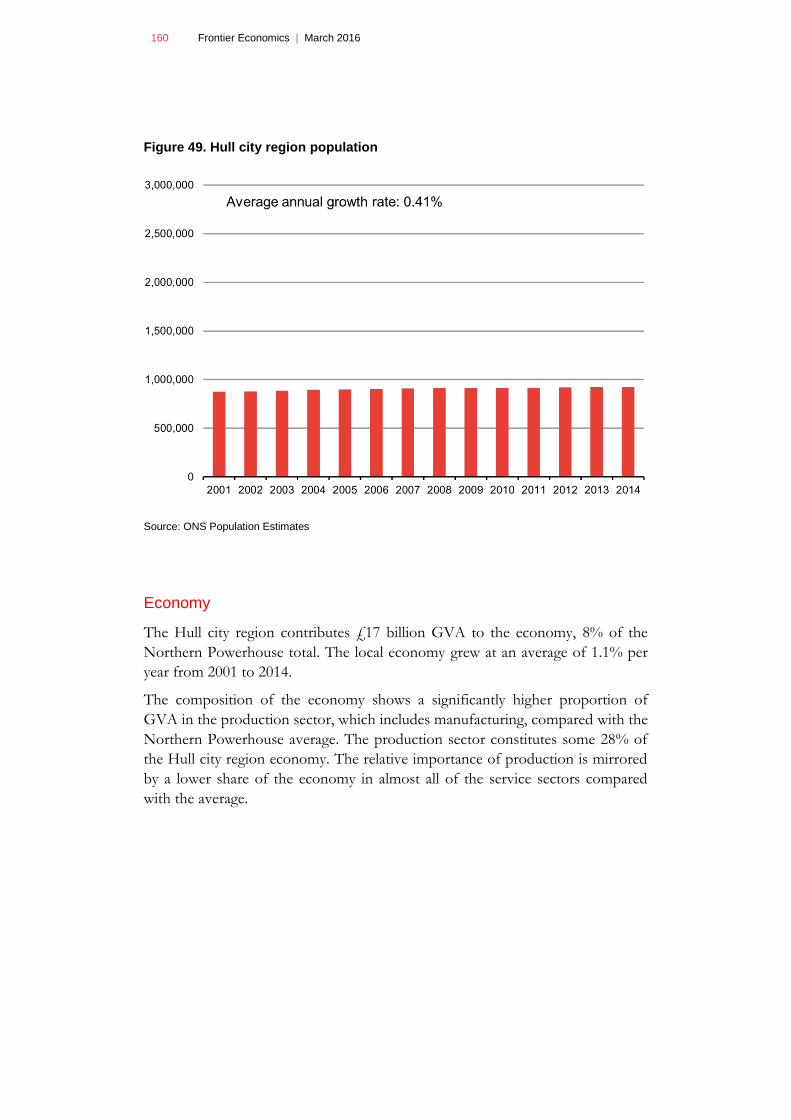
Figure 49. Hull city region population 160
Figure 50. Hull city region economy – GVA £bn (2014 prices) 161
Figure 51. Proportion of GVA by industry 162
Figure 52. Newcastle city region population 164
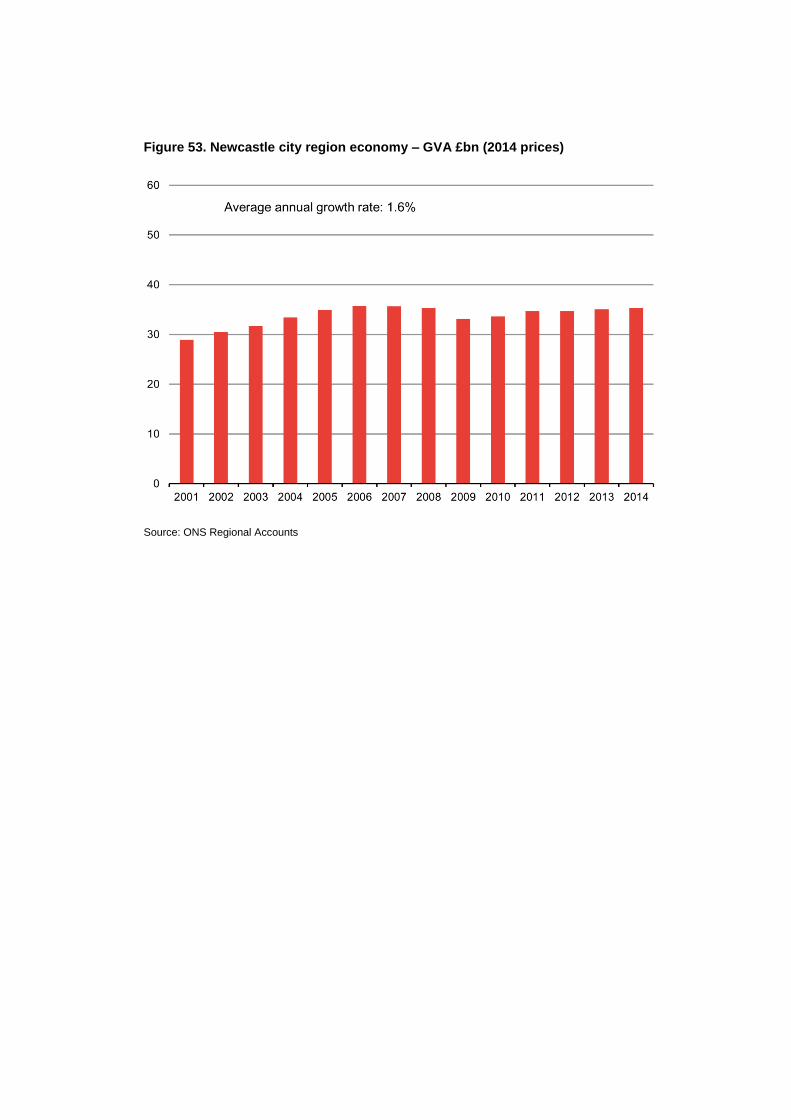
Figure 53. Newcastle city region economy – GVA £bn (2014
prices) 165
Figure 54. Proportion of GVA by industry 166
Figure 55. TfN Aspirational rail journey times between Northern
cities 174
Table 1. Employment and growth aspirations of Northern cities 22
Table 2. Priority areas identified by TfN 26
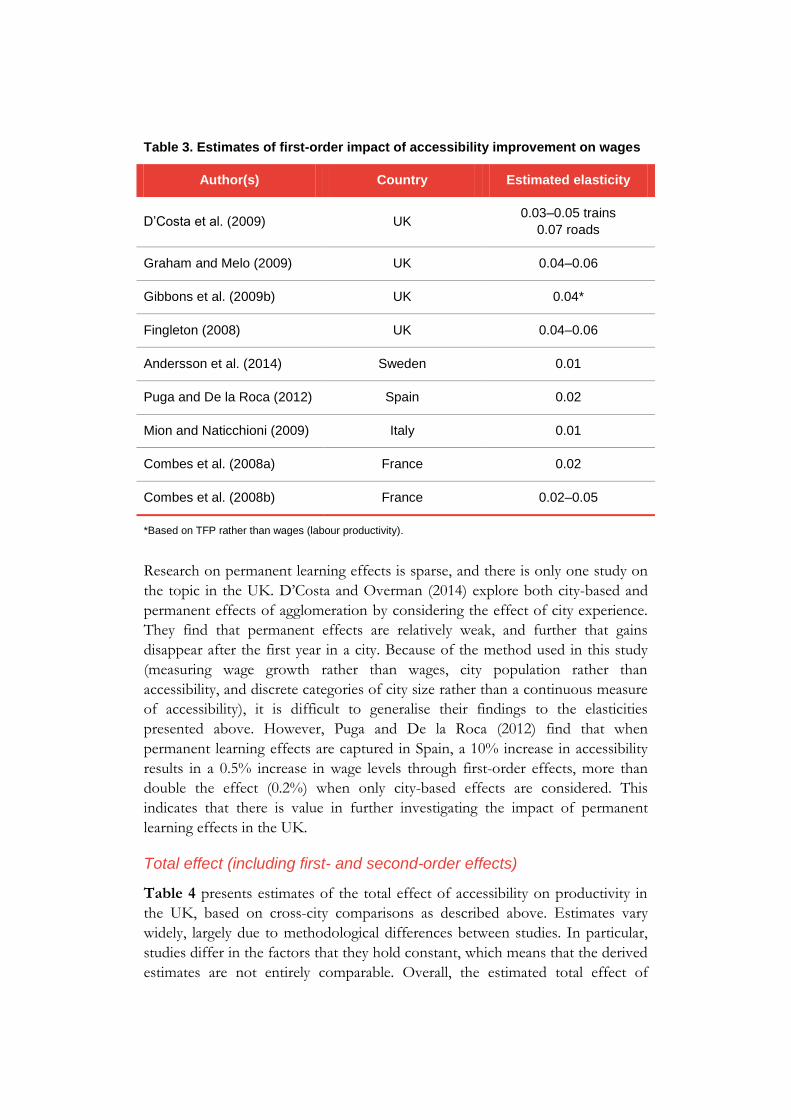
Table 3. Estimates of first-order impact of accessibility
improvement on wages 51
Table 4. Estimates of total impact of accessibility improvement on
wages 53
Table 5. Agglomeration effects across sectors as multiple of
overall effect 56
Table 6. Spatial decay estimates across sectors 58
Page 8
8 Frontier Economics | March 2016
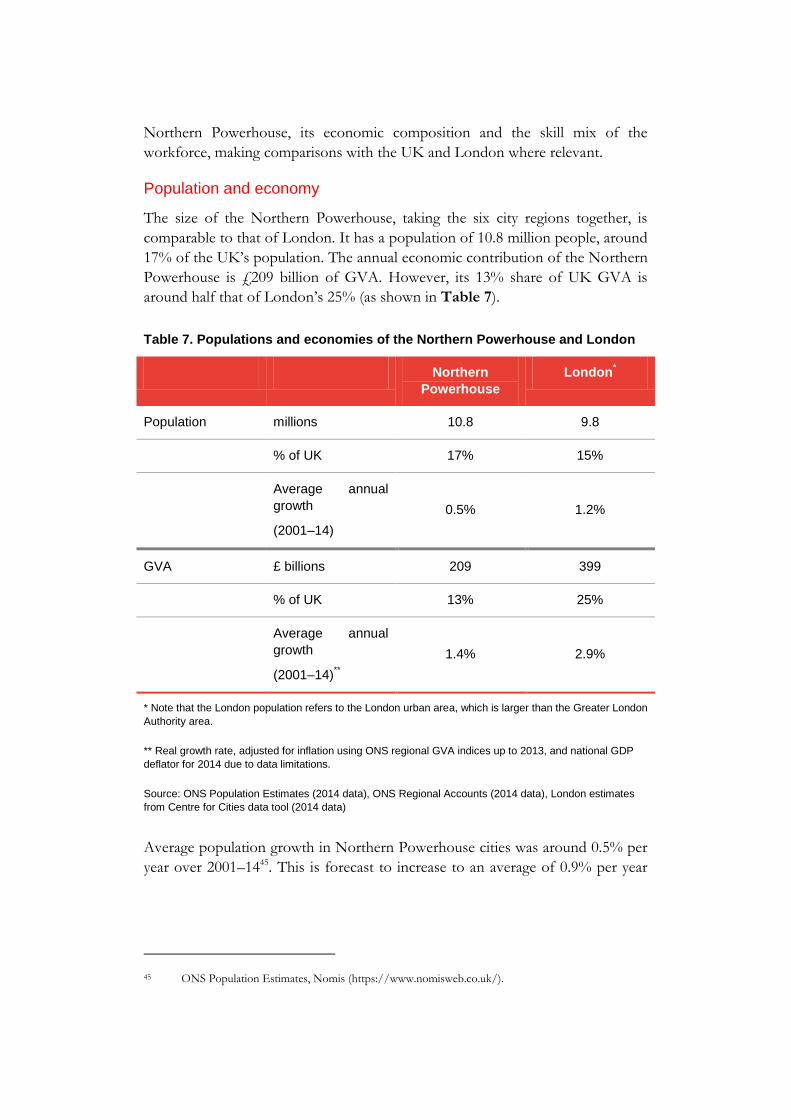
Table 7. Populations and economies of the Northern Powerhouse
and London 61
Table 8. Number of jobs in city regions (2013) 70
Table 9. Summary of city region characteristics 76
Table 10. Busiest stations in Northern Powerhouse cities, by
number of entries and exits in 2014–15 84
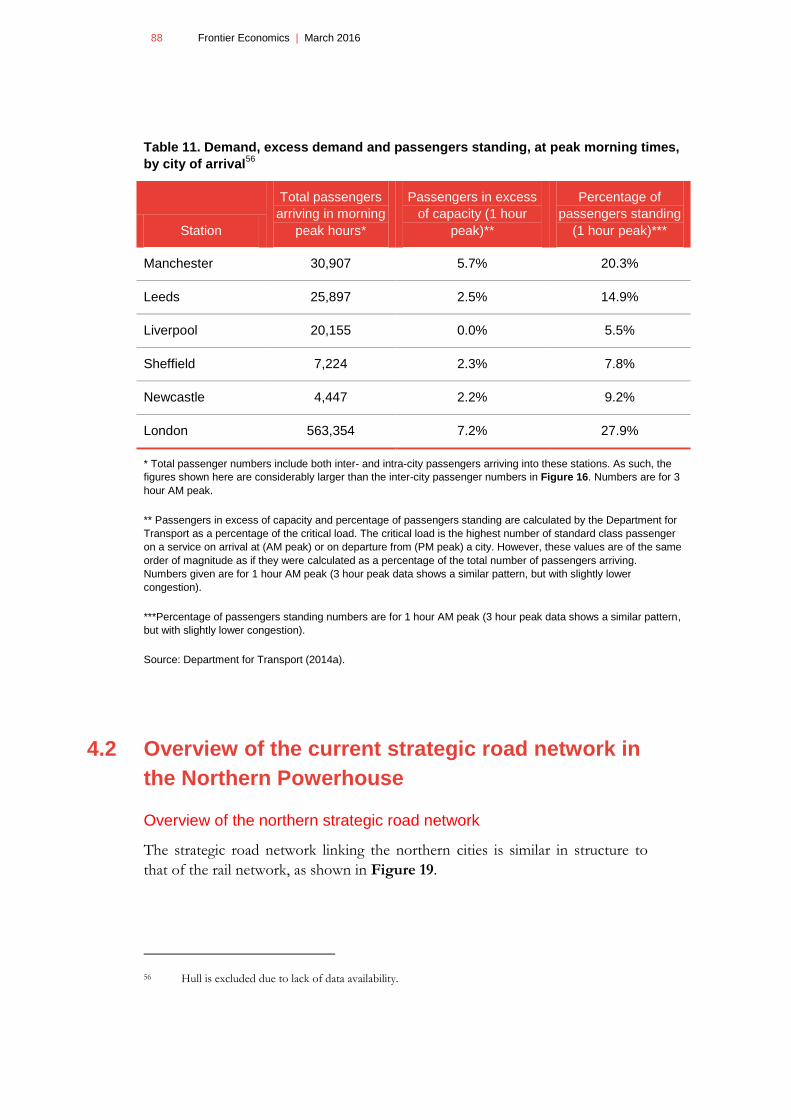
Table 11. Demand, excess demand and passengers standing, at
peak morning times, by city of arrival 88
Table 12. Estimated intra-city journey times (minutes) 109
Table 13. Estimated baseline inter-city journey times (minutes) 110
Table 14. Estimated baseline journey times (minutes) 112
Table 15. Scenario analysis results 117
Table 16. Liverpool city region productivity and qualifications 147
Table 17. Manchester city region productivity and qualifications
151
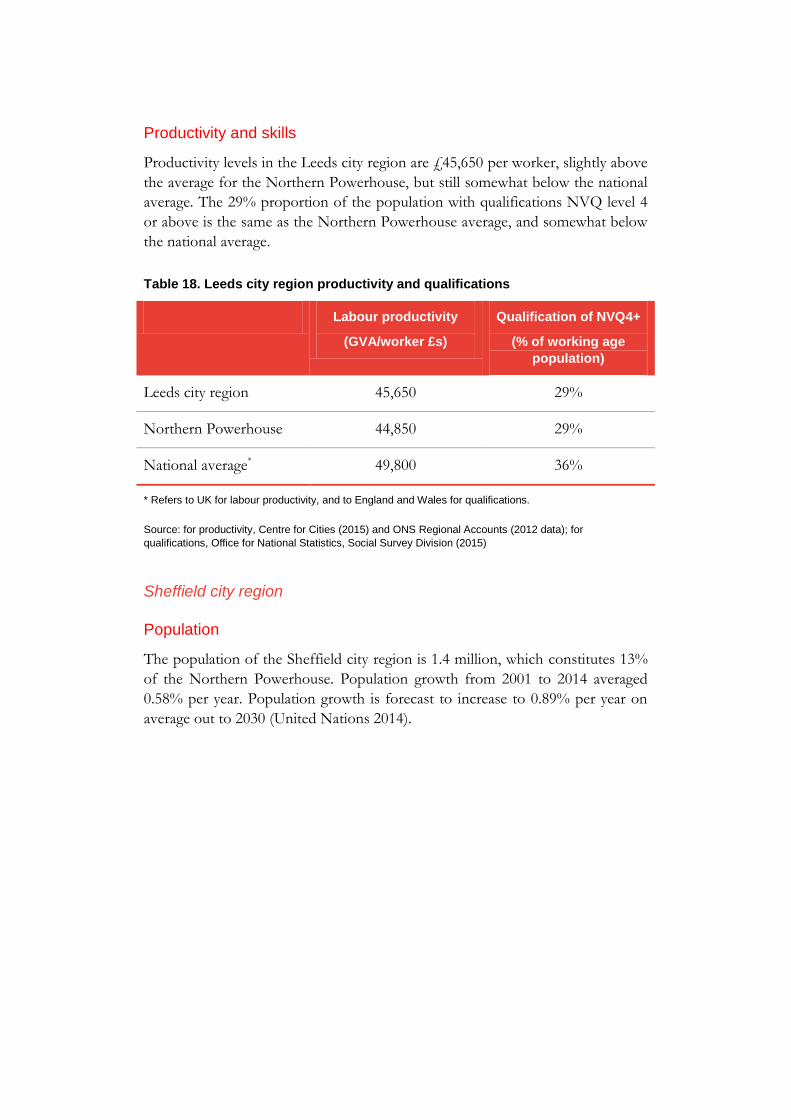
Table 18. Leeds city region productivity and qualifications 155
Table 19. Sheffield city region productivity and qualifications 159
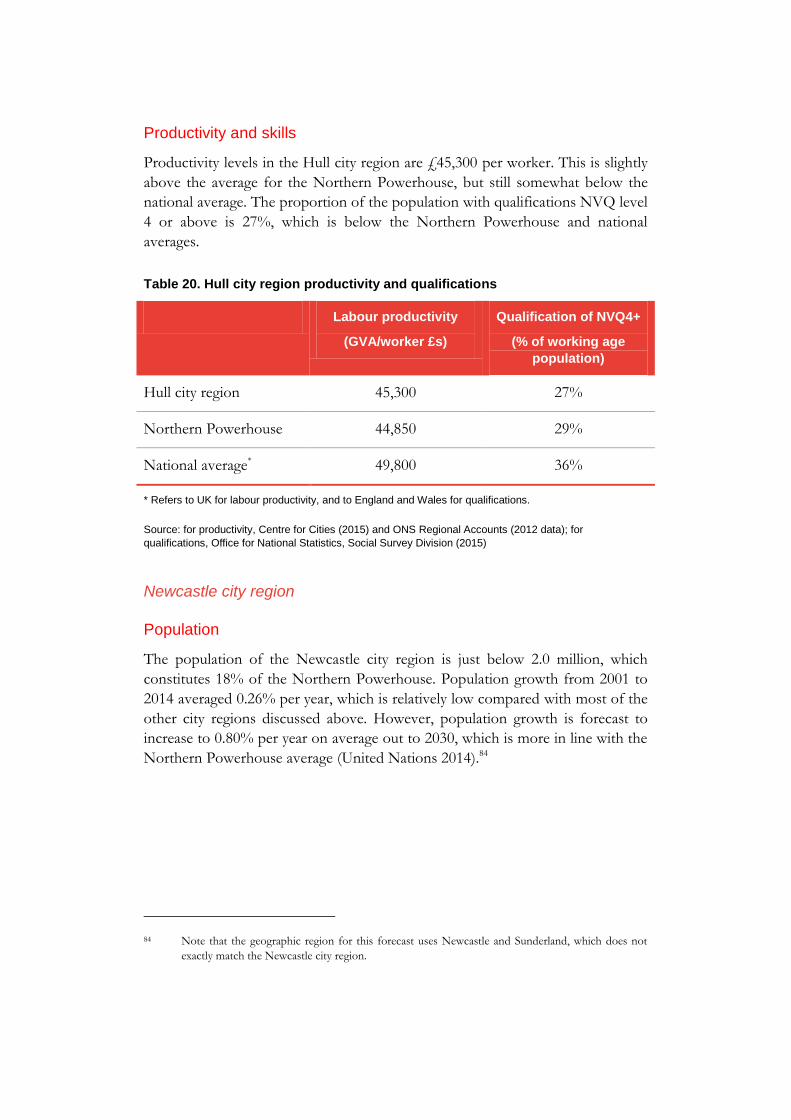
Table 20. Hull city region productivity and qualifications 163
Table 21. Newcastle city region productivity and qualifications 167
Table 22. Gravity of inter-city LA-LA commuting flows 168
Table 23. Predicted versus actual commuting flows (second
stage) 169
Table 24. Aspirational station-station journey times (all in
minutes) 175
Table 25. Station-station travel times under various scenarios (all
in minutes) 175
Table 26. TTWA travel time matrix for 6 key Northern Powerhouse
cities, under baseline and ‘All aspirations’ scenarios (All
times in minutes) 176
Page 9
Executive summary
This report for the UK’s National Infrastructure Commission explores the
following question:
‘Is there a role for improved inter-city transport connections to contribute
to the economic performance of the Northern Powerhouse?
If so:
(i) what is the potential scale of productivity impacts?
(ii) what are the conditions under which these impacts are likely to
be comparatively greater?’
To address the question robustly, we have drawn together the best available
evidence, both theoretical and empirical. We have complemented this with new
analysis, making clear our assumptions and appropriate interpretation. We remain
open about the current gaps in knowledge and where uncertainties remain.
This report reflects the forefront of thinking on these issues and seeks to advance
the current knowledge and evidence base in a transparent way. We are grateful
for the input and oversight of Professor Stephen Gibbons – Director of the
Spatial Economics Research Centre at the London School of Economics; and for
the modelling support of Stephen Law at the Bartlett Space Syntax Laboratory,
University College London.
Key findings
To address our overarching question, we have investigated a number of sub-
questions, as shown in Figure 1. Overall, we have several key findings for policy
makers:
Improving inter-city transport connections is able to create an opportunity
to boost economic performance, especially where investment is targeted on
links where there is scope both to unlock transport constraints, and to drive
enhanced economic performance (subject to other conditions being in
place).
Inter-city transport improvements can unlock gains in productivity
particularly where investments are targeted on routes demonstrating signs of
current and future congestion and overcrowding; and are heavily used by
commuters, freight and business travellers.
The importance of unlocking the economic potential of transport routes
heavily used by freight in the north must be noted given the substantial
planned investments in ports (such as Liverpool, Hull and Newcastle) and
Page 10
10 Frontier Economics | March 2016
the importance of surface access to international airports, such as
Manchester Airport, and other regional airports.
The extent to which inter-city transport connections are able to drive
economic performance will crucially depend on the following.
Other drivers of economic performance. Transport improvements
can only increase access to skills if there are workers with those skills
within reach. Investing in skills of the labour force is critical.
Likewise, other economic drivers (housing, amenities, etc.) must be
sufficient and complementary.
Intra-city connections. Gains from inter-city connectivity can only be
fully realised if the door-to-door journey is taken into account.
Therefore, within-city travel must be adequate to cope with current and
new journeys that are associated with vibrant and growing economic
centres.
Policy makers may therefore wish to focus attention on inter-city
connections in which the following characteristics are present.
Large and fast growing cities. The scale of potential to deliver gains
in absolute economic performance (overall earnings) is likely to be
greater for large and fast growing cities.
High and intermediate skills. There is considerable evidence that
gains from accessibility are greater for workers with higher, or
intermediate, skills levels.
Relatively high shares of sectors for which face-to-face or
business-to-business contacts are important. Producer services
(which include finance, insurance, real estate and consulting services)1
and transport services are most amenable to gains from accessibility
improvements.
Cities already relatively closer together (in terms of travel times).
The benefits of increased accessibility decline rapidly with travel time
from source, particularly for service sectors.
Adequate intra-city connections. Inter-city links are only ever going
to be part of a journey. The overall change in accessibility depends on
door-to-door journey times so intra-city connections must be adequate.
1 SIC codes 65 to 745.
Page 11
Overview of our approach
Our approach is described in Figure 1. We have addressed each question in turn,
as described below.
Figure 1. Understanding the potential role of inter-city transport connections in
enhancing economic performance of the Northern Powerhouse.
1. What are the aspirations for economic performance in the Northern
city regions?
Historically, there has been a productivity gap between the North and South of
England – particularly when compared to productivity performance in London
and the South East. GVA growth in the Northern Powerhouse region2 has been
below the UK average over the past 10 years, and its productivity (when
measured in terms of GVA per worker) is 29% below productivity in London
(Centre for Cities 2015).
The Northern Powerhouse policy agenda aims to address the economic
performance gap between the North and the South to contribute to a spatial
rebalancing of economic activity in the UK (Osborne 2015). More specifically,
the aim of Transport for the North (TfN) is “…for economic growth in the
North to be at least as high as the rest of the country, to complement and act as a
balance to the economic weight of London.” Alongside detailed plans being
developed by the Northern city regions, improving transport connections is seen
2 For the purposes of our analysis, we assume that the Northern Powerhouse includes the six
Northern city regions of Hull, Leeds, Liverpool, Manchester, Newcastle and Sheffield. These are the
city regions whose work is being taken forward by TfN.
Is there a role for improved inter-city transport connections to contribute to the economic
performance of the Northern Powerhouse? If so, what is the potential scale of impacts and
what are the conditions under which these impacts are likely to be comparatively greater?
What are the
aspirations for
economic
performance
in the
northern city
regions?
What do we
know about
the drivers of
economic
performance,
and the role
of inter-city
transport
connections?
Where are
the
opportunities
for inter-city
transport
improvements
to contribute
to economic
performance
likely to be
comparatively
greater?
What
potential
scale of
opportunity
could be
created
through
improved
inter-city
connectivity in
the north?
What does
this suggest
for policy
makers?
1 2 3 4 5
Chapter 1 Chapter 2Chapters 3
and 4Chapter 5 Chapter 6
Page 12
12 Frontier Economics | March 2016
as one of the important components to achieving this ambition. TfN notes that
“…a transformation in connections between the great cities of the North and
beyond will enable them to increase their productivity to meet the levels currently
only seen in London and the South East.” (Transport for the North 2015a).
The analysis in this report therefore focuses on the potential contribution of
improved inter-city connections in particular. However, as we describe below,
opportunities to boost economic performance can only be fully realised if
other drivers of economic performance are adequate and complementary.
2. What do we know about the drivers of economic performance?
The evidence is clear that there are a range of factors that drive economic
performance. Each driver is likely to be necessary, though not sufficient by itself,
for fully realising opportunities. The drivers include the labour market and skills,
infrastructure, the business environment, innovation and quality of place.
Transport resides in the infrastructure driver. Interventions that enhance
transport can create opportunities to improve economic performance in two
particular ways, as shown in Figure 2.
Figure 2. Transport interventions and economic performance
As Figure 2 shows, transport has a role in the following:
Transport
improvements
Driving growth
Economic
growth
Sharing common resources
Scale and specialisation
Matching workers and firms
Learning (knowledge spillovers)
First-order effects:
Attracting high-skilled workers
Investing in education and skills
Business investment
Second-order effects:
Other infrastructure
Labour markets and skills
Business environment
Innovation
Quality of place
Other drivers of growth:
Travel time
savings
Unlocking growth
Agglomeration
Removing
constraints
Page 13
Unlocking growth. Transport infrastructure can remove bottlenecks and
unlock the economic potential of other drivers of growth.
Driving growth. Transport can stimulate the economy by bringing people,
firms and places effectively closer together and generate ‘agglomeration
benefits’ which directly increase productivity. These are created through:
First-order effects. Agglomeration increases the productivity of the
existing stock of workers and firms, by enabling scale and specialisation,
better matching among workers and firms, and learning and knowledge
spillovers. First-order effects increase productivity holding the
composition of the economy (workers and firms) constant. Therefore,
they are not particularly dependent on other drivers of economic
performance.3
Second-order effects. High-skilled workers and investment can be
attracted into an area in response to the reduced travel times and
associated rise in wages and returns to investment. This changes the
economic composition of the area and adds to economic performance.
To realise the potential for inter-city transport connections to contribute to
economic performance, there are three critical factors to consider:
i. Other growth drivers must be adequate and complementary:
transport improvements alone will not be sufficient. For example,
quality housing and amenities are needed to attract high-skilled workers
to the area, and a favourable business environment is needed to increase
investment.
ii. Intra-city transport networks are important to realising the growth
opportunity: improved inter-city travel could increase flows into the city
centre. If those central networks become congested then the potential
accessibility gains could be eroded.
iii. Impacts over time imply movement of businesses and workers.
There is the potential for some areas to gain (if productive workers move
in) at the expense of other areas (if productive workers move away), yet
there is little evidence to suggest the scale or direction of such changes.
3 However, to the extent that improvements in inter-city transport connectivity increase traffic flows,
it may be necessary to invest in intra-city transport networks to ensure that congestion does not
occur (because congestion could erode any improvement in door-to-door journey times).
Page 14
14 Frontier Economics | March 2016
3. Where are the opportunities for inter-city transport improvements to
contribute to economic performance likely to be comparatively greater?
The identification of transport corridors that can create greater opportunities for
boosting economic performance will depend on how we see the role of transport
in promoting economic performance.
To unlock growth: Our analysis of transport performance suggests the
following.
The links with the highest commuter demand are those between
Manchester and Liverpool (road and rail), Manchester and Leeds (for
rail only), and Leeds and Sheffield (road and rail). In each case, flows in
the morning peak are relatively greater from the smaller to the larger
city, reflecting travel to dense employment centres. Lower than
expected travel flows along certain corridors may also indicate transport
constraints.
The greatest pressures on the strategic road network are on the M62
between Liverpool and Manchester, and also between Manchester and
Leeds; on the M60 around Manchester; on the M1 near Sheffield; on
the M6 leading into Manchester; and, on the A1(M) near Newcastle. On
the rail network, the greatest (morning peak) pressures are on services
into Manchester and Leeds.
Key freight routes, particularly those around ports attracting new
investments, such as Liverpool and Hull, are likely to experience
significant increases in traffic. The M62 is a critical freight link (freight is
around 40% of traffic).
Commuter flows between Manchester and Sheffield, and between
Manchester and Hull, are significantly lower than expected given the
characteristics of the cities and the distance between them. This may
indicate the existence of transport constraints.
To drive growth: The greatest comparative opportunity for driving
economic performance through inter-city transport improvements is on
connections between cities that have the following characteristics:
Large and fast growing cities. The potential gain in overall earnings is
likely to be greater by improving connections between large and fast-
growing cities simply because of the volume of workers who would
benefit from that boost in productivity. Cities with the largest numbers
of jobs are Manchester, Leeds and Newcastle.
High and intermediate skills. There is considerable evidence that
productivity gains associated with improved accessibility are greater for
Page 15
workers with high, or intermediate, skills levels. Productivity levels in
terms of GVA/worker vary across the city regions. For example,
Liverpool, Manchester and Leeds (which have the highest levels of
productivity) have GVA/worker which is around 11–12% higher than
Sheffield (which has the lowest level of productivity).
Relatively high shares of sectors for which face-to-face or
business-to-business contacts are important. Producer services
(which include finance, insurance, real estate and consulting services)4
and transport services are most amenable to gains in accessibility and
associated increases in earnings. The Manchester and Leeds city regions
have higher proportions of their economies in producer services than
the Northern Powerhouse average.
Cities already relatively closer together (in terms of travel times).
The benefits of increased accessibility decline rapidly with the travel
time from the source, particularly for service sectors. We note that
Liverpool–Manchester (fastest time of 32 minutes by rail) and Leeds–
Sheffield (fastest time of 40 minutes by rail) are closer together than the
connections between the remainder of the six city regions: for example,
Manchester–Sheffield, 48 minutes; Hull–Leeds, 55 minutes; Hull–
Sheffield, 86 minutes; Newcastle–Leeds, 87 minutes; and Leeds–
Manchester, 49 minutes.
4. What scale of opportunity could be created through improved inter-
city connectivity in the North?
We have carried out analysis of the changes in access to workers (‘accessibility’)
associated with improving rail travel times between the travel to work areas
(TTWAs) around major Northern cities5. We consider scenarios of improved rail
times between four city pairs plus a scenario in which all inter-city rail journey
times improve, all in line with TfN aspirations6.
Our findings are consistent with the notion that relative gains in earnings are
likely to be greater when improving connections between larger and more
productive (higher skilled) cities with relatively shorter travel times between
them.
4 SIC codes 65 to 745.
5 The equivalent analysis using road travel times was not possible in the timeframe of this study.
6 See Chapter 5 for the detail.
Page 16
16 Frontier Economics | March 2016
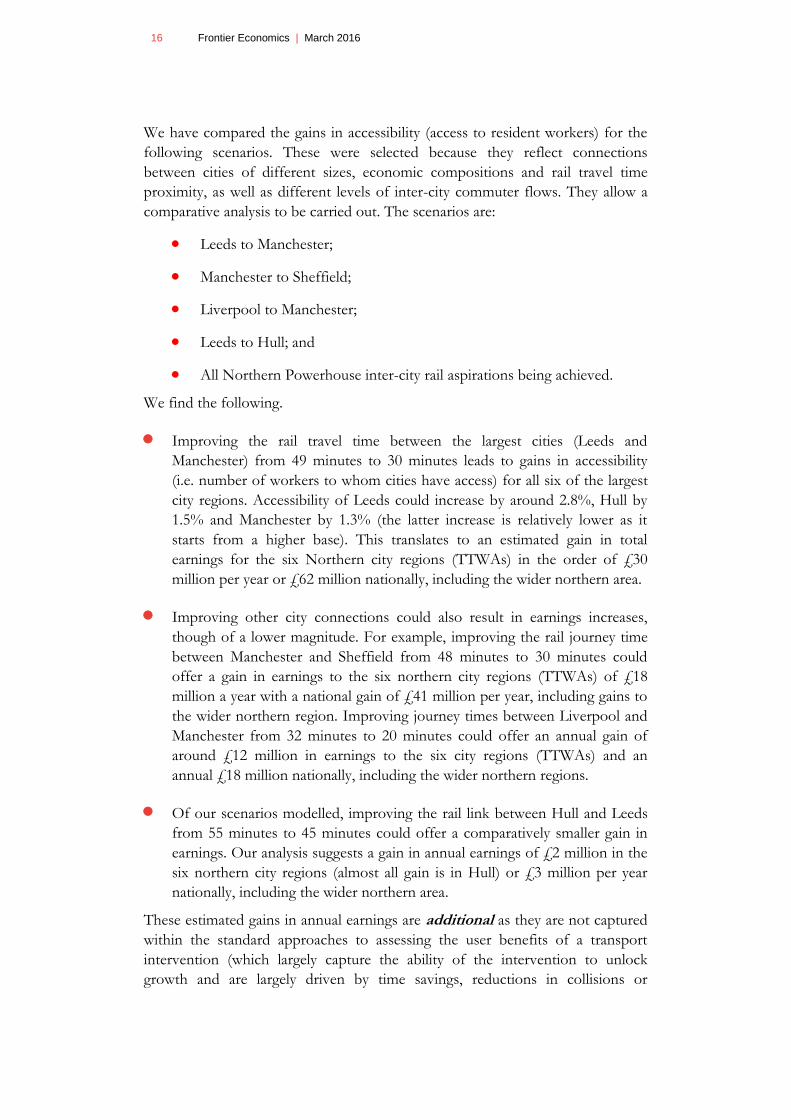
We have compared the gains in accessibility (access to resident workers) for the
following scenarios. These were selected because they reflect connections
between cities of different sizes, economic compositions and rail travel time
proximity, as well as different levels of inter-city commuter flows. They allow a
comparative analysis to be carried out. The scenarios are:
Leeds to Manchester;
Manchester to Sheffield;
Liverpool to Manchester;
Leeds to Hull; and
All Northern Powerhouse inter-city rail aspirations being achieved.
We find the following.
Improving the rail travel time between the largest cities (Leeds and
Manchester) from 49 minutes to 30 minutes leads to gains in accessibility
(i.e. number of workers to whom cities have access) for all six of the largest
city regions. Accessibility of Leeds could increase by around 2.8%, Hull by
1.5% and Manchester by 1.3% (the latter increase is relatively lower as it
starts from a higher base). This translates to an estimated gain in total
earnings for the six Northern city regions (TTWAs) in the order of £30
million per year or £62 million nationally, including the wider northern area.
Improving other city connections could also result in earnings increases,
though of a lower magnitude. For example, improving the rail journey time
between Manchester and Sheffield from 48 minutes to 30 minutes could
offer a gain in earnings to the six northern city regions (TTWAs) of £18
million a year with a national gain of £41 million per year, including gains to
the wider northern region. Improving journey times between Liverpool and
Manchester from 32 minutes to 20 minutes could offer an annual gain of
around £12 million in earnings to the six city regions (TTWAs) and an
annual £18 million nationally, including the wider northern regions.
Of our scenarios modelled, improving the rail link between Hull and Leeds
from 55 minutes to 45 minutes could offer a comparatively smaller gain in
earnings. Our analysis suggests a gain in annual earnings of £2 million in the
six northern city regions (almost all gain is in Hull) or £3 million per year
nationally, including the wider northern area.
These estimated gains in annual earnings are additional as they are not captured
within the standard approaches to assessing the user benefits of a transport
intervention (which largely capture the ability of the intervention to unlock
growth and are largely driven by time savings, reductions in collisions or
Page 17
accidents or reduced overcrowding). Agglomeration impacts would be expected
to form just one part of any assessment of the benefits of a transport
intervention. Investment decisions should be informed by an assessment of all
anticipated costs and benefits of an intervention. An assessment of the costs and
benefits is beyond the scope of this particular study but any productivity gains
would need to be considered alongside other economic impacts, environmental
considerations (such as emissions or landscape impacts) and social effects.
This analysis is based on a number of assumptions as described in Chapter 5.
5. What does this suggest for policy makers?
There are some emerging findings that are relevant and important for policy
makers as they seek to boost the economic performance of the North. As noted
at the start of this summary, our findings are the following:
Improving inter-city transport connections is able to create an opportunity
to boost economic performance, especially where investment is targeted on
links where there is scope both to unlock transport constraints, and to drive
enhanced economic performance (subject to other conditions being in
place).
To unlock the gains in economic performance from improved inter-city
connections, investment should be targeted on routes demonstrating signs
of current and future congestion and overcrowding; and heavily used by
commuters, freight and business travellers.
The importance of relieving constraints on routes heavily used by freight
must be noted given the substantial planned investments in ports (such as
Liverpool, Hull and Newcastle) and the importance of surface access to
international airports, such as Manchester Airport, and other regional
airports.
The extent to which inter-city transport connections are able to drive
economic performance will crucially depend on whether other economic
drivers are sufficient and complementary; and if intra-city connections are
adequate.
Policy makers may therefore wish to focus attention on inter-city
connections in which the following characteristics are present.
Large and fast growing cities.
Prevalence of high and intermediate skills.
Page 18
18 Frontier Economics | March 2016
Relatively high shares of sectors for which face-to-face or business-to-
business contacts are important.
Cities already relatively closer together (in terms of travel times).
Adequate intra-city connections.
.
Page 19
Chapter 1: The policy context
Chapter overview
In this chapter, we provide an overview of the strategic policy context in
Northern England. This forms the backdrop against which investing in
improving connectivity between cities in the North can be considered.
In the following sections, we set out the motivations for, and aspirations of, the
Northern Powerhouse policy, current economic growth aspirations in Northern
cities, aspirations for transport system investment in the North, and the role of
devolution. We analyse local economic geography and transport system
performance in Northern cities in more detail in later chapters.
1.1 Northern Powerhouse policy
In this section, we set out the motivating factors for developing a Northern
Powerhouse, and its aspirations.
Motivation for developing a Northern Powerhouse
Historically, there has been a productivity gap between the North and South of
England, particularly when the comparison is with productivity performance in
London and the South East. Gross value added (GVA) growth in the Northern
Powerhouse region7 has been below the UK average over the past 10 years, and
its productivity (when measured in terms of GVA per worker) is 29% below
productivity in London (Centre for Cities 2015).
The productivity gap is evident across all the large cities in Northern England.
The City Growth Commission analysed the largest 15 metro areas in the UK,8
which include Greater Manchester, Merseyside, West Yorkshire, South
Yorkshire, and Tyne and Wear. It found that, outside London, only the Bristol
metro area had higher productivity than the national average.
Alongside this productivity gap, which is expected to continue in the absence of
intervention, the population of Northern cities is forecast to continue growing.
Across the six Northern city regions we focus on, annual population growth is
projected to be 0.89% from 2016 to 2026.9 This is more rapid than the 0.77%
7 For the purposes of our analysis, we assume that the Northern Powerhouse includes the six
Northern city regions of Hull, Leeds, Liverpool, Manchester, Newcastle and Sheffield. These are the
city regions whose work is being taken forward by Transport for the North.
8 Metro areas are defined as cities with an overall population of over 500,000, including the city
centre, suburbs, and surrounding area.
9 Estimated using United Nations (2014).
Page 20
20 Frontier Economics | March 2016
annual population growth projected in London over the same period. The extent
of projected population growth differs by city: for example, the population of
West Yorkshire is projected to grow by 11.7% in total over the period 2016–
2026, while the population of Liverpool is projected to grow 7.4% over the same
period.10
At the same time, populations are ageing: in Northern England, the proportion
of the population aged 20–64 is projected to fall from 58% in 2016 to 55% in
2026, and to 52–53% by 2036.11 This is similar to the projected ageing in
England overall, where the same figures are projected at 58%, 56% and 54%
respectively – i.e. a gradual decline in the proportion of the population that is of
working age, which could be offset to some extent by changes such as individuals
retiring at a later age.12 Underlying this is a projected absolute decrease in the
population aged 20–64 in the North West and North East, and almost no change
in the population aged 20–64 in Yorkshire and the Humber over this period.
The result of historical productivity gaps has been a policy aim for spatial
rebalancing of economic activity, under the umbrella of the Northern
Powerhouse policy. In the next section, we discuss the growth aspirations
developed to achieve this rebalancing. City population growth and a changing age
profile (given its implications for the working age population) discussed above
are important factors affecting how economic growth aspirations can be achieved
– for example, by having an impact on future labour supply.13
1.2 Growth aspirations for Northern cities
The overarching Northern Powerhouse growth aspiration is for economic
growth in the North to at least equal the national average.14
Northern cities are developing plans to support increased economic growth.
Through Local Enterprise Partnerships (LEPs), Northern cities have developed
Strategic Economic Plans and Growth Plans. These plans articulate aspirations
for increasing economic growth in city regions, and set out the priorities for
achieving this. As we describe in Chapter 2, there are several drivers of economic
10 Estimated using United Nations (2014).
11 The North East, North West, and Yorkshire and the Humber. See Office for National Statistics,
Social Survey Division (2015), 2012-based Subnational Population Projections for Regions in
England.
12 See Office for National Statistics, Social Survey Division (2015), 2012-based Subnational Population
Projections for Regions in England.
13 We explore the economic geography of Northern cities further in Chapter 3.
14 See Transport for the North (2015a). Alternative targets have also been used: the City Growth
Commission uses a target of reducing the ‘fiscal gap’ between attributable tax revenue for a city and
its level of public expenditure.
Page 21
growth, and to be able to realise full growth potential, the wider policy
framework must recognise this. Hence, the plans developed by LEPs include
policy actions across the different drivers of economic growth, such as improving
skills, or investing in transport infrastructure and housing to attract inward
migration of skilled labour.
Economic plans by cities to date have developed forecasts using different
horizons, assumptions, and estimation techniques, so their interpretation differs.
Some are also subject to further consultation. Although not comparable, these
estimates provide an indication of what cities are currently aspiring to. We
therefore summarise published employment and economic growth aspirations for
Northern cities in Table 1.
Page 22
22 Frontier Economics | March 2016
Table 1. Employment and growth aspirations of Northern cities
City Employment growth forecasts GVA growth forecasts
Hulla Potential job growth of 20,400 to
27,040 in the Humber sub-region (i.e.
broader than Hull), assuming ‘game
changer’ projects go ahead (period
not specified).
Potential GVA growth of £5.7–
£11.7 billion in the Humber sub-
region (i.e. broader than Hull),
assuming ‘game changer’ projects
go ahead (period not specified).
Leedsb 44,600 net additional jobs are
forecast to be created in Leeds over
2013 to 2023, representing 32% of
net additional jobs forecast over the
same period in the Yorkshire and
Humber region.
GVA in Leeds is forecast to
increase by 27%, from £18.1 billion
in 2013 to £22.9 billion in 2023.
Liverpoolc Potential net employment growth of
100,000 jobs is forecast over 2013 to
2025.
GVA growth of £10 billion is
forecast over 2013 to 2025.
Greater
Manchesterd
Employment is forecast to grow by
110,000 jobs over 2014 to 2024.
GVA growth is forecast to average
2.8% per year from 2014 to 2024,
above the average in the North
West.
Newcastle*,e
22,000 additional jobs are projected
to be created across Newcastle and
Gateshead over the period to 2010 to
2030, an increase of approximately
7.3%.
GVA is projected to grow by 55%
from 2010 to 2030, from £6.2 billion
in 2010 to £9.6 billion in 2030.
Sheffieldf
Net employment growth of 40,700
over 2013 to 2024 is targeted to
address the current productivity gap.
Net GVA growth between 2013 and
2024 is targeted at £1.3 billion.
* Forecasts are for Newcastle and Gateshead.
Source: (a) University of Hull (2013); (b) Leeds City Council (2013); (c) Liverpool City Region Skills for
Growth (2013); (d) Oxford Economics (2015); (e) Durham Business School for Joint Planning Teams of
Newcastle City Council and Gateshead Council (2012); (f) IPPR North, RBLS Consulting, and East West
Locations (2013).
In addition to the work undertaken by individual cities, an Independent
Economic Review has been commissioned by Transport for the North (TfN) to
explore future growth aspirations of the North, and the likely sector composition
of the economy in Northern England if economic growth aspirations are
achieved.
While analysis in this report focuses on improving transport connectivity at
current population levels, as our economic framework will show, the wider policy
context is also critical. An important change in the policy context to date has
Page 23
been the devolution of responsibilities from central Government to authorities in
Northern cities, which we explore below.
1.3 Governance and policy responsibility in Northern
cities
The context within which growth aspirations will be delivered is increasingly
devolved, and reflects an increasing focus on cities as the likely source of
increased economic growth. TfN has responsibility for developing a transport
strategy, and in doing this is working with LEPs, central Government – primarily
the Department for Transport and HM Treasury – and national bodies including
Highways England, HS2 Ltd and Network Rail.
Alongside this, ‘combined authorities’ have been created: these are public bodies
bringing together local authorities and reflecting boundaries of economic activity
(typically a city), with responsibilities to deliver devolved economic and transport
policy functions. Costs relating to these functions are met by the councils within
the combined authorities, with in turn funding from government grants.
Combined authorities are responsible for setting economic growth aspirations
and planning to meet these, and are also responsible for delivery of an increasing
range of public services as a result of Devolution, City, and Growth Deals with
central Government. We briefly outline the scope of these deals in the box
below.
Page 24
24 Frontier Economics | March 2016
Devolution Deals
Cities can apply to secure Devolution Deals, which grant devolved or shared
powers to Combined Authorities. Devolved responsibilities can include
transport, health and social care, skills, business support, planning and
employment (see HM Treasury 2015a, and Local Government Association,
Devolution Deals15). To date, Devolution Deals have been secured in Northern
England by the Combined Authorities of:
West Yorkshire;
Liverpool City Region;
Greater Manchester;
Sheffield City Region;
North East Combined Authority; and
Tees Valley Combined Authority.
City authorities with devolved powers are encouraged to move to a model of
having directly elected mayors – to date, this has been agreed for Greater
Manchester only.16
City and Growth Deals
Devolution Deals were preceded by City Deals and Growth Deals, which
devolved powers to cities for specific programmes relating to improving
economic performance, along with provision of funding to achieve programme
aims. Deals included funding, policy support and formation of partnerships, with
projects in areas including skills, transport and city growth.
1.4 Transport investment in Northern England to
facilitate local growth aspirations
Improving transport is an important focus of the work underway to meet
economic growth aspirations in the Northern Powerhouse area. We discuss the
potential role of transport in facilitating and driving economic growth in Chapter
15 http://www.local.gov.uk/devolution-deals
16 http://www.local.gov.uk/devolution/directly-elected-mayors
Page 25
2. In this section, we set out the context within which Northern transport
investment policy is being developed and delivered.
TfN has been established to develop a transformational Northern Transport
Strategy. TfN is chaired by John Cridland, and its focus is on understanding and
enabling development of the transport system that will be required if the
Northern Powerhouse aim, which is to raise economic growth in the North to
the national average, is achieved. Transport could support this through
improving connections between centres of economic activity, improving
commuting access to centres of economic activity, or improving information and
ticketing systems to make travel easier.
TfN is a collaborative body bringing together combined authorities and local
transport authorities from Northern England. It is due to become a statutory
body by 2017, and has responsibility for local roads and rail. TfN is collaborating
with Highways England, the Department for Transport and Network Rail, who
have responsibility for strategic routes.
TfN has a long-term focus, and work is underway to identify and assess specific
transport investment projects to take forward. However, in its report on the
Northern Transport Strategy, TfN articulates its priority areas, spanning inter-
and intra-city connectivity, air transport, and freight and logistics (Transport for
the North 2015a). This includes identifying ‘aspirational’ journey times between
Northern cities, which we use to inform our later analysis. We summarise TfN’s
priorities across the four main areas in Table 2.
Page 26
26 Frontier Economics | March 2016
Table 2. Priority areas identified by TfN
Priority area Description
Inter-city connectivity TfN’s vision is to achieve large reductions in rail journey
times between cities, and to improve road connectivity.
This could include Government commitment to the full
High Speed Two (HS2) ‘Y’ network; a new ‘TransNorth’ rail
system; improving east–west road links; and expanding
capacity on major north–south roads.
Intra-city connectivity TfN prioritises improving connectivity between
communities and areas of employment growth. This
includes a focus on developing effective onward
connectivity from HS2 stations, and working to build in
improvements to local rail services through future rail
franchises.
Air transport Priorities include improving rail connectivity between
Manchester airport and nearby cities, and increasing the
destinations served by the existing network of airports in
Northern England.
Freight and logistics The focus in this area is on improving planning, to
coordinate port expansion with development of the
distribution network, and similarly to support increased
freight movements by improving rail capacity.
Source: Transport for the North (2015a)
In addition, TfN considers the role of ‘smart’ travel (e.g. integrating ticketing
systems across the North), which sits across the above areas. TfN also recognises
that transport investment is just one factor required to meet economic growth
aspirations, alongside other drivers of economic growth, such as investment in
skills, city centre amenities and supporting businesses (Transport for the North
2015a).
In addition to the transformational investment being planned, a large number of
incremental road and rail improvements have been made or are being made in
the near term in the Northern Powerhouse area. These are mapped in ‘A
blueprint for connecting the Northern Powerhouse’.17 The incremental changes
will improve aspects of transport such as capacity, journey times and quality of
services. Examples include electrification of rail track and improvements to the
North Trans-Pennine line, to deliver a greater number of fast trains and shorter
17 http://maps.dft.gov.uk/northern-powerhouse/index.html
Page 27
journey times between Manchester, Leeds and York; and work to improve traffic
flow on the M62, improving journeys between Leeds and Bradford.
Having explored the policy context and emerging transport priorities in the
Northern Powerhouse area, we set out an economic framework for analysing
inter-city links in Chapter 2.
Page 28
28 Frontier Economics | March 2016
Chapter 2: Transport and economic
performance
Chapter overview
This chapter presents an economic framework for understanding the key drivers
of economic performance in cities and other urban areas, and how those drivers
interact. We focus on the ways in which transport, in particular improvements to
inter-city links, can contribute to the economic performance of a city, along with
estimates of the magnitude of the impact based on the latest academic and policy
evidence.
The structure of the chapter is as follows.
Section 2.1 sets out the economic framework through which transport
unlocks and drives economic performance, when complemented by other
key drivers of economic performance.
Section 2.2 discusses the types of potential gains from increased transport
connectivity, both in terms of the first-order gains to productivity holding
the structure of the economy constant, and in terms of the potential second-
order responses, which occur over time as workers, firms and investment
respond. The latter can fundamentally transform the local economy.
Section 2.3 presents the latest empirical evidence on the impact of transport
interventions, and inter-city transport links in particular, on economic
performance. The section contains an overview of the current literature and
the gaps in our knowledge, a discussion of the methods used to estimate
both first- and second-order effects, estimates of the magnitude of these
benefits and the conditions under which they are likely to be stronger.
Section 2.4 concludes with a few key observations from the literature on
transport and economic performance to inform the strategic case.
2.1 The drivers of economic performance in cities
Overview of the key drivers
The urban economics and city growth literature contains a well-established
evidence base on how cities, city regions and other urban areas grow. This body
Page 29
of evidence identifies the key drivers of economic performance at disaggregated
spatial levels, with city growth being a primary focus of much of the research.18
The evidence is clear that there are many factors that drive economic
performance, and each driver is likely to be necessary, though not sufficient, to
realising growth opportunities.
In Figure 3, we provide a stylised diagram for understanding the economic
performance of cities, drawing on an extensive and well-recognised body of
evidence on the key drivers of growth (Aghion et al. 2013, Berube et al. 2006,
City Growth Commission 2014, and Gibbons et al. 2009a). The diagram sets out
the main high-level drivers of economic performance in cities, which improve
output and standards of living by increasing productivity, employment, wages
and profits.
It is worth noting that these measures of economic performance are interlinked.
For example, Krugman (2005) explains that when we consider countries, a 5%
difference in productivity translates into roughly a 5% difference in the standard
of living. In a well-functioning economy, workers are paid according to their
productivity, so higher labour productivity results in higher wages.19 There is also
evidence that increased productivity at an industry level generates demand, which
in turn increases total employment (see, for instance, Nordhaus 2005). In the
following discussion, we focus on the effect of transport infrastructure
enhancements and other key drivers on productivity.
Each driver of economic performance is described in more detail in the following
text.
18 It is worth noting the definition of ‘economic growth’ in this context. Throughout this chapter, the
term ‘economic growth’ refers to changes in the level of economic performance – therefore, any
measure that improves the level of economic performance can be seen to generate economic growth
(in that period). The phrases ‘improving economic performance’ and ‘generating economic growth’
are therefore used interchangeably. This is distinct from ‘increasing in the rate of economic growth’,
which refers to the percentage increase in output per year.
19 Under neoclassical assumptions, workers are paid their marginal product of labour.
Page 30
30 Frontier Economics | March 2016
Figure 3. Key drivers of economic performance in cities
Source: Frontier Economics, adapted from Office of the Deputy Prime Minister (ODPM) 2006, drawing on the LSE Growth Commission 2013 (Aghion et al. 2013), City Growth Commission (2014) and Overman et al (2009)
Labour market and skills. This refers to the education, training and skill
level of individuals, which has an impact on their productivity and earnings.
Cities can grow both by improving the skill base of residents and by
attracting skilled workers from elsewhere.
Infrastructure. Cities rely on infrastructure of various forms, both physical
and digital. The quality, capacity, reliability and efficiency of such
infrastructure are important for economic performance. National and local
governments play a large role in influencing infrastructure, both in terms of
direct provision (as is the case for transport networks), and also in the
regulation of infrastructure (as is the case with broadband services and land
use policy).
Business environment. The business environment refers to the tax regime,
regulations and stable policy environment in which businesses make
decisions. For example, business rates and labour regulation can affect
where, and how much, firms invest.
Innovation. Innovation is the process by which ideas and technologies
affect production, either in terms of higher output productivity or new types
of goods produced. Cities can play a role in innovation by supporting
knowledge generation (e.g. through universities) or business innovation (e.g.
Labour markets and
skills
Infrastructure
Business environment
Self-reinforcing effects
Drivers Measures of economic performance
Innovation
Quality of place
Productivity
Employment
Wages and profits
Gross value added
(GVA)
Urban standard of
living
Page 31
with business innovation grants or capital support for early-stage
companies).
Quality of place. The quality and variety of amenities available in cities
affect the quality of life, and in turn influence the location decisions of
workers and firms. Hospitals, schools, green spaces, cinemas, theatres and
other cultural and leisure facilities all affect the quality of place, as do
environmental factors such as pollution.
The literature identifies a number of important feedback effects and
interdependencies between economic performance and its drivers, such that
raising economic performance may rely on making improvements across multiple
drivers at the same time. Similarly, improvements in one driver can have knock-
on impacts, both positive and negative, on other drivers. For example, an
improvement in skills may not be sufficient if growth is constrained by an
unfavourable business environment. Alternatively, a favourable business
environment may lead firms to invest in up-skilling their workers.
Transport sits within the infrastructure driver, along with other types of
infrastructure, such as energy, telecoms and housing. The need for transport
improvements to be complemented with other drivers of economic performance
is clear. The Eddington Transport Study, conducted nearly a decade ago, argued
that ‘whilst transport can play an important role in facilitating productivity
growth, transport infrastructure alone does not create economic potential’
(Eddington 2006). However, transport is a unique type of infrastructure in its
ability to reduce the effective distance between places and to create the
opportunity to drive economic performance, as we describe in the following
section.
Role of transport in promoting economic performance
There are two ways of looking at the role of transport in promoting economic
performance from a UK perspective (Gibbons 2015, What Works Centre for
Local Economic Growth 2015).
The first is to ensure that transport infrastructure responds to growing
demand, so that congestion, travel times and travel costs do not constrain
growth, where this growth is generated by other drivers discussed above.
This is the traditional role of transport, in which transport acts as a facilitator
of growth, unlocking the growth potential of other drivers.
The second is where transport plays a role in stimulating local economies,
driving growth rather than simply facilitating it. This can be further split into
the following two effects.
Page 32
32 Frontier Economics | March 2016
By reducing travel times and connecting people, firms and places,
transport improvements can generate ‘agglomeration benefits’ that
increase productivity (first-order effects).
Further, the reduction in travel times and the resulting rise in
productivity increase wages and returns on investment, which attracts
more high-skilled workers, firms and investment to the area over time
(second-order effects).
The scale of these benefits, in particular the second-order effects on the local
economy, will depend on the extent to which transport improvements are
supported or constrained by other drivers of economic performance. The
role of transport in promoting performance must therefore be seen in the
context of all other drivers of economic performance, as shown in Figure 4.
Figure 4. Role of transport in promoting economic growth
Source: Frontier Economics, drawing on Gibbons (2015), What Works Centre for Local Economic Growth
(2015) and Laird et al. (2014)
Unlocking growth by removing constraints
We have stated that one way in which transport improvements can promote
economic performance is by relaxing the constraints imposed by congestion, long
travel times or inhibitive costs of travel. Long travel times imply economic costs
because time spent on journeys could be used more productively. Further, long
and unreliable journey times raise business costs, which increases prices to
consumers and constrains production (Gibbons 2015).
Transport
improvements
Driving growth
Economic
growth
Sharing common resources
Scale and specialisation
Matching workers and firms
Learning (knowledge spillovers)
First-order effects:
Attracting high-skilled workers
Investing in education and skills
Business investment
Second-order effects:
Other infrastructure
Labour markets and skills
Business environment
Innovation
Quality of place
Other drivers of growth:
Travel time
savings
Unlocking growth
Agglomeration
Removing
constraints
Page 33
The Eddington Transport Study presents evidence that transport networks under
pressure can constrain growth, so unless transport infrastructure keeps pace with
investments in other drivers of growth, these investments will not achieve their
full potential.
For instance, the Irish economy grew rapidly in recent decades, due to heavy
investment in education and skills and to fiscal incentives for FDI. However,
transport investment lagged behind the growth of the economy, so that by the
mid-2000s, inadequate international connectivity (ports and airports) and
congestion around urban areas had become a limiting factor on growth
(Eddington 2006). Another example is India, where growth driven by investment
in human capital and information technology risked being hindered by
inadequate transport infrastructure: in 2006, the World Bank warned that major
improvements in the transport sector would be required to support the country’s
continued economic growth (Eddington 2006).
The Eddington Transport Study estimated that a 5% reduction in travel times
nationally would be worth around 0.2% of GDP per year, and argued that
transport interventions should be targeted at growing and congested areas and
congested strategic inter-city links. These policy priorities were echoed by the
recent LSE Growth Commission (Aghion et al. 2013). Unlocking constraints
from congestion is a therefore a fundamental benefit of transport improvements.
Driving growth through agglomeration
A second role of transport is to stimulate the economy, that is, to directly drive
economic performance rather than just unlocking the growth potential of other
drivers. There has been greater interest in this channel in recent years, particularly
in the context of reducing inequalities between London and the North of
England (Cox and Davies 2013, What Works Centre for Local Economic
Growth 2015).
There are two particular effects worth noting.
First, a large body of evidence suggests that connecting people, firms and places
more closely generates ‘agglomeration benefits’. These refer to first-order
benefits from:
sharing common resources;
increased specialisation;
better matching between workers and firms; and
knowledge spillovers.
The above factors increase productivity given the current stock of workers and
firms within the economy (i.e. the current economic composition is held
constant).
Page 34
34 Frontier Economics | March 2016
Second, over time, travel time savings and the resulting productivity gains can
also produce second-order benefits by attracting more productive resources into
the economy, in particular:
attracting high-skilled workers to the region;
incentivising local people to invest in education and skills; and
stimulating business investment.
These effects have the potential to fundamentally transform the local economy.
Second-order effects further increase agglomeration (by increasing the number of
workers and firms in the cities), which may trigger further second-order effects,
and so on.
It is worth noting that the definition of ‘agglomeration benefits’ in the academic
literature is broader than the definition used in the Department for Transport’s
WebTAG20 appraisal guidance on wider economic impacts, which captures only
the first-order effects on productivity. Throughout this report, we refer to the
academic definition of agglomeration benefits, which considers both first- and
second-order effects.
Whether second-order benefits are realised crucially depends on the other key
drivers of economic performance, which may help or hinder the impact of
transport improvements. This is because the mechanisms through which
these benefits arise do not depend on transport alone. Transport
interventions can help attract high-skilled workers to the region, but quality
housing and amenities are also needed to attract and accommodate these
workers, and skilled labour pools in surrounding areas can ensure that high-
skilled workers are available. Individuals must have access to high-quality training
if they are to invest in education and skills as a result of transport improvements,
and a favourable business environment is needed to attract investment. If these
drivers are not in place, then the second-order benefits and the self-reinforcing
loop between first- and second-order benefits may fail to materialise. This
means that it may be necessary to invest in other drivers of economic
performance alongside investments in transport in order to fully realise the
potential (second-order) benefits of improved connectivity.
For example, a recent study found that the expansion of high-tech clusters in
Oxford and Cambridge was hindered by planning restrictions, which limited the
availability (and increased the cost) of housing, as well as inadequate coverage of
ultra-fast broadband (Aghion et al. 2013). A survey of senior executives cited in
20 DfT’s WebTAG web site (https://www.gov.uk/guidance/transport-analysis-guidance-webtag) It is
worth noting that second order benefits are captured in Land Use Transport Interaction (LUTI)
models recommended by WebTAG, however not all transport appraisals use LUTI models.
Page 35
the Eddington Transport Study indicates that whilst transport infrastructure21
featured heavily in the factors influencing business location, the availability of
qualified staff, business environment, availability and cost of office space and
quality of life in the area were also considered ‘absolutely essential’ for a
substantial proportion of respondents.
There is good evidence that when supporting drivers are in place, transport
interventions can have a large economic impact, as shown by the Jubilee Line
Extension. The impact of this transport scheme on regeneration in the
Docklands was boosted by favourable business rates that attracted investment, as
well as access to London’s skilled labour pool (Eddington 2006).
In the context of improving transport links between cities, it is also
important to consider the interdependencies between inter-city and intra-
city connectivity. Inadequate intra-city networks can constrain the impact of
any improvements to inter-city transport links, weakening the first- and second-
order benefits from agglomeration. This is because most journeys are not city
centre to city centre, so the door-to-door experience of travel between cities
depends on the quality of transport networks within cities. Congestion is
currently a major problem in a number of Northern cities: for example, peak bus
speeds within Manchester and Leeds are little better than 5 miles per hour, with
peak car speeds around 10 miles per hour. This means that halving the journey
time between Leeds City and Manchester Piccadilly would only reduce the
journey time between Leeds Beckett University and Manchester University by
around a quarter (Mackie et al. 2015). Further, improved transport links may
increase traffic volumes within cities. As such, investment in intra-city networks
may be required to ensure that this does not result in intra-city congestion, which
can offset any reduction in door-to-door journey times resulting from inter-city
improvements.
21 In terms of ‘easy access to markets’ and ‘inter-city and international links’.
Page 36
36 Frontier Economics | March 2016
Why must other drivers also be considered in order to realise the full
potential of transport investments to drive economic performance?
First-order effects improve productivity holding the state of the
economy constant, and are therefore not particularly dependent on non-
transport drivers of economic performance. However, improved inter-
city transport links could increase traffic volumes within cities, which
may lead to intra-city congestion and offset any reduction in door-to-
door journey times. If this is the case, then investment in intra-city
transport networks may be necessary to realise first-order effects.
Second-order effects depend crucially on other drivers of economic
performance, notably housing and a favourable business environment.
Without these drivers in place, transport investments may fail to attract
productive workers and firms to the area. If this is the case, then it may
be necessary to invest in other drivers of growth alongside transport
investments to fully realise second-order effects.
Identifying transport corridors that offer the greatest opportunity to
unlock or drive economic performance
The two ways of seeing the role of transport in promoting economic
performance have different implications for the choice of priority strategic
corridors (Gibbons 2015, What Works Centre for Local Economic Growth
2015). On the basis of the first ‘ameliorative’ role of unlocking growth,
investment should be targeted at cities where the economy and transport demand
are growing, in order to relax the constraints that congestion and travel times
impose on growth. This implies that the priority inter-city links will be those
between the fastest growing cities in the North, and/or the corridors already
facing high levels of congestion.
The second role of directly driving growth implies that transport investment
should be targeted at corridors that have the greatest scope for agglomeration
benefits. As discussed in the following sections, this depends on:
the size of the cities being linked;
current travel times between these cities;
the quality of their intra-city networks;
their geographic location in relation to surrounding cities;
their sector compositions;
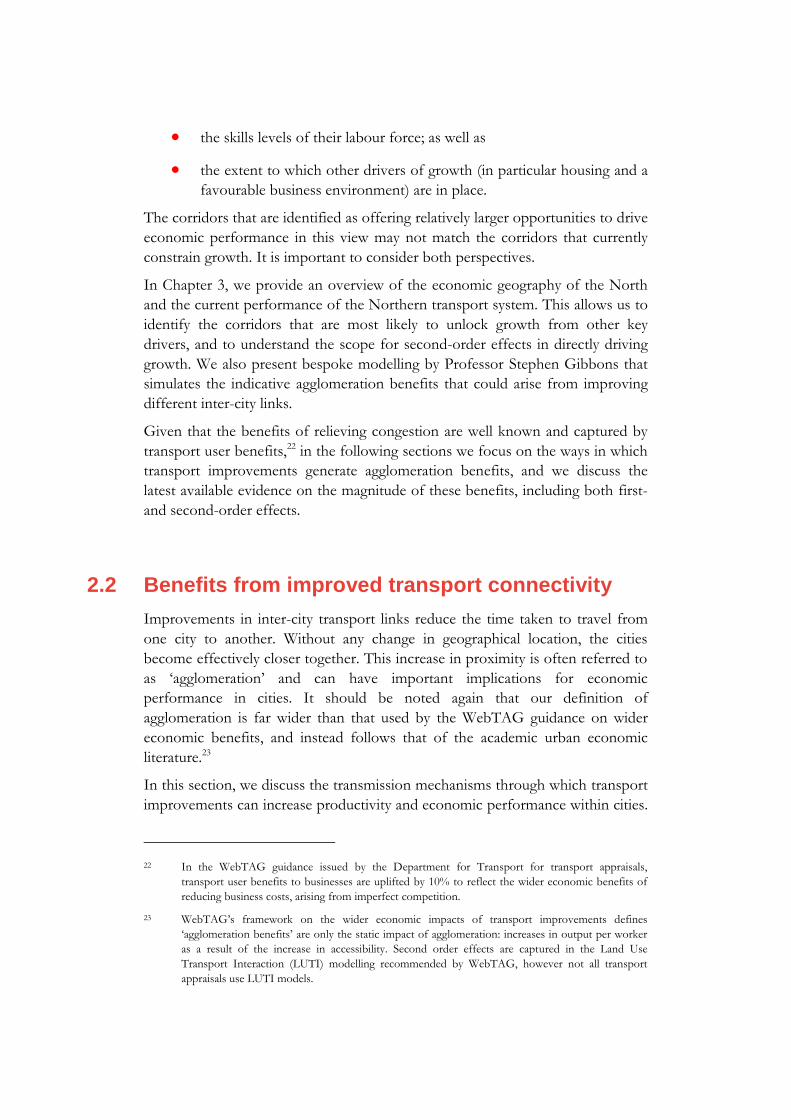
Page 37
the skills levels of their labour force; as well as
the extent to which other drivers of growth (in particular housing and a
favourable business environment) are in place.
The corridors that are identified as offering relatively larger opportunities to drive
economic performance in this view may not match the corridors that currently
constrain growth. It is important to consider both perspectives.
In Chapter 3, we provide an overview of the economic geography of the North
and the current performance of the Northern transport system. This allows us to
identify the corridors that are most likely to unlock growth from other key
drivers, and to understand the scope for second-order effects in directly driving
growth. We also present bespoke modelling by Professor Stephen Gibbons that
simulates the indicative agglomeration benefits that could arise from improving
different inter-city links.
Given that the benefits of relieving congestion are well known and captured by
transport user benefits,22 in the following sections we focus on the ways in which
transport improvements generate agglomeration benefits, and we discuss the
latest available evidence on the magnitude of these benefits, including both first-
and second-order effects.
2.2 Benefits from improved transport connectivity
Improvements in inter-city transport links reduce the time taken to travel from
one city to another. Without any change in geographical location, the cities
become effectively closer together. This increase in proximity is often referred to
as ‘agglomeration’ and can have important implications for economic
performance in cities. It should be noted again that our definition of
agglomeration is far wider than that used by the WebTAG guidance on wider
economic benefits, and instead follows that of the academic urban economic
literature.23
In this section, we discuss the transmission mechanisms through which transport
improvements can increase productivity and economic performance within cities.
22 In the WebTAG guidance issued by the Department for Transport for transport appraisals,
transport user benefits to businesses are uplifted by 10% to reflect the wider economic benefits of
reducing business costs, arising from imperfect competition.
23 WebTAG’s framework on the wider economic impacts of transport improvements defines
‘agglomeration benefits’ are only the static impact of agglomeration: increases in output per worker
as a result of the increase in accessibility. Second order effects are captured in the Land Use
Transport Interaction (LUTI) modelling recommended by WebTAG, however not all transport
appraisals use LUTI models.
Page 38
38 Frontier Economics | March 2016
There are two main mechanisms: ‘first-order effects’, which increase productivity
holding the composition of the economy constant, and ‘second-order effects’,
which reflect the fact that workers, firms and investment may be attracted to the
city as result of reduced travel times and resulting productivity gains. The scale of
these effects may depend on the characteristics of individuals and cities, the
specific transport scheme and the extent to which there is a supportive policy
framework around other drivers of economic performance (such as the business
environment).
First- and second-order effects
Greater connectivity increases productivity in any given economy – the first-order
effect. Over time, this can attract additional workers, firms and investment to the
area, changing the structure of the economy – the second-order effect. The sources of
first- and second-order effects are described below (based on Combes and
Gobillon 2015, Gibbons et al. 2009a, Laird et al. 2014, and Puga 2010).
Page 39
First-order effects
These refer to the following.
Sharing common resources. Firms and individuals close together are able
to lower average cost by sharing common goods and services, such as water
services or airports.
Scale and specialisation. Larger markets provide firms with economies of
scale and greater ability to specialise. These benefits are experienced by the
firms themselves, and also shared by those firms and workers who benefit
from lower prices.
Matching workers and firms. Reduced travel times make it quicker and
easier for workers to find jobs that match their skills. This improves
productivity by reducing ‘frictional’ unemployment (i.e. the time spent
unemployed while searching for jobs). Access to wider markets also makes it
easier for workers to find jobs that better suit their skill set, past training and
experience, which boosts productivity by enabling them to perform better
compared with a job that does not quite match their skills.
Learning (knowledge spillovers). Learning and knowledge spillovers are
more likely to occur when more people are closer together. For example,
younger workers have more interaction with experienced workers,
information is transmitted through casual interactions, and firms have more
opportunities to experiment and innovate (Gibbons et al. 2009a). Compared
with the above mechanisms, learning is distinctive in that it continues over time
and can be permanent. This means that the learning mechanism can increase
the growth rate of productivity over time, and further that these productivity
gains remain with firms and workers even as they move to areas with lower
levels of agglomeration.
Page 40
40 Frontier Economics | March 2016
Second-order effects
These refer to the following.
Attracting high-skilled workers. High-skilled workers may choose to
relocate to areas with improved transport links because of reduced travel
times and the first-order productivity benefits available in these areas, that is,
the opportunities to find more attractive and highly paid jobs. In the
academic literature, this is referred to as the ‘sorting’ effect.
Investing in education and skills. Access to wider employment markets
may give individuals an incentive to invest in education and skills, because
returns to skills are higher in more agglomerated cities.
Business investment. Firms may also have an incentive to enter or invest
in areas benefiting from first-order productivity gains, which in turn
increases economic growth in the area. Such investment could come from
other local areas (hence there could be a risk of displacement), or it could
come from overseas via FDI. This is discussed further below.
Because second-order effects increase agglomeration (by increasing the number
of workers and firms in the area), this can lead to a self-reinforcing loop, whereby
agglomeration boosts productivity, which further increases agglomeration. Again,
the importance of complementary drivers is important to note – for example,
increased employment would be expected to increase the demand for housing.
It is worth noting that the theoretical literature on urban economics focuses on
how density produces agglomeration effects and the impact that these have on
the economic performance of cities. The literature does not directly address the
impact of inter-city transport improvements; however, given that these
improvements increase the effective density of the affected areas, it is reasonable
to expect that agglomeration will occur through the same mechanisms. Indeed,
the mechanisms of first-order agglomeration occur through accessibility to
markets and people, which should equally be attained by increasing either real or
effective density.
Similarly, the literature has not investigated what happens when the effective
densities of two areas increase at the same time, which is the case with inter-city
transport improvements. As will be discussed below, the first-order effects are
expected to be positive for both places; however, the reallocation of resources
due to the second-order effects may benefit one place more than another or,
indeed, one place and not the other. There is some literature (Puga 2010)
discussing the potential for improved accessibility to have harmful effects: not
only do firms gain access to better inputs and larger markets, but also rival firms
Page 41
now gain access to their markets, which increases competition. If firms in the less
productive region are unable to compete, this can negatively affect them. This
means that our theoretical evidence base for the benefits of inter-city
connectivity is stronger for first- than second-order effects; as discussed in
Section 2.3, this is also true for the empirical evidence to date.
Additional growth v. displacement
First-order effects unambiguously improve economic performance, because they
increase productivity holding the current stock of workers and firms constant.
That is, growth resulting from first-order benefits can be seen as additional
growth. Second-order benefits may either be additional, or displace economic
activity in other areas, by drawing productive resources away from those areas.
For example, the movement of high-skilled workers is likely to result in
displacement. Improvements in inter-city transport links in the North may attract
high-skilled workers from other parts of the UK (e.g. from London to
Manchester) or from one Northern city to another (e.g. from Leeds to
Manchester). Both these examples will be observed as an increase in
Manchester’s economic activity, but at the expense of economic growth
elsewhere. Investment by firms can also be at the expense of other areas: for
instance, transport improvements may lead firms to invest in the North rather
than London.
Other types of second-order effects are likely to cause additional economic
activity. For instance, to the extent that transport improvements give local people
an incentive to invest in education and skills, or attract investment from abroad
(FDI) that would not have otherwise been directed at the UK, this should be
seen as adding to total economic activity. The different types of first- and
second-order effects are summarised in Figure 5.
Page 42
42 Frontier Economics | March 2016
Figure 5. First- and second-order effects of transport connectivity on
productivity
Source: Frontier Economics, drawing on Laird et al. (2014) and Puga (2010)
The net impact of second-order effects will depend on the extent to which the
benefits displace rather than add to total economic activity. The theoretical
literature does not predict the net effect on different areas, nor does it offer any
conclusive predictions on the types of areas that are likely to suffer from
displacement.24 However, improving inter-city connectivity should
unambiguously improve economic performance through first-order effects. This
means that whilst certain areas and/or cities may lose out from improved
connectivity, the direct impact on individuals (regardless of where they are) is
likely to be positive.
Determinants of the nature and scale of benefits
The characteristics of cities, such as their skill and sector composition, are an
important determinant of the nature and scale of potential benefits from
improved transport connectivity (Gibbons et al. 2009a, Combes and Gobillon
2015). For instance, services that are more reliant on face-to-face interaction may
benefit more from learning and knowledge spillovers, whereas manufacturing
may benefit more from sharing common resources, scale and specialisation.
Workers and businesses that gain more from knowledge, likely high-skilled
workers and high-tech firms, may gain more through the learning mechanism.
24 This is because spatial economic models typically involve multiple equilibria, which makes specific
ex-ante predictions impossible without knowing the initial conditions in detail.
Sharing common resources
Matching of workers to jobs
Self-
reinforcing
loop
First-order effects Second-order effects
Learning
Attracting high skilled
workers
Business investment
Adds to economic activity
Can displace economic activity
Scale and specialisation
Investing in education and
skills
Page 43
Agglomeration economies may arise more from ‘urbanisation’ (meaning they
extend across all industries) or ‘localisation’ (meaning they occur in narrowly
defined industries). This will depend on the extent to which different industries
can benefit from sharing the same infrastructure and labour pool. It will similarly
be affected by the extent to which learning and knowledge spillovers are most
beneficial within or across sectors.
Each mechanism will have an impact at different spatial distances from the
centre of the city. The benefits resulting from closer labour markets are more
likely to matter within a reasonable commuting distance. However, knowledge
spillovers and learning due to face-to-face interactions will be most prevalent
within a short radius of the centre. If benefits from agglomeration occur in a
narrow radius around the centre, intra-city transport improvements may be more
beneficial than inter-city improvements.
The type of transport link will also affect the nature and scale of benefits,
depending on the types of firms and workers that use the particular mode of
transport. Improving city-to-city rail links may encourage commuting, and
therefore produce matching and learning benefits. Alternatively, improvements in
roads may benefit freight travel, resulting in resource sharing, scale and
specialisation gains for firms. Inter-city links, which improve access to airports,
could improve international accessibility with corresponding impacts on FDI and
international knowledge spillovers for importing and exporting firms.
The following empirical section will examine in depth the evidence on how
agglomeration and city characteristics interact. These will have important
consequences for the extent to which inter-city transport improvements can be
expected to provide wider economic benefits.
2.3 Evidence of benefits from improved transport
connectivity
Having outlined the theoretical types of benefits from improved transport
connectivity in the previous section, this section sets out the empirical evidence
on these benefits. We first provide an overview of the state of existing evidence
and highlight the gaps in our knowledge, especially in terms of the long-term
second-order effects and the impact of specific improvements in inter-city
transport. We then discuss the most common methods of estimating benefits
from transport improvements, noting the methodological limitations of each
approach as well as the difficulties in interpreting results.
In this section, we describe the evidence on estimates of the impact of increased
access to markets on productivity in the UK. We also summarise the results of
recent studies on first-order and total benefits from increased accessibility,
including some evidence of displacement from other areas. The next section
Page 44
44 Frontier Economics | March 2016
considers the conditions under which these benefits are stronger, namely the
effect of specific sectors, sector mix (localisation), skills levels and spatial decay
on the magnitude of agglomeration benefits. This provides some guidance on the
types of cities and transport linkages to target when improving inter-city
connectivity in the North.
Overview of available evidence
Most of the available evidence examines the impact of access to markets
(‘accessibility’ in short) on wages, used as a proxy for labour productivity.
However, whilst we have relatively reliable estimates of the first-order effect of
accessibility on productivity, holding the rest of the economy constant, little is
currently known about the second-order effects that result from the behaviour
over time of workers, firms and investment in response to these effects. Further,
there is a lack of evidence on the economic impact of transport schemes in
particular (as opposed to accessibility in general). It is assumed in the academic
literature that the benefits of accessibility can be replicated by improving
transport links between cities (see, for instance, D’Costa et al. 2009).
Specific transport interventions v. accessibility
The bulk of research on agglomeration effects examines the effect of city size,
density or accessibility on productivity (Combes and Gobillon 2015). Of these,
accessibility is the most relevant metric for assessing the impact of inter-city
transport links. It has variously been called ‘market access’, ‘market potential’,
‘effective density’ or ‘closeness centrality’ in the literature (D’Costa et al. 2009).
The accessibility of a city is measured by the sum of ‘economic mass’ (typically
employment) that can be accessed from that city, discounted by the cost of
accessing these areas (in terms of generalised transport costs,25 travel times or
distance). This means that a reduction in travel times to a given city, or an
increase in employment in surrounding areas, would result in an increase in its
accessibility. Some studies use econometric techniques to isolate the change in
accessibility resulting from changes in travel times (as opposed to changes in
employment in surrounding areas), so that estimated benefits can plausibly be
attributed to transport improvements.
In contrast, there is very little existing evidence on the economic impact of
specific transport interventions. In part, this results from a lack of rigour in
transport evaluations, particularly in defining what would have happened in the
absence of the transport scheme. The What Works Centre for Local Economic
Growth (2015) reviewed around 2,300 policy evaluations from the UK and other
25 Generalised transport costs refer to the sum of financial travel costs (cost of fuel, fare, vehicle
maintenance, etc.), plus the value of the person’s travel time (including journey time and time spent
waiting for public transport). The value of time is higher for business travel than for leisure.
Page 45
OECD countries, and found fewer than 30 robust studies, mostly on interstate
highways and light rail lines in the US.
Aside from the lack of reliable evidence, there is a problem with generalising the
findings of these studies to the UK context. For instance, the impact of widening
a highway in California is not directly informative of the likely benefits of
improving rail links between Manchester and Leeds. However, the savings in
travel time from such a scheme could be translated into an increase in
accessibility. The benefits to productivity from this increase in accessibility could
then be estimated and projected to the UK context in a relatively straightforward
way. In our evidence review below, we therefore focus on estimates of the
impact of accessibility on productivity in the UK, drawing on evidence on
specific transport interventions where relevant.
Measures of productivity
There are two widely used measures of productivity in the literature: labour
productivity and total factor productivity (TFP; Gibbons et al. 2009a). TFP is the
more rigorous measure, as it captures the efficiency with which all inputs are
combined to produce output, not just the efficiency of the labour force.
However, it is not observable and must be estimated. There are a number of
ways to estimate TFP, and the appropriateness of these methods is a subject of
ongoing debate (Gibbons et al. 2009a). Partly because of this, most studies on the
impact of agglomeration on productivity focus on the effect on labour
productivity, which can be easily measured or approximated using wages.26 This
is not without problems, as labour productivity also depends on the extent to
which other inputs are substituted for labour, as well as the relative bargaining
power of workers and firms. However, given the evidence available, we focus on
the impact of accessibility on wages, supplementing the evidence with occasional
studies on TFP. Wages are also a policy priority in their own right, as they
directly affect individuals’ standards of living.
Knowledge gaps
Despite considerable advances in recent years, the study of spatial economics
remains a relatively new field, and there are still large gaps in our knowledge of
the wider economic benefits of transport improvements. First, whilst
econometric techniques have been used to estimate the first-order effect of
agglomeration on productivity, very little is known about the second-order
feedback mechanisms between transport improvements and the behaviour of
individuals, firms and investment in response to these improvements. This is
complicated by the fact that, as time goes on after a transport improvement, it
26 Under neoclassical assumptions, workers are paid their marginal product of labour, so high wages in
an area can be interpreted as reflecting high labour productivity.
Page 46
46 Frontier Economics | March 2016
becomes less and less clear what can be attributed to the transport scheme, and
any second-order effects will necessarily take a long time to feed through. Certain
transport models (such as LUTI models27 used in some transport appraisals) do
attempt to simulate these interactions; however, the predictions of these models
have never been validated against actual outcomes.
We therefore have relatively reliable estimates of the first-order effect of
agglomeration, holding the rest of the economy constant, but – as explained in
the following subsection – we have at most an estimate of the upper bound on
the total impact of transport improvements, taking second-order effects into
account. Further, no systematic studies to date have been undertaken on the
nature and extent of displacement, which means that policy makers have focused
on the benefits of improved connectivity with little understanding of the full
range of potential costs.
Second, most of the reliable evidence captures the effect of accessibility in
general, rather than the effect of transport improvements in particular. As
explained above, accessibility depends on a number of things, such as the size,
density and physical proximity of cities, in addition to the number and quality of
transport links between and within cities. This means that in some cases, the
derived estimates may reflect the impact of city size or density more generally and
a historical density–productivity relationship that has evolved over time, rather
than the causal effect of changes in transport infrastructure. Even when
econometric techniques are used to isolate the impact of transport
improvements, it is unclear that all of the estimated benefits will accrue to inter-
city (as opposed to intra-city) connectivity, given the rapid spatial decay of
agglomeration effects.28 The academic literature assumes that we can replicate the
estimated benefits of accessibility by improving transport links between cities
(see, for instance, D’Costa et al. 2009).
Methods for estimating the effect of transport connectivity
As explained in the previous subsection, improving inter-city connectivity has
two types of effects: a first-order effect resulting from closer proximity of
existing firms and workers, and a second-order effect of attracting more
productive resources into the area, in particular high-skilled workers, firms and
investment. This distinction is important when thinking about the wider
economic benefits of improving linkages between two cities. Whilst first-order
27 Land use transport interaction models. These seek to model a local economy and how market agents
respond to changes in transport costs over time. They assume that labour is mobile within a
particular defined area and that businesses and trade respond to find a new equilibrium following a
transport intervention. As with most transport appraisal models, they compare outcomes following
the intervention to what would have happened in the absence of the intervention.
28 Spatial decay is exponential in nature, which implies that a given reduction in travel times will have
more impact where travel times are currently shorter.
Page 47
effects are likely to accrue to both cities, second-order effects may benefit one
city at the expense of the other. Put simply, if productive workers and firms
move from one city to another as a result of increased connectivity between the
two cities, the destination city gains from second-order effects whilst the city of
origin loses out from second-order effects (though any losses may be offset by
gains from first-order effects). Further, increased accessibility in both cities as a
result of the transport scheme may draw productive resources away from other
cities that have not been directly affected by the scheme. Ideally, we would want
to separately identify first-order and second-order effects, including any
displacement effects on areas that experience negative sorting. Here, we outline
the most common methods of estimating the effects of transport connectivity,
noting the methodological limitations and difficulties in interpretation.
First-order effect
To identify the first-order effect, we would need to compare the productivity of
individuals who are otherwise identical, but live in cities with different levels of
accessibility. Recent studies have attempted to do this by tracking individuals as
they move from one city to another, whilst controlling for observable changes29
in their characteristics, such as education levels or years of work experience
(Combes and Gobillon 2015). Provided that there are no changes in ability or
motivation (that cannot be observed by the researcher) over time, this approach
ensures that if a particular individual earns more in cities that are more accessible,
we can plausibly attribute the wage difference to first-order effects.
In the absence of randomly allocating individuals between cities, this is the best
approach available for identifying first-order agglomeration effects. However, it is
worth noting that we cannot rule out the possibility that individuals’ unobserved
characteristics change over time, or that something unobserved happens to
individuals that both affects their wage and induces them to move cities. Further,
this approach captures the general impact of accessibility on productivity, and
not the specific impact of transport interventions. It is simply assumed that these
productivity differences can be replicated by improving transport links.
Another issue with this methodology is that it does not capture the permanent
effects of learning: skills gained working in large cities cannot be distinguished
from individual characteristics such as underlying ability. To capture both city-
based and permanent learning effects, some studies have included measures of
the time spent in different types of cities in their analysis (see, for instance, Puga
and De la Roca 2012, and D’Costa and Overman 2014). However, this is a very
new field (with the first paper published in 2012), so this area of research is still
in its infancy.
29 This refers to changes that are observable to the researcher, for instance measurable qualifications.
Page 48
48 Frontier Economics | March 2016
Second-order effect and displacement
The separate identification of second-order effects (including displacement) is
more difficult. Studies do not estimate second-order effects directly; instead,
some estimate the overall impact of accessibility by comparing more and less
accessible cities, sometimes controlling for industry structure (see, for instance,
D’Costa et al. 2009). The difference between this aggregate estimate and the
estimate of first-order effects (as above) is then attributed to second-order
effects. In the context of estimating the wider economic benefits of improving
inter-city connectivity, key to note here is that this aggregate estimate represents
the correlation between accessibility and productivity across all cities, not the
incremental gain that we would expect from increasing accessibility to any
particular city. This correlation is likely to capture a historical density–
productivity relationship that has evolved over time, owing to other drivers of
economic performance (notably skills), in addition to any causal impact of
accessibility. Put simply, if we are to directly apply estimates derived in this way
to changes in inter-city connectivity, we must believe that all of (for example)
London’s productivity advantages can be replicated with inter-city transport links
alone. Further, the estimate does not capture potential displacement effects,
either on the cities being connected or on other areas not directly affected by the
scheme. At most, estimates derived through cross-city comparisons can be seen
as the upper bound on the long-term benefit of accessibility, including both first-
and second-order effects.
Another issue is that the government may focus transport connectivity projects
on high-performing cities with congested transport links, in which case estimates
based on cross-city comparisons would capture the causal effect of productivity
on accessibility, rather than the impact of accessibility on productivity that we are
after.30 If transport interventions are targeted at areas due to their underlying
productivity, this will create biased estimates of the impact of accessibility on
productivity – this is called ‘selection bias’ or more specifically ‘endogenous
policy targeting’ in the economic literature. Some studies attempt to use
econometric techniques31 to eliminate selection bias; however, the results are
inconclusive (Combes and Gobillon 2015). Because transport investments have
traditionally been aimed at relieving constraints on growth, and therefore targeted
at high-performing cities, estimates based on cross-city comparisons are likely to
be biased upward. This reinforces our view that such estimates should be seen as
the upper bound on the total effect of accessibility.
30 Theoretically, it is also possible that transport projects are deliberately targeted at low-productivity
areas as a way of improving their economic performance (D’Costa et al. 2009).
31 In particular, historical values of population or density and geological features have been used as
instrumental variables.
Page 49
Given the difficulty of separating out positive dynamic effects, displacement and
selection bias, in the following summary of the literature we present estimates of
the total effect of accessibility, noting the difficulties in interpretation. We also
discuss the qualitative results of other studies on specific transport interventions,
as well as some indicative evidence of displacement.
Estimated effect of transport connectivity
Estimates from recent academic literature and policy reports suggest that
increasing accessibility to a city by 10% (for instance by reducing generalised
transport costs from that city to all other cities by 10%32) would increase wages33
in that city by 0.3–0.7% through first-order agglomeration effects (see sources in
Table 3). Whilst these figures look modest, it is worth noting that labour
productivity in the North has remained essentially unchanged since 2000 (Office
for National Statistics 2015a).34 The range of 0.3–0.7% would imply an increase
in earnings of £75–£175 per person per year in the North.35
The total impact on wages of a 10% increase in accessibility, including first- and
second-order effects, is up to 1.1–2.6% (see sources in Table 4). However, these
values are likely to be overestimating the contribution of transport to economic
performance as they capture the impact of all drivers, not just transport.
Therefore, one would effectively have to believe that all improvements ever
observed in a city’s productivity had been the result of the transport intervention
(and not other drivers).
Furthermore, there is also some tentative evidence of displacement, which means
that projects to improve connectivity could negatively affect some cities. This
means that it is difficult to predict the impact of increasing inter-city transport
connectivity on particular cities, though the effect on individuals (regardless of
where they are) is likely to be positive due to first-order effects.
It is also important to note that these elasticity figures represent average UK-
wide estimates, across all sectors, cities and individuals. In reality, the actual
impact will be highly location-specific, so that similar accessibility improvements
in different areas may lead to wildly different results. This is partly due to the
interdependencies between transport infrastructure and other drivers of
economic performance, as discussed in the final subsection, and partly due to the
32 This is based on a measure of accessibility based on inverse weighting of generalised transport costs,
as is standard in the literature (see D’Costa et al. 2009). Alternatively, if accessibility is based on
travel times alone, a 10% fall in travel times to all other cities would produce a 10% increase in
accessibility.
33 Throughout the report, ‘wages’ refer to pre-tax wages.
34 Based on nominal GVA per hour in North East, North West, and Yorkshire and the Humber.
35 Based on median annual earnings of £25,035 in the North East, North West, and Yorkshire and the
Humber in 2014 (simple average across the three regions).
Page 50
50 Frontier Economics | March 2016
fact that the magnitude of benefits varies according to individual and city
characteristics. Some of the conditions under which benefits to accessibility are
more pronounced are discussed below.
First-order effect
Based on recent studies in the UK, increasing accessibility by 10% would lead to
a 0.3–0.7% increase in wages as a result of first-order effects, holding the
composition of the economy constant (see sources in Table 3). Permanent
learning effects in the UK appear relatively weak, although further investigation is
needed to produce conclusive results.
A recent study by D’Costa et al. (2009) estimates that reducing generalised
transport costs for train travel by 10% (by reducing wait times, travel times or
ticket fares), whilst holding existing road infrastructure as is, would increase
wages by 0.3–0.5% on average through first-order effects. Conversely, reducing
generalised transport costs for road travel by 10% (by reducing travel times or
fuel costs), whilst holding train connectivity as is, would increase wages by 0.7%.
These estimates are similar to previous estimates of first-order effects in the UK,
of 0.4–0.6%, derived using comparable but slightly different methodologies. A
related study by Gibbons et al. (2009b) looks at the change in TFP of firms in
response to changes in accessibility, holding the skills composition of the area
fixed, and finds that a 10% increase in accessibility increases TFP by 0.4%.36 The
results from this study underpin the UK Department for Transport’s appraisal
guidance (WebTAG), which provides underlying assumptions for estimating the
wider economic benefits of transport interventions.
The estimates are also in line with, if higher than, estimates of the first-order
effect of accessibility in other European countries, which place the increase in
wages due to a 10% rise in accessibility at 0.1–0.5%.
36 The measure of accessibility used in this paper is based on distances, rather than generalised
transport costs. However, to the extent that improved transport links reduce ‘effective’ distances,
the results can be applied to transport improvements.
Page 51
Table 3. Estimates of first-order impact of accessibility improvement on wages
Author(s) Country Estimated elasticity
D’Costa et al. (2009) UK 0.03–0.05 trains
0.07 roads
Graham and Melo (2009) UK 0.04–0.06
Gibbons et al. (2009b) UK 0.04*
Fingleton (2008) UK 0.04–0.06
Andersson et al. (2014) Sweden 0.01
Puga and De la Roca (2012) Spain 0.02
Mion and Naticchioni (2009) Italy 0.01
Combes et al. (2008a) France 0.02
Combes et al. (2008b) France 0.02–0.05
*Based on TFP rather than wages (labour productivity).
Research on permanent learning effects is sparse, and there is only one study on
the topic in the UK. D’Costa and Overman (2014) explore both city-based and
permanent effects of agglomeration by considering the effect of city experience.
They find that permanent effects are relatively weak, and further that gains
disappear after the first year in a city. Because of the method used in this study
(measuring wage growth rather than wages, city population rather than
accessibility, and discrete categories of city size rather than a continuous measure
of accessibility), it is difficult to generalise their findings to the elasticities
presented above. However, Puga and De la Roca (2012) find that when
permanent learning effects are captured in Spain, a 10% increase in accessibility
results in a 0.5% increase in wage levels through first-order effects, more than
double the effect (0.2%) when only city-based effects are considered. This
indicates that there is value in further investigating the impact of permanent
learning effects in the UK.
Total effect (including first- and second-order effects)
Table 4 presents estimates of the total effect of accessibility on productivity in
the UK, based on cross-city comparisons as described above. Estimates vary
widely, largely due to methodological differences between studies. In particular,
studies differ in the factors that they hold constant, which means that the derived
estimates are not entirely comparable. Overall, the estimated total effect of
Page 52
52 Frontier Economics | March 2016
increasing accessibility by 10% on wages is between 1.1% and 2.6% (see sources
in Table 4).
The study by D’Costa et al. (2009) discussed above estimates that reducing
generalised travel times for train travel by 10%, holding the cost of road
transport constant, is associated with a 2.6% increase in wages within that area.
In contrast, reducing generalised travel times for road travel, holding train
infrastructure constant, is not associated with any significant change in wages.37
Another recent study by Gibbons et al. (2012) estimates that a 10% reduction in
travel times is associated with a 2.4% increase in wages at the firm level, and a
rise in employment in the area by 2.5–3.5%. This study uses econometric
techniques to pick up only those changes in accessibility that result from
improvements in road infrastructure, and to reduce selection bias,38 so that the
estimated benefit can plausibly be attributed to improved inter- and/or intra-city
transport links. Three older studies of connectivity in the UK produced lower
estimates of the total effect of accessibility on productivity, which may be partly
due to methodological differences.39 The evidence indicates that connectivity
improvements can have a substantial positive impact on target cities; however, as
discussed above, the estimates are likely to overstate the potential of inter-city
transport and do not consider displacement from other cities.
37 Combined with the positive individual-level effect explained above, this implies that road
connectivity is negatively associated with skills, perhaps because of road infrastructure projects being
targeted at areas with low levels of productivity (selection bias).
38 As explained in the previous subsection, this refers to the bias caused by the fact that transport
interventions are not randomly allocated but may be targeted at areas with high or low productivity.
39 KPMG (2010) uses additional assumptions on firms’ catchment areas and workers’ willingness to
travel rather than a simple accessibility indicator. Fingleton (2008) uses a short-run equilibrium
model to derive accessibility indicators. Graham (2006) considers the effect of distance rather than
generalised transport costs; the estimated effect increases significantly when generalised transport
costs are used, although the precise figure is not reported.
Page 53
Table 4. Estimates of total impact of accessibility improvement on wages
Author(s) Country Estimated elasticity
Gibbons et al. (2012) UK 0.24
D’Costa et al. (2009) UK 0.26 trains
0 roads
KPMG (2010) UK 0.11
Fingleton (2008) UK 0.16
Graham (2006) UK 0.13*
*Based on distances rather than generalised transport costs. A chart in the report suggests that when
generalised transport costs are used, the elasticity is around 0.2.
Research on specific transport interventions (instead of accessibility in general)
has mostly produced positive total effects. A study by Duranton and Turner
(2011) found that a 10% increase in the number of kilometres of interstate
highways leads to a 1.5% rise in employment within a 20-year period. A large
number of other studies have been thoroughly reviewed by the What Works
Centre for Local Economic Growth (2015), which shows that many evaluations
have found positive impacts of road and rail projects on wages, employment and
property prices. However, a significant minority of studies have found no effect,
or mixed effects on different communities. As discussed above, it is difficult to
generalise from these studies to the context of improving connectivity in the
North.
Overall, it is worth noting that relatively few recent studies focus on the total
effects of accessibility; most focus on estimating first-order effects, presenting
total effects as a potential sensitivity, if at all. This is because the derived
estimates do not have a straightforward interpretation. As discussed, to take
the above estimates at face value, we would need to believe that
productivity differences between cities are solely the result of differences
in transport connectivity. Further, even if we accept this (clearly unreasonable)
premise, we still cannot conclude from the above estimates that increasing
accessibility to a city by 10% would increase wages in that city by 1.1–2.6% due
to potential displacement effects. For example, we cannot conclude that a
scheme that improves connectivity between Manchester and Leeds (thereby
increasing accessibility in both cities) would lead to increased wages in Leeds,
because the scheme may in fact draw productive workers and firms to
Manchester away from Leeds, to the detriment of its economy. This may or may
not be offset by positive first round agglomeration effects in Leeds, or by the
sorting of productive workers and firms into Leeds from outside areas.
Page 54
54 Frontier Economics | March 2016
Displacement
There are no general estimates of displacement as a result of changes in
accessibility. However, evaluations of individual transport interventions provide
some tentative evidence of strong displacement effects. The evidence supports
the focus on first-order effects in the empirical literature, as these do not rely on
drawing resources away from other areas.
For instance, a study of interstate highways in rural regions in the US found that
highway construction raises total earnings by 6–8% in the counties that the
highways pass directly through, but draws economic activity away from adjacent
counties, reducing total earnings in these areas by 1–3%. Summing over all
counties in the region, the net effect on regional growth is found to be essentially
zero (Chandra and Thompson 2000). However the result may be particular to the
non-metropolitan areas considered. Chalermpong (2000) studies the construction
of a particular new interstate highway in the US, and finds that employment in
areas along the highway corridor increased by 200%, compared with a 10%
increase in employment in other areas. The author argues that the magnitude of
this effect suggests severe displacement from areas at greater distance from the
highway; certainly, this appears more likely than the construction of the highway
incrementally increasing employment growth by 190 percentage points.
Another example of displacement comes from Hanson (1997), who studies the
effect of trade reform in Mexico in the 1980s, which dramatically increased
accessibility for cities along the US–Mexico border. The results show that this
increased the number of firms along the border, at the expense of economic
activity in Mexico City, which is located far from the border. Basile (2004) also
finds that whilst agglomeration in Italian cities increases FDI, it has a negative
effect on FDI in adjacent provinces, indicating displacement effects. The
evidence of potentially strong displacement effects implies that estimates of the
total effect of accessibility should be treated with caution, as they rely on (but do
not capture) displacement from other areas. Because of this, our modelling in
Chapter 5 focuses on first-order effects, to which displacement does not apply.
Conditions under which benefits from improved inter-city connectivity
are likely to be stronger
The previous subsection presents estimates of the average effect of increasing
accessibility, across a wide range of cities, sectors and individuals. In reality, the
impact of improved connectivity may diverge substantially from the average. This
is partly due to the interaction between transport and other drivers of economic
performance, which may help or hinder the realisation of second-order benefits,
as discussed above. In addition, the magnitude of benefits also depends on the
nature of the transport intervention and the characteristics of the targeted
locations (Combes and Gobillon 2015). Here, we discuss some of the factors that
Page 55
affect the potential size of effects, and consider their implications on the strategic
case.
Because we are concerned with relative impacts rather than exact estimates, and
owing to the relative lack of evidence available, we have reviewed studies on all
types of benefits, including both first- and second-order effects, based on city
size and population density as well as accessibility. The evidence suggests that
service sectors and relatively high-skilled individuals are more likely to
benefit from agglomeration. There is evidence of strong spatial decay, which
means that benefits are likely to be local (for instance, inter-city rail links will
mostly benefit the city centre), and further that improving links between cities
that are already close by may have a larger effect than connecting far away
locations. Creating clusters of firms in any particular sector is unlikely to have an
effect over and above general agglomeration benefits for most sectors, with the
exception of a few high-tech and high-skilled sectors.
The importance of sector characteristics
Meta-analysis by Melo et al. (2009) shows that on average, across a large number
of countries and time periods, agglomeration effects tend to be stronger in
service industries than in manufacturing industries. This result is supported by
research on the UK, in terms of both first-order agglomeration effects and long-
term aggregate effects. Because the UK studies employ a range of methodologies
and capture different outcomes (employment, wages and TFP), we present
estimated sector-specific effects in Table 5 as multiples of overall benefits,
estimated across the whole economy, rather than the estimates themselves. This
provides indicative evidence of the relative gain from increased accessibility in
different sectors.
The evidence suggests that services gain strongly from improvements in
accessibility, whilst the gain to the manufacturing sector is relatively limited. In
particular, producer services (which include finance, insurance, real estate
and consulting services)40 benefit up to two times more from increased
accessibility than average, and two to four times more than manufacturing
industries.41 Unsurprisingly, transport services also benefit from accessibility
improvements, up to 30% more than average. The impact on consumer services
(including wholesale and retail, hotels and restaurants and telecommunications)42
and construction industries is relatively smaller, but still higher than the impact
on manufacturing.
40 SIC codes 65 to 745.
41 SIC codes 15 to 35.
42 SIC codes 50 to 55 and 64.
Page 56
56 Frontier Economics | March 2016
Table 5. Agglomeration effects across sectors as multiple of overall effect
Gibbons et al.
(2014)*
Gibbons et al.
(2009a)**
Gibbons et al.
(2009b)
Graham
(2006)
Manufacturing 0.6 0 0.5 0.6
Construction 0.6 0 0.8 1.5
Transport 1.3 1.3 –
1.6
Consumer
services 0.6–1.1 0 0.6
Producer
services 1.7 2.4 1.9
Others 0–4.7 0–1.7 – 0–2.3
*Consumer services based on retail, wholesale and tourism; producer services based on finance and
professional services and other business services.
**Based on specification (5) on ward level employment.
The importance of sector mix
As discussed above, the transmission mechanism may operate through two
channels: urbanisation, which refers to the benefits of accessibility to workers
and firms in all sectors, and localisation, which refers to the benefits of
accessibility to workers and firms within the same sector. The concept of
localisation relates to the idea of industrial clusters (from Silicon Roundabout in
East London to Media City), which have become popular among policy makers.
The argument for creating clusters relies on the assumption that sharing,
specialisation, matching and learning are more likely between workers and firms
within the same sector.
There is little evidence that ‘clustering’ has a substantial effect on productivity,
over and above the effect of accessibility in general. Studies by Mion and
Naticchioni (2009) and Combes et al. (2008b) find that the impact of localisation
is small or insignificant once general accessibility is controlled for, in Italy and
France respectively. Gibbons et al. (2009a) find similar results for the UK
economy as a whole; however, when looking at individual sectors separately they
find evidence of additional gains to localisation in some sectors. Five sectors
appear to experience benefits to ‘clustering’ in addition to general agglomeration
benefits: aviation; creative/digital/new media; engineering; financial and
professional services; ICT digital communications. In five other sectors
(wholesale, sport, energy, automotive and the catch-all ‘other’), they find benefits
to localisation in the absence of general agglomeration benefits, but note that the
Page 57
sector classification used is quite broad, so we should be careful about drawing
conclusions from these results.
Overall, the benefits of general improvements in accessibility appear more
important than clustering at the sector level, although some individual sectors do
experience additional benefits from clustering. Combined with the above result
on service sectors gaining more from agglomeration than manufacturing, this
means that in most cases it does not matter whether transport improvements
take place between two cities with large shares of services in general, or between
two cities that share particular services.
The importance of skill levels
There is considerable evidence that gains from accessibility are greater for
workers with higher skills levels. Gould (2007) finds that first-order benefits are
present for white-collar workers but not for blue-collar workers in the US, whilst
Andersson et al. (2014) find that only non-routine jobs benefit from
agglomeration in Sweden. These results are supported by Matano and
Naticchioni (2012), who find that first-order benefits in Italy appear to
strengthen along the wage distribution.
However, D’Costa et al. (2009) estimate that in the UK, the first-order effect of
accessibility on wages is largest for intermediate-skilled workers. In
particular, train accessibility (based on train journey times and ticket prices) has a
positive effect on intermediate-skilled workers, but little or no effect on high-
skilled workers (corporate managers and professionals) and low-skilled workers
in elementary occupations. The effect of road accessibility (based on road journey
times and fuel prices) is also largest for intermediate-skill workers, and slightly
larger for high-skilled than low-skilled workers, though the difference is not
pronounced. Given the lack of other research on skills-based effects in the UK, it
is unclear whether the difference between UK and European results is due to
differences in skills classifications, or to fundamental differences in the use of
transport infrastructure among socio-economic classes.
The importance of spatial decay
Research on spatial decay shows that the benefits of agglomeration decline
rapidly with distance from source; for instance, the construction of an
inter-city rail link between two cities will benefit the city centres much
more than areas far from the train stations, which take relatively longer to
reach. Gibbons et al. (2009b) have produced estimates for the extent to which
benefits decline with distance in the UK, which are used in the WebTAG
guidance on transport appraisals. In the context of improving transport
connectivity, spatial decay should be interpreted in terms of ‘effective distance’
(travel times) rather than physical distance.
Page 58
58 Frontier Economics | March 2016
Estimates for the UK economy as a whole, as well as for specific sector groups,
are shown in Table 6. A larger parameter estimate implies a faster rate of spatial
decay. A parameter estimate of 1.7 implies that a 1 hour reduction in travel times
on a journey that currently takes 10 hours has 7 times the effect of a 1 hour on
journey that currently takes 20 hours. To aid interpretation, we have added the
equivalent figures for the sector-specific estimates. An alternative way of
interpreting the distance decay parameter is that changes in economic mass
(employment) close by have a much larger effect on accessibility than changes in
economic mass far away (in terms of travel times). For example, a given increase
in economic mass in a market 10 hours away has one fiftieth (1/50) the effect as
the same change in a market 1 hour away.
The estimates show that spatial decay is substantially more rapid in service
sectors than in the manufacturing sector, which is likely to reflect the
importance of face-to-face interaction in service sectors. It is worth noting
that these estimates are rather high (the wider literature on travel, trade and other
flows generally uses a decay parameter of 1), but the differences in the relative
speed of decay across sectors is significant
Table 6. Spatial decay estimates across sectors
Parameter estimate Effect of 1h reduction in
journey taking 10h as factor of
journey taking 20h
All 1.7 7.0
Manufacturing 1.1 4.5
Construction 1.6 6.5
Consumer services 1.8 7.5
Producer services 1.7 7.0
Previous research supports the finding of rapid spatial decay. Rice et al. (2006)
find that for UK regions, markets located 40–80 minutes away have one-quarter
the effect of those located less than 40 minutes away, whilst markets located
more than 80 minutes away have no significant impact on local wages and
productivity.
In the context of inter-city connectivity in the North, this implies that benefits to
increased accessibility may be highly localised. Further, spatial decay is
exponential, which means that any given reduction in travel times will have a
larger effect on routes where current travel times are relatively short, than on
Page 59
routes with long travel times. The quality of intra-city transport networks is
important, because the relevant travel time applies to the door-to-door
journey: if intra-city networks are congested, an improvement in inter-city
connectivity may only have a small effect on the door-to-door travel time.
The fact that spatial decay is more rapid for services than for manufacturing,
coupled with the fact that services experience greater agglomeration benefits,
suggests that inter-city links should focus on cities with large service sectors that
are already relatively quick to travel between.
2.4 Implications for the strategic corridors that offer
the greatest opportunity
Based on the evidence above, the opportunity for productivity gains from
improved inter-city links will depend on:
the size of cities being linked;
current travel times between these cities;
the quality of their intra-city networks;
their geographic location in relation to surrounding cities;
their sector composition; and
the skills levels of their labour force.
The extent to which other drivers of growth are in place (in particular housing
availability and a favourable business environment) will also affect the potential
for second-order benefits from improved connectivity.
In Chapter 3 (on the economic geography of key Northern cities) and Chapter 4
(on the performance of transport systems between and within these cities
respectively), we examine each of these factors in turn to identify the corridors
with the greatest scope for driving growth.
Page 60
60 Frontier Economics | March 2016
Chapter 3: Local economic geography
Chapter overview
To build the strategic case for assessing improved connectivity in the Northern
Powerhouse, it is critical to understand the local economic geography. It helps us
to identify which inter-city connections could have the most potential for
unlocking or driving future improvements in economic performance.
We saw in Chapter 2 that the role of transport connectivity in economic
performance depends on the characteristics of the cities being linked. Improving
connections between large and growing cities would be likely to offer the greatest
opportunity for the productivity benefits that can result from agglomeration
effects. Realising these benefits does, however, also depend on the composition
of the economy and the skills mix of the workforce. In this chapter, we discuss
each of these characteristics in turn.
The structure of this chapter is as follows.
First, we outline the characteristics of the Northern Powerhouse city regions
taken as a whole, making comparisons with the UK and London where
relevant.
Second, we compare the city regions within the Northern Powerhouse. We
outline recent trends in populations and economic growth, we assess sector
compositions and we consider the productivity and skills of the workforce.
Finally, we conclude with several key observations to inform the strategic
case, linking the evidence on the local economic geography to the role of
transport connectivity in economic growth outlined in Chapter 2.
There has been a growing body of research on the economy of the Northern
Powerhouse city regions in recent years. We therefore draw on this to support
our analysis where relevant, particularly utilising research from the Centre for
Cities.43
3.1 The Northern Powerhouse
This section outlines the characteristics of the Northern Powerhouse as a whole,
considering the six city regions44 collectively. We focus on the size of the
43 http://www.centreforcities.org/
44 As will be detailed later, these are Liverpool, Manchester, Sheffield, Leeds, Hull and Newcastle.
Page 61
Northern Powerhouse, its economic composition and the skill mix of the
workforce, making comparisons with the UK and London where relevant.
Population and economy
The size of the Northern Powerhouse, taking the six city regions together, is
comparable to that of London. It has a population of 10.8 million people, around
17% of the UK’s population. The annual economic contribution of the Northern
Powerhouse is £209 billion of GVA. However, its 13% share of UK GVA is
around half that of London’s 25% (as shown in Table 7).
Table 7. Populations and economies of the Northern Powerhouse and London
Northern
Powerhouse
London*
Population millions 10.8 9.8
% of UK 17% 15%
Average annual
growth
(2001–14)
0.5% 1.2%
GVA £ billions 209 399
% of UK 13% 25%
Average annual
growth
(2001–14)**
1.4% 2.9%
* Note that the London population refers to the London urban area, which is larger than the Greater London
Authority area.
** Real growth rate, adjusted for inflation using ONS regional GVA indices up to 2013, and national GDP
deflator for 2014 due to data limitations.
Source: ONS Population Estimates (2014 data), ONS Regional Accounts (2014 data), London estimates
from Centre for Cities data tool (2014 data)
Average population growth in Northern Powerhouse cities was around 0.5% per
year over 2001–1445. This is forecast to increase to an average of 0.9% per year
45 ONS Population Estimates, Nomis (https://www.nomisweb.co.uk/).
Page 62
62 Frontier Economics | March 2016
out to 2030, based on demographic projections (United Nations 2014)46. This
equates to an increase of around 90,000 people per year in the population of the
Northern Powerhouse city regions, or around 1.4 million in total between 2015
and 2030.
The Northern Powerhouse economy (as measured by GVA) grew at an average
of around 1.4% per year over 2001–2014, compared with 2.9% in London. This
reflects both lower population growth and productivity compared with London.
An ambition for future economic growth to at least match the national average
growth rate by 2020 is one of the key stated aims for the Northern Powerhouse
(HM Treasury 2015b). Annual growth in the UK economy is forecast to be 2.3%
in 2020 by the Office for Budget Responsibility (2015). Higher employment
and/or productivity growth than past trends will therefore be needed to achieve
this aim.
Economic composition
The composition of the Northern Powerhouse economy is important for
understanding which sectors are already more prevalent and where the relative
potential to improve economic performance through improved inter-city
connectivity could be greatest.
The overall economic composition of the Northern Powerhouse is broadly
similar to the UK average, as might be expected when considering a large
geographic area. As with the UK average, a significant proportion of the
economy is in a variety of service sectors. As discussed in Chapter 2, these
sectors are particularly likely to benefit from the productivity gains that can result
from increased transport connectivity. Services in general may benefit relatively
more than other sectors because they tend to be more reliant on face-to-face
interaction, leading to learning and knowledge spillovers. Knowledge-based
services, such as financial and insurance activities, tend to particularly benefit
because of their relatively high reliance on skilled workers.
As shown in Figure 6, the proportion of GVA in the Northern Powerhouse
accounted for by such knowledge-based service sectors is relatively lower than
the national average. This is mainly because of the prominence of the public
administration, education and health sectors.
Production, which includes manufacturing, also accounts for a higher proportion
of the economy within the Northern Powerhouse compared with the rest of the
UK. The evidence discussed in Chapter 2 suggests that the potential for
46 Note this forecast uses slightly different geographic definitions to the city regions referred to
elsewhere. The areas included are United Nations urban area definitions for: Liverpool, Manchester,
Sheffield, Kingston upon Hull, Newcastle upon Tyne, Sunderland and West Yorkshire.
Page 63
agglomeration benefits is generally relatively lower in the manufacturing sector,
but this also depends on the skill mix within those sectors locally.
Page 64
64 Frontier Economics | March 2016
Figure 6. Proportion of GVA by industry
Source: Nomis, ONS Regional Accounts (2012 data)
Page 65
Productivity and skills
The availability of skilled workers is an important driver of economic
performance. Whilst the distribution of skills in the workforce is difficult to
measure directly, it can be assessed through consideration of qualifications and
overall labour productivity.
Qualification levels of the working age population in the Northern Powerhouse
are shown in Figure 7, compared with those of England and Wales. A smaller
proportion of the Northern Powerhouse population (29%) has qualifications of
NVQ level 4 or above compared with the average for England and Wales (36%).
A larger proportion has no qualifications: 11% in the Northern Powerhouse,
compared with 9% in England and Wales.
Labour productivity is also below the national average in the Northern
Powerhouse, with £44,850 GVA per worker, compared with £49,800 for the UK
average (Figure 8). The difference compared with London’s £63,500 is greater
still.
Figure 7. Highest level of qualification – % of working age population
Source: Nomis, ONS, Annual Population Survey (2014 data)
Page 66
66 Frontier Economics | March 2016
Figure 8. Labour productivity – GVA per worker
Source: Centre for Cities (2015) and ONS, Business Register and Employment Survey (BRES) (2013 data)
Summary
Taken together, the Northern Powerhouse city regions have a population
comparable with that of London. They make a significant contribution to the
economy, but have a much smaller proportion of UK GVA than London. The
population and economy of the Northern Powerhouse have been growing at
steady rates, around half that of London’s growth.
The composition of the Northern Powerhouse economy is broadly similar to the
national average. Qualification levels and productivity data both suggest that skill
levels in the workforce are somewhat below the national average.
We explore city differences in the next section.
3.2 Comparison of the city regions
This section compares the local economic geography of the city regions within
the Northern Powerhouse, focusing on population, the economy, economic
composition, jobs, productivity and skills. We find that the Manchester city
region is the largest in terms of its population and economy, followed by the city
regions of Leeds and then Newcastle. The city regions are generally more similar
to one another in terms of economic composition, productivity and skills.
Page 67
Further details on each individual city region are also outlined in the Annex.
Population
City scale is one of the important factors in determining the potential
productivity gains from agglomeration that could result from improving inter-city
transport connections. A simple comparison of populations in the city regions
can therefore be a useful indicator.
The Northern Powerhouse city regions together have a population of 10.8
million people, around 17% of the UK. Manchester city region is the largest (2.7
million), followed by Leeds (2.3 million) and Newcastle (2.0 million). The two
largest city regions, Manchester and Leeds, have seen the fastest growth from
2001 to 2014 and now account for 46% of the Northern Powerhouse population
between them (Figure 9).
Figure 9. Populations of city regions over time
Source: ONS Population Estimates
Economy
As with populations, the existing scale of economic activity can be an important
factor in determining the potential benefit from improved inter-city connectivity.
The economic contribution of the Northern Powerhouse city regions (Figure 10)
together is £209 billion GVA, some 13% of the UK total. All of the city regions
were growing rapidly in the years prior to the recession, with the Sheffield and
Page 68
68 Frontier Economics | March 2016
Hull city regions showing the strongest growth. The Manchester city region has
grown the most rapidly over the past three years, following the recession, with
the Liverpool and Sheffield city regions also showing strong recent economic
recovery.
The Manchester city region is the largest economy in terms of GVA (£57.4
billion), followed by Leeds (£47.1 billion) and Newcastle (£35.4 billion). The
GVA of the Manchester city region is second only to London (among the
proposed UK city regions47). The Manchester and Leeds city regions are the only
two with a share of GVA that exceeds their share of population in the Northern
Powerhouse, with 50% of the Northern Powerhouse GVA between them
(compared with 46% of the population). This may imply higher productivity than
the Northern Powerhouse average.
Figure 10. Economic performance of city regions over time (GVA, £bn)
Source: ONS Regional Accounts, adjusted to 2014 prices using GVA and GDP deflators
Employment levels across the Northern Powerhouse (Figure 11) also
demonstrate the relative economic scale of the city regions. Employment follows
a similar pattern to the scale of economic activity. The biggest city regions have
the highest employment (numbers of jobs), particularly Manchester, Leeds and
Newcastle. This suggests higher employment density in these areas, with jobs
appearing somewhat more spread out in other city regions.
47 Office for National Statistics (2015b), and ONS Regional Accounts (2015c).
Page 69
In terms of total job numbers, the Manchester city region has the most, followed
by the Leeds and Newcastle city regions (Table 8).
Page 70
70 Frontier Economics | March 2016
Figure 11. Distribution of jobs across city regions
Source: Centre for Cities (2015) (2011 Census data)
Table 8. Number of jobs in city regions (2013)
Region Number of Jobs
Liverpool City Region 594,872
Manchester City Region 1,207,529
Leeds City Region 993,830
Sheffield City Region 531,897
Hull City Region 365,737
Newcastle City Region 770,771
Source: Centre for Cities (2015) and ONS, Nomis, BRES (2013 data)
Economic composition
The economic composition of the city regions within the Northern Powerhouse
is generally quite uniform. Figure 10 shows the percentage point difference in
Page 71
industry share compared with the Northern Powerhouse average, where 0%
implies an economic sector share that is the same as the average.
The most notable difference is the Hull city region, which has approaching 12
percentage points more of its economy in production than is the case, on
average, in the Northern Powerhouse. The Liverpool, Sheffield and Newcastle
city regions have greater proportions of their economies in public administration,
education and health than the average.
The Manchester and Leeds city regions have a higher proportion of their
economies in producer services (which include finance, insurance, real estate and
business services48), which we have seen are likely to particularly benefit from
agglomeration effects. These sectors together contribute 5 percentage points
more of GVA in the Manchester city region than the Northern Powerhouse
average, and 3 percentage points more in the Leeds city region.
Further details on economic composition by city region are provided in the
Annex.
48 Also includes professional services, which may be spread across the categories in Figure 10. See
OECD definition, https://stats.oecd.org/glossary.
Page 72
72 Frontier Economics | March 2016
Figure 12. Difference in industries compared to Northern Powerhouse average
Page 73
Productivity and skills
The distribution of skilled workers across the Northern Powerhouse can provide
an important indication of economic potential. This is true in terms of both the
role of skills in agglomeration benefits and also the direct role of skills in
economic performance more generally.
The availability of high-skilled workers can be compared across city regions using
information on the proportion of the working age population with qualifications
of NVQ level 4 or above (Figure 13). The Manchester city region has the highest
proportion of people in this category, with 32%. All the other city regions have
proportions ranging between 27% and 29%, showing relatively small differences
in the availability of skilled workers.
Extending this analysis to also consider more intermediate skills, which can also
benefit from agglomeration benefits, shows a similar story. The proportion of the
population with NVQ level 3 or above ranges from 49% to 53% across the city
regions; Manchester city region has the greatest proportion of such workers
(Table 9).
Productivity, measured in terms of GVA per worker, shows very similar levels
across the city regions (Figure 14), with the Liverpool city region showing the
highest, just above the Leeds, Manchester and Hull city regions. This again
suggests broadly similar skill distributions at the local level.
Page 74
74 Frontier Economics | March 2016
Figure 13. Proportion of working age population qualified NVQ level 4 or above
Source: Nomis, and Office for National Statistics, Social Survey Division (2015)
Page 75
Figure 14. Labour productivity by city region – GVA per worker
Source: Centre for Cities (2015), ONS Regional Accounts (2013 data) and BRES (2013 data).
Summary
Key data on each of the city regions from the discussion above are summarised
in Table 9. The key points are the following.
Manchester is the largest city region in terms of population and economic
activity, followed by the Leeds and Newcastle city regions.
Manchester city region has the highest proportion of working age people
with qualifications of NVQ level 4 or above, with 32%. All the other city
regions have proportions ranging between 27% and 29%, showing relatively
small differences in the availability of skilled workers.
Labour productivity levels are very similar across the city regions, apart from
Sheffield, which is around 10% lower than Manchester and 7% lower than
the second to least lowest productivity city, Newcastle. The highest
productivity city is Liverpool at £45,950 GVA/worker.
It is worth noting also that Sheffield, despite its relatively low productivity, is the
fastest growing city region of all in the Northern Powerhouse. Its annual growth
over 2001–2014 was 1.77% compared with the next fastest, Newcastle, at 1.59%.
Page 76
76 Frontier Economics | March 2016
Table 9. Summary of city region characteristics
Region Population GVA Jobs Productivity NVQ
4+
NVQ
3+
2014,
million
2001–
14,
Average
annual
growth
2014,
£
billion
2001–14,
Average
annual
growth
2013,
million
£ GVA/
worker
% working
age
population
Liverpool
city region
1.5 0.16% 28.3 1.01% 0.59 45,950 27% 49%
Manchester
city region
2.7 0.64% 57.4 1.43% 1.21 45,550 32% 53%
Leeds
city region
2.3 0.64% 47.1 1.49% 0.99 45,650 29% 51%
Sheffield
city region
1.4 0.58% 23.9 1.77% 0.53 41,200 28% 51%
Hull
city region
0.9 0.41% 17.5 1.07% 0.37 45,300 27% 50%
Newcastle
city region
2.0 0.26% 35.4 1.59% 0.77 44,150 29% 52%
Northern
Powerhouse
10.8 0.47% 209.5 1.41% 4.46 44,850 29% 51%
Sources: See Tables 7 and 8.
3.3 Key observations to inform the strategic case
This section concludes our discussion of local economic geography with a few
key observations to inform the strategic case. Here we link the evidence on the
local economic geography to the role of inter-city transport connectivity in
driving and unlocking economic performance.
In Chapter 2, we outlined evidence from the academic literature on the role of
transport investment in economic performance.
Unlocking growth. Investment should be targeted at cities where the
economy and transport demand are growing and capacity constraints
are beginning to have an effect. This implies that the priority inter-city
Page 77
links will be those between the fastest growing cities in the North,
and/or the corridors already facing high levels of congestion.
Driving growth. Investment should be targeted at corridors that are
able to facilitate agglomeration through enhanced accessibility to
economic mass (i.e. workforce). This depends on the size of the cities
being linked, the distance between these cities, the quality of their intra-
city networks, their geographic location in relation to surrounding cities,
as well as their sector compositions and, importantly, the wider drivers
of economic performance.
In the remainder of this section, we discuss the local economic geography of the
Northern Powerhouse in this context.
Unlocking growth
The most promising inter-city links for unlocking growth are expected to be
those between the fastest growing cities in the North, and/or the corridors
already facing high levels of congestion. We discuss the former here, while
Chapter 4 outlines congestion across the city regions.
The Northern Powerhouse has a growing population, with growth having
averaged 0.5% per year from 2001 to 2014 and forecasts showing continued
growth out to 2030.
The city regions that have shown the fastest population growth are
Manchester, Leeds and Sheffield. Each showed population growth averaging
around 0.6% per year from 2001 to 2014.
Driving growth
Of the factors affecting how transport connections can drive growth, we discuss
evidence from the economic geography evidence above for the following in turn:
the size of the cities being linked, their sector compositions and the quality of
their labour force. The remaining factors, relating to geographic location, the
distance between cities and intra-city networks, are discussed in Chapter 4.
Size of the cities. The opportunity for productivity benefits from
agglomeration is usually greatest for larger cities, with higher employment
density. The largest city region in the Northern Powerhouse is Manchester,
in terms of population (2.7 million), the economy (£57 billion) and jobs (1.2
million). This is followed by the Leeds and Newcastle city regions. The city
centres of Manchester, Leeds and Newcastle also appear to have particularly
high employment densities.
Page 78
78 Frontier Economics | March 2016
Sector composition. Those sectors that would be expected to benefit most
from agglomeration tend to be service sectors. This reflects that they are
generally more reliant on face-to-face interaction, leading to learning and
knowledge spillovers, and that producer services in particular tend to need
access to high-skilled workers. Manufacturing industries tend to show lower
potential for agglomeration benefits in general. The industry composition of
the Northern Powerhouse is broadly similar to the UK average, but with a
degree of specialisation in individual regions. The Manchester and Leeds city
regions have higher proportions of their economies in producer services
than the Northern Powerhouse average, suggesting higher potential gains in
economic performance from increasing accessibility to these cities.
Meanwhile, those regions that are more reliant on manufacturing, such as
the Hull city region, suggest comparatively lower – though still positive –
potential gains from agglomeration, but this also depends on the skill mix
within those sectors locally.
Quality of labour. Skill levels are particularly important for considering the
potential for increased accessibility to drive economic performance – the
greatest gains are likely by increasing accessibility to skilled workers. The
proportion of skilled workers appears fairly similar in each of the city
regions. The Manchester city region has the highest proportion of people
qualified NVQ level 4 or above, but the differences between the city regions
are modest; and labour productivity levels are very similar across the city
regions, apart from Sheffield (which is 10% lower than Manchester).
Taken together, average skill levels in the Northern Powerhouse
appear somewhat below the national average. This suggests that wider
policies are also important for increasing the overall pool of skilled workers
available within the Northern Powerhouse as a whole, either from up-skilling
within the region or attracting skilled workers from elsewhere.
The economic geography therefore suggests a prominent role from improving
inter-city transport connectivity to/from the Manchester city region, with the
Leeds city region also appearing particularly important, given its relatively large
population, its comparatively high productivity and the fact that it has among the
highest level of skills in the Northern Powerhouse.
Page 79
4 Chapter 4: Overview of the Strategic
Transport Network in the North
Chapter overview
The economic framework (Chapter 2) highlighted the fact that transport
improvements can both unlock and drive improvements in economic
performance. To understand which inter-city corridors may have the highest
potential to do so, it is important that we examine the performance of the
Northern Powerhouse’s transport system.
This chapter will address the following.
First, we provide an overview of the current rail and road network in the
north.
We then examine the main differences in demand and performance of the
northern strategic rail and road networks.
Next, we look at how the freight industry interacts with the current transport
system, and identify freight-related constraints and opportunities in the
north.
We then highlight some of the gaps in our knowledge, the data limitations
and some further analysis that could be insightful should the data become
available.
Finally, we conclude with a few key observations.
4.1 Overview of the current strategic rail network in
the Northern Powerhouse
Overview of the main northern strategic rail corridors
Northern inter-city rail connectivity is focused upon a central east-to-west route
spanning from Liverpool on the west coast to Hull on the east coast. Newcastle
joins the network from the North at Leeds, while Sheffield connects in from the
South, at both Leeds and Manchester. This is shown in Figure 15.
Page 80
80 Frontier Economics | March 2016
Figure 15. Northern inter-city train routes and journey times
Source: High Speed Two Limited (2014)
Figure 15 illustrates how Leeds and Manchester are important nodes in the
network: Manchester connects directly to both Liverpool and Sheffield; and
Leeds connects directly to the eastern cities Newcastle, Hull and Sheffield. The
Manchester–Leeds trans-Pennine link is critical because it provides the principal
route for rail services from the western cities (Liverpool and Manchester) to get
to any of the eastern cities (Leeds, Newcastle and Hull), and vice versa.
Demand for inter-city strategic rail in the north
The centrality of the Leeds and Manchester nodes is reiterated in Figure 16,
which shows the number of inter-city rail commuters for each city (inbound and
outbound commuters combined). These two cities are the origin or destination
for 60% of all inter-city commuters. Liverpool and Sheffield account for another
large share (34%) while Hull and Newcastle make up the remaining 6%.
Page 81
Figure 16. Northern inter-city commuting by rail: number of people who
commute by city (inbound and outbound commuters combined)
Source: Office for National Statistics (2011), Travel to Work Area (TTWA) data
Note: This graph shows the number of people who live in a TTWA in one city, and commute to work in a
TTWA in a different city; for example, Manchester represents all those who commute out of Manchester to
any other city and into Manchester from all other cities.
When looking deeper at the patterns of commuting across northern cities – by
rail – we observe some corridors that have significantly higher commuter flows
than any of the other corridors. This is shown in Figure 17. This analysis is
based on census data in which respondents reported whether they travelled to a
different city for work and by which means of transport. As such, these data
capture both city-centre to city-centre rail travel and also rail commuting from
the broader city region to anywhere in the destination city region. However,
given that the busiest rail stations are in city centres, as shown in Table 10, it is
likely that many of these rail commuters finish their journey in the city centre.
Page 82
82 Frontier Economics | March 2016
Figure 17. Northern inter-city commuting by rail: number of people who live in one
city and commute to a different city
Source: Office for National Statistics (2011), TTWA data
Note: This graph shows the number of people who live in a TTWA in one city, and commute by rail to work in a
different TTWA. Each city pair is named ‘larger city and smaller city’, based on population. For example, the
red bar for Manchester–Liverpool represents the number of people who live in Liverpool and commute to work
in Manchester.
Rail commuting patterns between northern cities, as illustrated in Figure 16 and
Figure 17, show three striking patterns:
there are three busy corridors: Manchester–Liverpool, Manchester–
Leeds and Leeds–Sheffield;
there are greater flows between cities that are in close proximity to each
other: Newcastle, which is located further from the other cities, has
negligible intercity commuter flows; and
in each of these corridors, the flow is approximately twice as high from
the smaller to the larger city, than it is in the other direction.
After the three busiest routes, inter-city commuter flows are far lower for the
remaining routes; for instance, Manchester–Sheffield has roughly one-quarter of
the number of daily rail commuters of Leeds–Sheffield (500 compared to 2000,
approximately).
While these commuter figures provide a strong indication of rail demand in the
peak, it should be noted that they do not capture all journey purposes. The
Page 83
figures capture all commuters who live within one of the northern city regions
and travel to work in a different city region.49 They do not include business
travel, leisure travel, or travel to schools or universities, for example. Despite
these limitations, it is justifiable to focus on commuter flows because they
provide an indication of how mobile the labour market is, and how far businesses
and workers are reaching out to find suitable jobs. They also indicate the demand
for inter-city rail travel given current services and travel times: workers are willing
to travel 48 minutes (Manchester–Leeds) to work in a different city if the job
pays sufficiently, while they do not generally seem willing to travel over an hour
for work (very few travel to or from Newcastle, for example).
Table 10 shows the busiest stations in the Northern Powerhouse cities, based
upon the total passengers entering and exiting the stations in 2014–2015. They
include all passenger types, thus including both intra- and inter-city rail
passengers. This lends further evidence that Leeds, Manchester and Liverpool
(which all have combined passengers in excess of 28 million per year) have the
highest demand for rail travel. Sheffield and Newcastle have eight million and
nine million passengers, respectively, while Hull has two million passengers enter
and exit its station annually. There has been considerable growth in rail
passengers over the past five years: Leeds (31%), Manchester (24%), Sheffield
(21%) and Newcastle (21%).50
49 We use the definition of city regions from Office for National Statistics (2015b). As this does not
include a definition for Hull, we take it to be the ‘East Yorkshire and Northern Lincolnshire’ NUTS
level 2 region.
50 Liverpool’s Lime Street station’s passenger numbers increased by 34%, although numbers fell in
Liverpool’s other stations (Liverpool Central and Liverpool James Street). The overall change was
approximately a 2.5% increase in passenger numbers across the three Liverpool stations.
Page 84
84 Frontier Economics | March 2016
Table 10. Busiest stations in Northern Powerhouse cities, by number of entries
and exits in 2014–15
Station name
Total number of entries
and exits in 2014–15
Percentage change
between 2009–10 and
2014–15
Leeds 28,847,648 31%
Manchester Piccadilly 24,614,970 24%
Liverpool Central 15,272,837 –17%*
Liverpool Lime Street 14,870,920 37%
Sheffield 9,112,726 21%
York 8,586,056 25%
Newcastle 8,053,112 12%
Manchester Oxford Road 7,598,295 24%
Manchester Victoria 7,282,062 24%
Manchester Airport 3,460,854 32%
Liverpool James Street 3,215,334 -4%
Hull 2,199,092 2%
* Liverpool Central was closed for four months for refurbishments in 2012, which coincides with the time
during which a large fall in passenger numbers occurred – passenger numbers fell from 18 million to 13.5
million between 2010–11 and 2012–13. While passenger numbers have increased since then, they have
not yet reached the previous level. See BBC (2011).
Source: Office of Rail and Road (2015)
Note: This table includes the eight busiest northern stations, by entries and exits in 2014-15, alongside
some other important stations for the Northern Powerhouse cities: Manchester Airport; and city centre
stations such as Liverpool James Street.
Performance of inter-city strategic rail
This subsection explores the performance of the strategic rail network in the
north by considering journey times, speed, frequency and congestion of each
route.
Journey times
Journey times are important for users because these, along with cost, determine
the extent to which users are prepared to make a particular trip. Distance, per se,
Page 85
is typically less relevant to the decision. In terms of journey times, Figure 18
illustrates the quickest journey times by rail between each of the six largest
northern cities we are focusing on. An illustrative breakdown of the journey
times provides three categories:
less than 40 minutes (Liverpool–Manchester and Leeds–Sheffield51);
between 41 and 50 minutes (Manchester–Leeds and Manchester–
Sheffield);
longer than 50 minutes (Newcastle–Leeds, Leeds–Hull and all indirect52
routes such as Newcastle–Sheffield and Liverpool–Leeds).
The Manchester–Leeds link (48 minutes), which most of the indirect trains use,
takes longer than the Leeds–Sheffield link (40 minutes), which is a similar
distance. The longest journey times, as expected, are typically those that cover
most geographical distance, either directly or indirectly.
It is also interesting but perhaps unsurprising to note that the routes with highest
demand each have the shortest direct journey times. The shortest is Liverpool–
Manchester and, as we saw in Figure 15, this is also the link with the highest
commuter flows.
The Manchester–Sheffield route is a notable exception: its journey time is 49
minutes, yet the number of people commuting by rail is significantly below the
three other corridors with journey times less than 50 minutes (Liverpool–
Manchester; Leeds–Sheffield and Manchester–Leeds). This highlights an
important point, that a route will not have high demand just because of its
journey time. This is because transport is a means to an end, not an end in itself.
As such, demand will be driven by whether people can derive a benefit from
using that transport link, which exceeds the total cost to them of making the trip
(time and money), for instance by providing access to work, education or leisure.
Quicker journey times will only increase demand in so far as they allow people to
gain quicker access to locations or activities from which they can derive a
sufficient benefit.
Speed and frequency
While journey times are useful, speed provides a further indicator of the service
performance. Figure 18 indicates that the four rail links services with highest
51 Leeds–York is also within this category, but we focus our discussion on the cities discussed in
Transport for the North (2015a), which includes Liverpool, Manchester, Leeds, Sheffield, Newcastle
and Hull.
52 We consider routes to be indirect if they have to pass through a different city along the way to their
destination city. For instance, Liverpool–Manchester services are direct, but Liverpool–Leeds
services must go indirectly through Manchester.
Page 86
86 Frontier Economics | March 2016
commuter demand also tend to be the slowest: of these four, only Leeds–
Sheffield services have speeds in excess of 50 mph, whereas trains to Newcastle
travel at 71 mph.
Figure 18. Northern inter-city rail routes: speed and frequency of fast trains
Source: Re-produced from One North (2014)
These speeds may not, however, be directly comparable for numerous reasons,
such as: the constraints associated with the average and maximum speeds of the
trains and track; congestion on the track; the distance between stations and the
number of stations at which trains stop. Indeed, the topography of the route may
mean that faster trains are not possible, at least without considerable cost.
However, for illustration, we can try comparing performance against similar
international examples. One North (2014) highlights Randstad53 and Rhein-
Ruhr54, in the Netherlands and Germany respectively, as regions with similarly
53 The Randstad region consists of Amsterdam, Rotterdam, Den Haag and Utrecht. It has a
population of 7 million. Excluding Amsterdam, their per capita GDP ranges between approximately €35,000
and €40,000, which is higher than the approximate €25,000–€35,000 range of the northern cities. City to city
distances are between 30 and 50 miles.
54 The Rhein-Rruhr region of Germany consists of Cologne, Düsseldorf, Duisburg, Essen and
Dortmund, alongside 10 other smaller cities. It has a population of 10 million and, excluding Dusseldorf, has
a per capita GDP that ranges from less than €30,000 to €45,000, approximately. Several of the city distances
are in the 30–50 mile range.
Page 87
sized and spatially located cities. All of the Rhein-Ruhr cities have speeds in
excess of 63 mph, compared to 40–57 mph on all the shorter distance English
routes.55 While the Randstad has some slower trains, relative to northern
England, they are substantially more frequent. Indeed, only two out of seven of
the North’s routes have four or more services per hour (Liverpool–Manchester
and Manchester–Leeds), compared to 11 out of the 13 services on the European
routes examined.
One North (2014) highlights that these European region’s services are better
timed to support quick connections at key interchanges. There is no readily
available evidence on this particular issue within the Northern Powerhouse, but
further analysis may be justified if it can identify places where better connection
times have the potential to reduce travel times, without incurring network
improvement costs.
Crowding
Table 11 illustrates how crowded trains are when arriving into each station
during peak morning times, and indicates that trains arriving at Manchester are
the most crowded of the Northern Powerhouse cities. On average, these trains
have an overcapacity of 6% and 20% of passengers are standing. It is notable that
the crowding on trains into Manchester is approaching the level in London (an
overcapacity of 7%), which has the highest level of crowding in the UK.
Unfortunately, there is no available breakdown of where these crowded trains
originate, or at what point along their route they become overcrowded. As such,
it is not possible to conclude which corridors are more overcrowded than others.
Levels of crowding on services into key stations at Manchester and Leeds are in
line with the previous evidence that most commuting occurs into Manchester
(from Liverpool and Leeds) and into Leeds (from Sheffield). Further analysis of
route level data would be needed to identify whether these inter-city routes are
the most overcrowded.
55 The longer routes English routes to Newcastle can reach up to 71 mph.
Page 88
88 Frontier Economics | March 2016
Table 11. Demand, excess demand and passengers standing, at peak morning times,
by city of arrival56
Station
Total passengers
arriving in morning
peak hours*
Passengers in excess
of capacity (1 hour
peak)**
Percentage of
passengers standing
(1 hour peak)***
Manchester 30,907 5.7% 20.3%
Leeds 25,897 2.5% 14.9%
Liverpool 20,155 0.0% 5.5%
Sheffield 7,224 2.3% 7.8%
Newcastle 4,447 2.2% 9.2%
London 563,354 7.2% 27.9%
* Total passenger numbers include both inter- and intra-city passengers arriving into these stations. As such, the
figures shown here are considerably larger than the inter-city passenger numbers in Figure 16. Numbers are for 3
hour AM peak.
** Passengers in excess of capacity and percentage of passengers standing are calculated by the Department for
Transport as a percentage of the critical load. The critical load is the highest number of standard class passenger
on a service on arrival at (AM peak) or on departure from (PM peak) a city. However, these values are of the same
order of magnitude as if they were calculated as a percentage of the total number of passengers arriving.
Numbers given are for 1 hour AM peak (3 hour peak data shows a similar pattern, but with slightly lower
congestion).
***Percentage of passengers standing numbers are for 1 hour AM peak (3 hour peak data shows a similar pattern,
but with slightly lower congestion).
Source: Department for Transport (2014a).
4.2 Overview of the current strategic road network in
the Northern Powerhouse
Overview of the northern strategic road network
The strategic road network linking the northern cities is similar in structure to
that of the rail network, as shown in Figure 19.
56 Hull is excluded due to lack of data availability.
Page 89
Figure 19. Map of the main motorway network of northern England
Source: Reproduced from Highways England (2015)
The major corridor is the M62, which spans west-to-east from Liverpool to Hull,
passing through Manchester and Leeds. Manchester is surrounded by the M60
ring-road motorway, which feeds into the M62 in both directions. The M1 links
Sheffield northwards to Leeds and continues on to Newcastle.57 Sheffield to
Manchester does not have a motorway link, but is served by the A57. As was the
case with rail, the Manchester–Leeds trans-Pennine link is critical because it
provides the principal route for traffic from the western cities to get to any of the
eastern cities, and vice versa.
Demand for inter-city strategic roads
The inter-city commuting flows by road are shown in Figure 20. While the most
popular corridors are similarly ranked, there are some important differences from
rail commuting flows. As for our analysis above for inter-city rail commuting
flows, we draw on the latest census data for commuting travel between TTWAs.
It is likely that the final destinations of road commuters are more dispersed than
would be the case for inter-city rail travel.
57 The link between Leeds and Newcastle is not shown to the map. North of Leeds, the M1 is known
as A1(M) as only parts have been upgraded to full motorway status.
Page 90
90 Frontier Economics | March 2016
Figure 20. Northern inter-city commuting by road: number of people who live in
one city and commute to a different city
Source: Office for National Statistics (2011), TTWA data
Note: this graph shows the number of people who live in a TTWA in one city, and commute – by road – to
work in a TTWA in a different city. Each city pair is named ‘larger city and smaller city’, based on
population. For example, the red bar for Leeds–Sheffield represents the number of people who live in
Sheffield and commute to work in Leeds.
The notable patterns are:
ten-fold more commuters travel inter-city by car than by rail,
highlighting the importance of car travel for commuting in northern
England;
as with rail commuting, there are larger flows from the smaller city to
the larger city, than vice versa;
there are two major commuter links with more than 35,000 commuters:
Leeds–Sheffield and Manchester–Liverpool;
Manchester–Leeds (17,000 commuters per day) and Sheffield–Hull
(10,000 commuters per day) also have a large number of commuters,
albeit fewer than half the number of the top two commuting links noted
above;
Leeds–Hull (7,000 daily commuters) and Manchester–Sheffield (4,000
daily commuters) have relatively low levels of commuting; and
Page 91
the remaining city pairs, which have greater geographical distances
between them, have a very low level of commuting (less than 2,500 daily
commuters).
Unlike rail commuting where three inter-city links stand out, there are only two
inter-city strategic road links that have significant commuting: Leeds–Sheffield
(46 miles) and Manchester–Liverpool (34 miles). Manchester–Leeds (about 44
miles), which was highlighted above as an important link for rail commuters, has
fewer than half the number of road commuters as the leading two inter-city
strategic road links.
The number of people commuting by car is much larger than the number
commuting by rail. This indicates the relative importance of car travel as a means
to access work in northern cities. As these commuting data account for
commuters who live in one city region and travel to another city region for work,
the reliance on the car for commuting could reflect the fact that many car
journeys do not enter the city centre (unlike rail) but instead travel to destinations
for work in the wider city region.
In general, these commuting data provide evidence of demand for different inter-
city road travel and are an indicator of how mobile the northern labour force is.
Performance of the strategic road network
This subsection will analyse the performance of the road network based on
journey times and congestion.
Journey Times
Journey times by road, as shown in Figure 21, are typically quickest between
those cities that are located close to each other: Manchester–Liverpool (44
minutes), Manchester–Leeds (56 minutes) and Leeds–Sheffield (48 minutes);
whereas journeys to Newcastle and indirect journeys, such as Liverpool to Leeds,
take over an hour.
One notable exception is the Manchester–Sheffield link, where journeys are over
an hour despite the fact that the distance is shorter than both the Manchester–
Leeds and Leeds–Sheffield links. This is due to the lack of a direct motorway link
between Manchester and Sheffield. The geography, consisting of a national park
and the Pennines, between Sheffield and Manchester has restricted the
improvement of this link. However, Department for Transport (2015) have
recently proposed some improvements, such as a new dual carriageway link, to
improve journey times on this route.
Page 92
92 Frontier Economics | March 2016
Figure 21. Northern inter-city road routes: distance and journey times58
Source: One North (2014)
Congestion
Figure 22 highlights that there is currently high congestion59 on the M62
between Liverpool and Manchester, and also between Manchester and Leeds; on
the M60 around Manchester; on the M1 near Sheffield; on the M6 leading into
Manchester; and, on the A1(M) near Newcastle. High congestion on the Leeds–
Manchester M62 link is particularly notable, given the strategic importance of this
link at the centre of the west-to-east corridor.
It may not always be the case that the inter-city strategic roads with the highest
volumes of commuters are the most congested because other factors need to be
taken into account, such as capacity of the road, use of the road by other
58 One North (2015) does not define whether these journeys are average journeys or free flowing
traffic journey times. Based on AA Route Finder (2015), they seem consistent with free flowing traffic
journey times.
59 This is the Highways Agency’s categorisation, based on vehicle hour’s delay, which is an estimate
of the total travel time experienced by all road users over and above the expected theoretical free-flow travel
time.
Page 93
travellers (freight, business travellers and leisure travellers) and time of day over
which congestion is measured.
Figure 22. Current congestion on the strategic road corridors in the north of
England, 2012–2013
Source: Highways Agency reported in Steer Davies Gleave (2014)
The analysis by High Speed Two (2014) of Department for Transport data
suggests that congestion will increase over the coming years in similar areas to
those already highlighted; as well as increasing on the M1 between Sheffield and
Leeds, which is important given the fact that this is the corridor with highest
current demand for road commuting.
4.3 Comparison of the strategic road and rail
networks in the Northern Powerhouse
This section analyses the differences in the demand and performance of the road
and rail networks in the Northern Powerhouse.
Comparison of Figure 15 and Figure 21 reveals that inter-city rail journey times
are often faster than the equivalent road journey. This is particularly true for
longer journeys such as Leeds to Newcastle, where rail can take approximately an
hour and 16 minutes, while road journeys are almost 30 minutes longer. In this
sense, rail has an advantage over roads, but the onward journey when arriving in
the city at the end of the rail trip should also be accounted for. Intra-city
Page 94
94 Frontier Economics | March 2016
congestion could dampen some of these benefits, depending on the final
location.
Figure 17 and Figure 20 highlight the big difference in commuting patterns for
the strategic rail and road networks: there are approximately ten-fold more inter-
city road commuters than rail commuters. While road is by far the most
commonly used mode for travelling between city regions for work, high demand
for both road and rail (evidenced by crowding seen on both networks) suggests
that they complement each other and both play an important role in supporting
economic activity in the north of England. As noted above, it is likely that rail
journeys are primarily used to travel into city centres, while road travel has many
potential destinations. Important road and rail routes going into the largest cities
in the north are showing clear signs of being under pressure from congestion and
crowding.
To contribute to the evidence base on commuting patterns and the extent to
which they are at the levels that would be expected given the characteristics of
the cities, we have carried out our own analysis in the form of ‘gravity modelling’,
as described in the box below.
Page 95
Actual commuting flows versus expected commuting flows
Another way of thinking about the extent to which the transport network is
constraining economic activity is to consider whether flows between certain cities
are lower than expected, given the characteristics of the cities and the distance
between them. If flows between certain cities are significantly lower than
expected, this could imply that constraints on inter-city connections exist.
To compare actual and expected flows between cities in the North, we adopt a
‘gravity’ modelling approach. We follow the methodology used in the Northern
Way report (D’Costa et al. 2009), which analyses commuting flows between
Manchester to Leeds, and extend this to commuting between the six largest
Northern Powerhouse cities. Gravity models explain commuter flows between
two areas based on the observable characteristics of the origin and destination
areas (wages and employment), the geographic distance between the areas, and
any other characteristics of the origin and destination areas not observed by the
researcher. The aim is to identify which, if any, inter-city corridors between the
six Northern cities have significantly lower commuter flows than predicted by the
gravity model, compared to inter-city flows between cities in the South of
England, Scotland and Wales.60 This could then indicate transport constraints
between the two cities – indeed, the Northern Way report (D’Costa et al. 2009)
found that the 40% lower than expected commuter travel flows between
Manchester and Leeds under one model variation (explained below) were fully
explained by lengthy travel times.
Unobserved characteristics in the modelling may capture culture or quality of
place, but they may also reflect transport-related factors such as connectivity or
congestion. To the extent that they capture the latter, controlling for unobserved
characteristics may bias results, if our aim is to explore which corridors have low
flows due to congested transport networks. We therefore consider 3 different
specifications (model variations), which control for unobserved characteristics to
different extents. Details of the modelling and results are presented in the Annex.
The inter-city corridors that have significantly lower than expected commuter
flows based on all 3 specifications are Manchester-Sheffield, Liverpool-Sheffield,
Liverpool-Leeds and Hull-Manchester.61 Of these, low commuter flows between
60 The cities considered are: Birmingham, Bristol, London, Nottingham, Oxford in the South; Edinburgh,
Glasgow and Aberdeen in Scotland; and Cardiff and Swansea in Wales. The models inter-city LA-
LA flows between cities in the North to inter-city LA-LA flows in the South, Scotland and Wales.
Cities are defined as city regions, based on existing and proposed city regions and the definitions
used in the Northern Way report (D’Costa et al. 2009).
61 Leeds-Manchester, Hull-Newcastle, Liverpool-Newcastle and Leeds-Newcastle are also significantly lower
in one of the three specifications. Leeds-Manchester is significant under the specification controlling
for unobserved characteristics, but not others – this is consistent with the findings of the Northern
Way report (D’Costa et al. 2009).
Page 96
96 Frontier Economics | March 2016
Liverpool and Leeds, and between Liverpool and Sheffield, are easily explained
by the fact that Manchester lies between these cities (the modelling cannot
account for the spatial configuration of cities). Therefore, the modelling
indicates that transport constraints may exist on the Hull-Manchester and
Manchester-Sheffield corridors. Flows between these city pairs are at least
25% and 38% lower than expected respectively.
Indeed, currently commuters between Hull and Manchester tend to travel
through Leeds, which means that travel times are higher than the geographic
distance suggests.
It is worth noting that unlike the Northern Way report (D’Costa et al. 2009), our
analysis does not identify commuting along the Manchester-Leeds corridor to be
significantly lower than expected. This is due to two reasons. First, we take into
account a larger number of comparator inter-city links, as well as all corridors
between the 6 Northern Powerhouse cities, which brings down average
commuter flows. Second, we report only those corridors that are significantly
negative based on all 3 specifications, whilst the Northern Way report obtains a
significantly negative result for Manchester-Leeds only under one specification
(controlling for all unobserved origin and destination characteristics). In our
modelling, flows between Manchester and Leeds are also significantly lower than
expected under this particular specification, although the gap is smaller (8%
compared to 40%) due to the inclusion of a wider range of comparator inter-city
links.
4.4 Road and rail data limitations
This section summarises the gaps in our knowledge due to a current
lack of evidence and data.
Our analysis has looked at commuting patterns by road and rail as this
indicates workers’ propensity to travel from one city to another to find a job
they prefer. To gain a richer understanding of which routes commuters use
(i.e. between which stations rail passengers travel and between which areas
of the city regions road users travel), it would be beneficial to examine data
on the usage of individual road and rail routes. It has not been possible to
obtain these data in the time available for this study.
Our data on rail crowding are based on services arriving into stations, rather
than crowding on particular train routes or services. As such, we cannot
infer which particular services are more crowded than others. To further
understand the extent to which pressures on the transport system constrain
Page 97
economic performance, it would be useful to examine data on rail
overcrowding on individual links. This data was not available for this study.
To understand the economic geography of the area in more depth and how
this affects the labour market, it would be useful to know which jobs
workers are willing to travel to other cities for. This would indicate, for
example, the extent to which workers travel from one city to another for
low- or intermediate-skilled jobs, as well as high-skilled jobs.
Although the focus of this study is inter-city travel, it is important to
recognise that intra-city transport performance (alongside other drivers of
economic performance) is critical to whether the opportunities associated
with improved inter-city connectivity can be realised. This has not been
assessed within this Chapter.
Travel costs have not been assessed in this Chapter but these are likely to
play an important role in determining the extent to which there is inter-city
travel by rail and road, and the choice of mode.
4.5 Overview of freight activity in the Northern
Powerhouse
Freight movements by rail and road are a significant consideration for inter-city
connectivity in the Northern Powerhouse. This section provides a high-level
outline of key freight routes in the Northern Powerhouse. We find that there is
strong existing freight activity, and this is likely to increase in the future,
particularly in light of significant upcoming port investments.
Freight activity across the Northern Powerhouse
Freight activity is an important aspect of transport performance because of its
impact on the wider economy. Freight costs form an element of the final price of
goods to consumers. In some cases, these costs can even exceed the cost of the
production process – excluding raw materials (Independent Transport
Commission 2014). Similarly, freight costs are also a direct cost to businesses,
affecting UK competitiveness in an increasingly globalised market. Freight can
also have impacts on other road users, affecting congestion, noise and air quality.
The Northern Powerhouse city regions are at the centre of the freight and
distribution industry in the north, as demonstrated by a high concentration of
warehousing density. Northern England has 14 million square-metres of large
warehouses (One North 2014). Transport for the North describe a ‘golden
Page 98
98 Frontier Economics | March 2016
triangle’ of freight and distribution centres, encompassing a number of the
Northern Powerhouse city regions and spreading further south into the West
Midlands (Figure 23).
This has important implications for transport connectivity in the Northern
Powerhouse, for road and rail, and their linkages to ports.
Figure 23. Warehousing density in the North (2012)
Source: Re-produced from Transport for the North, Valuation Office Agency, MDS Transmodal
Road freight
Road transport accounts for around 88% of inland good movements in the UK
(Eurostat 2012). Some 30% of goods transported by domestic road freight
originate from the North West, North East, and the Yorkshire and Humber
regions (Department for Transport 2014b).
Freight accounts for a significant proportion of traffic along key routes in the
Northern Powerhouse. Freight makes up around 40% of traffic on the M62
route (One North 2014) that stretches from Liverpool in the west to Hull in the
east. The M18 and M1 also play a significant role alongside the M62 in providing
important links to the Humber ports. Warehouse space is concentrated along the
M62 corridor on both sides of the Pennines, in South Yorkshire, where the M18
Page 99
connects to the Doncaster logistics sector, and around the major ports (One
North 2014).
Rail freight
Rail freight accounts for around 12% of national inland good movements in the
UK (Eurostat 2013). Rail freight has increased by around 50% over the last
decade and is forecast to grow further (Network Rail 2015). There are key freight
sites in each of the Northern Powerhouse city regions, including important
intermodal hubs, such as the port of Liverpool.
Port freight
The Northern Powerhouse is home to a number of major international ports that
support the UK freight and logistics sector, including: Workington, Heysham,
Fleetwood, Liverpool, Garston, Manchester, Blyth, Tyne, Sunderland, Seaham,
Tees/Hartlepool, Goole, Hull and Grimsby/Immingham (Department for
Transport 2014c). This port network places additional demand on transport
connections across the north, which can be expected to increase with
approaching a billion pounds of investments in northern ports planned over the
next few years (Transport for the North 2015a).
The UK handles 500 million tonnes of goods per year at ports, the second
highest in Europe after the Netherlands (Eurostat 2013). The ports on both
coasts of the Northern Powerhouse play a major role in this industry. Ports in
Lancashire and Cumbria, Humber and the North East handled 175 million
tonnes of goods in 2014, some 35% of the UK total (Department for Transport
2014d).
Major private sector investment in ports in the north could approach one billion
pounds over the next few years. Developments are planned at locations across
the north, including the Liverpool, Manchester, Hull and Newcastle city regions.
This can be expected to increase freight activity on road and rail connections. For
example, the £300 million Peel Ports investment in the Port of Liverpool will
create a major terminal capable of accommodating 95% of global container
vessels, and is being supported by development of the ‘Liverpool Superport’
freight and logistics hub (Transport for the North 2015b).
4.6 Key observations for the strategic case
In this section, we offer several observations to inform the strategic case. We link
the evidence back to our economic framework of Chapter 2.
In Chapter 2, we outlined evidence from the academic literature on the role of
transport connectivity in economic performance.
Page 100
100 Frontier Economics | March 2016
Unlocking growth. Investment should be targeted at cities where the
economy and transport demand are growing and capacity constraints
are beginning to have an effect. This implies that the priority inter-city
links will be those between the fastest growing cities in the North,
and/or the corridors already facing high levels of congestion.
Driving growth. Investment should be targeted at corridors that are
able to facilitate agglomeration through enhanced accessibility to
economic mass (i.e. workforce). This depends on the size of the cities
being linked, the distance between these cities, the quality of their intra-
city networks, their geographic location in relation to surrounding cities,
as well as their sector compositions and the quality of their labour force.
In the remainder of this section, we discuss the transport performance of the
Northern Powerhouse in this context.
Unlocking growth
The most promising inter-city links for unlocking growth will be those between
the fastest growing cities in the North, and/or the corridors already facing high
levels of congestion. As such, this is a key consideration for our discussion of
transport performance.
With commuting by rail, we have seen that the links with the highest
commuter demand are those between Manchester and Liverpool,
Manchester and Leeds, and Leeds and Sheffield. In each case, the flows in
the morning peak are higher into the larger city. We have seen that trains
travelling into Manchester are the most prone to having passengers in excess
of capacity. Manchester and Leeds have particularly high proportions of
passengers standing, at 20% and 15% respectively in the morning peak hour.
This suggests that improvements to these rail routes could be important for
unlocking economic performance.
With commuting by road, we have seen that the links with the highest
commuter demand are those between Leeds and Sheffield, and Manchester
and Liverpool. The most congested routes are the M62 between Liverpool
and Manchester, and also between Manchester and Leeds; on the M60
around Manchester; on the M1 near Sheffield; on the M6 leading into
Manchester; and, on the A1(M) near Newcastle. Routes between Leeds and
Sheffield are also forecast to experience significant congestion in future. This
suggests that improvements to these road routes could be important for
unlocking economic performance.
Analysis of actual versus predicted levels of commuting between the Leeds
and Manchester city regions has shown that commuting levels are around
Page 101
40% lower than expected, which appears to be mostly explained by high
travel costs and times. This further highlights the potential importance of
transport performance on key commuting routes.
Economic performance could also be enhanced through improving links
heavily used by freight transport, as this would reduce congestion and hence
costs to consumers and businesses alike. Warehouse space is focused around
the M62, the M1 in South Yorkshire, and the major ports. Key freight
routes, particularly those around ports attracting new investments such as
Liverpool, are likely to experience significant increases in traffic.
Importantly, freight shares infrastructure with passenger rail and car traffic
so the interactions of these modes must be considered, because growth in
freight and passenger demand implies rising pressure on the system,
particularly around cities and ports.
As we saw in Chapter 3, the populations of the Northern Powerhouse city
regions have been growing and are forecast to grow further going forward.
This can be expected to further increase demands on the transport network,
which, if left unchecked, would be likely to affect its performance. Other
changes to the wider network may also have an impact, such as potential
increases in travelling between north and south as a result of High Speed 2.
Overall, the evidence on transport performance suggests that improvements
to inter-city connectivity may play an important role in unlocking economic
performance, with signs of current capacity constraints affecting both road
and rail. There is particular overcrowding on trains into Manchester and
Leeds, and road routes around Leeds, Manchester and Sheffield are showing
the highest congestion levels. These may therefore be particularly important
routes for targeting network improvements.
Driving growth
By referring back to our economic framework in Chapter 2 and drawing on the
evidence on the performance of the strategic transport network, we can consider
what this means for the potential for inter-city connections to drive economic
performance.
It is first worth highlighting that the potential for inter-city transport
enhancements to drive economic performance relates strongly to city
characteristics and whether accompanying policy is adequately supportive, not
just the transport system. For example, we saw in Chapter 2 that whilst improved
travel times facilitate access to skilled workers, other factors, such as quality of
place, also come into play to determine whether the opportunities from
accessibility are realised.
Page 102
102 Frontier Economics | March 2016
We saw in Chapter 2 that accessibility improvements are relatively greater when
travel times between larger cities (with high employment density) are improved
and when those cities are relatively closer together (in terms of travel times).
Indeed, we have seen that commuter flows are currently relatively greater
between cities that are effectively closer together (Manchester–Liverpool, Leeds–
Sheffield and Manchester–Leeds). This indicates a greater potential for these
routes to be important in driving economic performance.
Page 103
5 Chapter 5: Estimating the productivity gains
from improving inter-city rail connectivity in
the north
Chapter overview
In this Chapter we explore the potential productivity gains associated with
achieving the inter-city rail travel times aspired to by TfN. We first set out the
objectives and approach to the modelling, before describing the results of the
analysis and their implications. Further detail on the methodology and input
assumptions is provided in the Annex.
We are grateful to Professor Stephen Gibbons (Director of the Spatial Economic
Research Centre, LSE) and Stephen Law (The Bartlett Space Syntax Laboratory,
University College London) for their work in leading the analysis presented in
this Chapter.
5.1 Objective of the modelling analysis
The objective of the modelling in this Chapter is to assess the extent to which
reductions in inter-city rail journey times aspired to in Northern Powerhouse
plans could lead to improvements in access to markets, and in turn, potential
improvements in output and productivity62. We are therefore focusing on the role
of inter-city connectivity as a ‘driver’ of economic performance, rather than
‘unlocking’ it.
We focus only on first order effects of changes in accessibility (for example,
those resulting from learning and knowledge spillovers or improved matching of
workers and firms), rather than second order effects (which could for example
include attracting high-skilled workers to a city). As noted in Chapter 2, the first
order impacts are the externalities generated by improved connections between
places, keeping the spatial distribution of the population and workforce across
cities as it currently stands.
The method draws on the empirical literature on agglomeration economies (see
Combes and Gobillon 2015) and the application of these ideas to transport
appraisal (Department for Transport WebTAG guidance 2014). The intention is
to provide indicative estimates of the extent to which achieving the inter-city
travel time reductions between northern cities that are envisaged by TfN might
create the opportunity to raise productivity.
62 The focus on rail in this analysis is because of the availability of rail travel times in the time available for
this study; similar analysis would be possible for strategic road travel using road journey times.
Page 104
104 Frontier Economics | March 2016
This analysis is seeking to explore where the potential opportunity is
comparatively greater when considering different scenarios. The analysis does not
constitute a full appraisal of the potential benefits of investment in transport –
instead we focus on an externality of transport investment: the productivity
impacts of increasing agglomeration. Our estimates of potential earnings gains
are therefore over and above the transport user benefits that would reflect the
gains from ‘unlocking’ growth, such as the value of time savings that would
typically be considered in a transport investment appraisal. Some approximations
are made, given data availability and the short (five weeks) time period for this
study. Estimates are intended to provide an indication of the order of magnitude
of potential impacts, rather than to be considered as precise and accurate point
estimates.
There are two main measures that we model to explore the potential impacts of
improved inter-city rail connectivity, as follows.
Improvements in access to markets. Improved transport connectivity
within and between cities increases the economic ‘mass’ (i.e. economic
activity measured by the population, number of workers, number of firms or
other indicators) that is accessible within a given travel time from a given
city. We therefore model changes in economic mass (referred to as changes
in accessibility63) resulting from reduced inter-city rail travel times. In
particular, the key unit of measurement (accessibility) throughout the analysis
reflects changes in the number of workers to whom firms and workers in a
city have access when travel times improve.
Improvements in output and productivity. Increasing accessible
economic mass is generally understood to improve productivity and create
more output (either output per worker, or output for a given level of inputs
into the production process).64 Prediction of the likely changes in
productivity arising through this channel requires the following:
prediction of how proposed transport improvements change the level
of access to economic mass (i.e. as set out above);
estimates of productivity levels before the transport improvement
(measured, for example, by wages or firm value-added); and
63 We note that changes to economic mass are referred to in the literature with various names, such as
market potential, effective density, accessibility and market access.
64 The theoretical mechanisms by which access to economic mass (e.g. city regions) affects
productivity are outlined elsewhere in this report.
Page 105
estimates of the elasticity of productivity with respect to economic mass
(i.e. the percentage change in productivity for a given percentage change
in the economic mass which can be accessed).
Section 5.2 sets out the assumptions used in the modelling, and Section 5.3
presents the results using these measures.
We do not model changes to road travel times because of not having access to
the data required to do this. However, we note that there is likely to be some read
across from the high-level results of our rail modelling to the potential gains from
improving road transport connectivity.
Scenarios
Our analysis explores five illustrative scenarios of rail connectivity improvements
between Northern city pairs. The scenarios have been chosen to provide an
illustration of the potential impacts of improving inter-city connectivity in the
North. They include scenarios that improve travel times between city pairs with
different absolute and relative employment sizes, productivity levels, and
distances between them. The choice of scenarios does not imply anything about
policy preferences.
The improvements in travel times that we model are based on aspirational rail
journey times set out by TfN, which we reproduce in Figure 24. This illustrates
travel time improvements between seven key stations. We adapt the aspirational
journey times to reflect differences between the current journey time reported by
TfN (which is the fastest time to make a particular journey), and the current
journey time in our dataset which reflects the average travel time for a particular
journey (see the Annex for details).
Page 106
106 Frontier Economics | March 2016
Figure 24. Aspirational rail journey times between Northern cities
Source: Reproduced from Transport for the North ( 2015a)
The four city-pair scenarios that we model using TfN aspirational journey times
are as follows.
1. Leeds – Manchester. This scenario explores improving the rail links
between the two largest cities in Northern England, which are around 45
miles apart. Manchester is the largest Northern city by population. It has
experienced rapid economic growth, has relatively high skills compared to
Northern England as a whole, and has a diverse economy. Leeds is the
second largest city in Northern England by population. It has more
financial services activity than Manchester, and slightly lower productivity
levels.
2. Manchester – Sheffield. This improves links between the largest city in
the north and Sheffield which is a relatively small but fast growing
economy with a heavy public sector presence and relatively low skills.
The distance between Manchester and Sheffield is around 40 miles.
Page 107
3. Liverpool – Manchester. This scenario improves the travel times
between the largest of the northern cities (Manchester) and a city half its
size in terms of GVA and the number of jobs, Liverpool. The distance is
around 35 miles.
4. Hull – Leeds. The final city-pair scenario explores improving links
between Leeds and Hull. The former is the smallest, most production
focused Northern city, and has the lowest skill levels. The distance is
around 60 miles.
Alongside the city-pair scenarios, we model one further comparator to these,
consisting of the following.
5. All Northern Powerhouse inter-city rail aspirations being achieved.
This assumes that all aspirational rail journey times between the six cities
(Hull, Leeds, Liverpool, Manchester, Newcastle and Sheffield) are
achieved.
5.2 Modelling approach
In this section, we outline key elements of our approach, including their
implications for how the results can be interpreted. In particular, we focus on
estimating the following:
journey times;
accessibility improvements; and
potential productivity gains.
Further detail on the assumptions and methodology is provided in the Annex.
Our analysis is intended to be illustrative – it is based only on rail journey times
and does not map actual or forecast travel demand, rail journey fares, or any of
the planned or committed transport capacity improvements (such as investment
in High Speed 2). This is as a result of data availability and the time available to
carry out the analysis. In addition, it reflects that we are interested in illustrating
how accessible Northern cities are currently, and how changes in Northern cities’
accessibility might affect their economic performance. On that basis, our focus
on travel times only is reasonable for giving indicative estimates.
The unit of analysis corresponding to ‘cities’ in the modelling analysis is Travel to
Work Areas (TTWAs using definitions based on 2011 census data). TTWAs are
defined according to containment rules which ensure that at least 75% of the
population that work in a TTWA also live there and 75% of the people who live
Page 108
108 Frontier Economics | March 2016
in a TTWA also work there.65 TTWAs have therefore been used to overcome
concerns regarding the distinction between access to residential populations and
workplace populations.
5.2.1 Estimating journey times
To model changes in accessibility, we must first estimate journey times. To reflect
the fact that inter-city rail journeys are typically not directly from the origin to the
final destination, we estimate total journey times between two TTWAs (TTWA 1
and TTWA 2) as the sum of:
intra-city travel time in TTWA 1;
inter-city travel time between TTWA 1 and TTWA 2; and
intra-city travel time in TTWA 2.
This is shown in Figure 25, where the entire journey between TTWA 1 and
TTWA 2 is represented by the three arrows, and the estimated journey time is
therefore the time taken to complete these three steps.
Figure 25. Modelling total journey times
Source: Analysis for this study
Intra-city journey times
Intra-city journey times are estimated by constructing a circle of equivalent land
area to the TTWA. The average distance of travel from a random point within
the TTWA circle to the centre of the circle is then estimated. Each intra-city
travel time is then calculated as the time taken to travel the estimated intra-city
distance at 40 km per hour (the mean vehicle speed on morning peak A road
journeys in Great Britain66), plus a 10 minute assumed connection time to allow
65 http://www.ons.gov.uk/ons/guide-method/geography/beginner-s-guide/other/travel-to-work-
areas/index.html
66 Based on 2010-11 data, reported in Department for Transport Transport Statistics Great Britain: 2011.
Page 109
for transfers and waiting. This results in the estimated journey times set out in
Table 12.
Table 12. Estimated intra-city journey times (minutes)
City region
(TTWA)
Assumed
connection/
waiting time
(minutes)
Estimated travel
time from random
point to TTWA
centre (minutes)
Total baseline
intra-city journey
time (minutes)
Hull 10.0 22.7 32.7
Leeds 10.0 14.3 24.3
Liverpool 10.0 13.9 23.9
Manchester 10.0 24.2 34.2
Newcastle 10.0 20.0 30.0
Sheffield 10.0 15.5 25.5
As set out in the Annex, we use this modelled approach as our dataset does not
provide full coverage of all stations within cities, or contain data on onward road
journeys from city centres. Our assumption is that travel is from a random place
within the TTWA circle, rather than the expected location of a resident or
business within the circle (as this is not known). This approach will therefore
exaggerate the average intra-TTWA travel time in a predominantly rural TTWA
relative to a predominantly urban one, though our average intra-city journey time
(28 minutes) is consistent with the average journey time in England (29
minutes)67. For example, the estimated intra-TTWA journey time in Hull is the
highest of the six Northern city region TTWAs because of its geographical scale,
despite Hull being the smallest city in economic and population terms. This is a
limit of the TTWA definitions: they are commuting areas that may be broader
than the geographic area (city) within which economic activity is concentrated68.
67 Department of Transport, 2015, National Travel Survey: England 2014, available at:
https://www.gov.uk/government/uploads/system/uploads/attachment_data/file/457752/nts2014
-01.pdf
68 National Travel Survey (NTS) data on average commuting times in England provides an external cross-
check of our estimates of average intra-TTWA journey times. Given the definition of TTWAs, NTS
commuting times are likely to be mostly for intra-TTWA travel. In 2014, the average commuting
time in England was estimated at 29 minutes which is in line with our estimates of intra-TTWA
journey times shown above. As a further sensitivity test, we estimated accessibility gains if intra-
TTWA travel times were reduced by 10 minutes in the origin and destination city of each journey
Page 110
110 Frontier Economics | March 2016
Inter-city journey times
We use the Rail Usage Drivers Dataset (RUDD) supplied by DfT to estimate
inter-city journey times. RUDD data contains station-to-station journey times
and are derived from timetable information. The data represent around 80% of
rail journeys in Great Britain. We match RUDD data to TTWAs using a RUDD
station to TTWA lookup dataset, to estimate minimum station to station origin-
TTWA to destination-TTWA journey times. The resulting baseline inter-city rail
travel times are shown in Table 13.
Table 13. Estimated baseline inter-city journey times (minutes)
Origin Destination Baseline rail journey time (minutes)
Hull Leeds 62.9
Hull Liverpool 168.4
Hull Manchester 121.4
Hull Newcastle 124.8
Hull Sheffield 80.8
Leeds Liverpool 114.7
Leeds Manchester 68.0
Leeds Newcastle 92.4
Leeds Sheffield 52.0
Liverpool Manchester 62.5
Liverpool Newcastle 196.6
Liverpool Sheffield 111.3
Manchester Newcastle 152.6
Manchester Sheffield 61.5
Newcastle Sheffield 113.8
(i.e. a reduction in the total journey time of 20 minutes). This is a substantial reduction, given that
the average intra-TTWA journey time that we estimate above is 28 minutes. This adjustment did not
substantially affect the results that we present below: the overall pattern was similar, with
accessibility changes increasing slightly (by around 1%) in TTWAs starting from a lower base in
terms of their access to workers.
Page 111
Source: Analysis based on RUDD data
Note: Our estimates of baseline journey times between Liverpool and Manchester (as well as between
Manchester and Manchester Airport, not reported here) are significantly higher than the estimates set out
in Transport for the North (2015a). This is likely to be because the times reported in Transport for the North
(2015a) are estimates of fastest current rail journey times, rather than average journey times between the
stations. Our estimates use RUDD data, and are weighted for service frequency (as set out in the Annex).
So, for consistency, using RUDD data we scale our estimates down by the same amount as the TfN
aspiration figures to estimate journey times after connectivity improvements.
To construct improved TTWA–TTWA journey times, the TfN aspirational inter-
city rail journey times are applied to the links between the main stations in the
corresponding Northern Powerhouse TTWAs (Hull, Leeds, Liverpool,
Newcastle, Manchester, Sheffield,).69 The entire station–station origin destination
minimum travel time matrix is then recomputed to allow for the fact that these
new links may reduce the travel times between stations throughout the network
(for example, some journey travel times may rely on the improved link for at least
part of the journey).
In a few cases, a TTWA contains no station in the RUDD data, and so is missing
from the analysis (it is infeasible to compute a travel time change when there is
no station present). These TTWAs are shown on the maps in Section 5.3 as
uncoloured. These areas are remote, rural and with small populations, so will not
affect the analysis substantively.
Total journey times
Total journey times are estimated by summing inter-city journey times with the
two corresponding intra-city journey times. This results in the baseline and
improved journey times shown in Table 14.
69 So that our baseline is consistent with aspirational journey times, we scale the aspirational journey
times to account for differences between RUDD baseline journey time estimates and TfN reported
baseline journey times.
Page 112
112 Frontier Economics | March 2016
Table 14. Estimated baseline journey times (minutes)
Origin Destination
Baseline rail
journey time
(minutes)
Improved rail
journey time
(minutes)
Hull Leeds 120.0 112.3
Hull Liverpool 225.1 181.3
Hull Manchester 188.3 159.9
Hull Newcastle 187.5 175.6
Hull Sheffield 139.0 126.0
Leeds Liverpool 162.9 126.7
Leeds Manchester 126.5 105.5
Leeds Newcastle 146.8 121.9
Leeds Sheffield 101.8 92.4
Liverpool Manchester 120.6 105.4
Liverpool Newcastle 250.5 191.5
Liverpool Sheffield 160.7 126.2
Manchester Newcastle 216.8 170.3
Manchester Sheffield 121.2 103.8
Newcastle Sheffield 169.3 156.4
Source: Analysis based on RUDD data
Estimating accessibility changes
Changes in accessibility are the changes to the economic mass (measured as
employment) that can be accessed when journey times are improved between
cities. Put simply, the accessibility of a TTWA (or city region) is measured by the
number of people in other TTWAs, each weighted according to the length of the
journey time to those TTWAs. A reduction in the journey time to a particular
TTWA will increase the weight that is given to it, thereby increasing the number
of workers in that TTWA who can access the city region of interest, and in turn
Page 113
the level of accessibility of that city region. We provide a technical description of
this approach below.
We define the accessibility of economic mass by rail from an origin TTWA i
using a standard form of effective density/accessibility index:
(1) j
i
j ij
EA
time
Here, Ej is a variable capturing economic activity at destination TTWA j, and
time_ij is the minimum travel time by rail between TTWA i and TTWA j. These
accessibility indices are calculated for each TTWA from measures of employment
in Great Britain derived from the 2011 UK census and from rail travel times
estimated as above.
Accessibility for the baseline period is estimated using present day travel times,
which are set out in the previous section. Post-policy (i.e. with the improvement
in inter-city travel times) accessibility is estimated using the inter-TTWA travel
time scenarios described above, which reflect the TfN inter-city rail journey time
aspirations.
The difference between the natural log of the accessibility index post-policy and
in the baseline then gives the approximate proportionate changes in accessibility.
We hold employment in the accessibility indices constant at 2011 levels.
Our analysis measures the increase in accessibility to workers from each city as a
result of improved rail connectivity. This is not a zero sum game; this is because
the workers to whom one city now gains access could also be the same workers
to whom another city gains access as a result of improved rail connectivity.
Those workers cannot be employed in both cities – instead, the cities gain from
having the option and ability to attract employees from a wider labour pool.
Increased accessibility could result in productivity benefits, in a number of
different ways, for example:
it could simply be that workers in Leeds engage in more interaction,
business travel and face to face communication during the course of
their work with people in Manchester as a result of improved rail
connectivity, generating productivity gains due to learning effects; or
workers in Leeds could swap to jobs in Manchester for which they are
better matched and the workers in Manchester swap to jobs in Leeds to
which they are better matched, generating productivity gains for both
cities due to better matching.
Estimating potential productivity gains
Having estimated accessibility changes, we can then apply an agglomeration
elasticity parameter to that change in accessibility to estimate potential first order
Page 114
114 Frontier Economics | March 2016
productivity gains. Put another way, we saw from Chapter 2 that the evidence
finds that a 10% change in accessibility could result in anywhere between a 0.1%
and 0.7% first-order change in productivity, depending on the context of the
study. By applying this percentage change to the estimated increase in
accessibility found above, we can estimate the potential productivity gains. The
agglomeration elasticity represents the percentage change in mean earnings from
a percentage change in accessibility. We consider only first-order effects as the
evidence on second-order effects is very limited, as we discuss below.
The choice of elasticity is therefore critical to estimating productivity gains. There
are a number of elasticities that have been generated in the literature. We use an
elasticity estimate of 0.03, taken from (D’Costa et al 2009), because that study
provides an estimate of the effects of rail-specific accessibility changes on wages
using micro data on British workers, and holding the road network constant. It
also uses an accessibility index of the same form as equation (1), and is the most
directly relevant study. The estimate of the impact on earnings means that the
accessibility changes can be translated into potential earnings increases in each
TTWA and in Great Britain as a whole.
Estimates of the aggregate impact on earnings in each TTWA and in the country
overall are calculated from TTWA workplace-based mean wages and TTWA
worker numbers. Mean wages (gross annual earnings, all workers) are taken from
Annual Survey of Hours and Earnings data70.
We take the existing skills base and its distribution as given, and any second-
order up-skilling effects incentivised by increased accessibility are not captured in
our analysis. In practice, second-order effects incentivised by transport
investment may require additional investment (e.g. in further infrastructure, or in
education and training), so would not be likely to be directly attributable to the
transport investment itself.
The evidence we have reviewed for this study (in Chapter 2) suggests that a
higher elasticity of productivity has been estimated by some studies in a bid to
reflect total – i.e. first order and second order – effects. D’Costa et al. (2009)
discussed above estimates that a reduction of generalised travel times for rail
travel by 10%, holding the cost of road transport constant, is associated with a
2.6% increase in wages within that area (i.e. elasticity of 0.26).
The 0.26 figure reflects the impact on the place (rather than people) of
accessibility changes – this is because it captures all aspects about the city that
make it as productive as it is (i.e. previous investments in other infrastructure,
skills, movement of businesses, density etc.). If we used it in our analysis, we
70 Given the size of TTWAs, we would expect wages to vary within them, with the highest wages in the city
centres, for example. However, we use average TTWA earnings here to be consistent with our unit
of analysis which is TTWAs and not just the city centres.
Page 115
would be attributing all of that gain in productivity to the particular transport
intervention that led to the change in accessibility, and we would need to believe
that productivity differences between cities are solely the result of differences in
transport connectivity. Further, even if we accept this (clearly unreasonable)
premise, we still cannot conclude from the above estimates that increasing
accessibility to a city by 10% would increase wages in that city by 2.6%, because
there could be displacement effects. We note that while the 0.26 estimate is not
appropriate to use in our analysis, this does not mean that we expect second-
order effects not to exist – we just do not have the evidence to estimate their
size. We therefore believe 0.03 reflects a reasonable elasticity to use for this
analysis, but note that it is likely to be conservative as it does not capture second-
order effects.
5.3 Results
In this section, we set out the results of our analysis, for each of the city-pair and
comparator scenarios in turn:
Leeds – Manchester;
Manchester – Sheffield;
Liverpool – Manchester;
Hull – Leeds; and
All Northern Powerhouse inter-city rail aspirations being achieved.
We present maps showing the distribution and size of the potential changes in
accessibility and productivity for each scenario. Table 15 summarises the results
across all the scenarios, which we then discuss in detail.
Page 117
Table 15. Scenario analysis results
City
(TTWA)
Baseline Leeds-Manchester Manchester-
Sheffield
Liverpool-
Manchester
Leeds-Hull Achieving all NPH
rail aims
Mean
pay (£)
No. of
employees
Change
in
access
(%)
Potential
earnings
gain
Change
in
access
(%)
Potential
earnings
gain
Change in
access
(%)
Potential
earnings gain
Change
in
access
(%)
Potential
earnings
gain
Change in
access
(%)
Potential
earnings gain
Hull £22,456
231,000 1.5% £2,300,000 0.1% £200,000 0.2% £300,000 1.0% £1,600,000 4.6% £7,200,000
Leeds £25,944
420,000 2.8% £9,200,000 0.0% £0 0.2% £700,000 0.1% £300,000 5.2% £17,200,000
Liverpool £24,063
438,000 0.9% £2,900,000 0.6% £2,000,000 2.0% £6,400,000 0.0% £100,000 4.2% £13,400,000
Manchester £25,148
1,239,000 1.3% £12,400,000 1.2% £10,800,000 0.4% £3,500,000 0.0% £300,000 3.2% £30,100,000
Newcastle £24,394
474,000 1.0% £3,400,000 0.0% £0 0.1% £400,000 0.0% £0 4.9% £17,100,000
Sheffield £23,244
372,000 0.0% £0 2.0% £5,100,000 0.2% £600,000 0.0% £0 3.2% £8,300,000
Estimated annual earnings increase across the six
city TTWAs £30,000,000 £18,000,000 £12,000,000 £2,000,000 £93,000,000
Estimated annual earnings increase across GB £62,000,000 £41,000,000 £18,000,000 £3,000,000 £189,000,000
Notes: Table reports initial mean pay (ASHE), worker count (TTWA definition table), plus % change in access index (difference in logs) and aggregate
implied increase in earnings per year using assumed elasticity of earnings w.r.t access = 0.03.
Page 118
118 Frontier Economics | March 2016
Leeds–Manchester scenario
The accessibility impacts of improving rail connectivity between the largest
Northern cities (Leeds and Manchester) are shown in Figure 26. Of the city-pair
scenarios we consider, this scenario results in the greatest gains in accessibility
(i.e. the number of workers to whom cities have access). The access to workers
of Leeds could increase by around 2.8%, Hull by 1.5% and Manchester by 1.3%.
The increase in Manchester is relatively lower, as it starts from a higher base in
terms of transport connectivity and accessibility. Five of the six Northern city
regions gain in terms of accessibility under this scenario, with the exception being
Sheffield (implying that inter-city rail travel to Sheffield is not improved by
reducing the travel time between Leeds and Manchester).
The accessibility impacts for this scenario are high relative to the other inter-city
scenarios due to a number of factors. These include their existing connectivity
(with these cities having relatively more connections to a range of different cities
already), and the greater reduction in travel times which TfN aspire to in this
corridor.
Page 119
Figure 26. Percentage change in accessibility to workers, Leeds – Manchester
scenario
Source: Analysis for this study
Note: In this and following maps, areas shaded in white are those without a rail station.
The improved rail connectivity improves access to both skilled and unskilled
labour (defined as whether employees have degrees or not). However, the
analysis finds that the increase in the number of unskilled workers that the cities
can access is relatively higher than the increase in the number of skilled workers.
As a result, the share of skilled workers as a proportion of all workers now
accessible decreases by a small amount following improved rail connectivity
between Leeds and Manchester. This finding applies across the scenarios that we
have analysed. This reflects the distribution of skills across the North.
Using the agglomeration elasticity estimate of 0.03, we estimate a potential
increase in total aggregate earnings by some £62 million per year across Great
Page 120
120 Frontier Economics | March 2016
Britain (or £30 million in the six Northern city TTWAs) associated with reducing
the Leeds-Manchester rail travel time.71 The difference between the estimated
national (Great Britain) potential earnings gain and potential earnings gains in the
six Northern city-regions includes potential gains to the wider northern region.
The estimated gain in earnings for each of the six city regions is equivalent to
small per worker annual earnings gains:72 at £22 per annum in Leeds, and £10 per
annum in Hull and Manchester. However, the aggregate monetary gain is
considerably greater because the improved connectivity affects so many people,
and would accrue over the lifetime of the improved transport infrastructure.
The distribution of productivity impacts is shown in Figure 27. This shows that
both Leeds and Manchester show the highest potential increase in earnings as a
result of the improvement – by £9 million in Leeds and £12 million in
Manchester. This reflects the total size of the cities (Manchester has larger
baseline employment than Leeds), their respective baseline productivity levels
(again, productivity levels are higher in Manchester than Leeds in the baseline),
and the fact that the Leeds–Manchester connectivity improvement would
primarily benefit journeys between these two city regions (rather than other
journeys between TTWAs that use this link).
71 Estimates are rounded to the nearest £1 million.
72 These are estimated using initial employee numbers in the corresponding city, excluding accessibility
increases, to avoid double counting.
Page 121
Figure 27. Implied aggregate change in earnings at TTWA level: Leeds–
Manchester cities only linked
Source: Analysis for this study
Note: Estimated earnings brackets are continuous, but have been rounded in the key above.
Manchester–Sheffield scenario
An improved Manchester – Sheffield link could increase accessibility by 2.0% in
Sheffield, 1.2% in Manchester, 0.6% in Liverpool, but minimally in other city
regions. This is shown in Figure 28.
Page 122
122 Frontier Economics | March 2016
Figure 28. Percentage change in accessibility to workers: Manchester–Sheffield
scenario
Source: Analysis for this study
Again using an agglomeration elasticity of 0.03, this implies a potential increase in
earnings of around £18 million a year within the six Northern city TTWAs or
£41 million per year across Great Britain, including the wider northern area.
The smaller estimated increase in earnings relative to the Leeds–Manchester
scenario reflects that Sheffield is a relatively smaller city, implying fewer
connections with other cities, as well as the scenario modelling a slightly smaller
reduction in travel times compared to the aspiration for the Leeds–Manchester
rail link. Within the six Northern cities, potential aggregate earnings gains are
material in three of the cities – compared to potential earnings gains being
material in five of the six cities in the Leeds–Manchester scenario considered
above. The absolute gains are largest in Manchester, at £11 million per year,
compared to £5 million per year in Sheffield. This represents a greater relative
change in Sheffield, given lower initial employment. As before, the potential
gains per employee in annual earnings are small: at £14 per annum in Sheffield,
Page 123
and £9 per annum in Manchester. This is an average figure across all employees –
some individuals may gain more, and some less, for example reflecting how far
individual employees are able to better match their skills to their job following
the change in connectivity.
The distribution of earnings gains is shown in Figure 29.
Figure 29. Implied aggregate change in earnings at TTWA level: Sheffield–
Manchester cities only linked
Source: Analysis for this study
Note: Estimated earnings brackets are continuous, but have been rounded in the key above.
Liverpool–Manchester scenario
An improved Liverpool–Manchester rail travel time could increase accessibility
by 2.0% in Liverpool, 0.4% in Manchester, and by smaller amounts elsewhere.
This is shown in Figure 30.
Page 124
124 Frontier Economics | March 2016
Figure 30. Percentage change in accessibility to workers: Manchester–
Liverpool
Source: Analysis for this study
In total, this accessibility increase implies a potential increase in earnings of
around £12 million a year within the six Northern city TTWAs or £18 million
per year across Great Britain (this includes gains across Northern England).
Within the six Northern cities, potential aggregate earnings gains are largest in
Liverpool, at £6 million, compared to £4 million in Manchester. The relative
earnings change is estimated to be larger in Liverpool because of its increased
accessibility to productive workers in Manchester. As before, the potential gains
per employee in annual earnings are small: highest at £15 per annum in
Liverpool, and £3 per annum in Manchester. As above, these are average impacts
on earnings, in practice some may gain more and some may gain less. The
distribution of earnings gains is shown in Figure 31.
Page 125
Figure 31. Implied aggregate change in earnings at TTWA level: Liverpool–
Manchester cities only linked
Source: Analysis for this study
Note: Estimated earnings brackets are continuous, but have been rounded in the key above.
Hull–Leeds scenario
The accessibility gains from improving Hull–Leeds rail journey times are
relatively modest, in part reflecting the smaller size of these cities and the longer
baseline travel time between them. The results also reflect the more limited
choice of direct rail routes from Hull compared to the direct routes available
travelling from larger cities such as Manchester. Hull could show accessibility
gains of 1% but with minimal changes elsewhere – including a gain of only 0.1%
in Leeds. This is shown in Figure 32.
Page 126
126 Frontier Economics | March 2016
Figure 32. Percentage change in accessibility to workplace workers: Hull–
Leeds scenario
Source: Analysis for this study
Reflecting the small accessibility gains as a result of improving rail connectivity,
the estimated potential earnings gains as a result of the improvement is just £3
million across Great Britain, of which around £2 million per year accrues to
Northern cities (almost entirely to Hull – an average gain of £7 per employee in
Hull). This is shown in Figure 33.
Page 127
Figure 33. Implied aggregate change in earnings at TTWA level: Leeds–Hull
cities only linked
Source: Analysis for this study
Note: Estimated earnings brackets are continuous, but have been rounded in the key above.
Achieving all Northern Powerhouse rail aspirations
For comparison, we modelled a scenario in which all inter-city rail journey time
reductions aspired to by TfN are achieved. The accessibility improvements
associated with this scenario are shown in Figure 34. It shows accessibility gains
averaging 4.2% for the six Northern cities, along with smaller accessibility gains
across Northern England. The percentage accessibility gains are highest in Leeds
and Newcastle, given that they start from a relatively lower base.
Page 128
128 Frontier Economics | March 2016
Figure 34. Percentage change in accessibility to workplace workers: all
Northern Powerhouse inter-city aspirations
Source: Analysis for this study
The potential earnings increase estimated using the 0.03 agglomeration elasticity
is around £93 million per year for the six Northern cities we focus on, and
around £189 million per year across Great Britain, including the wider northern
area. The largest estimated earnings gains are likely to be for Manchester at £30
million per year, as shown in Figure 35. This compares to potential earnings gains
of £17 million each in Newcastle and Leeds, £13 million in Liverpool, £8 million
in Sheffield and £7 million in Hull. To put this into context, the estimated
aggregate gains to Northern cities represent less than one percentage point of
estimated 2014 GVA in the six Northern Powerhouse city regions. Per employee
potential annual earnings gains are highest in Leeds (£41) and Newcastle (£36).
Unsurprisingly, the results of this scenario show that the potential benefits are
greater when a greater number of rail travel time improvements are made
between cities, meaning that all Northern cities become more accessible to
workers in a variety of different locations. In practice, there may be winners and
losers, given that an employee accessible to a number of different city regions will
not work in all of these locations.
Page 129
Figure 35. Implied aggregate change in earnings at TTWA level: all Northern
Powerhouse cities linked
Source: Analysis for this study
Note: Estimated earnings brackets are continuous, but have been rounded in the key above.
5.4 Implications
Comparing the scenarios, we find that improving the rail travel time between the
largest, most productive, cities (Leeds and Manchester) leads to the greatest gains
in accessibility (i.e. the number of workers to whom cities have access) –
supporting the findings in Chapter 3. Accessibility of Leeds could increase by
around 2.8%, Hull by 1.5% and Manchester by 1.3% (increase in the latter is
relatively lower as it starts from a higher base of workers). The estimated increase
in opportunity to boost economic performance (measured by earnings) for the
six Northern city regions from this improvement could be of the order of £30
million per year. Improving other inter-city connections could also result in
increased earnings, though of a lower magnitude.
Page 130
130 Frontier Economics | March 2016
More detailed analysis of the scenarios above highlights some key observations:
Improvements in journey times, at least in the first instance, can only
increase accessibility to the workers that are within reach.73 The level of skills
is on average lower in the Northern cities than in the Southern cities of
England, so accessibility to workers increases accessibility to low-skilled
workers disproportionately.
A notable proportion of the door-to-door journey time for inter-city trips is
at either end of the journey i.e. the intra-city connections. Therefore, the
potential gains from even very substantial improvements in inter-city travel
times could be diluted if intra-city travel times are excessive.
Small changes in productivity can have a significant impact on the total
earnings of the larger city regions, simply because of the numbers of workers
in larger cities.
The level of responsiveness of earnings to accessibility assumed here
(elasticity 0.03) reflects the gains to individuals from being effectively closer
to other workers due to improvements in rail travel times, holding the road
network constant. It is drawn from the best available evidence. The scale of
change in earnings could be higher still over time because workers could
identify the opportunities for higher earnings and seek to up-skill,74 or they
could move across cities to find jobs with higher earnings.75 Plus, more
skilled workers and investment could be attracted to better connected and
higher productivity areas from far away (or overseas). There is reason to be
cautious in trying to estimate the potential scale of overall longer-term
effects given the lack of evidence in this area, particularly in relation to
where workers may move to and from. Due to the limited evidence currently
available, our modelling has not estimated second-order effects, but these
effects could potentially add significantly to the estimated economic benefits
(subject to displacement) of improved connectivity.
73 Second-order effects may include workers moving into the area accessible to the city region.
74 However, we note that in a full cost benefit analysis the costs of acquiring these skills would need to
be deducted from the predicted benefits. In addition, evidence suggests that the gains from a switch
to more productive jobs are the tax gains to the Exchequer, as the benefits from the net wage gains
are absorbed by the transport costs in reaching these more productive jobs (see the Webtag
guidance and Laird et al (2014)).
75 However, this implies potential losses to the places that individuals move away from.
Page 131
While we do not model road travel times, a similar approach could be used
to estimate potential accessibility and productivity gains from improved road
connectivity. A number of the findings above (e.g. in relation to skills or
intra-city journey times) would also apply to analysis of road travel.
Page 132
132 Frontier Economics | March 2016
6 Chapter 6: Summary and case for change
Overview of this Chapter
This Chapter provides a summary of the key findings from our analysis and
draws out the policy implications. This is intended to inform a comparative
assessment of the scale of the potential productivity gains associated with
enhanced inter-city connections, and the conditions under which those gains are
likely to be relatively greater.
6.1 The question addressed by this study
This report for the UK’s National Infrastructure Commission has been exploring
the following question:
‘Is there a role for improved inter-city transport connections to contribute
to the economic performance of the Northern Powerhouse?
If so:
(iii) what is the potential scale of impacts?
(iv) what are the conditions under which these impacts are likely to
be comparatively greater?’
To address the question robustly, we have systematically drawn together the best
available evidence, both theoretical and empirical. We have complemented this
with new indicative analysis, though we remain honest and open about the
current gaps in knowledge and where uncertainties remain.
This field of research is relatively new and will continue to evolve over coming
years. This report reflects the forefront of thinking on these issues and seeks to
advance the current knowledge and evidence base in a clear and transparent way.
We are grateful for the input and oversight of Professor Stephen Gibbons –
Director of the Spatial Economics Research Centre at the London School of
Economics.
This chapter brings together what we have learned, and what we conclude based
on our analysis.
Overview of our approach
To address our overarching question, we have investigated a number of sub-
questions, as shown in Figure 36.
Page 133
Figure 36. Understanding the potential role of inter-city transport connections
in enhancing economic performance of the Northern Powerhouse.
6.2 What aspirations does TfN have for economic
performance in the Northern city regions?
Historically, there has been a productivity gap between the North and South of
England – particularly when compared to productivity performance in London
and the South East. GVA growth in the Northern Powerhouse region76 has been
below the UK average over the past 10 years, and its productivity (when
measured in terms of GVA per worker) is 29% below productivity in London
(Centre for Cities 2015).
The Northern Powerhouse policy agenda aims to address the productivity gap
between the North and the South by bringing economic productivity in the
North in line with the UK average (Osborne 2015). Alongside detailed plans
being developed by the Northern city regions, improving transport connections
is seen as one of the important components to achieving this ambition.
The analysis in this report focuses on the potential contribution of improved
inter-city connections in particular. However, as we describe below,
76 For the purposes of our analysis, we assume that the Northern Powerhouse includes the six
Northern city regions of Hull, Leeds, Liverpool, Manchester, Newcastle and Sheffield. These are the
city regions whose work is being taken forward by Transport for the North.
Is there a role for improved inter-city transport connections to contribute to the economic
performance of the Northern Powerhouse? If so, what is the potential scale of impacts and
what are the conditions under which these impacts are likely to be comparatively greater?
What
aspirations
does TfN
have for
economic
performance
in the
northern city
regions?
What do we
know about
the drivers of
economic
performance,
and the role
of inter-city
transport
connections?
Where are
the
opportunities
for inter-city
transport
improvements
to contribute
to economic
performance
likely to be
comparatively
greater?
What
potential
scale of
opportunity
could be
created
through
improved
inter-city
connectivity in
the north?
What does
this suggest
for policy
makers?
1 2 3 4 5
Chapter 1 Chapter 2Chapters 3
and 4Chapter 5 Chapter 6
Page 134
134 Frontier Economics | March 2016
opportunities to boost economic performance can only be fully realised if
other drivers of economic performance are adequate and complementary.
6.3 What do we know about the drivers of economic
performance?
The evidence is clear that there are many factors that drive economic
performance. Each driver is likely to be necessary, though not sufficient by itself,
for realising opportunities. The drivers are the following.
Labour market and skills. Cities can grow by both improving the skill
base of current workers and by attracting skilled workers from
elsewhere.
Infrastructure. Cities rely on infrastructure of various forms, both
physical and digital. The quality, capacity, reliability and efficiency of
such infrastructure are important for economic performance.
Business environment. All activities take place within existing policy
regimes. National and local actions on tax, regulations and the stability
of the policy environment are all important for economic performance
as they can have an impact on workers and business investment
decisions.
Innovation. Cities can play a role in innovation by supporting
knowledge generation and business innovation measures.
Quality of place. The quality and variety of amenities available in cities
affect the quality of life, and in turn influence the location decisions of
workers and firms.
Transport resides in the infrastructure driver. It facilitates other activities such as
providing access to work, movement of freight or visiting friends and family. In
doing so, it is a means to an end rather than an end in itself. Transport
interventions can therefore create opportunities to improve economic
performance in two particular ways.
Unlocking growth. Transport infrastructure can be enhanced so that
pressures on the system (when demand exceeds capacity) which can result in
congestion, overcrowding and unreliability, are minimised and do not
constrain the opportunities generated by other drivers of economic
performance. Such enhancements can also facilitate new journeys to take
place that were not feasible or viable previously. In both cases, transport
improvements can be seen to unlock the economic potential of other
drivers.
Page 135
Driving growth. Transport can stimulate the economy; that is, it can
directly drive economic performance rather than just unlocking the growth
potential of other drivers. By bringing people, firms and places effectively
closer together, transport improvements can generate ‘agglomeration
benefits’, which directly increase productivity.
We have identified the following channels through which opportunities for
agglomeration benefits could be created.
First-order effects. Agglomeration increases the productivity of the
existing stock of workers and firms, by enabling scale and specialisation,
better matching among workers and firms, and learning and knowledge
spillovers. First-order effects increase productivity holding the
composition of the economy constant (e.g. levels of employment and
location of businesses). Therefore, they do not depend on other drivers
of economic performance.77
Second-order effects. In response to the reduced travel times and
associated rise in wages and returns to investment (the first order
effects), further high-skilled workers and investment can be attracted to
an area over time. This changes the economic composition of the area
and adds to economic performance.
The nature and scale of second-order effects crucially depends on
other drivers. For example, quality housing and amenities are needed
to attract high-skilled workers to the area, and a favourable business
environment is needed to increase investment. This means that it may
be necessary to invest in other drivers of economic performance to fully
realise the opportunities created by investments in transport.
Although first-order effects will always have a positive impact as they reflect the
gains to the current stock of workers from being able to access a greater number
of markets and opportunities, second-order effects involve movement of
economic activity and occur over time. Therefore, there is the potential for some
areas to gain (if productive workers move in) at the expense of others (if
productive workers move away), yet there is little evidence to suggest the scale or
direction of such changes following an improvement in an inter-city connection.
The ability of inter-city connections specifically, as opposed to improved
transport connections more widely, to drive economic performance is relatively
less well understood in published evidence. Our approach in this report is
therefore cautious and honest about the limitations in the knowledge base, and
77 However, to the extent that improvements in inter-city transport connectivity increase traffic flows,
it may be necessary to invest in intra-city transport networks to ensure that congestion does not
occur (because congestion could erode any improvement in door-to-door journey times).
Page 136
136 Frontier Economics | March 2016
we only draw conclusions that are well-founded while highlighting where further
evidence is needed.
We begin by setting out our understanding of the conditions under which the
economic gains associated with improvements in inter-city transport links are
likely to be comparatively greater, based on the evidence. We then explore this
understanding by using new analysis of the change in the number of workers that
firms in a particular city have access to when inter-city transport links in the
Northern Powerhouse are improved. This is then used to estimate the associated
increase in productivity because firms and workers are effectively closer together.
This allows us to draw conclusions about where the scale of opportunity is likely
to be comparatively greater, and where further work would add value to the
evidence-base.
6.4 Where are the opportunities for inter-city
transport improvements to contribute to
economic performance likely to be comparatively
greater?
The identification of transport corridors that are able to create comparatively
greater opportunities for boosting economic performance will depend on how
we see the role of transport in promoting economic performance, for example,
the following.
Unlocking growth. The role of transport interventions in this context is to
release constraints that might occur because of the demand for travel
associated with other drivers of economic performance. Attention should
therefore be targeted on inter-city connections that are demonstrating high
levels of demand related to economic activity (commuting, business travel
and freight travel) and that are showing signs that pressures – through
congestion or overcrowding – are having a negative effect. In addition,
attention is needed on connections between the fastest growing cities in the
North, where such pressures are likely to arise in the future. Our analysis of
transport performance (Chapter 4) suggests the following.
The links with the highest commuter demand are those between
Manchester and Liverpool (road and rail), Manchester and Leeds (for
rail only), and Leeds and Sheffield (road and rail). In each case, flows in
the morning peak are relatively greater from the smaller to the larger
city, reflecting travel to dense employment centres.
The greatest pressures on the strategic road network are on the M62
between Liverpool and Manchester, and also between Manchester and
Leeds; on the M60 around Manchester; on the M1 near Sheffield; on
Page 137
the M6 leading into Manchester; and, on the A1(M) near Newcastle. On
the rail network, the greatest (morning peak) pressures are on services
into Manchester and Leeds.
Key freight routes, particularly those around ports attracting new
investments, such as Liverpool and Hull, are likely to experience
significant increases in traffic. The M62 is a critical freight link (freight is
around 40% of traffic).
Driving growth. The nature and scale of this opportunity depends on the
size and economic composition of the cities that will be better connected;
the distance between these cities (in terms of journey travel times); the
quality of their intra-city networks; their geographic location in relation to
surrounding cities; as well as the extent to which other drivers – such as
skills of their labour force – are adequate and complementary.
The corridors that are identified with a potential to unlock growth may not
in all cases match the corridors where transport is currently constraining
economic performance. It is important to consider both perspectives.
The greatest comparative opportunity for driving economic performance
through inter-city transport improvements is on connections between cities
that have the following characteristics:
Large and fast growing cities. The potential gain in overall earnings is
likely to be greater by improving connections between large and fast-
growing cities simply because of the volume of workers who would
benefit from that boost in productivity. Cities with the largest numbers
of jobs are Manchester, Leeds and Newcastle. These cities have also
experienced more rapid growth than the other cities, with annual
growth in GVA over the last decade of 1.43%, 1.49% and 1.59%,
respectively.
High and intermediate skills. There is considerable evidence that
productivity gains associated with improved accessibility are greater for
workers with high, or intermediate, skills levels. The proportion of
skilled workers appears fairly similar in each of the northern city
regions, both in terms of NVQ level 4+ (ranging from 27% to 32% of
the working age population) and level 3+ (ranging from 49% to 53%).
Productivity levels in terms of GVA/worker do, however, vary more
noticeably across the city regions. For example, Liverpool, Manchester
and Leeds (which have the highest levels of productivity) have
GVA/worker which is around 11–12% higher than Sheffield (which has
the lowest level of productivity).
Page 138
138 Frontier Economics | March 2016
Relatively high shares of sectors for which face-to-face or
business-to-business contacts are important. Producer services
(which include finance, insurance, real estate and consulting services)78
and transport services are therefore most amenable to gains in
accessibility and associated increases in earnings. The Manchester and
Leeds city regions have higher proportions of their economies in
producer services than the Northern Powerhouse average.
Cities already relatively closer together (in terms of travel times).
The benefits of increased accessibility decline rapidly with the travel
time from the source, particularly for service sectors. We note that
Liverpool–Manchester (fastest time of 32 minutes by rail) and Leeds–
Sheffield (fastest time of 40 minutes by rail) are closer together than the
connections between the remainder of the six city regions: for example,
Manchester–Sheffield, 48 minutes; Hull–Leeds, 55 minutes; Hull–
Sheffield, 86 minutes; Newcastle–Leeds, 87 minutes; and Leeds–
Manchester, 49 minutes.
Adequate intra-city connections. Inter-city links are only part of a
journey. The overall change in accessibility depends on door-to-door
journey times. If intra-city travel times are prohibitively high, reductions
in inter-city travel time may do little to improve accessibility. Further
work is needed to address this in the context of the interactions with
improved inter-city connections.
6.5 What scale of opportunity could be created
through improved inter-city connectivity in the
North?
We have carried out indicative analysis of the changes in access to workers
‘accessibility’ associated with improving rail travel times between the TTWAs
around major Northern cities79. We consider improved rail times between four
city pairs plus improvements on all links between the largest city regions in the
North, in line with the TfN rail travel time aspirations.
This analysis is intended to be illustrative – it considers the increase in workers
that cities would have access to, if present-day rail travel times were to reduce to
the TfN’s aspirational travel times. These changes in ‘accessibility’ are then
78 SIC codes 65 to 745.
79 The equivalent analysis using road travel times was not possible in the timeframe of this study.
Page 139
converted into an estimated impact on earnings by using evidence-based
estimates of how, at a national average level, worker productivity (earnings per
worker) changes when accessibility changes80. It does not account for actual or
forecast levels of travel demand along corridors, nor does it include any of the
planned or committed transport capacity improvements, which could affect
journey times.
Some important points about this analysis are:
This indicative analysis focuses on the scale of potential gains in productivity
per worker when firms and workers are effectively brought closer together
(i.e. when accessibility increases because of improved journey times). This
effect is additional as it is not captured within the standard
approaches to assessing the transport user benefits of a transport
intervention (which are largely driven by time savings, reductions in
collisions or accidents or reduced overcrowding).
The productivity gains estimated in this analysis would be expected to
form just one part of any assessment of the benefits of a transport
intervention. No attempt is made to assess the standard transport user
benefits – these would be expected to largely derive from the role of the
transport intervention in unlocking economic performance by lowering
congestion or overcrowding81. In addition, improved inter-city connectivity
could contribute to other wider economic impacts that are not considered
here. For example, the ability of the area to attract FDI; and the gains to
freight and logistics (such gains would be likely to be largely captured in
standard appraisal methods).
Investment decisions should be informed by an assessment of all
anticipated costs and benefits of an intervention. An assessment of the
costs and benefits is beyond the scope of this particular study but any
productivity gains would need to be considered alongside other economic
impacts, environmental considerations (such as emissions or landscape
impacts) and social effects.
The analysis is intended to allow us to compare the relative opportunity to boost
economic performance associated with improved inter-city connections between
80 The elasticity we use is 0.03 from D’Costa et al (2009). Please see Chapter 2 for full details.
81 For example, the Eddington Transport Study (Eddington 2006) suggested that the inclusion of
wider economic impacts that are missing from current appraisals would add around 0.1 to the
benefit-cost ratio on average i.e. raising the average benefit-cost ratio for these interventions from
around 1.7 to 1.8. This is of course an average estimate and the returns will vary significantly across
interventions.
Page 140
140 Frontier Economics | March 2016
cities of different sizes and proximity, though we do not claim spurious accuracy
in the estimates.
Key assumptions are:
Journey times between rail stations are based on current actual timetable
data using a national database of every rail service in Britain;
Planned and committed enhancements to transport capacity have not
been reflected in this analysis, for example, High Speed 2 or
improvements in rail franchise services. These would be expected to
affect travel times along the corridors investigated. If these are
accounted for, the incremental accessibility gains of further improved
inter-city travel times would be lower than assessed in this report.
Estimating the effects that improved inter-city transport links might
have on earnings is an emerging area of analysis. The results shown in
this report should therefore be used as a guide to relative orders of
magnitude, rather than taken as literal and absolute estimates. Little is
known about the nature and magnitude of displacement effects.
However, there is some tentative evidence that the increases in
economic performance generated by transport improvements in one
area may have substantial negative consequences on surrounding areas.
Further analysis is needed into the potential for these effects.
The elasticities used in this report capture only the first-order effects
from improved connectivity – that is, they reflect the gains to worker
productivity holding the economic composition of the local economy
constant. The potential benefits associated with people and businesses
changing location over time, and the extent to which workers may
invest in their own skills if they have better access to jobs, would be
additional.
We have compared the gains in accessibility (access to resident workers) for the
following scenarios. These were selected because they reflect connections
between cities of different sizes, economic compositions and rail travel time
proximity, as well as different levels of inter-city commuter flows. They allow a
comparative analysis to be carried out:
Leeds to Manchester;
Manchester to Sheffield;
Liverpool – Manchester;
Leeds to Hull; and
all Northern Powerhouse inter-city rail aspirations being achieved.
Page 141
We find the following.
Improving the rail travel time between the largest cities (Leeds and
Manchester) from 49 minutes to 30 minutes leads to gains in accessibility
(i.e. number of workers to whom cities have access) for all six of the largest
city regions. Accessibility of Leeds could increase by around 2.8%, Hull by
1.5% and Manchester by 1.3% (the latter increase is relatively lower as it
starts from a higher base). This translates to an estimated gain in total
earnings for the six Northern city regions in the order of £30 million per
year or £62 million nationally, including the wider northern area.
Improving other city connections could also result in earnings increases,
though of a lower magnitude. For example, improving the rail journey time
between Manchester and Sheffield from 48 minutes to 30 minutes could
offer a gain in earnings to the six northern city regions of £18 million with a
national gain of £41 million, including gains to the wider northern region.
Improving journey times between Liverpool and Manchester from 32
minutes to 20 minutes could offer a gain of around £12 million in earnings
to the six city regions and £18 million nationally, including the wider
northern regions.
Of our scenarios modelled, improving the link between Hull and Leeds from
55 minutes to 45 minutes could offer a comparatively smaller gain in
earnings. Our analysis suggests a gain in earnings of £2 million in the six
northern city regions (almost all gain is in Hull) or £3 million nationally,
including the wider northern area.
These findings are therefore consistent with the notion that relative gains in
earnings are likely to be greater when improving connections between larger and
more productive (higher skilled) cities with relatively shorter travel times between
them.
6.6 What does this suggest for policy makers?
There are some emerging findings that are relevant and important for policy
makers as they seek to boost the economic performance of the North.
Improving inter-city transport connections is able to create an opportunity
to boost economic performance, especially where investment is targeted on
links where there is scope both to unlock transport constraints, and to drive
enhanced economic performance (subject to other conditions being in
place).
Page 142
142 Frontier Economics | March 2016
The importance of inter-city connections to unlock the gains in economic
performance that could be attained through other drivers allows us to
identify those routes that are demonstrating signs of current and future
congestion and overcrowding. Those heavily used by commuters, freight and
business travellers would be likely to provide the highest returns.
The importance of unlocking freight travel in the Northern cities must be
noted, given the substantial planned investments in ports (such as Liverpool,
Hull and Newcastle) and the importance of surface access to international
airports, such as Manchester Airport, and other regional airports.
The extent to which inter-city transport connections are able to drive
economic performance will crucially depend on the following.
Other drivers. We have seen how access to skills can only increase if
there are workers with those skills within reach. Investing in skills of
the labour force is critical. Likewise, to maximise the opportunity for
enhanced economic performance, other drivers (housing, amenities,
etc.) must be sufficient and complementary.
Intra-city connections. Gains from inter-city connectivity can only be
fully realised if the door-to-door journey is taken in to account.
Therefore, within-city travel must be adequate to cope with current and
new journeys that are associated with vibrant and growing economic
centres.
Policy makers may therefore wish to focus attention on inter-city
connections in which the following characteristics are present.
Large and fast growing cities. The potential to deliver gains in
absolute economic performance (overall earnings) is likely to be greater
for large and fast growing cities.
High and intermediate skills. There is considerable evidence that
gains from accessibility are greater for workers with higher, or
intermediate, skills levels.
Relatively high shares of sectors for which face-to-face or
business-to-business contacts are important. Producer services
(which include finance, insurance, real estate and consulting services)82
and transport services are therefore most amenable to gains from
accessibility improvements.
82 SIC codes 65 to 745.
Page 143
Cities already relatively closer together (in terms of travel times).
The benefits of increased accessibility decline rapidly with travel time
from source, particularly for service sectors.
Adequate intra-city connections. Inter-city links are only ever going
to be part of a journey. The overall change in accessibility depends on
door-to-door journey times so intra-city connections must be adequate.
This report has presented the best available evidence on the channels through
which improved transport connections could improve economic performance. It
describes the role that inter-city connections can play in this context and the
conditions under which improvements in inter-city connections are likely to
deliver comparatively greater gains in earnings.
We have carried out new indicative analysis that allows us to quantify and
compare the potential gains in earnings from improving connections between
different Northern cities. This should help to inform policy makers about the
potential gains in economic performance from improving inter-city connectivity,
and to identify where this potential is likely to be comparatively greater. We
would recommend that further analysis is carried out to assess the benefits of
such improvements in more detail, alongside the costs associated with such
improvements.
Page 144
144 Frontier Economics | March 2016
Annex: Additional material
City analysis for Chapter 3
This Annexe outlines the economic geography of each city region in turn.
Liverpool city region
Population
The population of the Liverpool city region is 1.5 million, 14% of the Northern
Powerhouse. Population growth from 2001 to 2014 averaged 0.16% per year,
with the population having been fairly constant for a number of years until a
recent acceleration to 0.29% per year since 2009. This acceleration is forecast to
continue, with average growth of 0.73% per year out to 2030 (United Nations
2014).
Figure 37. Liverpool city region population
Source: ONS Population Estimates
Economy
The Liverpool city region contributes £28 billion GVA to the economy, 13% of
the Northern Powerhouse total. The local economy grew at an average of 1.0%
per year from 2001 to 2014.
Page 145
The composition of the economy is similar to the Northern Powerhouse as a
whole but with a higher proportion in some service sectors, notably business
service activities and the public administration, education and health sectors.
Figure 38. Liverpool city region economy – GVA £bn (2014 prices)
Source: ONS Regional Accounts
Page 146
146 Frontier Economics | March 2016
Figure 39. Proportion of GVA by industry
Source: ONS Regional Accounts (2012 data)
Page 147
Productivity and skills
Productivity levels in the Liverpool city region, at £45,950 per worker, are slightly
above the average for the Northern Powerhouse, but still somewhat below the
national average. The 27% proportion of the population with qualifications NVQ
level 4 or above is also similar to the Northern Powerhouse average, and
somewhat below the national average.
Table 16. Liverpool city region productivity and qualifications
Labour productivity
(GVA/worker £s)
Qualification of NVQ4+
(% of working age
population)
Liverpool city region 45,950 27%
Northern Powerhouse 44,850 29%
National average* 49,800 36%
* Refers to UK for labour productivity, and to England and Wales for qualifications.
Source: for productivity, Centre for Cities (2015) and ONS Regional Accounts (2012 data); for
qualifications, Office for National Statistics, Social Survey Division (2015)
Manchester city region
Population
The population of the Manchester city region is 2.7 million, which constitutes
some 25% of the Northern Powerhouse, the largest of any of the city regions.
Population growth from 2001 to 2014 averaged 0.64% per year. This high growth
is expected to continue, with average growth of 0.77% per year forecast out to
2030 (United Nations 2014).
Page 148
148 Frontier Economics | March 2016
Figure 40. Manchester city region population
Source: ONS Population Estimates
Economy
The Manchester city region contributes £57 billion GVA to the economy, 27%
of the Northern Powerhouse total. This is second only to London among
proposed UK city regions (Office for National Statistics 2015b). The local
economy has grown at an average of 1.4% per year from 2001 to 2014.
The composition of the economy is similar to the Northern Powerhouse as a
whole, but with a higher proportion across almost all of the service sectors. The
production sector and the public administration, education and health sectors are
a smaller proportion of the Manchester city region’s economy than the average in
the Northern Powerhouse.
Page 149
Figure 41. Manchester city region economy – GVA £bn (2014 prices)
Source: ONS Regional Accounts
Page 150
150 Frontier Economics | March 2016
Figure 42. Proportion of GVA by industry
Source: ONS Regional Accounts (2012 data)
Page 151
Productivity and skills
Productivity levels in the Manchester city region of £45,550 per worker are
slightly above the average for the Northern Powerhouse, but still somewhat
below the national average. The 32% proportion of the population with
qualifications NVQ level 4 or above follows the same pattern. This suggests
slightly higher skill levels in the Manchester city region than elsewhere in the
Northern Powerhouse, but the difference appears to be relatively small.
Table 17. Manchester city region productivity and qualifications
Labour productivity
(GVA/worker £s)
Qualification of NVQ4+
(% of working age
population)
Manchester city region 45,550 32%
Northern Powerhouse 44,850 29%
National average* 49,800 36%
* Refers to UK for labour productivity, and to England and Wales for qualifications.
Source: for productivity, Centre for Cities (2015) and ONS Regional Accounts (2012 data); for
qualifications, Office for National Statistics, Social Survey Division (2015)
Leeds city region
Population
The population of the Leeds city region is 2.3 million, which constitutes 21% of
the Northern Powerhouse. The Leeds city region is the second largest in the
Northern Powerhouse behind Manchester. Population growth from 2001 to
2014 averaged 0.64% per year. Population growth is forecast at around 1% per
year on average out to 2030 (United Nations 2014).83
83 Note that the geographic region for this forecast uses UN definitions for West Yorkshire, which do
not exactly match the Leeds city region.
Page 152
152 Frontier Economics | March 2016
Figure 43. Leeds city region population
Source: ONS Population Estimates
Economy
The Leeds city region contributes £47 billion GVA to the economy, 22% of the
Northern Powerhouse total. The local economy has grown at an average of 1.5%
per year from 2001 to 2014.
The composition of the economy is similar to the Northern Powerhouse as a
whole, but with a higher proportion in financial and insurance activities and a
lower proportion in the public administration, education and health sectors.
Page 153
Figure 44. Leeds city region economy – GVA £bn (2014 prices)
Source: ONS Regional Accounts
Page 154
154 Frontier Economics | March 2016
Figure 45. Proportion of GVA by industry
Source: ONS Regional Accounts (2012 data)
Page 155
Productivity and skills
Productivity levels in the Leeds city region are £45,650 per worker, slightly above
the average for the Northern Powerhouse, but still somewhat below the national
average. The 29% proportion of the population with qualifications NVQ level 4
or above is the same as the Northern Powerhouse average, and somewhat below
the national average.
Table 18. Leeds city region productivity and qualifications
Labour productivity
(GVA/worker £s)
Qualification of NVQ4+
(% of working age
population)
Leeds city region 45,650 29%
Northern Powerhouse 44,850 29%
National average* 49,800 36%
* Refers to UK for labour productivity, and to England and Wales for qualifications.
Source: for productivity, Centre for Cities (2015) and ONS Regional Accounts (2012 data); for
qualifications, Office for National Statistics, Social Survey Division (2015)
Sheffield city region
Population
The population of the Sheffield city region is 1.4 million, which constitutes 13%
of the Northern Powerhouse. Population growth from 2001 to 2014 averaged
0.58% per year. Population growth is forecast to increase to 0.89% per year on
average out to 2030 (United Nations 2014).
Page 156
156 Frontier Economics | March 2016
Figure 46. Sheffield city region population
Source: ONS Population Estimates
Economy
The Sheffield city region contributes £24 billion GVA to the economy, 11% of
the Northern Powerhouse total. The local economy has shown the fastest growth
of all of the Northern Powerhouse cities, averaging 1.8% per year from 2001 to
2014.
The composition of the economy is broadly similar to the Northern Powerhouse
as a whole, but with some differences in the shares of specific services sectors. A
significantly higher proportion of GVA is in the public administration, education
and health sectors. Meanwhile, the proportion is smaller than average for
financial and insurance activities, real estate activities and business service
activities.
Page 157
Figure 47. Sheffield city region economy – GVA £bn (2014 prices)
Source: ONS Regional Accounts
Page 158
158 Frontier Economics | March 2016
Figure 48. Proportion of GVA by industry
Source: ONS Regional Accounts (2012 data)
Page 159
Productivity and skills
Productivity levels in the Sheffield city region are £41,200 per worker, which is
below the average for the Northern Powerhouse and the national average. The
proportion of the population with qualifications NVQ level 4 or above follows a
similar pattern, showing 28% of the population with these qualifications in the
Sheffield city region.
Table 19. Sheffield city region productivity and qualifications
Labour productivity
(GVA/worker £s)
Qualification of NVQ4+
(% of working age
population)
Sheffield city region 41,200 28%
Northern Powerhouse 44,850 29%
National average* 49,800 36%
* Refers to UK for labour productivity, and to England and Wales for qualifications.
Source: for productivity, Centre for Cities (2015) and ONS Regional Accounts (2012 data); for
qualifications, Office for National Statistics, Social Survey Division (2015)
Hull city region
Population
The population of the Hull city region is 0.9 million, constituting 9% of the
Northern Powerhouse, the smallest of the city regions. Population growth from
2001 to 2014 averaged 0.41% per year. Population growth is forecast to increase
to 0.92% per year on average out to 2030 (United Nations 2014).
Page 160
160 Frontier Economics | March 2016
Figure 49. Hull city region population
Source: ONS Population Estimates
Economy
The Hull city region contributes £17 billion GVA to the economy, 8% of the
Northern Powerhouse total. The local economy grew at an average of 1.1% per
year from 2001 to 2014.
The composition of the economy shows a significantly higher proportion of
GVA in the production sector, which includes manufacturing, compared with the
Northern Powerhouse average. The production sector constitutes some 28% of
the Hull city region economy. The relative importance of production is mirrored
by a lower share of the economy in almost all of the service sectors compared
with the average.
Page 161
Figure 50. Hull city region economy – GVA £bn (2014 prices)
Source: ONS Regional Accounts
Page 162
162 Frontier Economics | March 2016
Figure 51. Proportion of GVA by industry
Source: ONS Regional Accounts (2012 data)
Page 163
Productivity and skills
Productivity levels in the Hull city region are £45,300 per worker. This is slightly
above the average for the Northern Powerhouse, but still somewhat below the
national average. The proportion of the population with qualifications NVQ level
4 or above is 27%, which is below the Northern Powerhouse and national
averages.
Table 20. Hull city region productivity and qualifications
Labour productivity
(GVA/worker £s)
Qualification of NVQ4+
(% of working age
population)
Hull city region 45,300 27%
Northern Powerhouse 44,850 29%
National average* 49,800 36%
* Refers to UK for labour productivity, and to England and Wales for qualifications.
Source: for productivity, Centre for Cities (2015) and ONS Regional Accounts (2012 data); for
qualifications, Office for National Statistics, Social Survey Division (2015)
Newcastle city region
Population
The population of the Newcastle city region is just below 2.0 million, which
constitutes 18% of the Northern Powerhouse. Population growth from 2001 to
2014 averaged 0.26% per year, which is relatively low compared with most of the
other city regions discussed above. However, population growth is forecast to
increase to 0.80% per year on average out to 2030, which is more in line with the
Northern Powerhouse average (United Nations 2014).84
84 Note that the geographic region for this forecast uses Newcastle and Sunderland, which does not
exactly match the Newcastle city region.
Page 164
164 Frontier Economics | March 2016
Figure 52. Newcastle city region population
Source: ONS Population Estimates
Economy
The Newcastle city region contributes £35 billion GVA to the economy, 17% of
the Northern Powerhouse total. The local economy grew at an average of 1.6%
per year from 2001 to 2014.
The composition of the economy is broadly similar to the Northern Powerhouse
as a whole. The production sector and the public administration, education and
health sectors take a higher proportion of GVA than average. Most other service
sectors have a share of the economy slightly below the average.
Page 165
Figure 53. Newcastle city region economy – GVA £bn (2014 prices)
Source: ONS Regional Accounts
Page 166
166 Frontier Economics | March 2016
Figure 54. Proportion of GVA by industry
Source: ONS Regional Accounts (2012 data)
Page 167
Productivity and skills
Productivity levels in the Newcastle city region are £44,150 per worker, close to
the average for the Northern Powerhouse and somewhat below the national
average. The 29% proportion of the population with qualifications NVQ level 4
or above follows the same pattern.
Table 21. Newcastle city region productivity and qualifications
Labour productivity
(GVA/worker £s)
Qualification of NVQ4+
(% of working age
population)
Newcastle city region 44,150 29%
Northern Powerhouse 44,850 29%
National average* 49,800 36%
* Refers to UK for labour productivity, and to England and Wales for qualifications.
Source: for productivity, Centre for Cities (2015) and ONS Regional Accounts (2012 data); for
qualifications, Office for National Statistics, Social Survey Division (2015)
Gravity modelling assumptions in Chapter 4
The 3 gravity model specifications are as follows:
Model 1: Controls for origin and destination wages and employment and distance
(does not control for unobserved characteristics)
Model 2: Controls for wages and employment, distance and unobserved
characteristics separately by origin and destination (partly controls for
unobserved characteristics)
Model 3: Controls for distance and unobserved origin and destination
characteristics (fully controls for unobserved characteristics)
Details of the methodology can be found in D’Costa et al. 2009. The only
difference is that our modelling includes distance in logs rather than levels, to
capture any non-linear effects of distance on commuter flows.
Page 168
168 Frontier Economics | March 2016
Table 22. Gravity of inter-city LA-LA commuting flows
Explanatory
variable
Model 1 Model 2 Model 3
Destination
characteristics
Log employment 0.945*** -0.694*** -
Log wage 1.149*** 13.84*** -
Log distance -1.900*** -1.863*** -2.480***
R-squared 0.73 0.696 0.827
Origin
characteristics
Log employment 0.761*** 1.217*** -
Log wage -1.255*** -4.206 -
Log distance -1.900*** -2.142*** -2.480***
R-squared 0.73 0.573 0.827
Source: Modelling based on Census 2011, ASHE, NSPD data
Page 169
Table 23. Predicted versus actual commuting flows (second stage)
Corridor Model 1 Model 2 Model 3
Hull-Leeds 0.705*** 0.316*** 0.362***
Hull-Liverpool -0.138 0.0884 0.126
Hull-Manchester -0.590*** -0.552*** -0.247***
Hull-Newcastle -0.136 -0.0677 -0.416***
Hull-Sheffield 0.942*** 0.971*** 0.718***
Leeds-Liverpool -0.299*** -0.817*** -0.346***
Leeds-
Manchester
0.0886* 0.0633 -0.0780**
Leeds-Newcastle 0.399*** -0.156*** 0.00481
Leeds-Sheffield 0.885*** 1.024*** 0.344***
Liverpool-
Manchester
0.268*** 0.732*** 0.365***
Liverpool-
Newcastle
-0.161** 0.0338 -0.0830
Liverpool-
Sheffield
-0.716*** -0.942*** -0.452***
Manchester-
Newcastle
-0.0848 -0.0438 0.105**
Manchester-
Sheffield
-0.580*** -0.558*** -0.383***
Newcastle-
Sheffield
0.377*** 0.330*** 0.289***
Source: Modelling based on Census 2011, ASHE, NSPD data
Page 170
170 Frontier Economics | March 2016
Technical Annex: Northern Powerhouse inter-city
rail connectivity methodology
This technical Annexe provides further detail on the assumptions and
methodology used to derive the results set out in Chapter 5.
Measuring access to economic mass and its changes
For the purposes of this study, economic mass accessible by rail from an origin
TTWA i is defined by a standard form of effective density/accessibility index:
(1) j
i
j ij
EA
time
Where Ej is a variable capturing economic activity at destination TTWA j, and
time_ij is the minimum travel time by rail between TTWA i and TTWA j. These
accessibility indices are calculated for each TTWA from measures of economic
activity derived from the 2011 Great Britain census at TTWA level and from rail
travel time data (RUDD as explained below). The TTWA-to-TTWA journey
times are then adjusted to match aspirations for reductions in journey times
between Liverpool-Manchester, Manchester-Leeds, Manchester-Sheffield,
Sheffield-Leeds, Leeds-Hull and Leeds-Newcastle as set out in TfN (2015) and
the accessibility indices re-calculated.
The parameter α is a time decay parameter which sets the rate at which the
weights applied to destination TTWA_j employment decline with travel time
between TTWA_i an TTWA_j. For the present analysis, this parameter is set to
1, in line with the value used most commonly in the literature, and in (D’Costa et
al 2009) which provides the estimates of the elasticity of productivity (wages)
with respect to accessibility (see Chapter 2.3).
Accessibility indices A_i0 and A_i1 are calculated for the baseline period
(assumed to be present day travel times) and for the post-policy period with inter
TTWA travel times adjusted according to some or all of these Northern
Powerhouse aspirations (depending on the scenario being analysed). The
difference between the natural log of these indices then gives the approximate
proportionate changes in accessibility:
1 0
ln ln lnj j
i
j jij ij
E EA
time time
Note the employment values in the numerators of these indices are held constant
at 2011 values (derived from the 2011 census).
Estimates of the response of wages to changes in this accessibility
The accessibility changes are translated into a change in worker productivity by
multiplying them by a parameter taken from published literature. This
Page 171
agglomeration elasticity parameter has been estimated in many studies in various
contexts as detailed in Chapter 2.
In the empirical literature, these parameters are derived from regression analyses,
of a generic form
'
0 1 2ln lnk k k ky A x u
Where y is some measure of productivity (e.g. value-added, wages), A is an index
of economic mass, city size, density, accessibility or market potential and x is a
set of control variables (worker, firm or city characteristics depending on the
units of analysis). This regression may be estimated on city or other area-level
data, data on workers or data on firms. Estimates of parameter β1 provide
estimates of the percentage response of productivity to a 1% increase in
accessibility (holding other factors in x constant).
Given an estimate of β1 based on an accessibility index as defined above and an
estimate of ln iA based on a predicted change in accessibility arising from some
transport policy change, an implied percentage change in productivity or wages
can be imputed for a given location from:
1ˆln lni iy A
An estimate of β1= 0.03 is taken from (D’Costa et al 2009), because that study
provides an estimate of the effects rail-specific accessibility changes on wages
using micro data on British workers. It also uses an accessibility index of the
same form as (1), and is the most directly relevant study. Having an estimate of
the impact on earnings means that the accessibility changes can be translated into
potential earnings increases in each TTWA and in Britain as a whole.
Estimates of the aggregate impact on earnings in each TTWA and in the country
overall are calculated from TTWA mean wages and TTWA worker numbers.
Mean wages (gross annual earnings, all workers) are taken from Annual Survey of
Hours and Earnings data which is available at Parliamentary Constituency (PC)
level (2010 PC definitions, wages averaged over 2010-2015) from
www.nomisweb.co.uk. Given that PCs overlap TTWA boundaries and vice versa,
PCs are matched to TTWAs using an area-based weighting procedure (PC
workers and aggregated earnings are assigned to TTWAs according to the land
area of intersection between PCs and TTWAs).
Since β1 gives the percentage change in mean earnings from a 1% change in
accessibility, estimates of aggregate changes in total earnings in a TTWA are
given by:
1ˆ lni i i iy A workers meanearnings
Page 172
172 Frontier Economics | March 2016
Measuring minimum TTWA-to-TTWA journey times by rail
This section outlines the approach to estimation of the inter-travel-to-work-area
(TTWA) travel time matrix between every origin and destination TTWA. This is
required for computation of the accessibility index in equation (1). Two datasets
were used namely: 1) the Rail-Usage-Driver-Dataset (RUDD) supplied with
permission by DfT; and 2) a RUDD station to TTWA lookup dataset.
The RUDD data contains station-to-station journey times and is derived from
timetable information. It represents around 80% of journeys in Britain. These
data have been processed using a network analysis journey-time weighted
shortest path algorithm to derive the minimum journey times from any given
origin station s to every other destination station j in the RUDD set of stations.
The journey time between each station is calculated from the difference of the
arrival time at its destination station and the departure time at its origin station.
The second step is to collapse (average) every RUDD origin and destination
station pair according to its corresponding TTWA using the lookup table from
the dataset. There are often multiple stations in any given TTWA and hence
multiple station-station journey times corresponding to any potential TTWA-to-
TTWA journey. For example, suppose there is one station, station 1, in TTWA 1
and two stations, stations 4 and 5, in TTWA 2. This gives two station-station link
times between TTWA 1 and TTWA 2: 14stime 15stime .
From the origin-destination matrix of station-station minimum journey times,
unique origin-TTWA-to-destination-TTWA journey times are estimated by
averaging the minimum station-station journey times. The averaging is done
according to which TTWAs contain the origin and destination stations. A simple
average of the station-station journey times would be misleading since it would
give insufficient weight to services that were more frequent and heavily used. For
instance, suppose in the above example, 14stime was 30 minutes and stations 1
and 4 have 6 trains per hour whereas 15stime was 1 hour and station 5 only has 1
train per hour. A simple mean would give an average journey time between
TTWA 1 and TTWA 2 of 45 minutes, which would be an overestimate since
most journeys would presumably be via station 1 and 4. Ideally, to construct the
actual average journey times would require passenger volumes, but these data
were unavailable in the time available for this study. Instead, the station service
frequencies ( sf ) are used to construct appropriate weights, with the weight on a
station-station link given by the product of the total service frequencies at the
origin and destination stations. In the above example, the weight on link 1-4
would be 6 x 6 = 36, whereas the weight on link 1-5 would be 6 x 1 = 6. These
weights are used to calculate a service frequency weighted average travel time
between TTWAs. In the above example, the weighted average minimum rail
journey time in minutes between TTWA 1 and 2 becomes
Page 173
1 51 412 14 15
1 4 1 5 1 4 1 5
36 630 60 34.3
36 6 36 6
f ff ftime stime stime
f f f f f f f f
Note, in a few cases, a TTWA contains no station in the RUDD data so is
missing from the analysis (it is infeasible to compute a travel time change when
there is no station present). These are shown on the maps in the report as
uncoloured TTWAs. These are remote, rural and unpopulated TTWAs so will
not affect the analysis substantively.
To construct aspirational TTWA-TTWA journey times, the aspirational central-
city-to-central-city journey times are applied to the links between the main
stations in the corresponding Northern Powerhouse TTWAs (Manchester,
Liverpool, Leeds, Sheffield, Hull, Newcastle) as described in the next section.
The entire station-station origin destination minimum travel time matrix is then
recomputed to allow for the fact that these new links may reduce the travel times
between stations throughout the network where the overall journey relies on the
newly improved link. The revised TTWA-TTWA travel times are then
recomputed using the frequency weighted averaging procedure described above.
Intra-TTWA travel times
The RUDD data is unsuitable for generating intra-TTWA travel times because it
does not provide full coverage of all stations within cities. The modelling also
should allow for the fact that many intra-TTWA journeys required to reach a
station from home or the workplace would be done by road rather than rail. A
full analysis would require information on intra-TTWA rail and road journey
times which is beyond the scope of the present study. Instead to approximate
intra-TTWA travel times an analytical approach is used. This involves: 1)
calculating the average distance from a random point within a circle of the same
land area as the TTWA to its centre; 2) assuming a fixed intra TTWA travel
speed (set at 40km per hour, the mean vehicle speed on journeys in Britain) and;
allowing for transfer/waiting times (10 minutes). The formula for inter-TTWA
travel time in minutes is:
360 2 /iitime wait sp ed ar ae e
Where speed is in km/h and area is in km2.
Note that inter-TTWA travel can in reality also be undertaken by road (or air).
The analysis provided here does not take into account other modes of travel
between TTWAs when calculating the accessibility indices. This means that the
changes in accessibility calculated from changes in rail travel times in the
Northern Powerhouse aspirations refer to changes in rail accessibility only. These
may overstate the true percentage change in accessibility by all modes, given that
a substantial part of the existing accessibility from a TTWA will be by other
modes. When the changes in accessibility are used to infer potential changes in
wages (productivity), elasticities are used which have been estimated conditional
Page 174
174 Frontier Economics | March 2016
on rail accessibility (D’Costa et al 2009) i.e. holding road accessibility constant.
Therefore, the predictions can be interpreted as the impact of changes in rail
accessibility, while the road infrastructure and road travel times, and intra-TTW
travel times, are kept at their initial levels.
Scenario assumptions
A total of five inter-city rail scenarios were estimated. The scenarios use the
travel time improvements highlighted in TfN (2015). The Figure below illustrates
the travel time improvements for the seven key stations.
Figure 55. TfN Aspirational rail journey times between Northern cities
Source: Reproduced from Transport for the North, 2015, The Northern Powerhouse: One Agenda, One
Economy, One North, A report on the Northern Transport Strategy.
Each aspiration improvement takes the report’s improvement ratio (TfN
aspirational journey time/ current journey time reported by TfN) from TfN
(2015)85 and multiplies it with the current model journey time from the Rail-
85 Transport for the North, 2015, The Northern Powerhouse: One Agenda, One Economy, One
North, A report on the Northern Transport Strategy.
Page 175
Usage-Driver-Dataset (RUDD) supplied with permission by DfT to calculate an
aspirational model journey time. This is illustrated in the table below.
Table 24. Aspirational station-station journey times (all in minutes)
Origin Destination Model current
Model aspiration
Current time reported by TfN
TfN report aspiration
Hull Leeds 57.79 47.28 55 45
Hull Sheffield 88.28 61.59 86 60
Leeds Manchester Br 55.93 34.24 49 30
Leeds Newcastle 90.20 62.21 87 60
Leeds Sheffield 46.23 34.68 40 30
Liverpool Br
Manchester
Airport 71.21 32.87 65 30
Liverpool Br Manchester Br 47.52 29.70 32 20
Manchester
Airport Manchester Br 18.91 14.54 13 10
Manchester
Airport Sheffield 77.25 31.75 73 30
Manchester Br Sheffield 52.64 32.90 48 30
Source: Analysis for this study
The table below highlights all the current journey times between stations in grey
and all the improvements highlighted for each scenarios in yellow. The existing
run uses the current model journey time from the Rail-Usage-Driver-Dataset
(RUDD). The proposal run 1 is the full aspiration scenario that takes the base
scenario with improvements between all the pairs as listed in Table 1. The
proposal run 2 takes the base scenario with improvement between Manchester
and Leeds. The proposal run 3 takes the base scenario with improvement
between Manchester and Sheffield. The proposal run 4 takes the base scenario
with improvement between Hull and Leeds.
Table 25. Station-station travel times under various scenarios (all in minutes)
Origin Destination Existing Run
Proposal Run 1
Proposal Run 2
Proposal Run 3
Proposal Run 4
Page 176
176 Frontier Economics | March 2016
Hull Leeds 57.79 47.28 57.79 57.79 47.28
Hull Sheffield 88.28 61.59 88.28 88.28 88.28
Leeds
Manchester
Br 55.93 34.24 34.24 55.93 55.93
Leeds Newcastle 90.20 62.21 90.20 90.20 90.20
Leeds Sheffield 46.23 34.68 46.23 46.23 46.23
Liverpool Br
Manchester
Airport 71.21 32.87 71.21 71.21 71.21
Liverpool Br
Manchester
Br 47.52 29.70 47.52 47.52 47.52
Manchester
Airport
Manchester
Br 18.91 14.54 18.91 18.91 18.91
Manchester
Airport Sheffield 77.25 31.75 77.25 77.25 77.25
Manchester
Br Sheffield 52.64 32.90 52.64 32.90 52.64
Source: Analysis for this study
Final inter and intra TTWA travel times
Table 3 below shows an example of the inter and intra TTWA travel times
between the key 6 Northern Powerhouse cities for the ‘All aspirations’ scenario,
which is the end product of the steps described in sections 4 and 5. Note the full
TTWA_i to TTWA_j travel time time_ij is derived by adding the internal TTW
travel time to each end of the journey. Note the full analysis includes the baseline
and post-policy inter TTWA travel times between all TTWAs with RUDD
stations in Britain. This table is an extract.
Table 26. TTWA travel time matrix for 6 key Northern Powerhouse cities, under
baseline and ‘All aspirations’ scenarios (All times in minutes)
Origin Destination Pre improvement Post improvement
Hull Hull 32.7 32.7
Hull Leeds 62.9 55.2
Hull Liverpool 168.4 124.7
Hull Manchester 121.4 93.0
Page 177
Hull Newcastle 124.8 112.9
Hull Sheffield 80.8 67.8
Leeds Leeds 24.3 24.3
Leeds Liverpool 114.7 78.5
Leeds Manchester 68.0 47.0
Leeds Newcastle 92.4 67.5
Leeds Sheffield 52.0 42.5
Liverpool Liverpool 23.9 23.9
Liverpool Manchester 62.5 47.4
Liverpool Newcastle 196.6 137.5
Liverpool Sheffield 111.3 76.8
Manchester Manchester 34.2 34.2
Manchester Newcastle 152.6 106.1
Manchester Sheffield 61.5 44.2
Newcastle Newcastle 30.0 30.0
Newcastle Sheffield 113.8 100.9
Sheffield Sheffield 25.5 25.5
Source: Analysis for this study
Page 178
178 Frontier Economics | March 2016
Bibliography
AA Route Finder, 2015, http://www.theaa.com/route-planner/index.jsp
Aghion, Philippe, Tim Besley, John Browne, Francesco Caselli, Richard Lambert,
Rachel Lomax, Chris Pissarides, Nick Stern and John Van Reenen 2013. Investing
for Prosperity: Skills, Infrastructure and Innovation. LSE Growth Commission.
Andersson, Martin, Johan Klaesson and Johan Larsson 2014. The sources of the
urban wage premium by worker skills: spatial sorting or agglomeration economies? Papers in
Regional Science 93, 727–747.
Basile, Roberto 2004. Acquisition versus greenfield investment: the location of foreign
manufacturers in Italy. Regional Science and Urban Economics.
BBC 2011. Liverpool underground stations get £40m overhaul,
http://www.bbc.co.uk/news/uk-england-merseyside-14779812
Berube, Alan, Tony Champion, Mike Coombes, Martin Crookston, Danny
Dorling, Richard Evans, Norman Glass, Mary Hutchins, Bruce Katz, Ade
Kearns, Ron Martin, Alison Park, Michael Parkinson, James Simmie, Ivan Turok
and Peter Wood 2006. State of the English Cities, Volume 1. Office of Deputy Prime
Minister.
Centre for Cities 2015. Northern Powerhouse factsheet.
Chalermpong, Saksith 2002. Economic Spillovers of Highway Investment: A Case Study
of the Employment Impacts of Interstate 105 in Los Angeles County. University of
California Transportation Centre.
Chandra, Amitabh and Eric Thompson 2000. Does public infrastructure affect economic
activity? Evidence from the rural interstate highway system. Regional Science and Urban
Economics 30, 457–490.
City Growth Commission 2014. Unleashing Metro Growth, Final Recommendations of
the City Growth Commission. City Growth Commission.
Combes, Pierre-Philippe and Laurent Gobillon 2015. The Empirics of Agglomeration
Economies, in Handbook of Regional and Urban Economics, Volume 5, edited by Gilles
Duranton, J. Vernon Henderson and William C. Strange. Elsevier.
Combes, Pierre-Philippe, Gilles Duranton and Laurent Gobillon 2008a. Spatial
wage disparities: Sorting matters! Journal of Urban Economics 63, 723–742.
Combes, Pierre-Philippe, Jacques-Francois Thisse and Thierry Mayer 2008b.
Economic Geography: The Integration of Regions and Nations. Princeton University
Press.
Cox, Ed and Bill Davies 2013. Transformational Infrastructure for the North: Why We
Need a Great North Plan. IPPR North.
Page 179
D’Costa, Sabine and Henry Overman 2014. The urban wage growth premium: Sorting
or learning? Regional Science and Urban Economics 48, 168–179.
D’Costa, Sabine, Steve Gibbons, Giordano Mion, Henry Overman, Panu
Pelkonen, Guilherme Resende and Mike Thomas 2009. Strengthening Economic
Linkages between Leeds and Manchester: Feasibility and Implications. LSE Spatial
Economics Research Centre.
Department for Transport 2011, Transport Statistics Great Britain: 2011.
Department for Transport 2014a. Rail statistics 2014.
Department for Transport 2014b. Road freight statistics.
Department for Transport 2014c. Maritime and shipping statistics.
Department for Transport 2014d. Port freight statistics.
Department for Transport 2015, Trans- Pennine Routes Feasibility Study
Summary
Duranton, Gilles and Matthew Turner 2011. Urban Growth and Transportation.
Review of Economic Studies 01, 1–36.
Durham Business School for Joint Planning Teams of Newcastle City Council
and Gateshead Council 2012. Long Term Employment and Demographic
Projections.Eddington, Rod 2006. The Eddington Transport Study. Department for
Transport.
Eurostat 2012. Modal split of inland freight transport
Eurostat 2013. Gross weight of seaborne goods handled in ports
Fingleton, Bernard 2008. Testing the NEG Model: Further Evidence from Panel Data.
LSE Spatial Economics Research Centre.
Gibbons, Steve 2015. Planes, Trains and Automobiles: The Economic Impact of Transport
Infrastructure. LSE Spatial Economics Research Centre.
Gibbons, Steve, Henry Overman and Alessandra Tucci 2009a. The Case for
Agglomeration Economies. Manchester Independent Economic Review.
Gibbons, Steve, Daniel Graham and Ralf Martin 2009b. Transport Investment and
the Distance Decay of Agglomeration Benefits. Working Paper.
Gibbons, Steve, Henry Overman, Rosa Sanchis-Guarner and Teemu Lyytikäinen
2012. New Road Infrastructure: The Effects on Firms. LSE Spatial Economics
Research Centre.
Gould, Eric 2007. Cities, workers, and wages: a structural analysis of the urban wage
premium. Review of Economic Studies 74, 477–506.
Graham, Daniel 2006. Investigating the link between productivity and agglomeration for UK
industries. Department for Transport.
Page 180
180 Frontier Economics | March 2016
Graham, Daniel and Patricia Melo 2009. Agglomeration Economies and Labour
Productivity: Evidence from Longitudinal Worker Data for GB’s Travel-to-Work Areas.
LSE Spatial Economics Research Centre.
Hanson, Gordon 1997. Increasing returns, trade, and the regional structure of wages.
Economic Journal 107, 113–133.
High Speed Two Limited 2014. Rebalancing Britain.
Highways England 2015, Map of Key Roads, http://www.highways.gov.uk/our-
road-network/our-network/key-roads/
HM Treasury 2015a. Long term economic plan for the north-west set out by Prime Minister
and Chancellor, News story, 8 January 2015,
https://www.gov.uk/government/news/long-term-economic-plan-for-the-
north-west-set-out-by-prime-minister-and-chancellor.
HM Treasury 2015b. Chancellor George Osborne’s Budget 2015 speech, 18 March 2015,
https://www.gov.uk/government/speeches/chancellor-george-osbornes-budget-
2015-speech.
Independent Transport Commission 2014. Improving the efficiency of freight movements:
The contribution to UK economic growth
IPPR North, RBLS Consulting and East West Locations 2013. Sheffield City Region
Independent Economic Review. Sheffield City Region Local Enterprise Partnership
(http://sheffieldcityregion.org.uk/wp-content/uploads/2013/10/Independent-
Economic-Review.pdf).
KPMG 2010. High speed rail in Britain: Consequences for employment and economic growth.
Greengauge21.
Krugman, Paul 2005. Second Wind for Industrial Regions, in New Wealth for Old
Nations: Scotland’s Economic Prospects, edited by Diane Coyle, Wendy Alexander and
Brian Ashcroft. Princeton University Press.
Laird, James, Henry Overman and Anthony Venables 2014. Transport investment
and economic performance: Implications for project appraisal. Department for Transport.
Leeds City Council 2013, Leeds Economy Briefing Note.
Liverpool City Region Skills for Growth 2013. Annual Report 2013.
Mackie, Peter, Chris Nash, Tony Whiteing and Tom Worsley 2015. Response to
National Infrastructure Commission Northern Connectivity Consultation. Institute for
Transport Studies, University of Leeds.
Matano, Alessia and Paolo Naticchioni 2012. Wage distribution and the spatial sorting
of workers. Journal of Economic Geography 12, 379–408.
Melo, Patricia, Daniel Graham and Robert Noland 2009. A meta-analysis of
estimates of urban agglomeration economies. Regional Science and Urban Economics 39,
332–342.
Page 181
Mion, Giordano and Paolo Naticchioni 2009. The spatial sorting and matching of skills
and firms. Canadian Journal of Economics 42, 28–55.
Network Rail 2015. Rail freight resource centre
Nordhaus, William 2005. The Sources of the Productivity Rebound and the Manufacturing
Employment Puzzle. NBER Working paper.
Office for Budget Responsibility 2015. Economic and fiscal outlook
(http://cdn.budgetresponsibility.independent.gov.uk/EFO_November__2015.p
df).
Office for National Statistics 2011. Census data on location of usual residence
and place of work, https://www.nomisweb.co.uk/census/2011/rf03ew
Office for National Statistics 2015a. Labour Productivity, Q3 2015.
Office for National Statistics 2015b. City Regions Article,
http://www.ons.gov.uk/ons/dcp171776_411826.pdf
Office for National Statistics 2015c. Regional Accounts.
Office for National Statistics, Social Survey Division 2015. Annual Population
Survey, January–December, 2014. [data collection]. UK Data Service. SN: 7684,
http://dx.doi.org/10.5255/UKDA-SN-7684-1.
Office of the Deputy Prime Minister 2006 State of the English Cities Volume 1
http://webarchive.nationalarchives.gov.uk/20070101092320/http:/www.commu
nities.gov.uk/documents/citiesandregions/pdf/143999
Office of Rail and Road 2015. Estimates of Station Usage Time Series: 1997–98
to 2014–15
One North 2014. A proposition for an interconnected North
Osborne, George 2015. Speech on building a Northern Powerhouse, available at
https://www.gov.uk/government/speeches/chancellor-on-building-a-northern-
powerhouse. HM Treasury
Overman, H., Gibbons, s. and Tucci, 2009 A. Manchester Independent Economic
Review: the Case for Agglomeration Economies http://www.manchester-
review.org.uk/project_718.html
Oxford Economics 2015, Greater Manchester Forecasting Model 2014/2015 Report.
Puga, Diego 2010. The magnitude and causes of agglomeration economies. Journal of
Regional Science 50, 203–219.
Puga, Diego 2011. European regional policies in light of recent location theories. CEPR
Discussion Paper No. 2767.
Puga, Diego and Jorge De la Roca 2012. Learning by working in big cities. Centre for
Economic Performance Working Paper.
Page 182
182 Frontier Economics | March 2016
Rice, Patricia, Anthony Venables and Eleonora Patacchini 2006. Spatial
determinants of productivity: analysis for the regions of Great Britain. Regional Science and
Urban Economics 36, 727–752.
Spatial Economics Research Centre 2009. Strengthening economic linkages between
Leeds and Manchester: Feasibility and implications, a report for The Northern Way
Steer Davie Gleave (2014) Transport Constraints and Opportunities in the North of
England
Transport for the North, 2015a. The Northern Powerhouse: One Agenda, One Economy,
One North.
Transport for the North 2015b. The Northern Transport Strategy: Autumn Report.
United Nations 2014. The 2014 Revision of World Urbanization Prospects, CD-ROM
Edition. United Nations, Department of Economic and Social Affairs,
Population Division.
University of Hull 2013. The Humber’s Future Economic and Sustainable Development.
What Works Centre for Local Economic Growth 2015. Evidence Review 7:
Transport. What Works Centre for Local Economic Growth.
Page 183
FRONTIER ECONOMICS EUROPE
BRUSSELS | COLOGNE | LONDON | MADRID
Frontier Economics Ltd 71 High Holborn London WC1V 6DA
Tel. +44 (0)20 7031 7000 Fax. +44 (0)20 7031 7001 www.frontier-economics.com