Page 1
CHAPTER 1: INTRODUCTION
1.1INTRODUCTION
A stable and reliable electric power supply system is an inevitable pre-requisite
for the technological and economic growth of any nation. Due to this, utilities must strive
and ensure that the customer’s reliability requirements are met and the regulators
requirements satisfied at the lowest possible cost. It is known fact around the world that
90% of the customer service interruptions are caused due to failure in distribution system.
Therefore, it is worth considering reliability worth assessments as it provides an
opportunity to incorporate the cost or losses incurred by the utilities customer as a result
of power failure and this must be considered in planning and operating practices.
The power system basically consists of generation, transmission and distribution,
regulated either by a single entity or by the number of entities. Hence, the responsibility
of maintaining reliability at different levels falls with different entities and should be the
common goals of the custodians of the various systems at different levels. Also
Regulators require most of investor owned utilities to report their reliability indices and
the regulator trend is moving towards performance based rates where performance is
rewarded and penalized based as quantified by regulator indices.
1.2 PROBLEM FORMULATION
Electricity networks are, and will continue to be a critical part of our energy
infrastructure,and we have the responsibility to ensure that they are developed
consistently and in a mannerthat meets future demands of society and customers. The
process of network developmentshould be directed towards a long term vision aligned
with the expectations of the present andfuture customers. After corporatization and
forming as utility company, BPCL`s mission is to transmit, distribute and supply
adequate electricity in a safe, reliable and efficient manner andthis has to be
accomplished.
The main problem facing by electric power utilities in developing countries today is that
thepower demand is increasingly rapidly where supply growth is constrained by scarce
1
Page 2
resources,environmental problems and other societal concerns. This has resulted in a
need for moreextensive justifications of the new system facilities, and improvements in
production and useof electricity. System planning and operation based on reliability
cost/worth evaluationapproach provides an opportunity to justify one of the scrutinized
and vulnerable economicsectors in Bhutan. It is with this objective to conduct customer
surveys to find out the outagecost of interruptions.
The analysis of the customer failure statistics reveal that the distribution system
makeshighest individual contribution to the unavailability of supply to the customer.
With the existing system, the customer interruptions is as high as 20-30 hours per year.
Withthe vision of electricity to all within 2017, the interruptions per customer may
furtherdeteriorate due to rapid expansion of the distribution systems. As of now, no
sufficient technical research have been carried out in the distribution network, it may be
due to lack oftechnical expertise in the Utility and most of the interruption has been
caused due to thefailure in the distribution systems.Comparing with other utilities around
the world,reliability standards are very low in distribution system. Hence, it is felt
necessaryto improve the reliability of the system in order to improve the utility’s
performance and tokeep our valued customers satisfied. The reliability improvement
should be based mostprobably upon the consideration of reliability worth and to find the
reliability worth, which is suitable to our context is being formulated.
Intelligent placement of Distributed Generation units, protection devices,
sectionalizers and switches in the distribution feeders has significant impact in reliability
improvement and this will be further assessed along with the capacity outage probability
table(COPT) for the distribution system.
1.3 OBJECTIVE OF THE THESIS
The goal of the power system is to supply electricity to it’s customers in an
economical and reliable manner. Reliability assessment of distribution system has
became very important in recent years in designing and planning distribution systems that
operate in an economical manner with minimal interruption of load demands. Distributed
generation plays a vital role in emerging power system to serve energy to power systems
utilizing the different types of resources and technologies. Initially Distributed generation
units are in standby mode and starts when some load points are interrupted from the
2
Page 3
supply to serve backup generation which could reduce the cost and improve reliability of
the system.
But the existence of the DG units in distribution units will effect on the
restoration time of the load points, this impact can be assessed using the concept of
conditional probability.
1.4 ORGANIZATION OF THE THESIS
Chapter 1 Presents introduction to the overall thesis and the overview of the project. In
the project overview a brief introduction of problems associated with reliability of
distribution system.
Chapter 2 Presents an introduction to reliability, reliability assessment, types of
reliability assessments.
Chapter 3 Presents introduction to DG and its types, advantages, disadvantages,
applications, impact of DG on Power system
Chapter 4 Presents an introduction to reliability assessment indices - General and
Customer oriented indices. Presents use of reliability indices, potential problems with
indices, factors affecting reliability performance
Chapter 5 Presents a details ofreal distribution test system and the required test data
Chapter 6 Presents the results, discussion of results, conclusion and future scope of the
project.
1.5 LITERATURE SURVEY
Prior to the 1960’s, the reliability of proposed power systems was often estimated
by extrapolating the experience obtained from existing systems and using rule-of-thumb
methods to forecast the reliability of new systems.
During the 1960’s considerable work was performed in the field of power system
reliability and some excellent papers were published. The most significant publications
were two company papers by a group of Westinghouse Electric Corporation and Public
Service and Gas Company authors. These papers introduced the concept of a fluctuation
environment to describe the failure rate of transmission system components. The
techniques presented in these papers were approximations which provided results within
3
Page 4
a few percent of those obtained using more theoretical techniques, such as Markov
processes. The application of Markov Chains in the power system reliability field was
illustrated in Reference. The Markov approach is limited in application because of
computer storage requirements and the rounding errors which occur in thesolution of
large systems. Most previous publications have focused on transmission system
reliability. This research focuses on distribution system reliability. This work extends
previous research, which demonstrated sets used in describing power system reliability
calculations. Further References presented the first application to apply linked lists and
pointer concepts to reliability analysis. It took into account constraints associated with
switching operations, but it was relatively slow due to running numerous power flow
calculations. One aspect investigated h ere is the effect of Distributed Generators (DG) on
power system reliability. Standards for connecting DGs into distribution systems are just
being developed. It deals with issues related to existing DG interconnection practices. An
investigation of eleven utilities and industry interconnection standards was performed to
identify the key requirements for a DG connection. The results of this investigation led to
the development of a unified approach for determininginterconnection requirements.
Some considers many aspects of DGs in distribution systems, including protection,
harmonics, transients, voltage and frequency control. A Power flow calculation based on
the positive sequence model of the distribution circuits was presented.
4
Page 5
CHAPTER 2
DISTRIBUTION RELIABILITY ASSESSMENT
2.1 INTRODUCTION
Distribution reliability primarily relates to equipment outages and
customer interruptions. In normal operating conditions, all equipment (except
stand by is energized and all customers are energized. Schedule and unscheduled
events disrupt normal operating conditions and can lead to outages and
interruptions. The unscheduled events are caused either due to human error or due
to equipment failures. The schedule events are meant for periodic maintenance of
the equipment and shall be notified in advance to the customers. Several
indicators are used to evaluate reliability in the transmission and distribution
system. The Regulation can aim to compensate customers for very long
interruptions, keep restoration times under control and create incentives to reduce
the total number and duration of interruptions (disincentives to increase them).
Power quality is an ambiguous term that means many things to many
people. From a consumer perspective, a power quality problem might be defined
as any electric supply condition that causes appliances to malfunction or prevents
their use. From a utility perspective, a power quality problem might be viewed as
noncompliance with various standards such as RMS voltage or harmonics.
Perfect power quality is a perfect sinusoidal with constant frequency and
amplitude. The power Quality is affected when a voltage waveform is distorted
by transients or harmonics, changes its amplitudes or deviates in frequency.
Customer interruptions are power quality concern since it reduces voltage to zero.
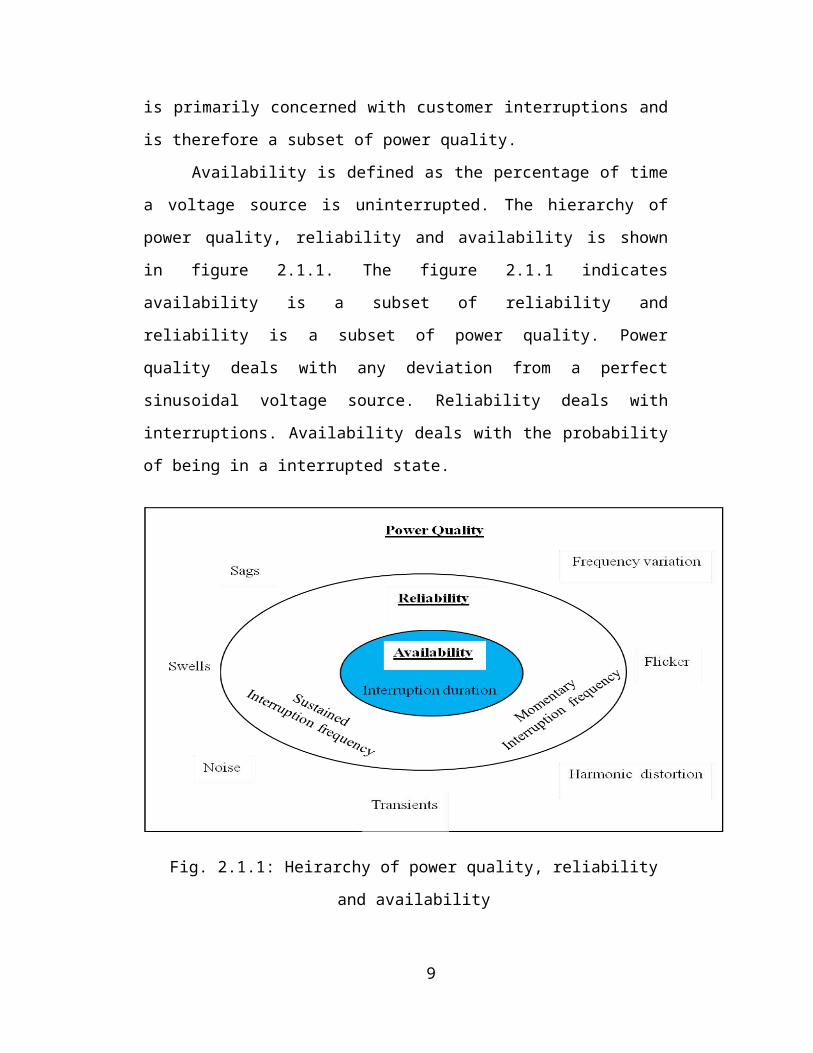
Reliability is primarily concerned with customer interruptions and is therefore a
subset of power quality.
Availability is defined as the percentage of time a voltage source is
uninterrupted. The hierarchy of power quality, reliability and availability is
shown in figure 2.1.1. The figure 2.1.1 indicates availability is a subset of
reliability and reliability is a subset of power quality. Power quality deals with
any deviation from a perfect sinusoidal voltage source. Reliability deals with
5
Page 6
interruptions. Availability deals with the probability of being in a interrupted
state.
Fig. 2.1.1: Heirarchy of power quality, reliability and availability
2.2 RELIABILITY AND ITS ASSESSMENT
2.2.1 Reliability
Reliability is an abstract term meaning endurance, dependability and good
performance. For engineering systems however it is more than an abstract term. It is
something that can be compared, evaluated, planned, and designed into a equipment plan
or system. Reliability means ability of the system to perform the function it is designed
for under the operating conditions encountered during its projected life time. Reliability
is often related to in terms of failure rate and outage time. Reliability in the context of
power system can be defined as “A general concept encompassing all the measures of the
ability to deliver electricity to all points of the utilization within acceptable standards and
in the amount desired”.
Frequency and duration of outages are relevant measures for reliability in
electricity supply systems. If reliability is regarded as a technical restriction, adequate
6
Page 7
outage indices have to be evaluated. If outages are associated with costs, reliability shall
be included within operating costs. The estimation of outage cost mostly used around is
the customer survey approach. When comparing among alternatives of approximately
equal total costs, the outage indices will be helpful in selection of the best solution.
The function of an electric power system is to satisfy the system load requirement
with a reasonable assurance of continuity and quality. The ability of the system to
provide an adequate supply of electrical energy is usually designated by the term of
reliability. The concept of power-system reliability is extremely broad and covers all
aspects of the ability of the system to satisfy the customer requirements. There is a
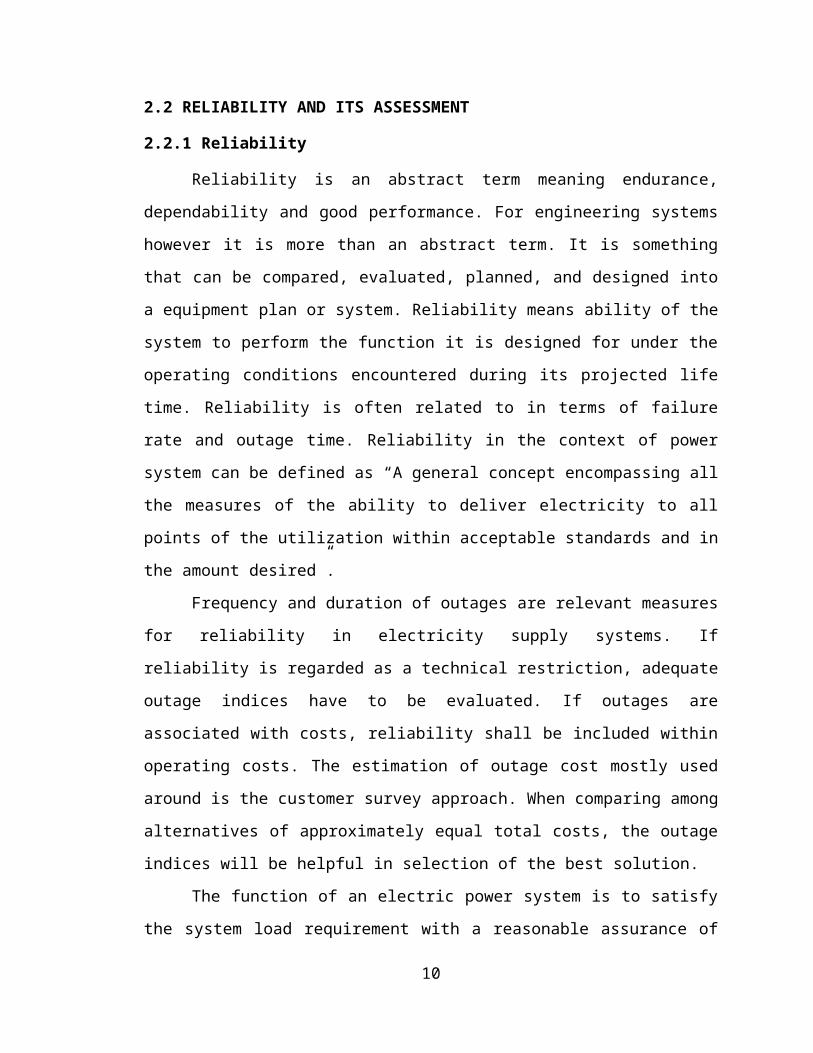
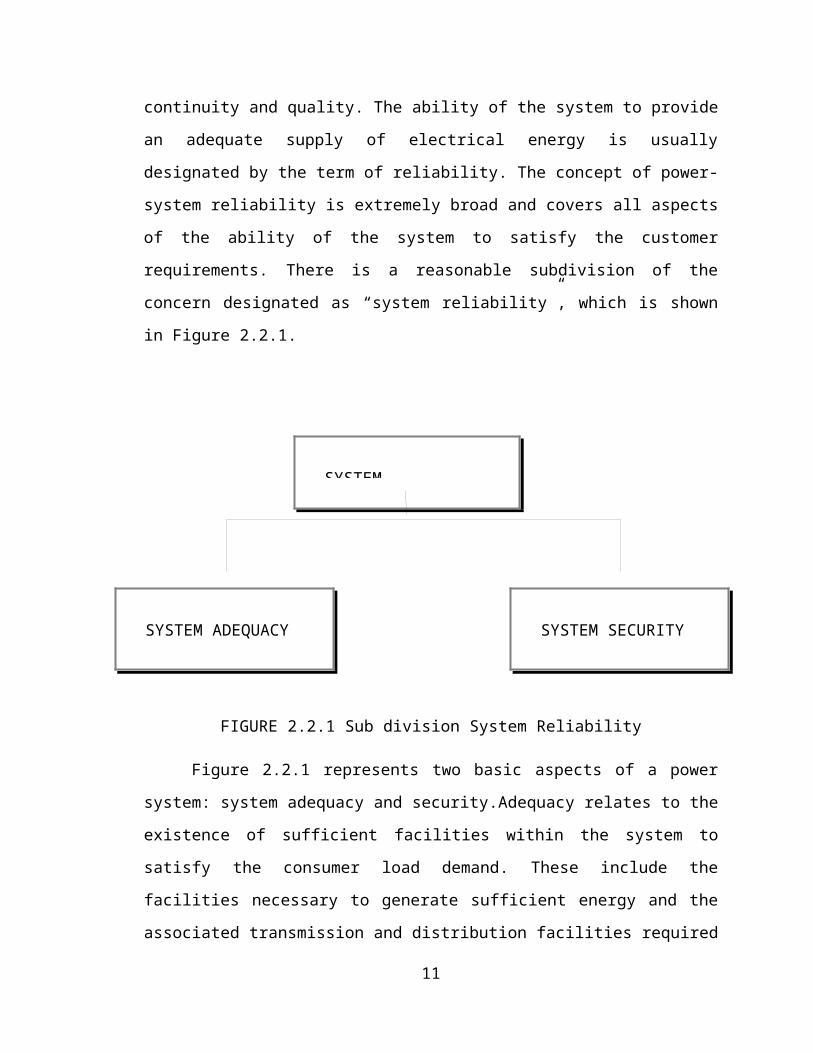
reasonable subdivision of the concern designated as “system reliability”, which is shown
in Figure 2.2.1.
FIGURE 2.2.1 Sub division System Reliability
Figure 2.2.1 represents two basic aspects of a power system: system adequacy and
security.Adequacy relates to the existence of sufficient facilities within the system to
satisfy the consumer load demand. These include the facilities necessary to generate
sufficient energy and the associated transmission and distribution facilities required to
transport the energy to the actual consumer load points. Security relates to the ability of
the system to respond to disturbances arising within that system. Security is therefore
associated with the response of the system to perturbations. Most of the probabilistic
7
SYSTEM
SYSTEM ADEQUACY SYSTEM SECURITY
Page 8
techniques presently available for power-system reliability evaluation are in the domain
of adequacy assessment.
2.2.2 Reliability Assessment
Reliability analysis has a wide range of applications in the engineering
field.Distribution reliability is the ability of the distribution system to perform its
function under stated conditions for a stated period of time without failure. Distribution
reliability is becoming significantly important in the current competitive climate because
the distribution system feeds the customer directly. The distribution system is the face of
the utility to the customer. Its assessment is to determine the system reliability and
customer satisfaction.
Rigorous analytical treatment of distribution reliability requires well defined units
of measurement, referred to as metrics. Many utilities across the world today use
reliability indices to track the performance of the utility or a region or a circuit.
Regulators require most investor owned utilities to report their reliability indices. The
regulatory trend is moving to performance based rates where performance is penalized or
rewarded based as quantified by reliability indices. Most of the utilities also pay bonuses
to managers or others based in part on reliability achievements. Even some of the
commercial and industrial customer asks utilities for their reliability indices when
planning to find a location for their establishments.
2.3 NEED FOR RELIABILITY ASSESSMENT
Reliability analysis of electrical distribution system is considered as a tool for the
planning engineer to ensure a reasonable quality of service and to choose between
different system expansion plans that cost wise were comparable considering system
investment and cost of losses
Reliability indices are significant components of any utility’s ability to measure
long-term electric service performance. Reliability metrics are one indicator of system
health or condition. The same way many complex systems have their own level of health,
these indicators let a utility know if the system is getting better or worse over time. Since
8
Page 9
all systems are different and stressed by different factors, it can be very hard to make a
legitimate comparison between two systems. This means reliability indices are situational
in nature and will present different baselines depending on the many intrinsic factors
affecting the system.
Reliability statistics can help drive utility improvement programs. Nonetheless,
when pursuing reliability improvement, taking a splintered approach can be damaging.
As such, utility managers should be sure to include all departments in a uniform plan to
understand and act on reliability data. In some cases, a system reliability meeting will
help bring other departments into the process of reinforcing system reliability. Whether a
utility decides to use meetings or have technical specialists focus on the issues, it should
be sure to identify gaps and create a uniform approach to reliability.
2.4 RELIABILITY ASSESSMENT TECHNIQUES
The ultimate goal of reliability analysis is to help answer questions like “is the
system reliable enough?” “which scheme will fail less?” and “where can the next dollar
be best spent to improve the system?”. Reliability in power system can be divided in two
basic aspects System adequacy and System security. Adequacy relates to the capacity of
the system in relation to energy demand and security relates to the dynamic response of
the system to disturbances (such as faults). Since distribution systems are seldom loaded
near their limits, system adequacy is of relatively small concern and reliability emphasis
in on system security.
The two main approaches applied to reliability evaluation of distribution systems are ;
• Simulation methods based on drawings from statistical distributions (Monte Carlo).
• Analytical methods based on solution of mathematical models
The Monte Carlo techniques are normally very “time” consuming due to large
number ofdrawings necessary in order to obtain accurate results. The fault contribution
from each component is given by a statistical distribution of failure rates and outage
times. The analytical approach is based on assumptions concerning the statistical
distributions of failure rate and repair times. The most common evaluation techniques
9
Page 10
using a set of approximate equations are failure mode analysis or minimum cut set
analysis. This method is less time consuming than the simulation methods, but suffers
from problems of representing repair times adequately. The analytical approach to
reliability evaluation of radial distribution system shall be used. The approach is called
RELRAD (Reliability in Radial systems) and is complimentary to the minimum cut set
approach.
2.5 IMPACTS OF MITIGATION TECHNIQUES AND PROTECTION SYSTEM
ON RELIABILITY
A properly co-ordinate protection system is vital to ensure that an electricity
distribution network can operate within preset requirements for safety for individual
items of equipment, staff and public, and the network overall. Suitable and reliable
equipment should be installed on all circuits and electrical equipment and to do this,
protective relays are used to initiate the isolation of faulted sections of a network in order
to maintain supplies elsewhere on the system. This then leads to an improved electricity
service with better continuity and quality of supply. This can reduce the permanent
outages and its durations. Nowadays, with the increase of sensitive load with the end
users, to improve the power quality and to mitigate the momentary interruptions is also
equally important. The first step is to find out the root cause of the problem and apply
mitigation solutions to a circuit that affects the largest number of customers.
A better over-current protection scheme can reduce number of customers affected
by temporary and permanent faults. The reliability of the system depends on the
mitigation techniques being used by the utility namely, electric and non-electric
mitigation techniques. So, historical data can be used to quantify improvements and
predict the best locations for sectionalizing devices for reliability improvements. Adding
numbers of recloser at optimal locations can reduce SAIFI, SAIDI but it should be
economically viable. The location and installation of number of Auto-recloser, Switches,
Load Break Swtiches and Sectionalizers either manual or automated helps to reduce fault
rate, repair time and sectioning time which directly reduces the impacts on the system
when fault occurs. The Mitigation Techniques applied shall depend on the need of utility
whether it wants to reduce fault rate, repair time or both or outage duration.
10
Page 11
2.6 RELIABILITY COST AND WORTH
As a concept, reliability is an inherent characteristics and a specific measure that
describes the ability of any system to perform its intended function. The primary
technical function of a power system is to supply electrical energy to its end customers.
This has always been an important system issue and power system personnel have always
strive to ensure that customers receive adequate and secure supplies within reasonable
economic constraints.
The system adequacy basically means the availability of enough generation,
transmission and distribution capacities to meet the customer demand. While on the other
hand security is considered to relate to the ability of the system to respond to disturbances
arising within the system. Therefore, adequacy assessment represents the static
conditions, where as security assessment pertains to the dynamic conditions of the power
system.
Utilities, in a venture to supply power at an economic price with an adequate level
of reliability, often faces challenges to balance the high level of reliability at relatively
low cost, since these two aspects counters each other. Direct evaluation of reliability
worth is a difficult task, therefore, a practical alternative, which is being widely used is to
evaluate the impacts and monetary losses incurred by customers due to power failures.
When an interruption is experienced by a customer, there is an amount of money that the
customer is willing to pay to evade the interruption and this amount is referred to as the
‘customer cost of reliability’.
These costs include both tangible and intangible cost and also the opportunity
cost. As such, to maximize the reliability, utility should balance their reinforcement cost
for reliability improvement and the customer cost for poor reliability. Therefore, the
optimal level of reliability is said to be achieved when the sum of utility cost and the
customer cost is at minimum.
11
Page 12
CHAPTER 3
DISTRIBUTED GENERATION
3.1 INTRODUCTION
DG is not a new concept. A number of utility consumers have been using DG for
decades. Over the last 10 years, the DG market has been somewhat turbulent. In the late
1990s, new regulations/subsidies, such as net metering and renewable portfolio
requirements, and the development of new DG technologies, have sparked broader
interests in distributed generation. DG is power generation built near consumers. DG
sources include small-scale, environmentally-friendly technologies (e.g., photovoltaic and
wind) installed on and designed primarily to serve a single end user’s site. But when
reliability and power quality issues are critical, DG most often includes more traditional
fossil fuel fired reciprocating engines or gas turbines.
The limited generation in the power sector has continually been exacerbated by
load growth, power demand, limitations in the ability to site new transmission lines,
limitations in the ability to construct large scale generation due to increased
environmental regulation, and lack of technology development to meet the new
requirements. Manpower is required to achieve the development of a sustainable,
secured, and economically-viable society and infrastructure. The growth in developed
and developing countries has created an energy divide in terms of wealth. The major
disparities of energy consumption per capita are reflected in developing countries. The
universal electrification challenge to meet the world’s population growth in order to
attain its current per capita electricity consumption will require massive increases in
electricity generation capacities.
Electric energy is produced and delivered practically on real time and there is no
convenient method to readily store it. This makes necessary to maintain a continuous and
almost instantaneous balance between production and consumption of electricity in
power systems. A way to ensure energy balance is by keeping some margin of generation
above the expected demand load, so the system can deal with unexpected mismatches
between supply and demand leading to power shortages. Generation margins are attained
12
Page 13
by providing stand-by plant capacity and they represent reservesof generation capacity
that can be rapidly utilized in case of a supply shortage.
Utilities have traditionally determined reserve requirements using working rules
and more recently probabilistic techniques. They estimate a reasonable amount of
capacity to be reserved and kept available, so that credible contingencies will not cause a
failure of supply. Nevertheless, even when analytical methods are used, a final decision
regarding reserve levels depends on the operator’s judgment of what is the acceptable
risk of system failure. In fact, although it is not always made explicit, this decision is a
trade-off between the additional reliability offered to customers and the cost of keeping
the reserves available.
In some cases, properly planned and operated DG can provide consumers, as well
as society, with a wide variety of benefits. These include economic savings because of
government subsidies and improved environmental performance. Many utilities have
installed DG on their systems and support federal funding of research to develop new
technologies.
The interconnection of DG with the electric grid continues to pose genuine safety
and reliability risks for the utility. DG could reduce the demand for traditional utility
services. DG also poses an economic risk to incumbent utilities and their consumers
unless appropriate rate structures or cost recovery mechanisms are put into place.
Though a small scale power plant, DG is environmentally friendly due to its
“friendly” technologies. These “friendly” technologies include: photovoltaic’s (PV), fuel
cells, small wind turbines, or more conventional technologies such as: micro turbines and
reciprocating engines that are fueled by renewable fuels, for instance, landfill gas. DG
encompasses generation built near to a consumer’s load despite size or energy source.
The latter definition could include diesel-fired generators with significant emissions.
Other definitions of DG include some or all of the following:
• Any qualifying facilities under the Public Utility Regulatory Policies Act of 1978
(PURPA);
• Any generation interconnected with distribution facilities;
• Commercial emergency and standby diesel generators installed, (i.e., hospitals
and hotels);
13
Page 14
• Residential standby generators sold at hardware stores;
• Generators installed by utility at a substation for voltage support or other
reliability purposes;
• Any on-site generation with less than “X” kW or MW of capacity. “X” ranges
everywhere from 10 kW to 50 MW;
• Generation facilities located at or near a load center;
• Demand side management (DSM), energy efficiency, and other tools for reducing
energy usage on the consumer’s side of the meter. The alternative to this
definition would be to abandon the term “distributed generation” completely and
use instead “distributed resources” (DR) or “distributed energy resources (DER)”.
3.2TYPES OF DISTRIBUTED GENERATION
DG can be classified into two major groups, inverter based DG and rotating
machine DG. Normally, inverters are used in DG systems after the generation process,
as the generated voltage may be in DC or AC form, but it is required to be changed to
the nominal voltage and frequency. Therefore, it has to be converted first to DC and then
back to AC with the nominal parameters through the rectifier. In this chapter, some of
the DG technologies, which are available at the present: photovoltaic systems, wind
turbines, fuel cells, micro turbines, synchronous and induction generators are introduced.
3.2.1 Photovoltaic Systems
A photovoltaic system, converts the light received from the sun into electric
energy. In this system, semiconductive materials are used in the construction of solar
cells, which transform the self contained energy of photons into electricity, when they
are exposed to sun light. The cells are placed in an array that is either fixed or moving to
keep tracking the sun in order to generate the maximum power.
These systems are environmental friendly without any kind of emission, easy to
use, with simple designs and it does not require any other fuel than solar light. On the
other hand, they need large spaces and the initial cost is high.
14
Page 15
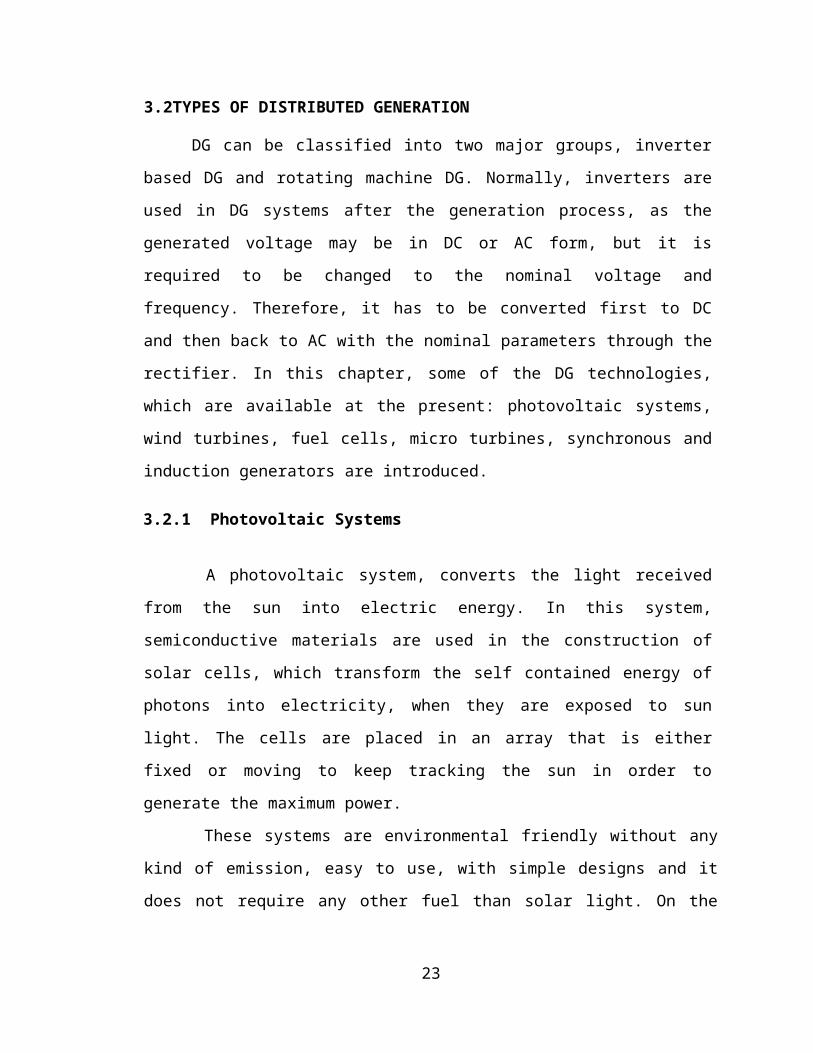
In Fig. 3.2.1 a photovoltaic panel is shown.
Fig. 3.2.1 Schematic diagram of a photovoltaic system
PV systems generate DC voltage then transferred to AC with the aid of inverters. There
are two general designs that are typically used: with and without battery storages.
3.2.2 Wind Turbines
Wind turbines transform wind energy into electricity. The wind is a highly variable
source, which cannot be stored, thus, it must be handled according to this characteristic.
A general scheme of a wind turbine is shown in Fig. 2.2, where its main components are
presented.
15
Page 16
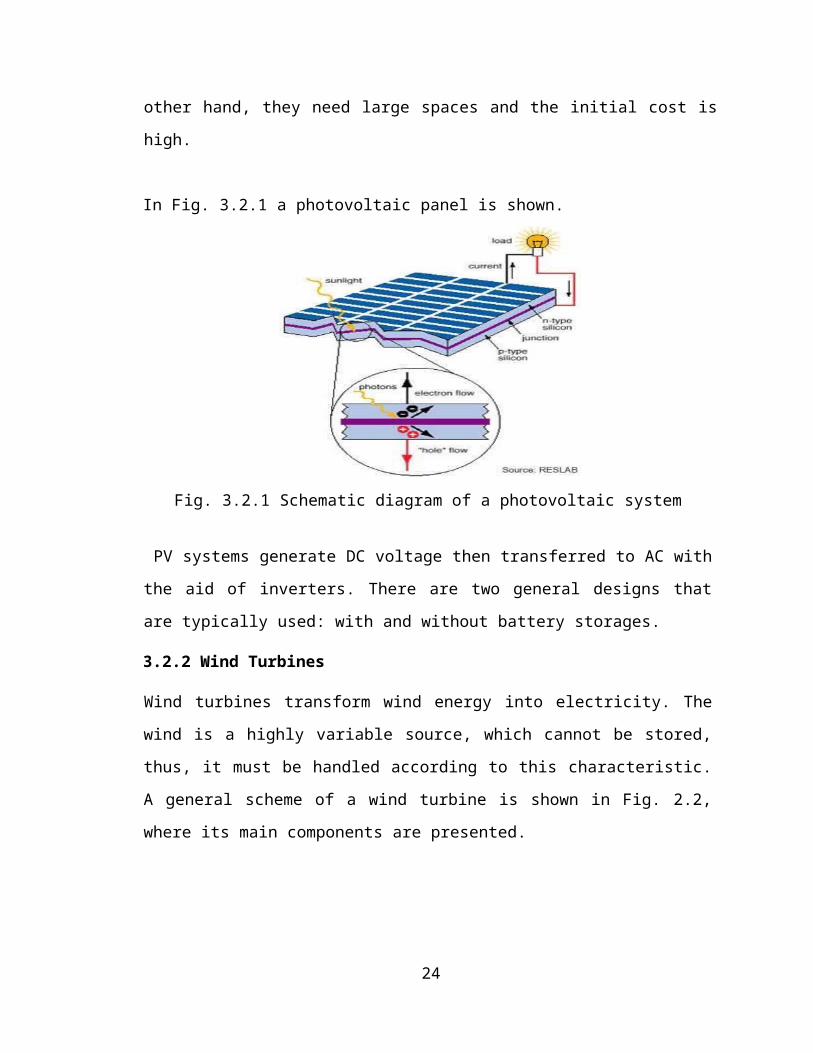
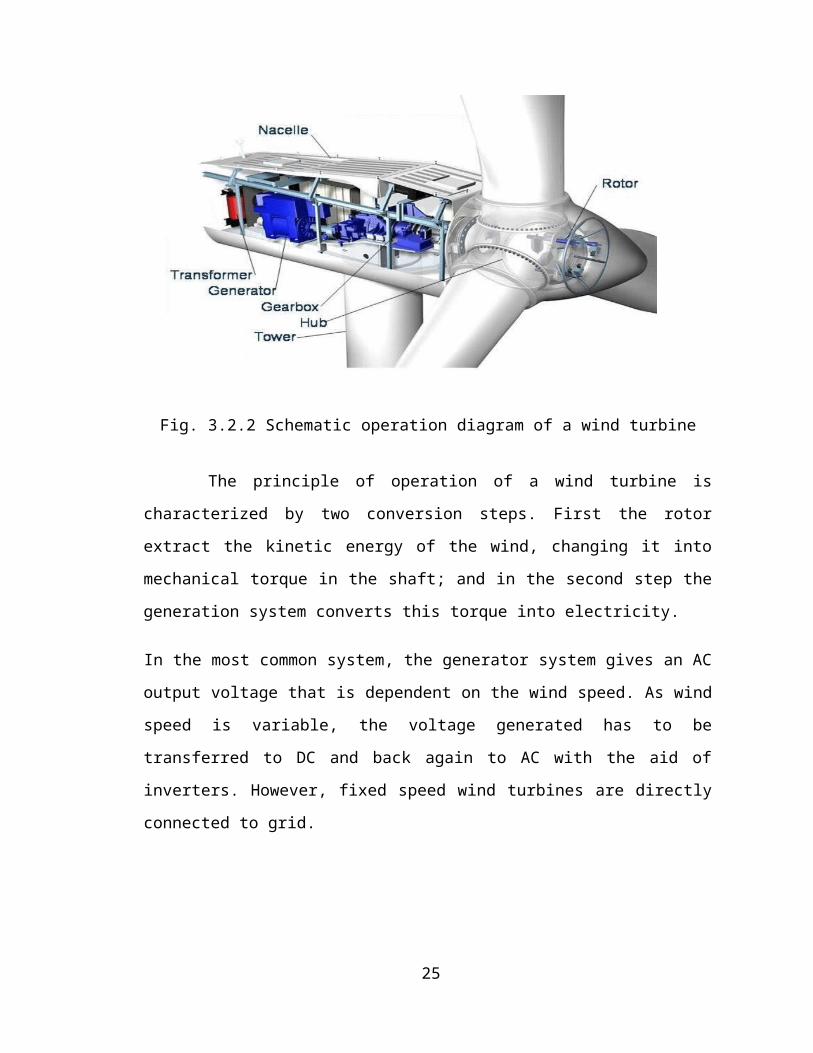
Fig. 3.2.2 Schematic operation diagram of a wind turbine
The principle of operation of a wind turbine is characterized by two conversion
steps. First the rotor extract the kinetic energy of the wind, changing it into mechanical
torque in the shaft; and in the second step the generation system converts this torque into
electricity.
In the most common system, the generator system gives an AC output voltage that is
dependent on the wind speed. As wind speed is variable, the voltage generated has to be
transferred to DC and back again to AC with the aid of inverters. However, fixed speed
wind turbines are directly connected to grid.
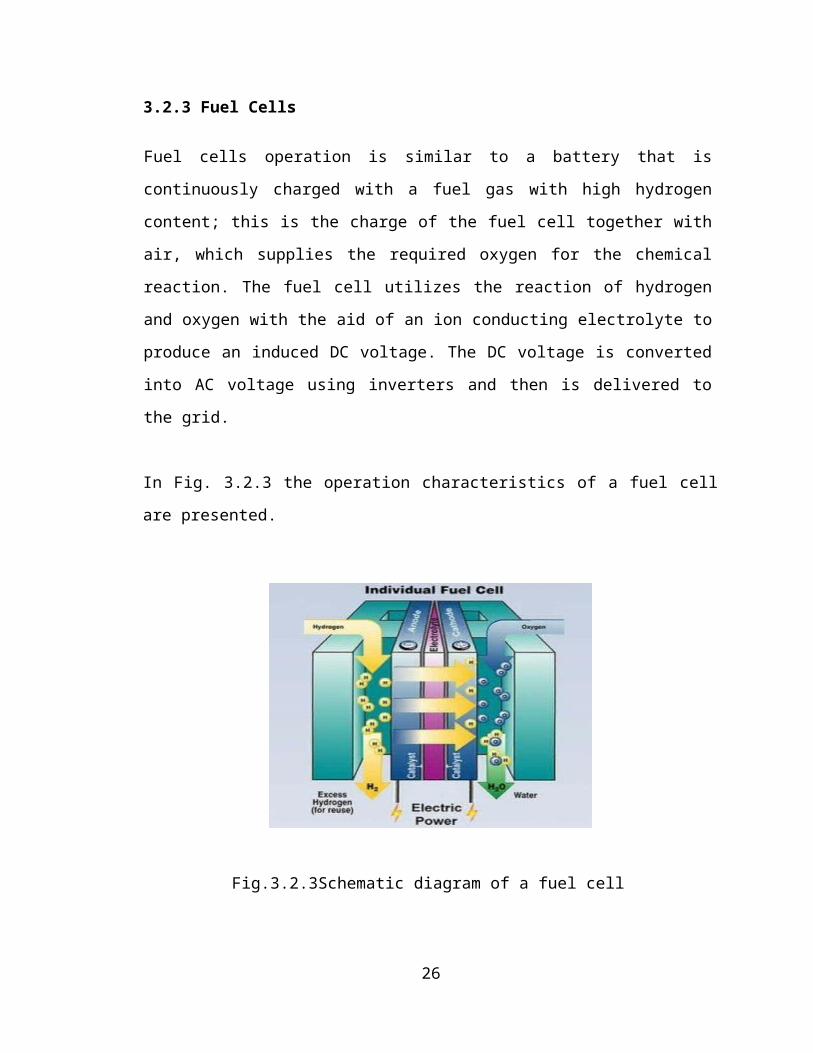
3.2.3 Fuel Cells
Fuel cells operation is similar to a battery that is continuously charged with a fuel gas
with high hydrogen content; this is the charge of the fuel cell together with air, which
supplies the required oxygen for the chemical reaction. The fuel cell utilizes the reaction
of hydrogen and oxygen with the aid of an ion conducting electrolyte to produce an
induced DC voltage. The DC voltage is converted into AC voltage using inverters and
then is delivered to the grid.
16
Page 17
In Fig. 3.2.3 the operation characteristics of a fuel cell are presented.
Fig.3.2.3Schematic diagram of a fuel cell
A fuel cell also produces heat and water along with electricity but it has a high running
cost, which is its major disadvantage. The main advantage of a fuel cell is that there are
no moving parts, which increase the reliability of this technology and no noise is
generated. Moreover, they can be operated with a width spectrum of fossil fuels with
higher efficiency than any other generation device. On the other hand, it is necessary to
assess the impact of the pollution emissions and ageing of the electrolyte characteristics,
as well as its effect in the efficiency and life time of the cell.
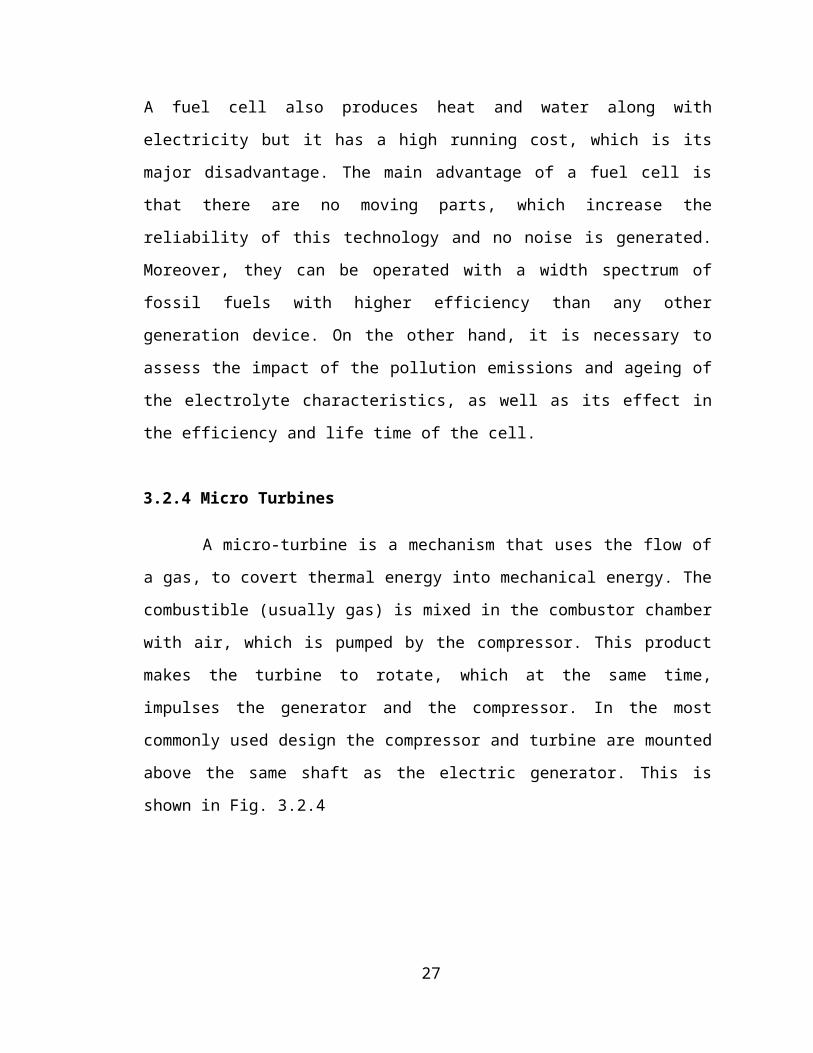
3.2.4 Micro Turbines
A micro-turbine is a mechanism that uses the flow of a gas, to covert thermal
energy into mechanical energy. The combustible (usually gas) is mixed in the combustor
chamber with air, which is pumped by the compressor. This product makes the turbine
to rotate, which at the same time, impulses the generator and the compressor. In the most
commonly used design the compressor and turbine are mounted above the same shaft as
the electric generator. This is shown in Fig. 3.2.4
17
Page 18
Fig 3.2.4 Schematic diagram of a micro-turbine
The output voltage from micro-turbines cannot be connected directly to the power grid
or utility, it has to be transferred to DC and then converted back to AC in order to have
the nominal voltage and frequency of the utility. The main advantage of micro-turbines
is the clean operation with low emissions produced and good efficiency. On the other
hand, its disadvantages are the high maintenance cost and the lack of experience in this
field. Very little micro-turbines have been operated for enough time periods to establish
a reliable field database. Furthermore, methods of control and dispatch for a large
number of micro turbines and selling the remaining energy have not been developed yet.
3.3 Impact of Distributed Generation on Power System Grids
The introduction of DG in systems originally radial and designed to operate without any
generation on the distribution system, can significantly impact the power flow and
voltage conditions at both, customers and utility equipment.
These impacts can be manifested as having positive or negative influence, depending on
the DG features and distribution system operation characteristics.
The objective of this thesis, is to investigate the technical impact that the
integration of DG have on the protection coordination of distributed power systems. A
18
Page 19
method to asses this impact, is based on investigate the behaviour of an electric system,
with and without the presence of DG. The difference between the results obtained in
these two operating conditions, gives important information for both, companies in the
electric sector and customers. In that sense, a general view of the main problems
encountered in the integration of DG to the distributed network is presented.
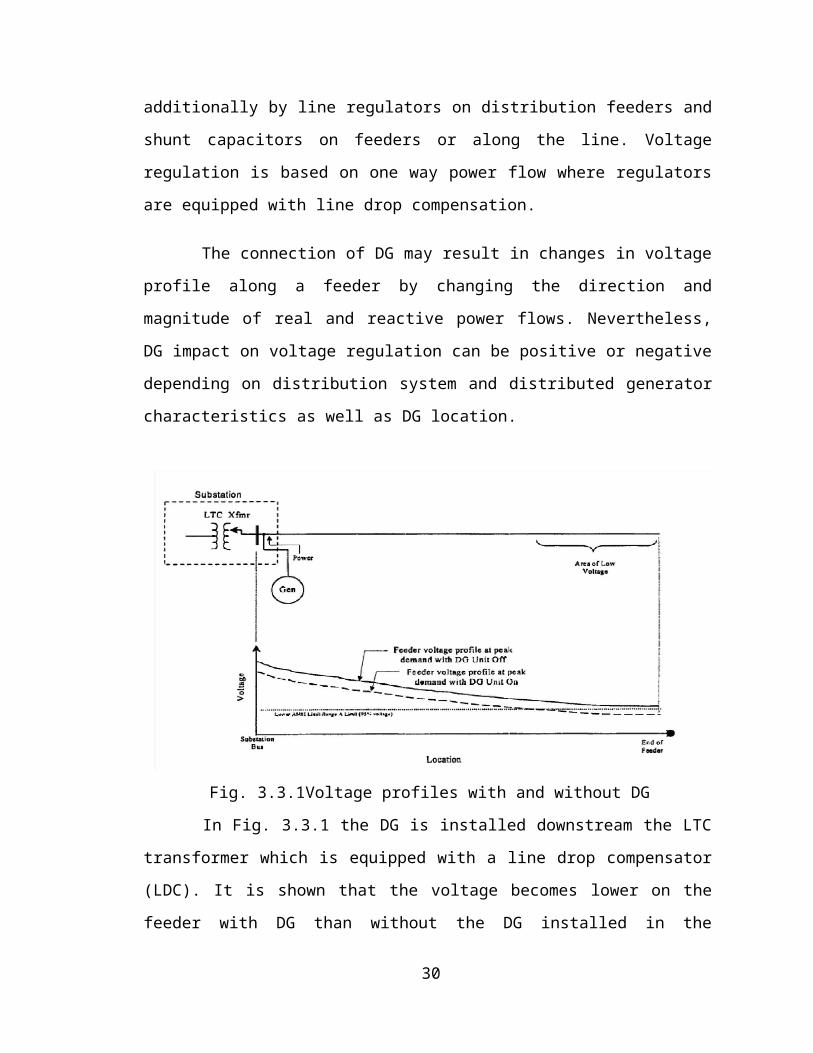
3.3.1 Impact of DG on Voltage Regulation
Radial distribution systems regulate the voltage by the aid of load tap changing
transformers (LTC) at substations, additionally by line regulators on distribution feeders
and shunt capacitors on feeders or along the line. Voltage regulation is based on one way
power flow where regulators are equipped with line drop compensation.
The connection of DG may result in changes in voltage profile along a feeder by
changing the direction and magnitude of real and reactive power flows. Nevertheless,
DG impact on voltage regulation can be positive or negative depending on distribution
system and distributed generator characteristics as well as DG location.
Fig. 3.3.1Voltage profiles with and without DG
In Fig. 3.3.1 the DG is installed downstream the LTC transformer which is
equipped with a line drop compensator (LDC). It is shown that the voltage becomes
19
Page 20
lower on the feeder with DG than without the DG installed in the network. The voltage
regulator will be deceived, setting a voltage lower than is required for sufficient service.
The DG reduces the load observed from the load compensation control side, which
makes the regulator to set less voltage at the end of the feeder. This phenomenon has the
opposite effect to which is expected with the introduction of DG (voltage support).
There are two possible solutions facing this problem: the first solution is to
move the DG unit to the upstream side of the regulator, while the second solution is
adding regulator controls to compensate for the DG output.
The installation of DG units along the power distribution feeders may cause
overvoltage due to too much injection of active and reactive power. For instance, a small
DG system sharing a common distribution transformer with several loads may raise the
voltage on the secondary side, which is sufficient to cause high voltage at these
customers. This can happen if the location of the distribution transformer is at a point on
the feeder where the primary voltage is near or above the fixed limits; for instance:
ANSI (American National Standards Institute) upper limit 126+ volts on a 120 volt base.
During normal operation conditions, without DG, voltage received at the load terminals
is lower than the voltage at the primary of the transformer. The connection of DG can
cause a reverse power flow, maybe even raising the voltage somewhat, and the voltage
received at the customer´s site could be higher than on the primary side of the
distribution transformer.
For any small scale DG unit (< 10MW) the impact on the feeder primary is
negligible. Nonetheless, if the aggregate capacity increases until critical thresholds, then
voltage regulation analysis is necessary to make sure that the feeder voltage will be fixed
within suitable limits.
3.3.2 Impact of DG on Losses
One of the major impacts of Distributed generation is on the losses in a feeder. Locating
the DG units is an important criterion that has to be analyzed to be able to achieve a
better reliability of the system with reduced losses.
20
Page 21
According to, locating DG units to minimize losses is similar to locating
capacitor banks to reduce losses. The main difference between both situations is that DG
may contribute with active power and reactive power (P and Q). On the other hand,
capacitor banks only contribute with reactive power flow (Q). Mainly, generators in the
system operate with a power factor range between 0.85 lagging and unity, but the
presence of inverters and synchronous generators provides a contribution to reactive
power compensation (leading current).
The optimum location of DG can be obtained using load flow analysis software,
which is able to investigate the suitable location of DG within the system in order to
reduce the losses. For instance: if feeders have high losses, adding a number of small
capacity DGs will show an important positive effect on the losses and have a great
benefit to the system. On the other hand, if larger units are added, they must be installed
considering the feeder capacity boundaries. For example: the feeder capacity may be
limited as overhead lines and cables have thermal characteristic that cannot be exceed.
Most DG units are owned by the customers. The grid operators cannot decide
the locations of the DG units. Normally, it is assumed that losses decrease when
generation takes place closer to the load site. However, as it was mentioned, local
increase in power flow in low voltage cables may have undesired consequences due to
thermal characteristics.
3.3.3 Impact of DG on Harmonics
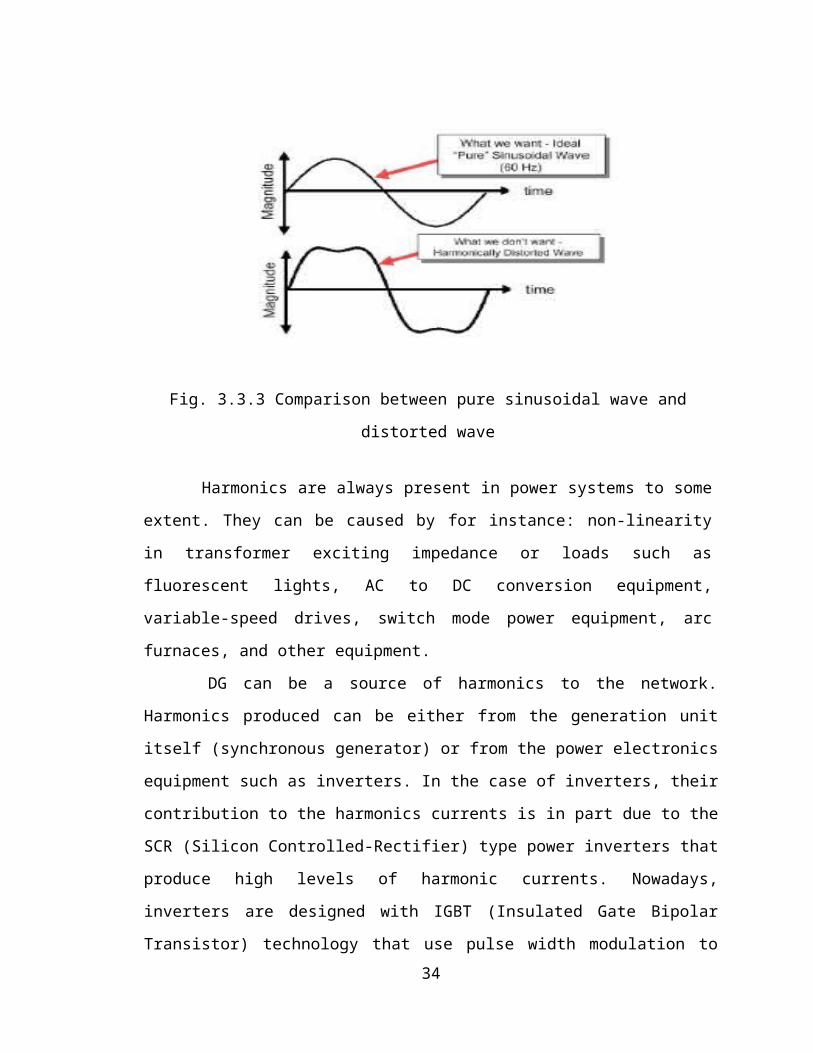
A wave that does not follow a “pure” sinusoidal wave is regarded as
harmonically distorted. This is shown in Fig.3.3.3
21
Page 22
Fig. 3.3.3 Comparison between pure sinusoidal wave and distorted wave
Harmonics are always present in power systems to some extent. They can be
caused by for instance: non-linearity in transformer exciting impedance or loads such as
fluorescent lights, AC to DC conversion equipment, variable-speed drives, switch mode
power equipment, arc furnaces, and other equipment.
DG can be a source of harmonics to the network. Harmonics produced can be
either from the generation unit itself (synchronous generator) or from the power
electronics equipment such as inverters. In the case of inverters, their contribution to the
harmonics currents is in part due to the SCR (Silicon Controlled-Rectifier) type power
inverters that produce high levels of harmonic currents. Nowadays, inverters are designed
with IGBT (Insulated Gate Bipolar Transistor) technology that use pulse width
modulation to generate the injected “pure” sinusoidal wave. This new technology
produces a cleaner output with fewer harmonic that should satisfy the IEEE 1547-2003
standards.
Rotating generators are another source of harmonics, that depends on the design
of the generators winding (pitch of the coils), core non-linearity's, grounding and other
factors that may result in significant harmonics propagation.
When comparing different synchronous generator pitches the best configuration
encountered is with a winding pitch of 2/3 as they are the least third harmonic producers.
Third harmonic is additive in the neutral and is often the most prevalent. On the other
hand, 2/3 winding pitch generators have lower impedance and may cause more harmonic
22
Page 23
currents to flow from other sources connected in parallel with it. Thus, grounding
arrangement of the generator and step-up transformer will have main impact on limiting
the feeder penetration of harmonics. Grounding schemes can be chosen to remove or
decrease third harmonic injection to the utility system. This would tend to confine it to
the DG site only.
Normally, comparing harmonic contribution from DG with the other impacts
that DG may have on the power system, it is concluded that they are not as much of a
problem. However, in some instants problems may arise and levels can exceed the
IEEE-519 standard (these levels are shown in table 2.1). These problems are usually
caused by resonance with capacitor banks, or problems with equipment that are sensitive
to harmonics. In the worst case, equipment at the DG may need to be disconnected as a
consequence of the extra heating caused by the harmonics.
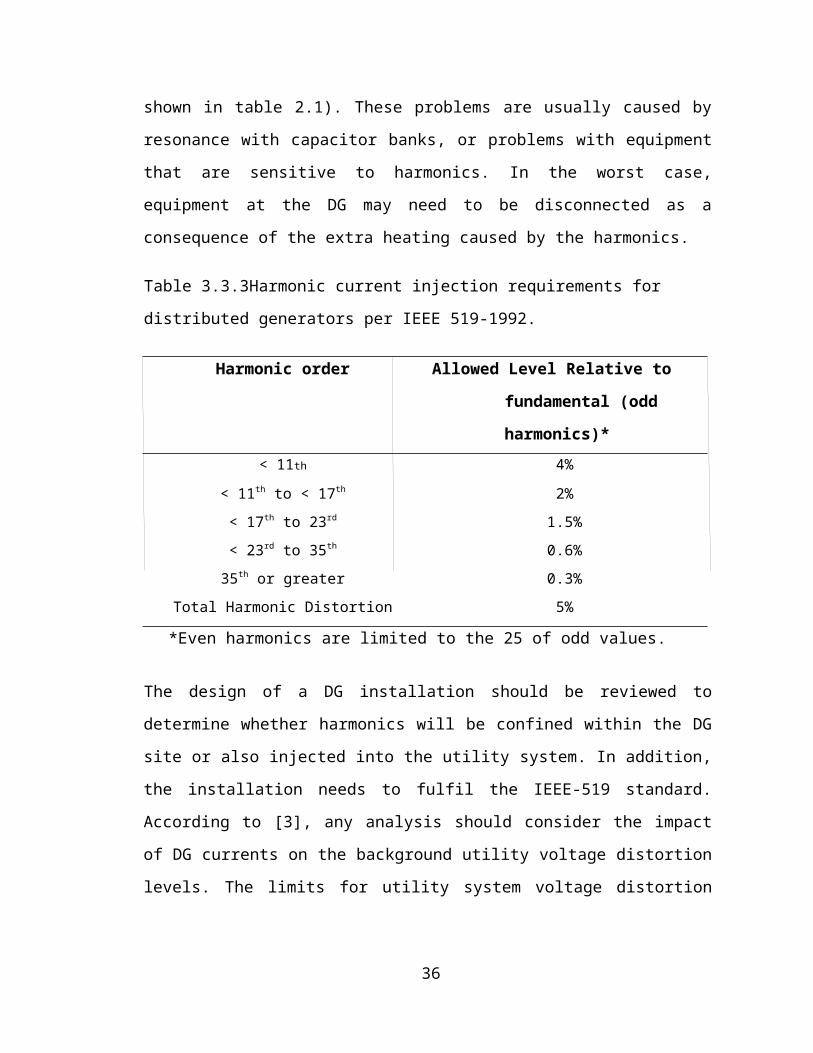
Table 3.3.3Harmonic current injection requirements for distributed generators per IEEE
519-1992.
Harmonic order Allowed Level Relative to fundamental
(odd harmonics)*
< 11th 4%
< 11th to < 17th 2%
< 17th to 23rd 1.5%
< 23rd to 35th 0.6%
35th or greater 0.3%
Total Harmonic Distortion 5%
*Even harmonics are limited to the 25 of odd values.
The design of a DG installation should be reviewed to determine whether harmonics will
be confined within the DG site or also injected into the utility system. In addition, the
installation needs to fulfil the IEEE-519 standard. According to [3], any analysis should
consider the impact of DG currents on the background utility voltage distortion levels.
The limits for utility system voltage distortion are 5%for THD (total harmonic
distortion) and 3%for any individual harmonic.
23
Page 24
3.3.4 Impact of DG on Short Circuit Levels of the Network
The presence of DG in a network affects the short circuit levels of the network. It creates
an increase in the fault currents when compared to normal conditions at which no DG is
installed in the network. The fault contribution from a single small DG is not large, but
even so, it will be an increase in the fault current. In the case of many small units, or few
large units, the short circuits levels can be altered enough to cause miss coordination
between protective devices, like fuses or relays.
The influence of DG to faults depends on some factors such as the generating
size of the DG, the distance of the DG from the fault location and the type of DG. This
could affect the reliability and safety of the distribution system.
In the case of one small DG embedded in the system, it will have little effect on
the increase of the level of short circuit currents. On the other hand, if many small units
or a few large units are installed in the system, they can alter the short circuit levels
sufficient to cause fuse-breaker miss-coordination. This could affect the reliability and
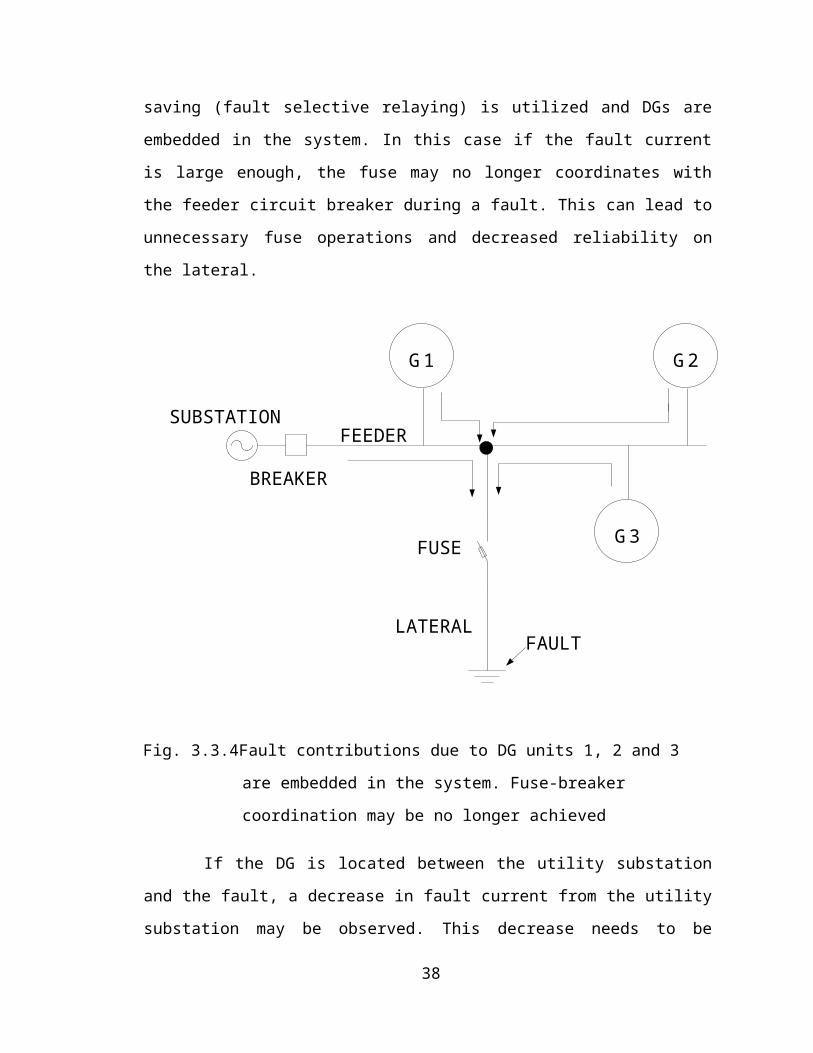
safety of the distribution system. Figure 3.3.4 shows a typical fused lateral on a feeder
where fuse saving (fault selective relaying) is utilized and DGs are embedded in the
system. In this case if the fault current is large enough, the fuse may no longer
coordinates with the feeder circuit breaker during a fault. This can lead to unnecessary
fuse operations and decreased reliability on the lateral.
24
Page 25
G2G1
G3
SUBSTATION
BREAKER
FUSE
FAULT
FEEDER
LATERAL
Fig. 3.3.4Fault contributions due to DG units 1, 2 and 3 are embedded in the system.
Fuse-breaker coordination may be no longer achieved
If the DG is located between the utility substation and the fault, a decrease in
fault current from the utility substation may be observed. This decrease needs to be
investigated for minimum tripping or coordination problems. On the other hand, if the
DG source (or combined DG sources) is strong compared to the utility substation source,
it may have a significant impact on the fault current coming from the utility substation.
This may cause fail to trip, sequential tripping, or coordination problems.
The nature of the DG also affects the short circuit levels. The highest
contributing DG to faults is the synchronous generator. During the first few cycles its
contribution is equal to the induction generator and self excited synchronous generator,
while after the first few cycles the synchronous generator is the most fault current
contributing DG type. The DG type that contributes the least amount of fault current is
the inverter interfaced DG type, in some inverter types the fault contribution lasts for
less than one cycle. Even though a few cycles are a short time, it may be long enough to
impact fuse breaker coordination and breaker duties in some cases.
25
Page 26
3.4 BENEFITS AND DRAWBACKS
An overview of some common benefits and drawbacks of the DG are presented below:
1) Benefits
• Connection of DG is intended to increase the reliability of power supply
provided to the customers, using local sources, and if possible, reduce the losses
of the transmission and distribution systems.
• The connection of DG to the power system could improve the voltage profile,
power quality and support voltage stability. Therefore, the system can withstand
higher loading situations.
• The installation of DG takes less time and payback period. Many countries are
subsidizing the development of renewable energy projects through a portfolio
obligation and green power certificates. This incentives investment in small
generation plants.
• Some DG technologies have low pollution and good overall efficiencies like
combined heat and power (CHP) and micro-turbines. Besides, renewable energy
based DG like photovoltaic and wind turbines contribute to the reduction of
greenhouse gases.
2) Drawbacks
• Many DG are connected to the grid via power converters, which injects
harmonics into the system.
• The connection of DG might cause over-voltage, fluctuation and unbalance of
the system voltage if coordination with the utility supply is not properly
achieved.
• Depending on the network configuration, the penetration level and the nature of
the DG technology, the power injection of DG may increase the power losses in
the distribution system.
• Short circuit levels are changed when a DG is connected to the network.
Therefore, relay settings should be changed and if there is a disconnection of
DG, relay should be changed back to its previous state.
26
Page 27
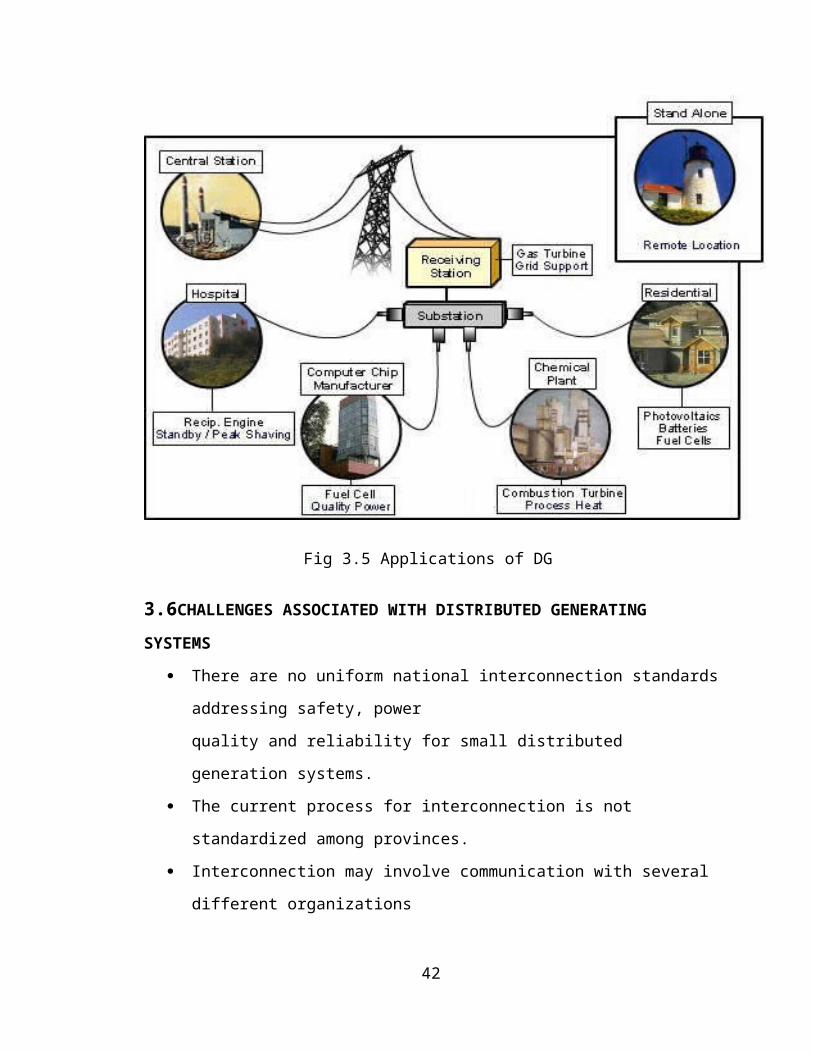
3.5 APPLICATONS OF DISTRIBUTED GENERATION
DG technologies can meet the needs of a wide range of users, with applications in
the residential, commercial, and industrial sectors. Decision makers at all levels need to
be aware of the potential benefits DG can offer. In some instances, DG technologies can
be more cost effective than conventional solutions. Among other things, DG can be used
by utilities to both enhance existing systems and to delay the purchase of transmission
and distribution equipment. In addition, DG units can help meet the changing demands of
end users for premium, reliable or“green” power.
Currently, DG is being utilized most often in a continuous power capacity for
industrialapplications such as food manufacturing, plastics, rubber, metals and chemical
production. Commercial sector usage, while a fraction of total industrial usage, includes
sectors such as grocery stores and hospitals.
Fig 3.5 Applications of DG
27
Page 28
3.6CHALLENGES ASSOCIATED WITH DISTRIBUTED GENERATING
SYSTEMS
There are no uniform national interconnection standards addressing safety, power
quality and reliability for small distributed generation systems.
The current process for interconnection is not standardized among provinces.
Interconnection may involve communication with several different organizations
The environmental regulations and permit process that have been developed for
larger distributed generation projects make some DG projects uneconomical.
Contractual barriers exist such as liability insurance requirements, fees and
charges, and extensive paperwork.
28
Page 29
CHAPTER 4
MEASURING RELIABILITY
Along with the variety of definitions of reliability come a variety of ways to
measure it. A metric for reliability is required for assessment of past performance,
consideration of reliability in design, and setting of reliability goals. Many indices have
been defined as measures of reliability. They measure different aspects of reliability or
combinations of different aspects. Only a small number of these are common across
several utilities, and the ones that are commonly used are not always defined in the exact
same manner.
Reliability measures dealing with interruptions address three factors: frequency,
duration, and extent or severity. The extent is the number of customers or load affected,
which is determined by the layout of the distribution system Combining the two key
factors of frequency and duration into a single appropriate measure may not be possible,
so any one index may not be very valuable alone. When assessing reliability, all three
factors should be considered. Each reliability index may be important for a different
purpose. Different utilities use different sets of indices.
4.1 RELIABILITY INDICES
Reliability indices are statistical aggregations of reliability data for a well defined
set of loads, components or customers. Most reliability indices are average values of a
particular reliability characteristic for an entire system, operating region, substation
service territory, or feeder.
Comprehensive treatment is not practicable, but the following sections discuss the
most important reliability indices used around the world. The utility indices have
traditionally only included long duration interruption (usually defined as interruptions
longer than 5 minutes). A common way of defining reliability is in terms of customer and
load based indices.
29
Page 30
4.1.1 Customer Based Indices
The Utilities commonly use the following two reliability indices for frequency
and duration to quantify the performance of their systems.
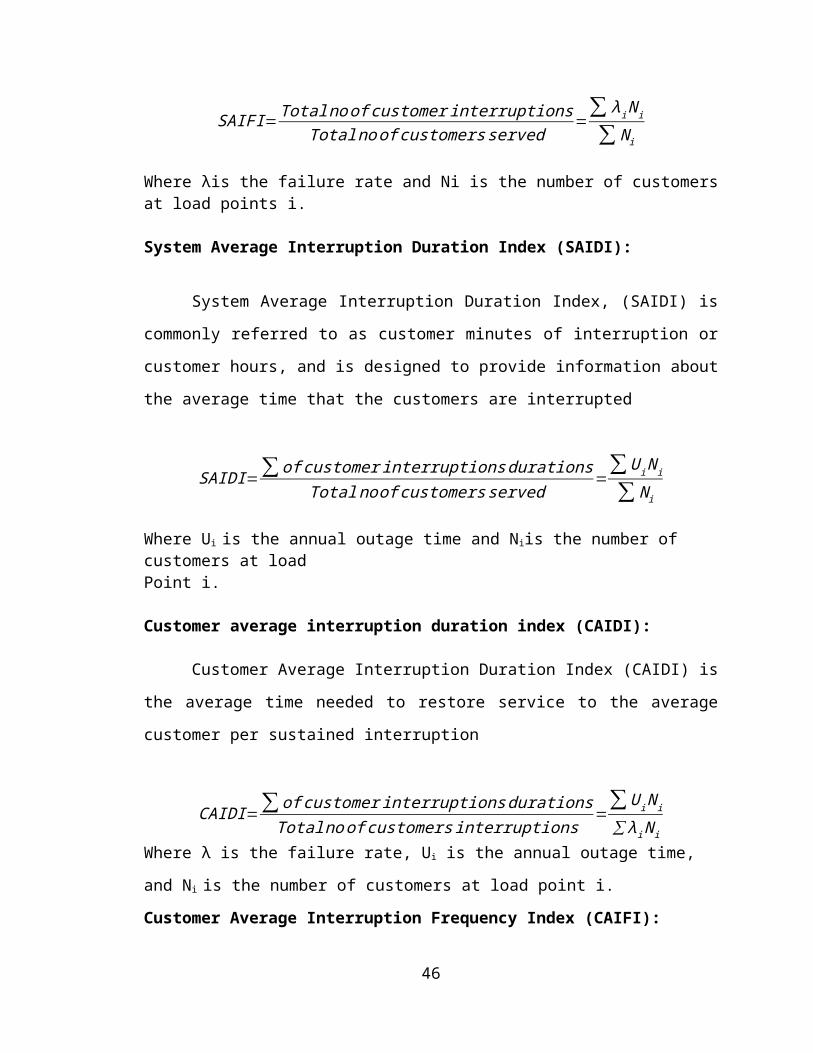
System Average Interruption Frequency Index (SAIFI):
System Average Interruption Frequency Index (SAIFI) is designed to give
information about the average frequency of sustained interruptions per customer over a
predefined area.
SAIFI=Total no of customer interruptionsTotalno of customers served
=∑ λi N i
∑ N i
Where λis the failure rate and Ni is the number of customers at load points i.
System Average Interruption Duration Index (SAIDI):
System Average Interruption Duration Index, (SAIDI) is commonly referred to as
customer minutes of interruption or customer hours, and is designed to provide
information about the average time that the customers are interrupted
SAIDI=∑ of customer interruptionsdurationsTotalno of customers served
=∑ U i N i
∑ N i
Where Ui is the annual outage time and Niis the number of customers at loadPoint i.
Customer average interruption duration index (CAIDI):
Customer Average Interruption Duration Index (CAIDI) is the average time
needed to restore service to the average customer per sustained interruption
CAIDI=∑ of customer interruptionsdurationsTotal no of customers interruptions
=∑ U i N i
∑ λ i N i
30
Page 31
Where λ is the failure rate, Ui is the annual outage time, and Ni is the number of
customers at load point i.
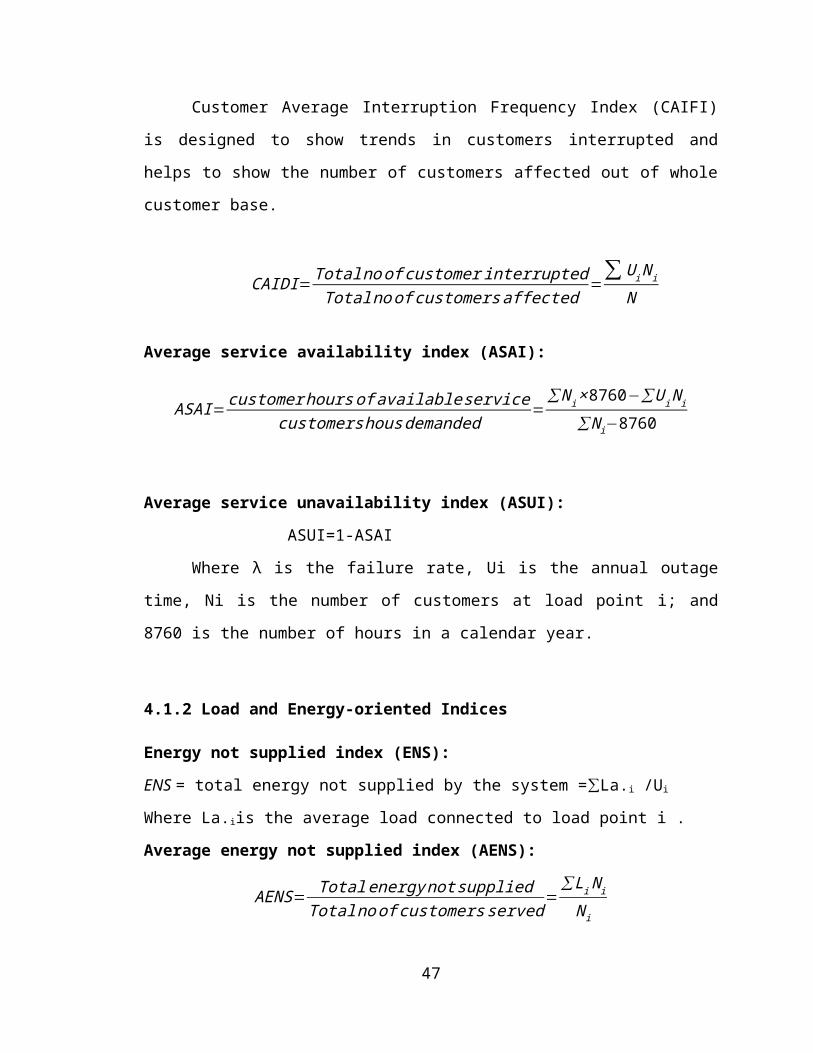
Customer Average Interruption Frequency Index (CAIFI):
Customer Average Interruption Frequency Index (CAIFI) is designed to show
trends in customers interrupted and helps to show the number of customers affected out
of whole customer base.
CAIDI=Total no of customer interruptedTotalno of customers affected
=∑ U i N i
N
Average service availability index (ASAI):
ASAI= customer hoursof available servicecustomers housdemanded
=∑ N i ×8760−∑U i N i
∑ N i−8760
Average service unavailability index (ASUI):
ASUI=1-ASAI
Where λ is the failure rate, Ui is the annual outage time, Ni is the number of
customers at load point i; and 8760 is the number of hours in a calendar year.
4.1.2 Load and Energy-oriented Indices
Energy not supplied index (ENS):
ENS = total energy not supplied by the system =∑La.i /Ui
Where La.iis the average load connected to load point i .
Average energy not supplied index (AENS):
AENS= Totalenergy not suppliedTotal no of customers served
=∑ Li N i
N i
Where Liis the average load connected to load point i .
31
Page 32
4.1.3 System Performance
The customer and load based indices described in section 4.1.1 and 4.1.2 are
useful for assessing the severity of system failures in future reliability prediction analysis.
They can be used, however, as a means of assessing the past performance of a system.
The assessment of system performance is a valuable procedure for three important
reasons
• It establishes the chronological changes in system performance and therefore helps to
identify weak areas and the need for the reinforcement.
• It establishes existing indices which serves as a guide for acceptable values in future
reliability assessments.
• It enables previous predictions to be compared with actual operating experience.
4.2 USE OF RELIABILITY INDICES
Comparisons across utilities such as the ones made in these programs must be
done with caution. Differing definitions of interruptions can affect the reliability-index
results. How different utilities treat momentary outages, scheduled outages, storms, and
other non-failure related interruptions must be considered. Given these concerns, utilities
may be reluctant to allow comparisons of their performance.
Most utilities use more than one reliability index. More than 80% of the surveyed utilities
maintained SAIDI records. SAIFI, CAIDI, and ASAI were also widely used. Although
the use of indices may have increased over the years, the indices used most commonly
have not changed.
4.3Potential problems with standard indices
Although the most commonly used indices do a reasonable job in tracking the
reliability performance of utilities, they have the potential of allocating spending
decisions that are not closely aligned with customer interests. This is true for utilities that
32
Page 33
are mature in their reliability improvement process. Once first round of investment is
made, traditional reliability measure may present complications.
The following describes the potential problem with the standard indices.
SAIDI and SAIFI– When making reliability investments, reductions in SAIDI and
SAIFI are proportional to the number of affected customers. This means projects that
affect many customers are preferred to those that affect few customers. However, feeders
with many customers typically have better than average reliability, and feeders with few
customers have worse than average reliability. Therefore, reliability investment based on
SAIFI and SAIDI can drive investments towards densely populated areas where
reliability is already satisfactory.
CAIDI – Although popular with many utilities and regulators, CAIDI is
problematic as measure of reliability. This is because, any view CAIDI as a measure of
operation efficiency; when utility responds more quickly after a fault, CAIDI will go
down. In fact, CAIDI is mathematically equal to SAIDI divided by SAIFI. That is
reliability could be improving in both frequency and duration, but CAIDI could be
increasing. Because of the above problem, the use of CAIDI is decreasing in today’s
world.
4.4 FACTORS AFFECTING RELIABILITY PERFORMANCE
Reliability performance varies dramatically from one system to another and this is
not necessarily an indication that one system has poor performance. Many factors
influence the expected reliability at a particular location or for an entire system.
Reliability indices that reflect reliability performance differ with data definitions
and data classifications. Most Utilities define separate indices for planned and unplanned
events. The interruption caused due to major event like storm, forest fire or a forced
majeure may or may not be considered in reliability performance. Transmission and
Distribution events are considered separately for reliability performance evaluation due to
data classes or nature of events.
The service territory of the utility determines the nature of the events that could be
expected which effect reliability performance. Geography of the service territory such as
thick forest, mountainous terrain, etc is likely to cause reliability issues. Weather is an
important factor that can seriously affect reliability levels. The effects of vegetation such
33
Page 34
as tree falls, branch intrusion and animal activity from birds, squirrels and pests causing
ground faults affect reliability levels. Maintenance practices such as tree trimming
programs and installation of animal guards could help achieve higher levels of reliability.
Hence, it is obvious to expect a different reliability levels at various locations.
34
Page 35
CHAPTER 5
DETAILS OF TEST SYSTEM
Introduction
Reliability evaluation techniques have been widely used in many industries such
as power, nuclear, airspace etc. Many techniques have been developed for different
applications. The basic function of an electric power system is to supply customers with
reasonably economical and reliable electricity.
To build an absolutely reliable power system is neither practically realizable nor
economically justifiable. The reliability of a power system can only be improved through
the increased investment in system equipment during either the planning phase or
operating phase. However, over-investment can lead to excessive operating costs, which
must be reflected in the tariff structure.
5.1 RBTS TEST SYSTEM
The application of the proposed technique to a multi-load point distribution system is
clarified using the distribution system shown in Fig 5.1.1
The test system is a real distribution network. The network has 16 load points and 2138
customers. The average fault location time and repair time for all sections are assumed to
be respectively 0.66 and 3 hours.
35
Page 36
Fig 5.1.1 RBTS test system
36
Page 37
Fig 5.1.2 Radial distribution system
Fig 5.1.3 Radial distribution system
37
Page 38
Table 5.1 shows the data associated with sections and load points. Average failure rate of
sections is assumed to be 1.49(failure/yr.km).
Section Number
Length(Km) Loadpoint number at end
node
Average Load at end node(KVA)
No. of Customer at
end node1 0.42 1 90 137
2 0.25 - - -
3 0.294 2 100.1 126
4 0.411 3 18.7 20
5 0.190 - - -
6 0.190 4 90 284
7 0.340 5 269.5 210
8 0.110 - - -
9 0.124 6 50.6 57
10 0.030 7 87.6 135
11 0.124 8 90 172
12 0.200 9 85 170
13 0.140 10 200 190
14 0.104 11 51.04 56
15 0.167 12 26.4 38
16 0.189 - - -
17 0.033 16 45.1 49
18 0.138 13 16.5 10
19 0.481 - - -
20 0.200 14 374 280
21 0.290 15 90 204
Table 5.1 Data associated with sections and load points
38
Page 39
In this network there are five locations for possible installation of DG units that is shown
in Figure 5.1.1 (these points are defined by the utility considering various factors)
The purpose is to determine the best location and optimum number of DG units in order
to maintain the predefined reliability level. The capacity of each DG unit is assumed to be
650 KVA.
39
Page 40
CHAPTER 6
EXPERIMENTAL RESULTS
INTRODUCTION:
This chapter presents final results tested on RBTS test system. Average values of
load point and system indices are calculated and presented. Even the probability
distributions of various reliability indices are presented.
6.1 RESULTS
A computer program has been developed to perform necessary computations.
This program first computes failure rate( λ ),restoration time(r), and annual outage
time(u) for each load point then calculate system indices such as SAIFI, SAIDI, CAIDI
and AENS as described before. Three different case studies are considered. For each case
it is assumed that 0, 1, 2, 3, or 4 DG units can be established in each location and then
system indices are calculated.
With Location 1 and availability 0.95
No. of DG’s SAIFI SAIDI CAIDI AENS
0 6.5932 23.0272 3.6599 19.79
1 6.5932 19.875 3.457 17.943
2 6.5932 19.763 3.013 15.993
3 6.5932 17.89 2.763 13.987
4 6.5932 17.54 2.694 13.854
Table 6.1.1 Results with Location 1 and availability 0.95
With Location 1 and availability 0.8
No. of DG’s SAIFI SAIDI CAIDI AENS
1 6.5932 23.95 3.412 18.12
2 6.5932 20.02 3.027 15.95
3 6.5932 18.54 2.843 13.98
4 6.5932 17.32 13.98 13.82
Table 6.1.2 Results with Location 1 and availability 0.8
40
Page 41
With Location 2 and availability of 0.95
No. of DG’s SAIFI SAIDI CAIDI AENS
0 6.5932 23.0272 3.6599 19.79
1 6.5932 23.002 3.423 18.12
2 6.5932 19.724 2.997 15.987
3 6.5932 2.997 2.639 13.83
4 6.5932 15.987 2.598 13.72
Table 6.1.3 Results with Location 2 and availability 0.95
Because DG units are assumed as standby units they only affect on outage time and
doesn’t affect on interruption frequency, hence SAIFI will be constant in each case and is
equal to 6.5932 (int/cust.yr).
6.2 DISCUSSION OF RESULTS
The comparison between the results obtained for the different case studies indicates
that the load point failure rates are not affected by the availability of one or two DG units in
the studied system. The load point failure rates are dependent only on the main feeder and
laterals failure states and durations. In addition, the two system indices which are based on
the load points failure rate namely, system average interruption frequency index SAIFI and
average service availability index ASAI remained the same for the three case studied. The
main contribution of the DG to the system reliability is the improvement in both the system
average interruption duration index (SAIDI) and the customer average interruption duration
index (CAIDI). Although the frequency of interruption of the system is the same for all cases,
the duration of these interruptions become shorter as the number of DG units in the system
increases. Both the customers and the utilities are benefiting from this improvement in the
duration of interruptions.
41
Page 42
CONCLUSION
This project proposed an analytical approach to study the DG impacts on
distribution system reliability indices. The method assumes DG units as backup
generation and considers availability and unavailability of DG units. The method is then
applied to a real distribution network and system indices such as SAIFI, SAIDI, CAIDI
and AENS has been computed for 3 cases with the developed computer program. The
results show when DG units are applied as standby units, only affect on outage duration
and don’t affect on interruption frequency so SAIFI will be constant. In addition, the
results show that indices are too sensitive to location, number and availability of DG
units. Hence, the optimum number of DG units for the best location in distribution system
can be obtained using the proposed method.
The analysis of the studied system has proven that the presence of DG is enhancing
the system reliability. This improvement in the system reliability is reflected on the duration
of interruptions per customer per year and the duration of system interruptions per year.
By comparing the results obtained with location1 and location 2 the optimal location
is location 1 because the reliability indices at location 1 are lower compared to location 2.So
the optimal location for placement of DG is location 1.
42
Page 43
FUTURE SCOPE
Reliability assessment has become important for utility planners in recent years.
Improved service reliability might be motivated by government regulation or by market
competition, but providing superior service at an attractive price is in the interest of both
utilities and customers.
At present the electric power utilities are not much reliable leading to the increase
in the cost of interruptions and power outages effecting economically on the utility and its
customers.
In the near future,these deregulated power utilities must be restructured and
operated as distinct generation, transmission and distribution. This can be achieved by
combining conventional based generation units with the distributed generation units. The
responsibility of maintaining the reliability of the overall power system must and should
be shared by all the involving companies instead of by a single electric utility which leads
to the decrease in the power outages and interruption cost and increases the reliability of
the system.
43
Page 44
REFERENCES
1. R.E. Brown and S. Gupta and R. D. Christie and S. S. VenkataandR. Fletcher
“Distribution System Reliability Assessment UsingHierarchical Markov
Modeling” IEEE Transactions on PowerDelivery, Vol. 11, No. 4, October 1996
2. A. Chowdhury and D. O. Koval, “Generation reliability impacts of Industry-
owned distributed generation sources,” in IndustryApplications Conference, vol.
2, Oct. 2003, pp. 1321–1327.
3. Ackermann,T.; Andersson,G.; Soder, L.; "Distributed Generation: A Definition”,
Electric Power Systems Research, Vol 57, 2001, pp195– 204.
4. P. A. Daly and J. Morrison, “Understanding the potential benefits of distributed
Generation on power delivery systems,” in Proc.Rural Electric Power Conf.,
2001, pp. A2/1–A2/13.
5. R. Billinton, R, N. Allan, "Reliability Evaluation of Power Systems",2nd edition,
Plenum Press, New York, 1996.
6. R. Billinton and R. Allan, Reliability Evaluation of Engineering Systems:
Concepts and Techniques: Plenum Press, 1994.
7. IEEE Standard 1366-1998, IEEE trial-use guide for electric powerdistribution
reliability Index, 1998.
44
Page 45
APPENDIX
#include<stdio.h>
#include<conio.h>
void main()
{
Float
AFR,AFLT,ART,AL[100],UL[100],RL,NC[100],ALD[100],LS[100],A,w,x,y,z,T
NCS,TNCI,SCID,ENS,AENS,SAIDI,SAIFI,CAIDI,ASAI,ASUI;
intn,i;
printf("\n ENTER THE NO. OF LOAD POINTS");
scanf("%d",&n);
printf("\nENTER THE AVERAGE FAILURE RATE OF THE SECTIONS");
scanf("%f",&AFR);
printf("\nENTER THE AVERAGE FAULT LOCATION TIME");
scanf("%f",&AFLT);
printf("\nENTER THE AVERAGE REPAIR TIME");
scanf("%f",&ART);
printf("\nENTER THE AVAILABILITY OF DG UNITS");
scanf("%f",&A);
for(i=0;i<n;i++)
{
printf("\n enter the no of customers,avg load demand,Length(km) of the section of
load point %d",i);
scanf("%f%f%f", &NC[i],&ALD[i],&LS[i]);
}
RL=AFLT+ART;
x=0;
for(i=0;i<n;i++)
{
45
Page 46
AL[i] = AFR*LS[i];
UL[i] = x+AL[i]*RL;
x = AL[i]*RL
}
printf("\n load point reliability incides for the given system");
printf("\nload pt.\tAvg. Failure rate\tAvg. Outage time\tAnnualAvg.outage time");
for(i=0;i<n;i++)
{
printf("\n %d\t %0.2f\t %0.2f\t %0.2f",i,AL[i],RL[i],UL[i]);
}
w=0;x=0;y=0;z=0;
for(i=0;i<n;i++)
{
TNCS=x+NC[i];
x=TNCS;
TNCI=y+AL[i]*NC[i];
y=TNCI;
SCID=z+UL[i]*NC[i];
z=SCID;
ENS=w+ALD[i]*UL[i];
w=ENS;
}
SAIFI=(TNCI/((1-A)*TNCS));
SAIDI=(SCID/((1-A)*TNCS));
CAIDI=SAIDI/SAIFI;
ASAI=(8760-SAIDI)/8760;
ASUI=1-ASAI;
AENS=(ENS/((1-A)*TNCS));
printf("\n System indices are");
46
Page 47
printf("\n SAIFI=%0.6f\n SAIDI=%0.6f\n CAIDI=%0.6f\n ASAI=%0.6f\n
ASUI=%0.6f\n ENS=%0.6f\n AENS=
%0.6f",SAIFI,SAIDI,CAIDI,ASAI,ASUI,ENS,AENS);
}
47