Page 1
ASSESSING THE SOIL CARBON SEQUESTRATION
POTENTIAL OF DIFFERENT PLANT RESIDUES
BY
NAA KOTEIKOR AMON
A THESIS SUBMITTED TO THE DEPARTM ENT OF SOIL SCIENCE,
UNIVERSITY OF GHANA, IN PARTIAL FULFILM ENT OF THE
REQUIREM ENTS FOR THE M ASTER OF PHILOSOPHY (M .Phil.) DEGREE
IN SOIL SCIENCE.
Department of Soil ScienceCollege of Agriculture and Consumer SciencesUniversity of GhanaLegon, Accra,Ghana
MAY, 2006.
Page 2
ii
DEDICATION
Dedicated to my parents; Mr. and Mrs. G.K. Hammond and m y sisters; Mrs. Naa
Adei Essuman and Koteikai Amon
Page 3
3794AZ
CS^l-b-ClS l lP t
c ' '
Page 4
iii
DECLARATION
I hereby declare that, the thesis herein presented for a degree o f M aster o f Philosophy
in Soil Science is a result o f my investigation. All references to other authors’ works
as sources o f information are duly acknowledged.
AMON NAA KOTEIKOR
SUPERVISORY COMMITTEE:
Prof. S.G. K. Adiku
(Supervisor)
Prof.G .N.N .Dowuona
(Member)
Rev.Prof. F.K. Kumaga
(Member)
Page 5
ACKNOW LEDGEMENTS
I wish to express my sincere thanks, first o f all to the ALMIGHTY GOD, who
has sustained me throughout the entire course of this work.
My profound gratitude goes to my supervisors, Prof. S. G. K. Adiku, Prof
G .N .N. Dowuona, Dr. T.A. Adjadeh and Rev. Prof. F. K. Kumaga for their keen
interest, patience and guidance during the course o f this work. I am also very grateful
to my major supervisor (Prof. Adiku) for securing funding from the carbon
sequestration project for the research.
I am also grateful to Dr. M. Abekoe, Head o f Soil Science Department, Prof.
K. B. Laryea, Dr. Mrs. S. Assuming-Brempong, Dr. K. Nartey and Prof. J.K
Ametakpor all o f the Soil Science Department for their encouragement, suggestions
and constructive criticisms.
M y appreciation goes to the whole technical staff o f the Soil Science
Department especially to: Mr. Julius Nartenor, Mr. Anipa, Mr. Adusei, Mr. Daniel
Tsatsu and Mr. Aggrey and to Mr. Tonyigah and Mr. Asante o f the Crop Science
Department.
My sincere thanks also go to Rev. Dr. M. Y. Quaye, all members o f Chosen
Generation Fellowship and the Cleggies Gospel Band for their immerse support and
prayers during the course o f this work.
I am also grateful to Dr. Mrs. A. Aboe and Mr. Tei Mensah for assisting me
with the printing and photocopying o f the work through out my entire course.
Page 6
A B STR A C T
This study investigated the use o f fallow residue m anagem ent as a m eans o f
sequestering soil carbon to m itigate the build up o f atm ospheric carbon dioxide.
T he study involved the analysis o f the effect o f three soil m oisture levels (W l=
F ield C apacity (FC), W 2 = 70% FC and W 3 = 40 % FC) on the decom position rate o f
five different fallow p lan t residues.(i) Pennisetum spp (elephant grass) from natural
bush fallow, R T1, (ii) Cajanus cajan (pigeon pea) residue, R T2, (iii) Vigna unguiculata
(cow pea), R T3, (iv) M ucuna pruriens (m ucuna) residue, R T 4 and (v) P ennisetum spp
(elephant grass w hich had benefited from residual fertilizer) under greenhouse
conditions. The residues w ere incubated for 180 days in po tted soils (H aplic L ixosols)
and m onitored over a 6 -m onth period and the am ount o f organic carbon added to the soil
w as determ ined. L im ited study o f residue decom position under field conditions w as also
carried out and com pared w ith the greenhouse conditions.
R esults show ed that w ater had a significant effect (P<0.05) on the decom position
rates o f p lan t residues. The order o f w ater treatm ent on the decom position o f p lan t
residues generally w as: W1 > W 2 > W3.
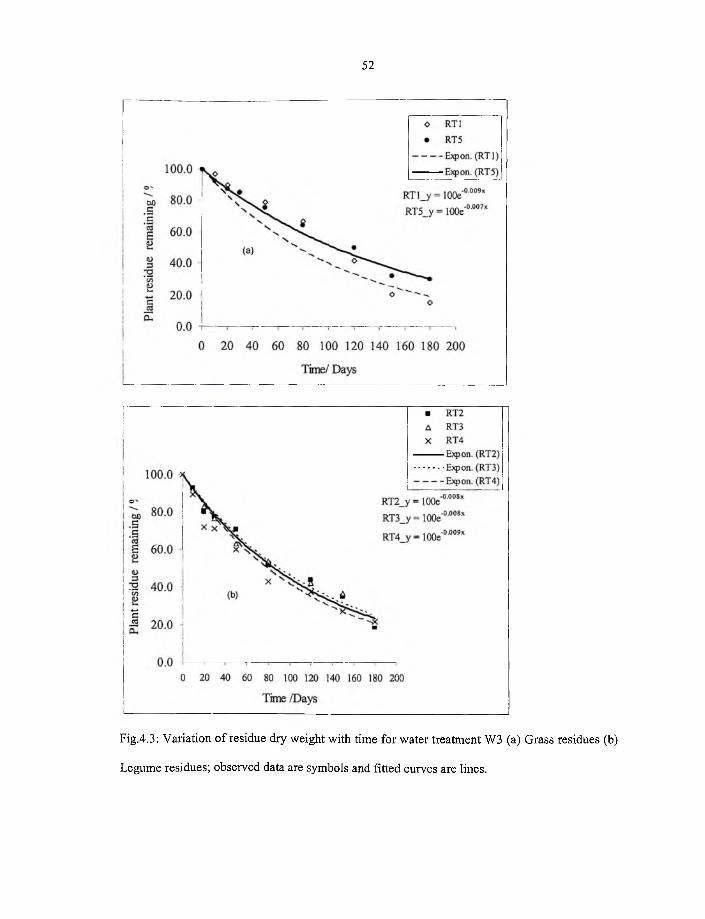
D ecom position w as also d ifferent for the residue types in the
order: RT1 < RT5 < RT3 < R T4 < RT2. This study show ed that the grasses; R T la n d
RT5 having h igh C:N ratios w ere better contributors to soil carbon storage.
It w as also observed that at the end o f the incubation period all the p lan t residues
added significantly h igher carbon to the soil than the control. (R T 6 ). A sim ilar response
was also observed in the field even though w ater and tem perature could not be controlled.
V
Page 7
iv
A sim ple equation developed to describe the variation o f residue decom position
w ith soil w ater gave reasonable predictions o f residue w eight loss w ith tim e. It is
concluded that residue type and soil m oisture m anagem ent offer m easures fo r im proving
soil carbon sequestration in tropical agricultural system s.
Page 8
vii
TABLE OF CONTENTS
Page
Title page i
Dedication ii
Declaration iii
Acknowledgements iv
Abstract v
Table of content vii
List o f Tables xi
List o f Figures xiii
CHAPTER 1 1
1.0 INTRODUCTION 1
1.1 Background 1
1.2 Problem specification 2
1.3 Objectives 4
CHAPTER 2 5
2.0 LITERATURE REVIEW 5
2.1 Introduction 5
2.2 The carbon cycle 6
2.3 The role o f plants in the carbon cycle 7
2.4 Residue decomposition 8
2.4.1 Factors governing residue decomposition 9
Page 9
2.4.1.1 Plant (substrate) characteristic 9
2.4.1.2 The nitrogen content o f substrate 10
2.4.1.3 Relative size of substrate 11
2.4.1.4 Method and depth of placement of residue 12
2.4.1.5 Environmental factors affecting residue decomposition 12
2.4.1.5.1 Temperature 12
2.4..1.5.2 Moisture content o f soil 14
2.4.1.5.3 Soil pH 15
2 .4.1.5.4 The carbon: nitrogen ratio o f the soil 16
2.4.1.5.5 Cultivation/Tillage 17
2.4.1.5 .6 Texture and mineralogy 18
2.5 Processes involved in organic matter decomposition 19
2.6 Contribution o f cereal and legumes residues to carbon sequestration 21
2.7 Techniques for estimating carbon sequestration potential 23
2.8 Modeling residue decomposition 25
2.9 Importance o f soil organic matter 29
CHAPTER 3 30
3.0 MATERIALS AND METHODS 30
3.1 Experimental site 30
3.1.1 Location and Physiography 30
3..2 Soils and sampling 30
3.3 Determination of physico-chemical properties o f the Haplic Lixosol 31
viii
Page 10
3.3.1 Soil texture 31
3.3.2 Field capacity determination 32
3.3.3 Soil pH 33
3.3.4 Organic Carbon 33
3.3.5 Total Nitrogen 34
3.3.6 Exchangeable Bases 35
3.3.7 Cation exchange capacity 36
3.3.8 Available phosphorus 36
3.4 Greenhouse residue incubation studies 37
3.4.1 Introduction 37
3.4.2 Plant residue 38
3.4.3 Pot experiment 39
3.5 Field studies 40
3.6 Statistical analysis 41
CHAPTER 4 RESULTS AND DISSCUSSION 42
4.0 Greenhouse studies 42
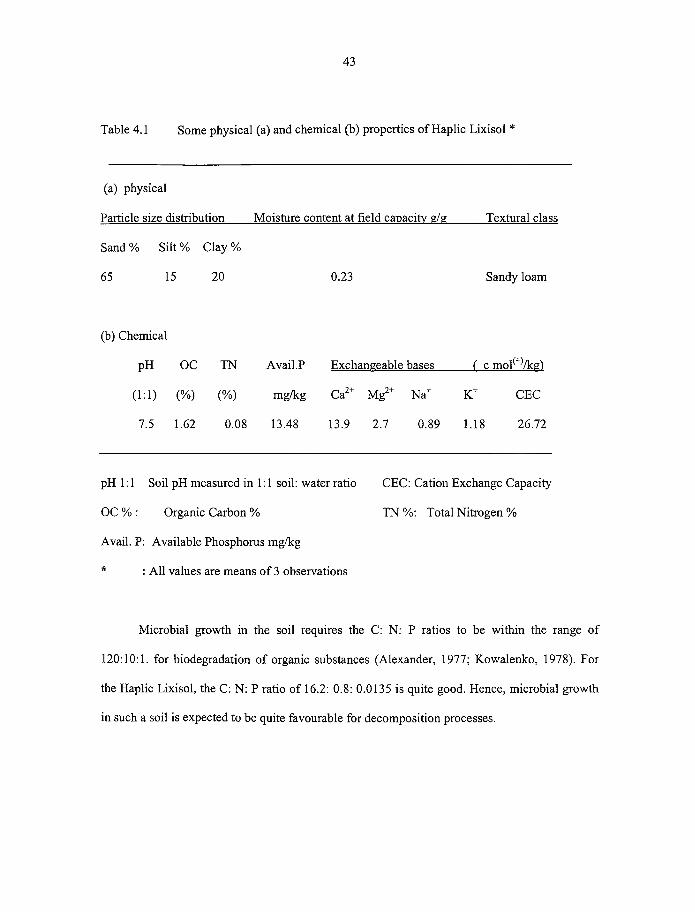
4.1 Soil physical and chemical properties 42
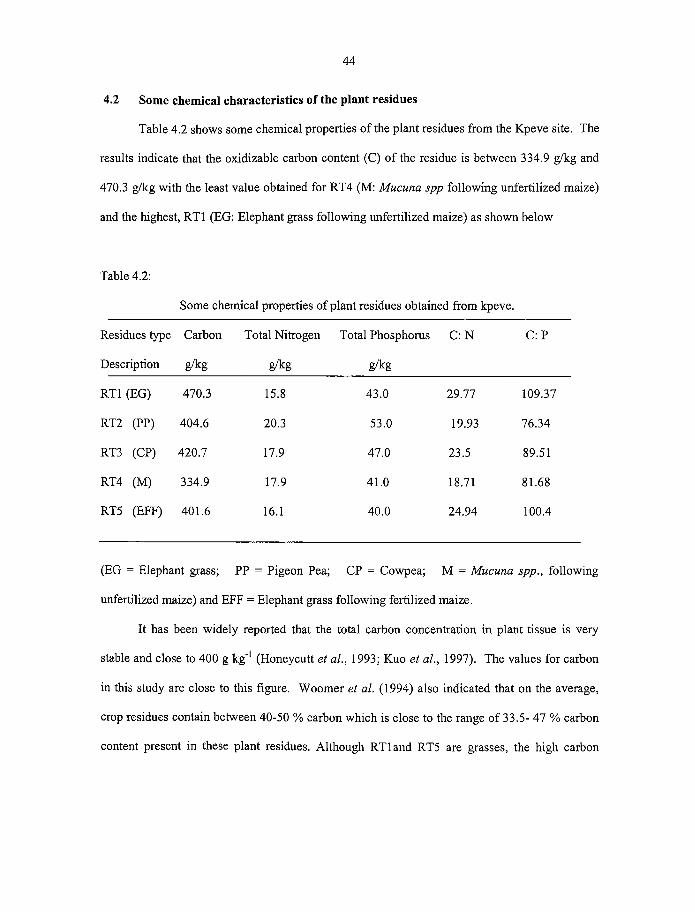
4.2 Some chemical characteristics of the plant residues 44
4.3 Decomposition o f residues during greenhouse studies 47
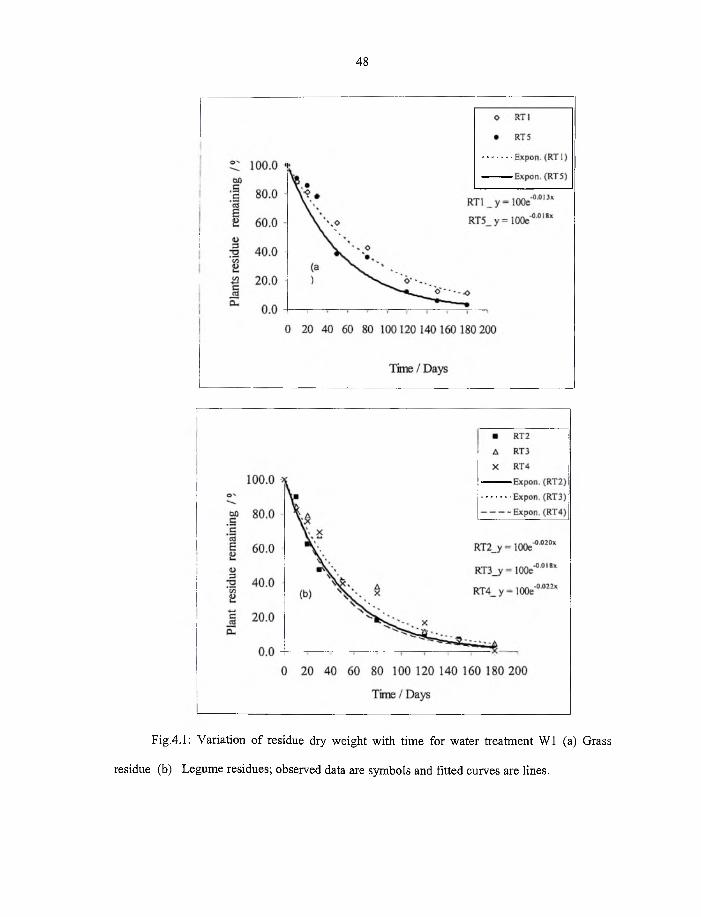
4.3.1 Effect o f residue type 47
4.3.2 Effect o f soil water on residue decomposition 56
4.4 Modelling the dynamics o f residue decomposition 60
ix
Page 11
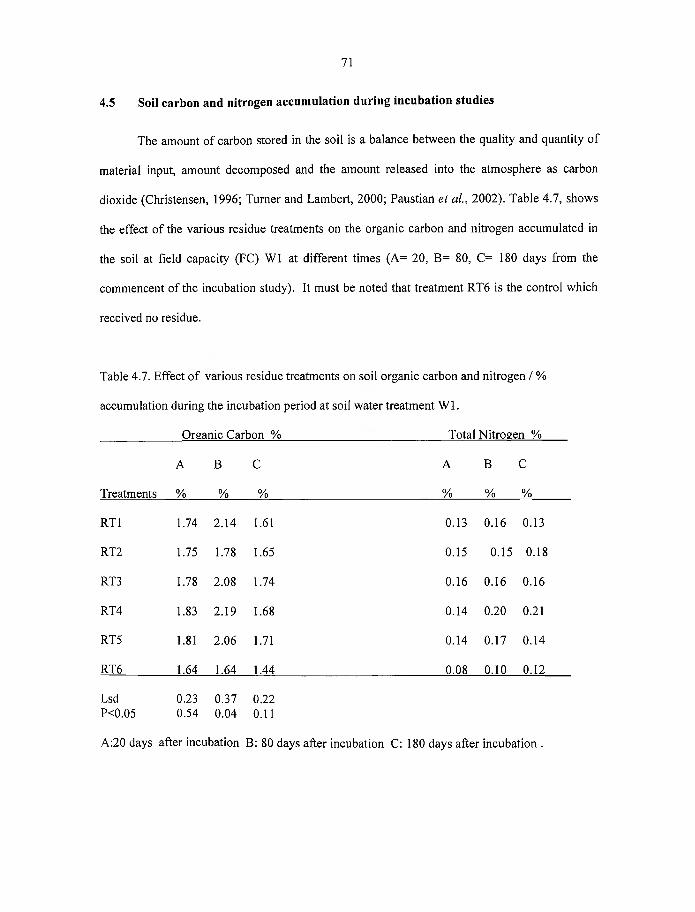
4.5 Soil carbon and nitrogen accumulation during incubation studies 71
4.6 Field Studies 77
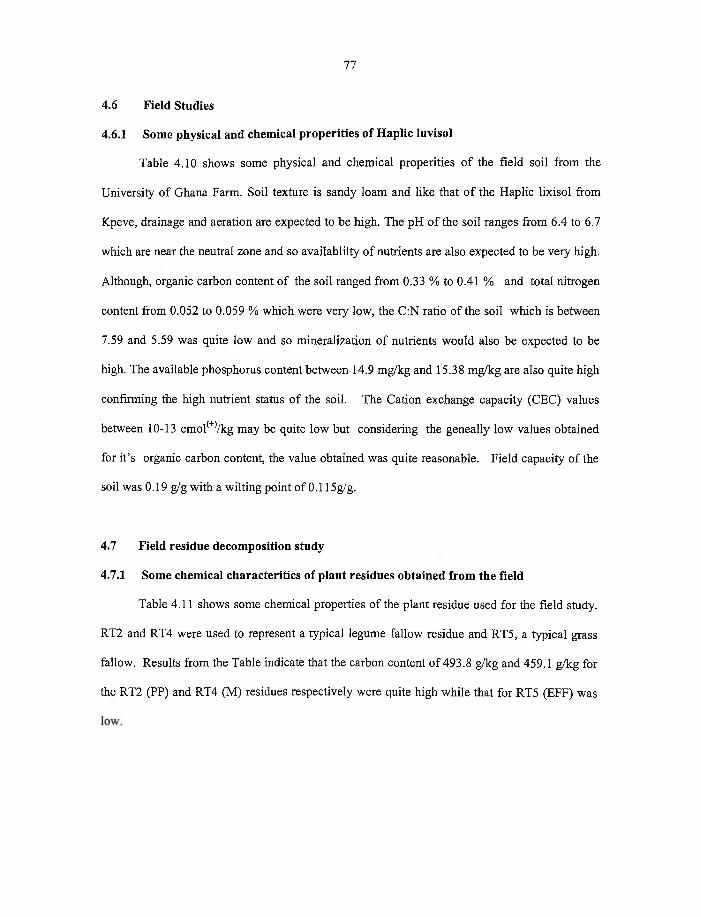
4.6.1 Some physical and chemical properties o f Haplic luvisol 77
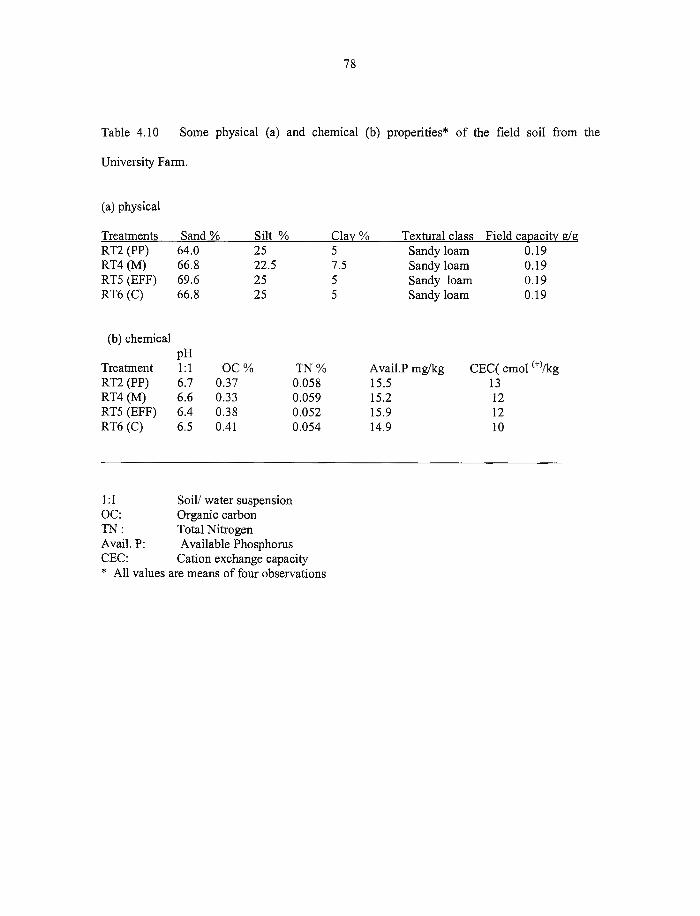
4.7 Field residue decomposition study 77
4.7.1 Some chemical charctericterics o f plant residues obtained from the field 77
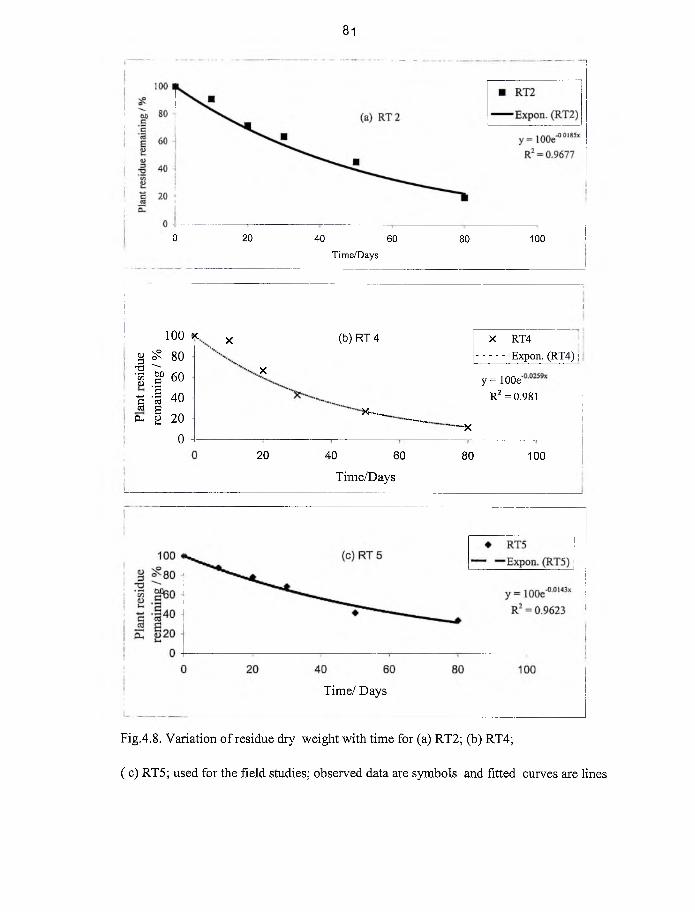
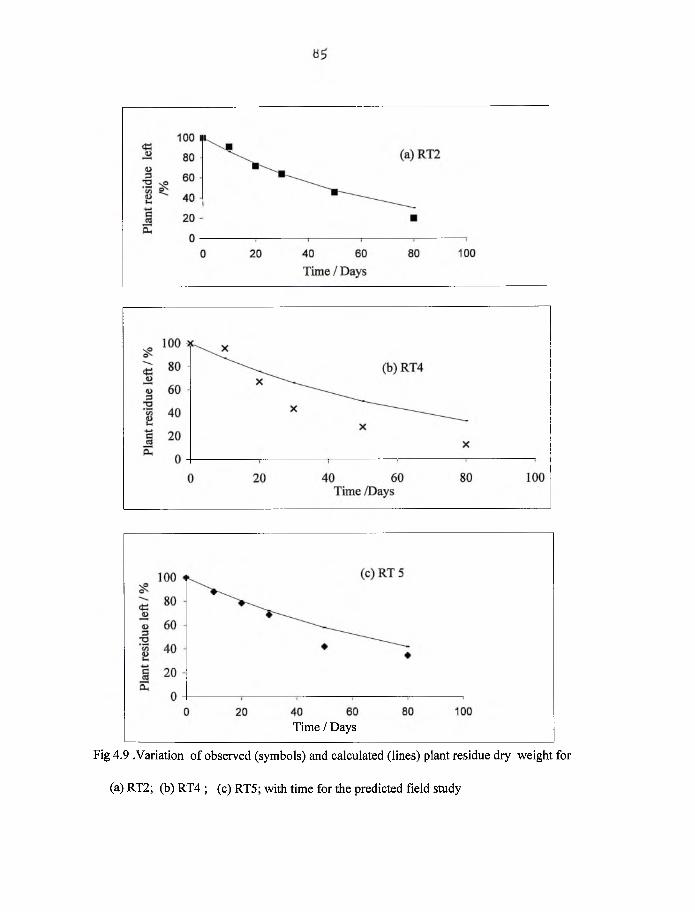
4.7.2. Effect o f residue type on decomposition 80
4.7.3Comparison between greenhouse pot experiment and field residue studies 82
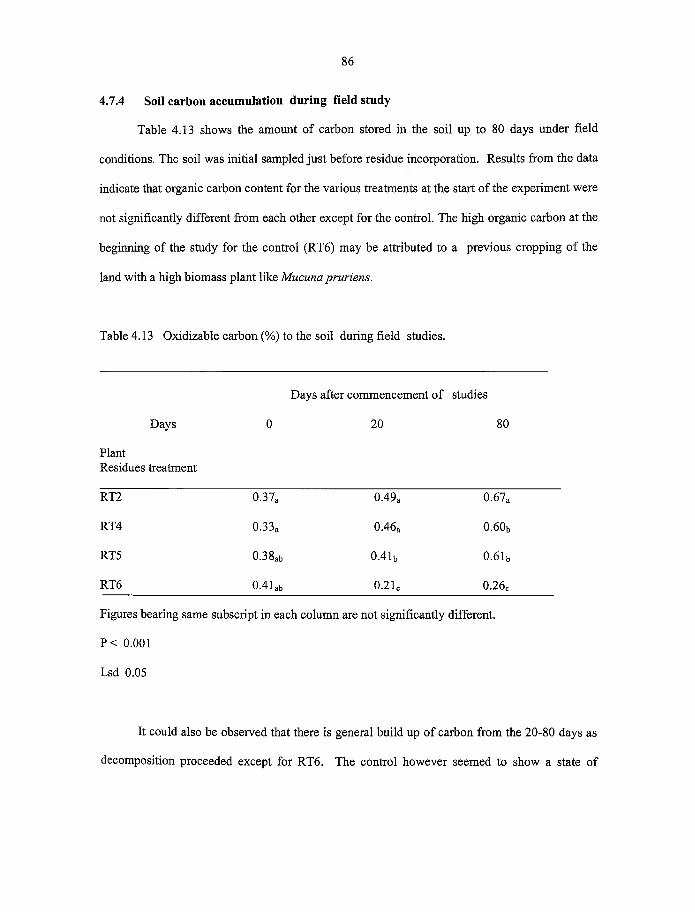
4.7.4 Soil carbon accumulation during field study 8 6
CHAPTER 5 88
CONCLUSION 8 8
Recommendation 89
REFERENCES 90
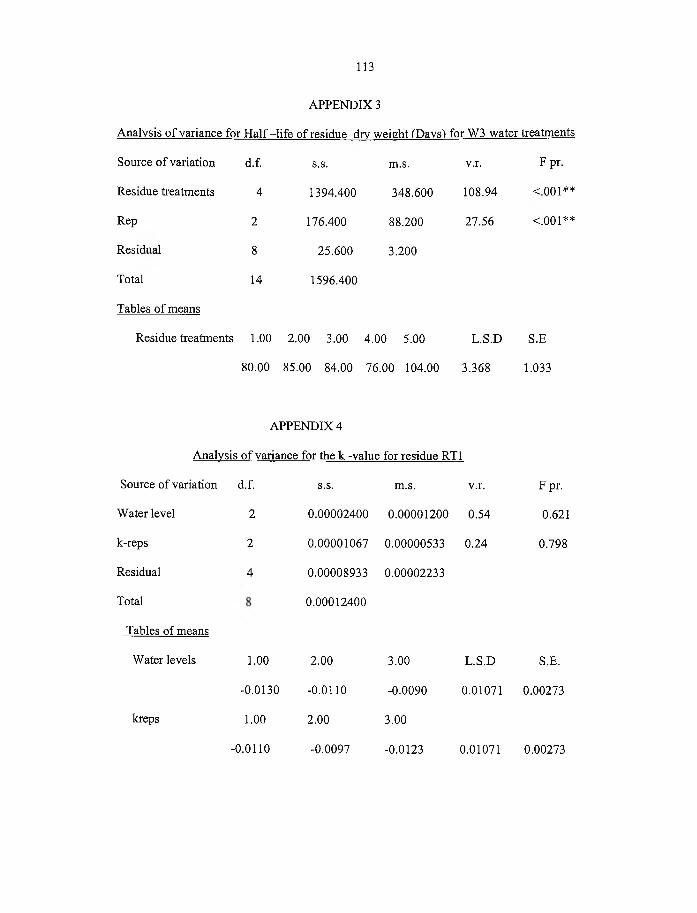
APPENDIX 112
X
Page 12
xi
LIST OF TABLES
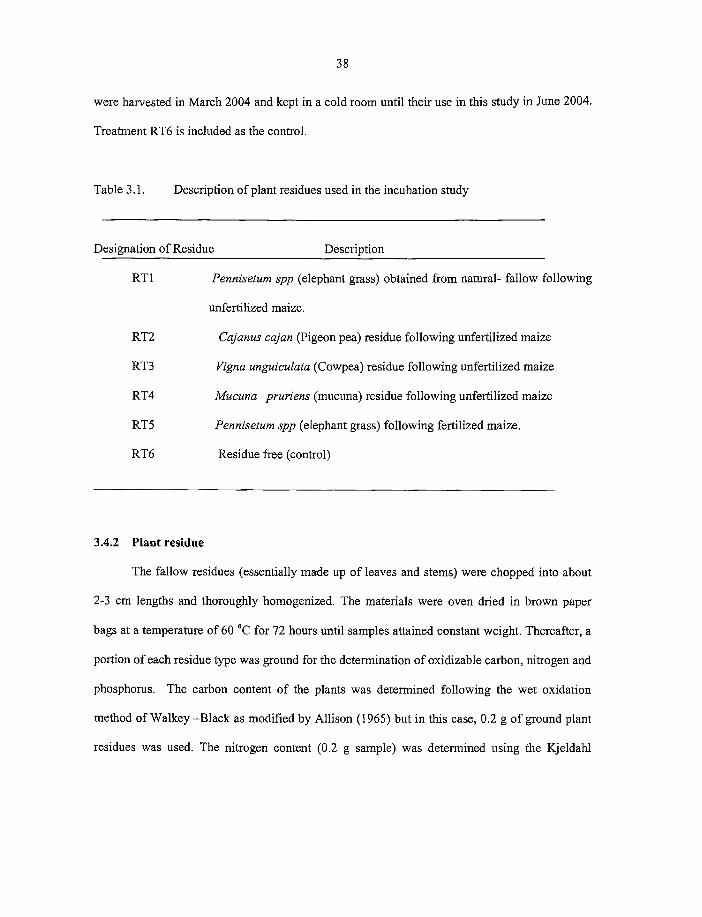
3.1 Description o f plant residues used in the incubation study 38
4.1 Some physical (a) and chemical (b) properties o f Haplic Lixosol. 43
4.2 Some chemical properties o f plant residues obtained from Kpev 44
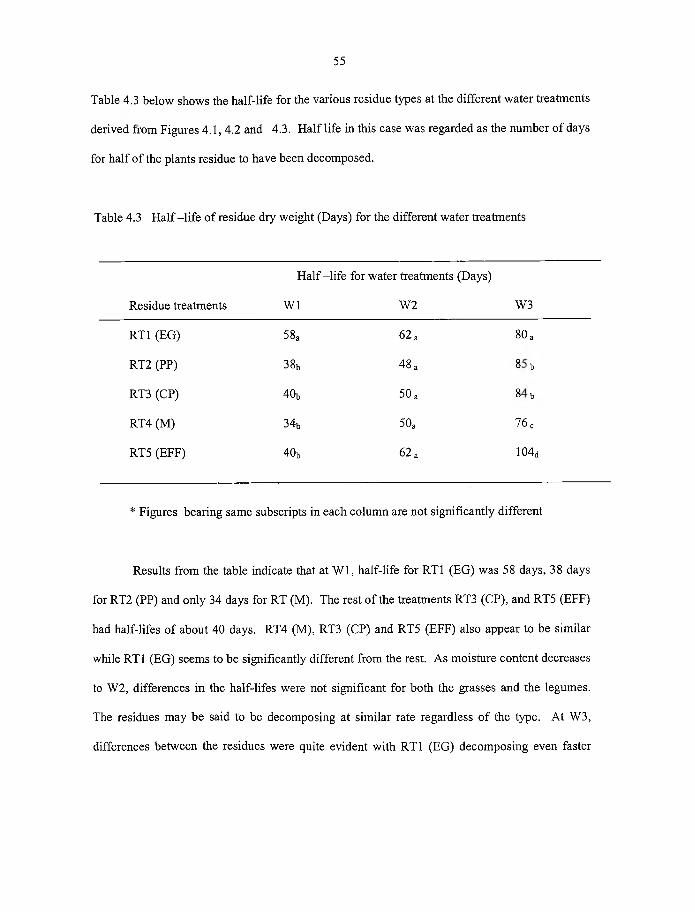
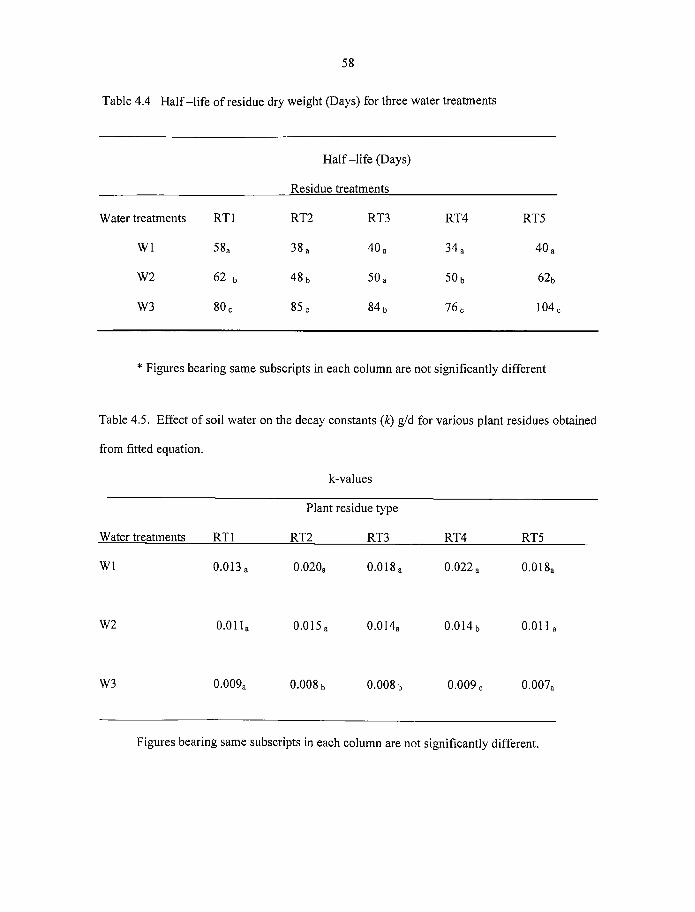
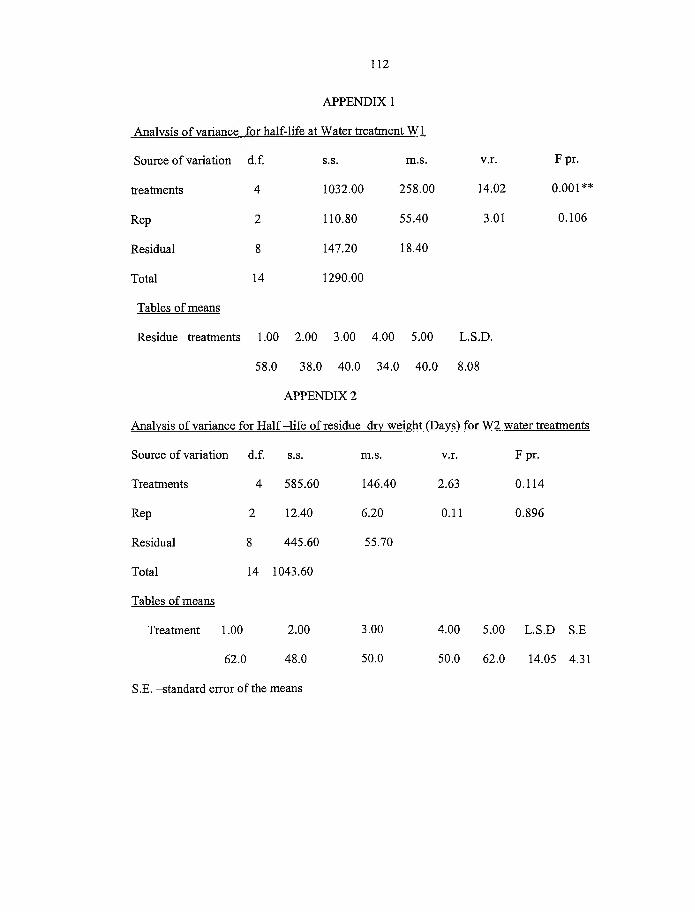
4.3 Half-life o f residue dry weight (days) for different water treatments 55
4.4 Half-life o f residue dry weight (days) for three water treatments 58
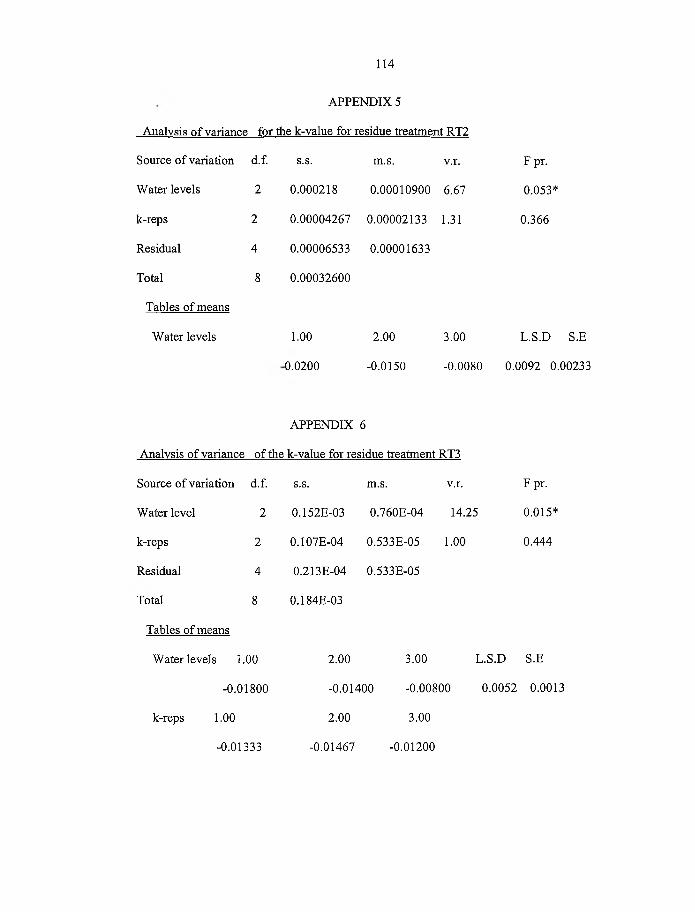
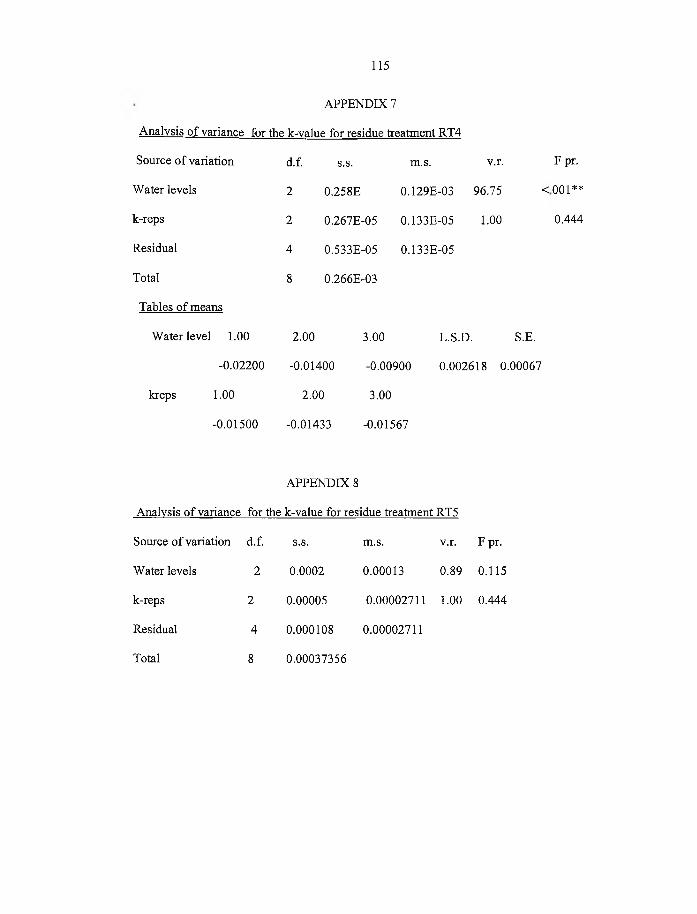
4.5 Effect o f soil water on the decay constants (k) g/d for various plant residues
obtained from fitted equation 58
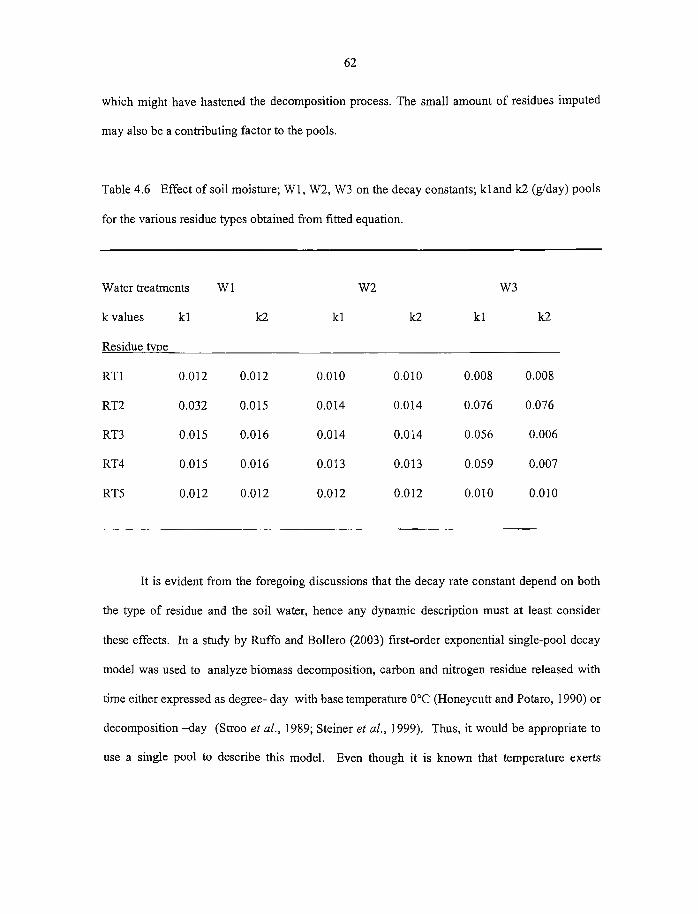
4.6 Effect o f soil moisture;W 1,W 2,W 3 on decay constants; k la n d K2 (g/day)
pools for the various residue types obtained from fitted equation 62
4.7 Effect o f various residue treatments on soil organic carbon and nitrogen /
% accumulation during the incubation period at soil moisture W1 71
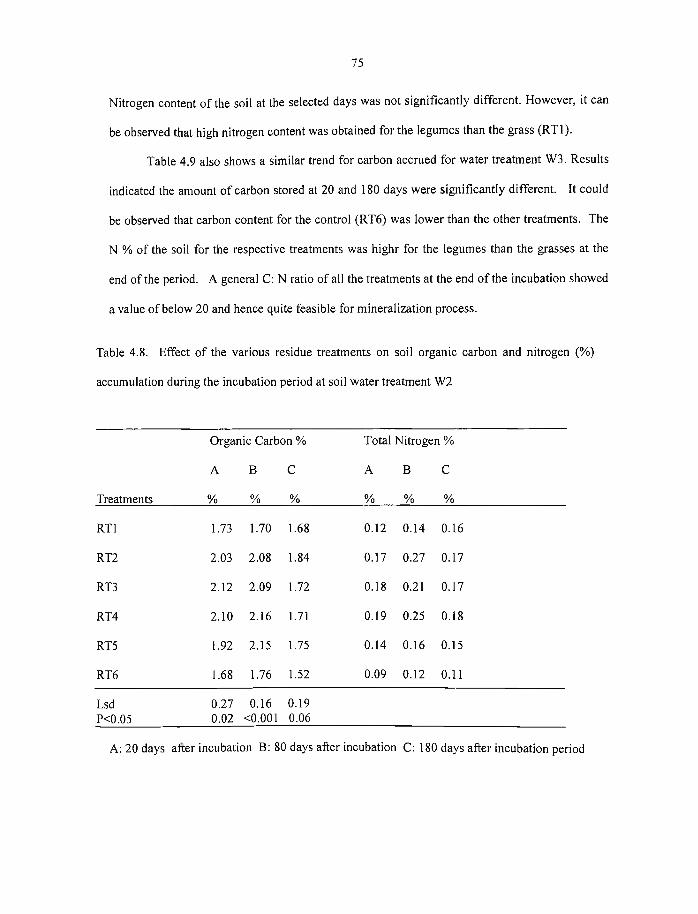
4.8 Effect o f various residue treatments on soil organic carbon and nitrogen /
% accumulation during the incubation period at soil moisture W 2 75
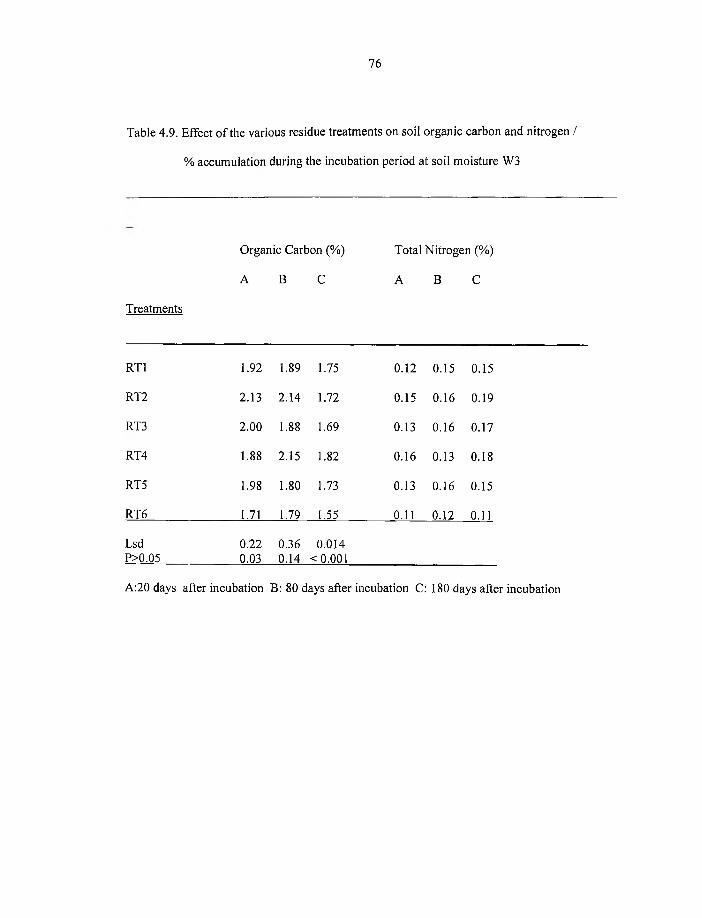
4.9 Effect o f various residue treatments on soil organic carbon and nitrogen /
% accumulation during the incubation period at soil moisture W3 76
4.10 Some physical (a) and chemical (b) properties o f the field soil from the
University farm 78
4.11 Some chemical properties o f the plant residues used for the field study 79
Page 13
4.12 Comparison between decay rate constant (k; g/day) for the greenhouse pot
experiment and that o f the field for some o f the plant residue treatments 83
4.13 Oxizable carbon % during field studies 8 6
xii
Page 14
LIST OF FIGURES
2.1 The Carbon cycle 6
4.1 Variation o f residue dry weight with time for water treatment W1 (a) grass
residue (b) Legume residue; observed data are symbols and fitted curves
are lines. 48
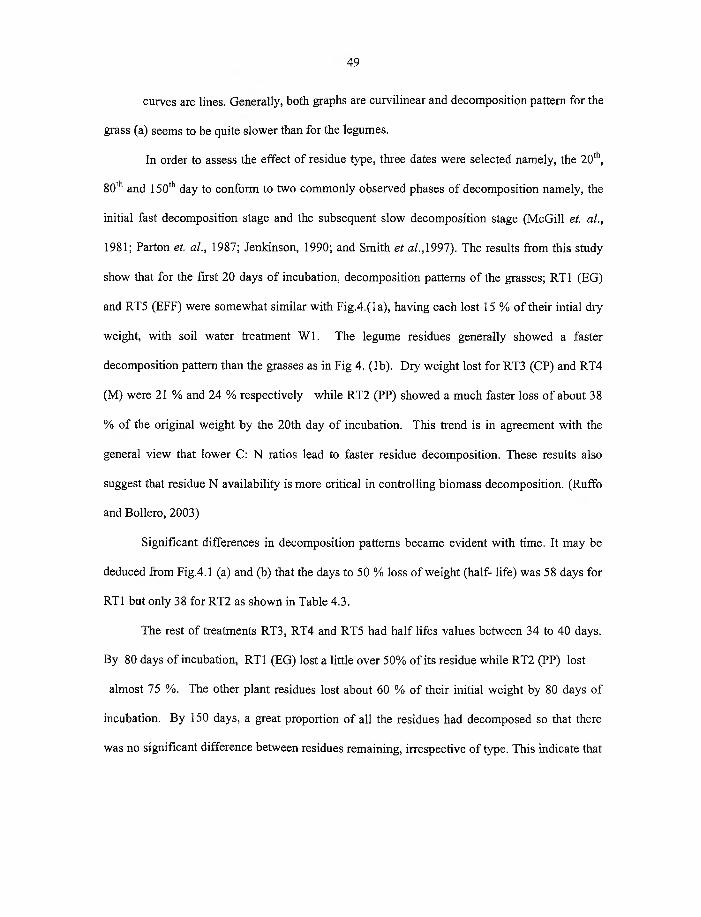
4.2 Variation o f residue dry weight with time for water treatment W 2 (a) grass
residue (b) Legume residue; observed data are symbols and fitted curves
are lines. 51
4.3 Variation o f residue dry weight with time for water treatment W3 (a) grass
residue (b) Legume residue; observed data are symbols and fitted curves
are lines. 52
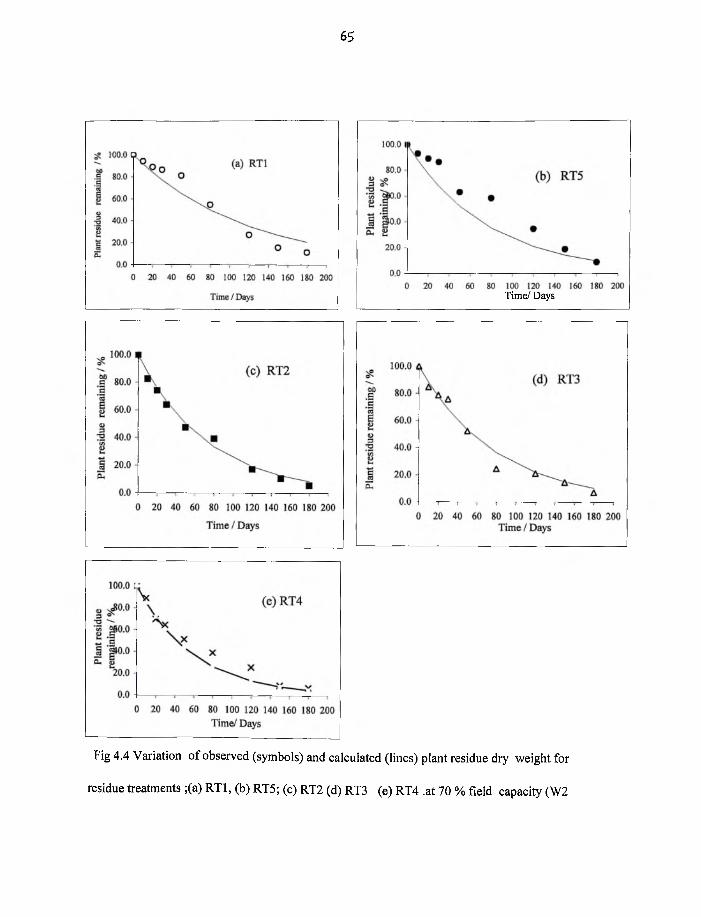
4.4 Variation o f observed (symbols) and calculated (lines) plant residue dry
weight for RT1,RT5,RT2,RT3 and RT4 at 70 % field capacity, W2 65
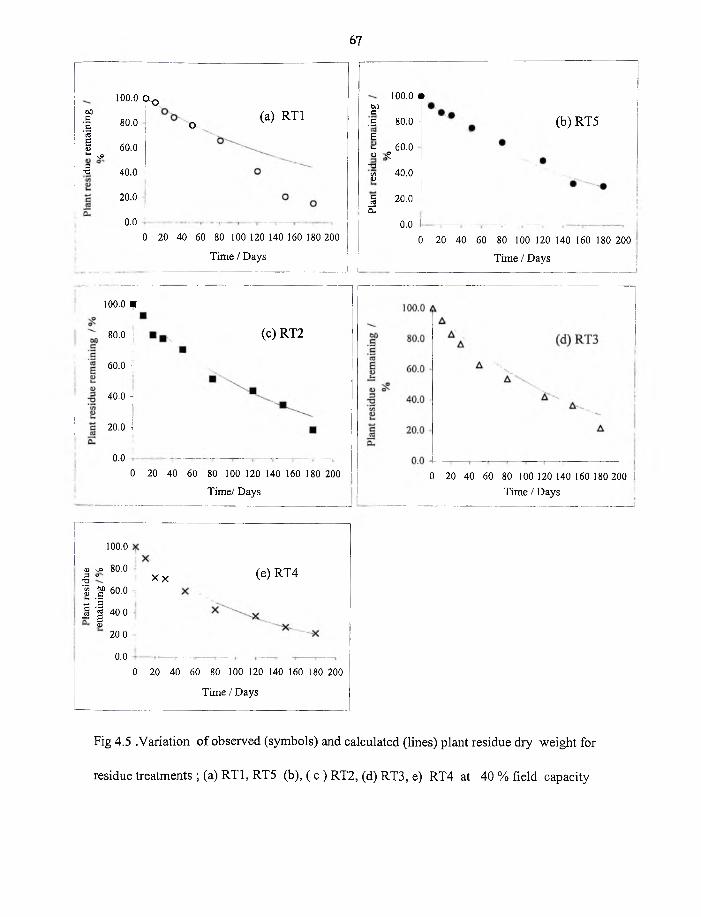
4.5 Variation o f Observed (symbols) and calculated (lines) plant residue dry
weight for RT1,RT5,RT2,RT3 and RT4 at 40 % field capacity, W3 67
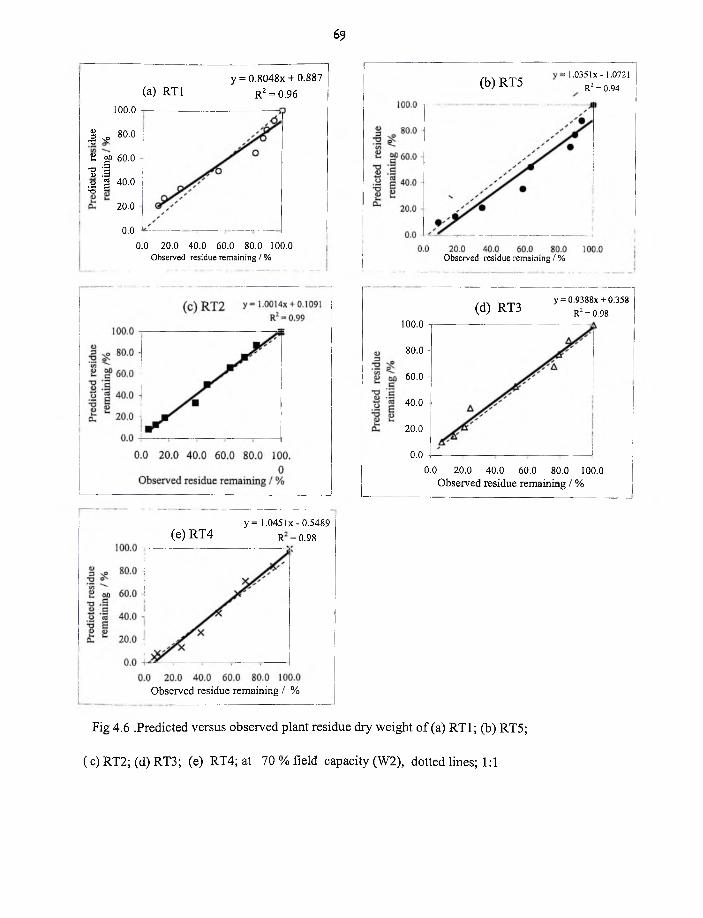
4.6 Predicted versus observed plant residue dry weight for RT1,RT5,RT2,RT3
and RT4 at 70% field capacity,W2 69
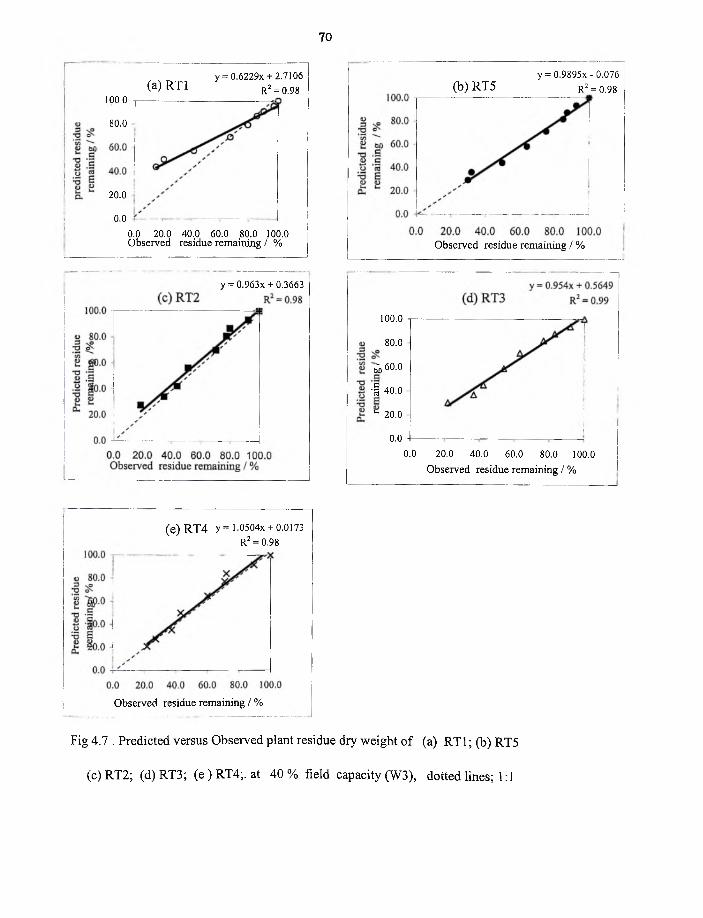
4.7 Predicted versus Observed plant residue dry weight RT1,RT5,RT2,RT3
and RT4 at 40 % field capacity, W2 70
4.8 Variation of residue dry weight with time for RT2, RT4 and RT5 used for
field studies. 81
XI11
Page 15
4.9 Variation o f observed (symbols) and calculated (lines) plant residue dry
weight for RT2, RT4 and RT5 with time for the field study 85.
xiv
Page 16
1
CHAPTER 1
INTRODUCTION
1.1 Background
Carbon is a major constituent o f all living things and the cycling o f carbon between the
atmosphere and the biosphere is one of the bases for life on earth. However, as a result o f m an’s
exploitative activities such as deforestation, automobile emission and power generation to
increase productivity to m eet energy demands, the quality o f the natural environment has and
continues to deteriorate in many parts o f the world at a time when the human population is
growing at an accelerated rate.
The stable carbon dioxide concentration in the atmosphere has for a long time been 0.034
% (Alexander, 1977). Report by Paustian (1998) indicates that carbon dioxide in the
atmosphere has increased by about 30 % since 1800 and continues to increase by about 0.5 %
per year. According to a special report on the contribution o f carbon pool to the global carbon
cycle by the Intergovernmental Panel on Climate Change (IPCC, 2000) over the period 1989-
1998, activities in the energy and building sectors o f the global economy increased atmospheric
carbon levels by 6.3 Gigatonnes o f carbon per year (Gt C y r-1). Other reports from the Science
Daily Magazine (1995 -2003) also indicate that deforestation and the use o f fossil fuels release
about 8 billion metric tonnes o f carbon dioxide into the atmosphere annually. Although most o f
the carbon dioxide gas is removed from the atmosphere by plants or by the w orld’s oceans, a
significant portion remains air borne. The net result o f these fluxes over the last 10-15 years is
that atmospheric carbon levels have increased by about 3.3 Gt C yr - 1
Page 17
Carbon dioxide addition to the atmosphere is caused not only by burning o f fossil fuel
through industrial and agricultural activities, but also by soil organic carbon decomposition and
vegetation burning. Methane production, volatilisation and mineralization o f soil carbon can also
lead to carbon loss from the soil. Consequently, atmospheric carbon dioxide continues to
increase at the rate o f 3.5 billion tonnes every year (Rice et al., 2004) which presents a problem
of global wanning.
1.2 Problem specification
Increased atmospheric carbon dioxide in the environment could lead to global warming
and changes in climate pattern (Jenkinson et al., 1991; IPCC, 2001). To mitigate these effects
various methods have been proposed to control carbon dioxide accumulation in the atmosphere.
One o f these is to legislate a policy framework, which ensures that the fossil burning industries
change their technology to reduce carbon dioxide concentration in the atmosphere (Wise and
Cacho, 1999). In other cases, heavy levying o f culprit industries to deter their production o f
carbon dioxide has also not been effective. The Department o f Energy in U.S. A used carbon to
bind common minerals like serpentine and peridotites and this was believed to result in a
mineral carbonate which could be used to prevent carbon dioxide from fossil fuel from reaching
the atmosphere (McNelly, 1999). This helps in reducing carbon dioxide concentration in the
atmosphere. However, this method is very expensive and could not be used on a wide scale.
Carbon credit trading, incentives for development and application o f new technology,
education and technical assistance for producers and tax credits for conservation practices are
also being used (Bruce et al., 1999) as methods to reduce carbon load o f the atmosphere.
2
Page 18
Carbon sequestration by soil provides a better means o f storage o f carbon in a stable
solid form and this occurs through direct and indirect fixation o f atmospheric carbon dioxide.
(Wielopolski et al., 2004). Direct soil carbon sequestration occurs by inorganic chemical
reactions that convert carbon dioxide into soil inorganic carbon compounds such as calcium and
magnesium compounds. Indirect carbon sequestration by plants through photosynthesis could
finally be transformed to the soil when the plant biomass is added to the soil as residue. This
process is considered by many as the most cost effective way to reduce the concentration of
carbon dioxide in the atmosphere. Thus, increasing soil organic C stocks (i.e. soil carbon
sequestration), as a means to mitigate increasing CO2 concentrations in the atmosphere, requires
increasing C inputs and /or decreasing decomposition rates Paustian et al., (2002).
Different plant residues decompose at different rates. Slow decomposing residues will
result in more carbon accretion to the soil and being released slowly into the atmosphere
(Bouldin, 1988). As noted, carbon additions are mainly through plant residue input and their
decomposition rates (Bruce et al., 1999). The quality and quantity o f plant residue input will
determine the status o f the soil as studies show that addition o f organic matter to soil improves
many of the soil properties that influence yield (Mulongoy and Merckx., 1991). Other factors
that affect the residue decomposition rate include the moisture status o f the soil (Paustian et al.,
2002). The slowly decomposing residues may have an important effect on the organic matter
content o f the soil but the effect will occur only after a period o f several years (Van Faasen and
Smilde, 1985).
The storage o f carbon in soils if only managed well would therefore offer a more
permanent storage of carbon. Whereas most studies on land fallowing in Ghana has focused
mainly on soil fertility restoration, there is a general lack o f detailed studies on how different
3
Page 19
plant types and environmental factors interact to determine soil carbon storage. In deciding on
the ultimate goal to get more carbon stored in the soil through plants which are commonly left
on the soil in various fallow systems, as well as improve the productivity o f soil within cropping
systems, it is necessary to evaluate the carbon sequestration potential o f various fallow plant
residues. The amount o f carbon sequestered at a site reflects the long-term balance between
carbon addition and release mechanism (Christensen, 1996; Turner and Lambert, 2000; Paustian
et al., 2 0 0 2 ).
1.3 Objectives
The objectives o f this research are to:
i) determine the effect o f five fallow residue types obtained from a maize-cropping
system at Kpeve in the Volta Region o f Ghana on the decomposition rates under
greenhouse conditions, and compare with limited field studies at the University Farm,
Legon,
ii) determine the effect o f soil moisture levels on the decomposition rate o f these plant
residues and their contribution to soil carbon storage,
(iii) determine the additions o f organic carbon to the soil by the various residue types.
4
Page 20
CHAPTER 2
LITERATURE REVIEW
2.1 Introduction
The increasing level o f carbon dioxide in our atmosphere has caused scientists to
investigate ways o f limiting carbon emissions from agriculture. Agriculture has a tremendous
potential to reduce carbon present in the atmosphere due to assimilation of atmospheric carbon
by growing plants (Cole et al., 1997). Plant residues returned to the soil would add carbon to the
soil and part o f this will be converted by microbial decomposition processes to organic matter.
The amount o f carbon (C) stored in soils depends primarily on the balance between C
inputs from the plant residues and C emissions from decomposition. Thus, increasing soil
organic C stocks (i.e. soil carbon sequestration), as a means to mitigate increasing CCb
concentrations in the atmosphere, requires increasing C inputs and/or decreasing decomposition
rates. Both inputs and decomposition rates are affected by environmental factors such as climate
(temperature and rainfall) and soil physical factors (soil texture, clay mineralogy, profile
development), as well as agricultural management practices (Paustian et al., 2002)
Different plant residues decompose at different rates. Slow decomposing residues will
result in more carbon accretion to the soil and being released slowly into the atmosphere.
Biodegradation o f plant residues have considerable contribution in carbon evolution in natural
and agro ecosystems. The chemical composition of plant residues determines their contribution
to carbon sequestration and the fertility status o f the soil. Thus, increased understanding o f
residue decomposition and its associated N mineralization may improve the management of
cover crops in these systems (Quemada and Cabrera, 1995).
5
Page 21
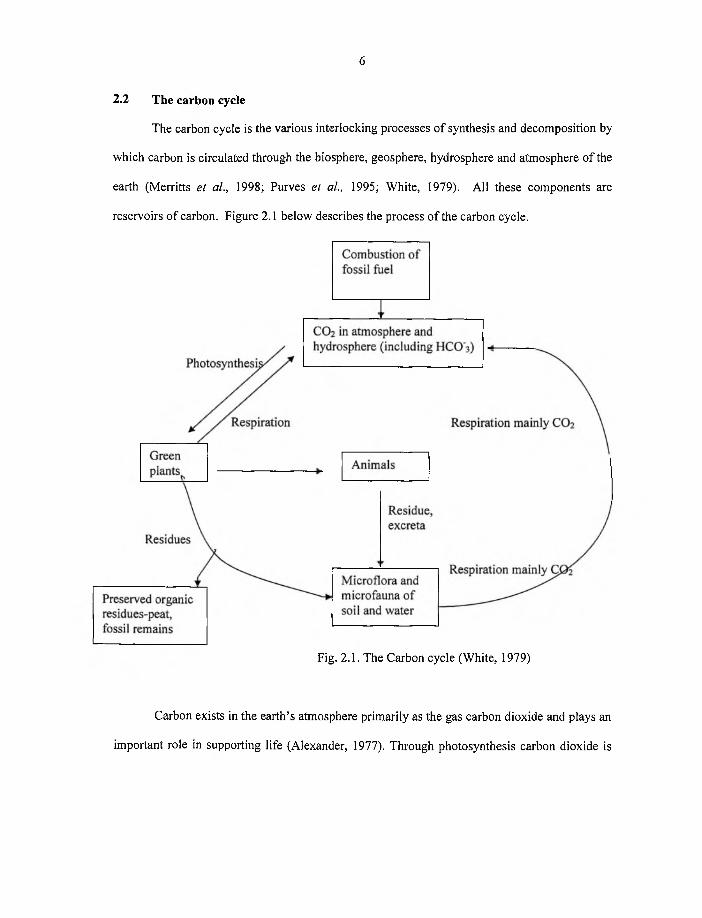
2.2 The carbon cycle
The carbon cycle is the various interlocking processes o f synthesis and decomposition by
which carbon is circulated through the biosphere, geosphere, hydrosphere and atmosphere o f the
earth (Merritts et al., 1998; Purves el al., 1995; White, 1979). All these components are
reservoirs o f carbon. Figure 2.1 below describes the process o f the carbon cycle.
6
Fig. 2.1. The Carbon cycle (White, 1979)
Carbon exists in the earth’s atmosphere primarily as the gas carbon dioxide and plays an
important role in supporting life (Alexander, 1977). Through photosynthesis carbon dioxide is
Page 22
converted to plant material and this carbon is lost when the crop is harvested. Animals consume
the plants and carbon is returned to the soil in the form o f manure or excreta which are admixed
to a variable extent with the mineral component. The dead organic matter is colonized by a
variety o f soil organisms which derive energy for growth from the oxidative decomposition of
complex organic molecules. During decomposition, essential elements are converted from
organic combination to simple inorganic forms through the process o f mineralization (White,
1979). Mineralization, especially the release o f carbon dioxide is vital for the growth o f
succeeding generations of green plants which convert organic carbon to carbon dioxide. When
the micro organisms respire, carbon dioxide is released into the atmosphere.
The remainder of the substrate carbon used by the micro organisms is incorporated into
their cell substance or biomass, as a variable proportion o f the other essential elements N, P and
S. This incorporation renders these elements unavailable (immobilized) for plant growth until
the organisms die and decay. The residues o f the organisms, together with the more recalcitrant
parts o f the original substrate, accumulate in the soil (White, 1979). Soil carbon losses are
exacerbated through erosion and to a lesser extent through leaching o f dissolved organic carbon.
Hence the basic processes o f the carbon cycle are carbon dioxide in through photosynthesis and
carbon dioxide out through decomposition (Goings, 2001).
2.3 The role of plants in the carbon cycle
Green plants play a very important role in the carbon cycle. Carbon dioxide is used by
plants for photosynthesis to build up carbon compounds. The amount o f carbon taken up by
photosynthesis and released back to the atmosphere by respiration each year is 1 0 0 0 times
greater than the amount o f carbon that moves through the geological cycle on annual basis
7
Page 23
(Merritts et al., 1998; Purves et al., 1995). During the process o f photosynthesis, sunlight
energy is first trapped by the chlorophyll o f the plant. The energy is converted to a chemical
form called Adensosine triphosphate (ATP). The plants then use the energy from ATP to
produce sugar (C6 H i2 Os). This process o f photosynthesis requires water and produces oxygen
as shown below
6 CO2 + 6 H2 O + Sunlight C 6 H 12O6 + 6 O2 (2.1) ►
Animals eat plants to obtain the energy trapped during photosynthesis. As the animals
bodies break down the carbohydrates in the plant tissue, carbon dioxide is released to the
atmosphere through the process of respiration.
C6 H i20 6 + 6 O2 -----------► 6 CO 2 + 6 H20 (2.2)
Plants too respire as they breakdown the organic molecules in themselves to release the
stored energy. Plants also release CO2 to the atmosphere when they decompose. When dead
plants slowly decay under high pressure and high temperature, they may form pools o f energy
known as fossil fuels (White, 1979). Fossil fuels, as well as fresh vegetation through the
process of combustion release the energy stored in them in the form o f C 0 2 into the
atmosphere.
2.4 Residue decomposition
According to Thien and Graveel (1997), decomposition describes a series o f processes
that ultimately reduce the complexity o f a material. Residue decomposition will therefore
involve the constituent parts of the material being released or synthesized into new compounds.
This act o f releasing and synthesizing o f materials is the main process that recycles nutrients
back into the soil.
8
Page 24
2.4.1 Factors governing residue decomposition
Decomposition o f organic materials and the release o f carbon dioxide from native soil
organic matter or decaying litter is the result o f complex interactions between the microbial
population and various factors. The major factors include the quantity and quality o f substrate,
moisture, temperature, soil pH, soil texture and management practices (Alexander, 1977).
2.4.1.1 Plant (substrate) characteristic
The rate o f decay o f added organic materials is affected by their major constituents (Rice
et al., 2004). It is known that materials with high contents o flign in degrade very slowly due
to the paucity o f organisms that degrade it and the more resistant nature o f lignin (Duncan,
1996). Similarly, plant materials high in polyphenols and tannins degrade more slowly than
those with high contents o f water soluble materials and cellulose (Taylor et al., 1989). Plant
residue is a complex mixture consisting o f soluble sugars, free amino acids, proteins, cellulose,
hemicellulose and lignin (White, 1979; Rice et al., 2004). Typical components and their
proportion within the whole tissue vary among plant species (Broder and Wagner, 1988) and
within plant species (White et al., 2003). The residue o f different plant species can decompose
at different rates. According to reports by Kaboneka et al. (1997), 48%, 56 % and 60 % o f
wheat straw, com stover and soybean stubble were mineralized during a 30 day incubation
period, respectively. Thus, the chemical and physical characteristics o f crop residues affect their
decomposition rate.
The age o f a plant affects its composition, and therefore its rate o f decomposition. As the
plant ages, its chemical composition changes; the amounts o f N, proteins and water soluble
9
Page 25
substances decrease while the proportion o f cellulose, lignin and hemi cellulose increase (Brady,
1990).
2.4.1.2 The nitrogen content of substrate
The nitrogen content o f plant material has been shown to be an important factor
controlling the rate o f decomposition in many studies (Cowling and Merrill, 1966; Aber and
Mellilo, 1980; Campbell, 1978). Residues that are low in nitrogen (N) but high in fibre are
resistant to decay and therefore decompose more slowly than crop residues that are high in N
and low in fibre. For example, com cobs, com stalks, sorghum stalks, soybean stems and
sunflower stems are crop residues that are low in N, high in fibre and are slow to decompose
even in warm moist soils (Vigil and Sparks, 2002). On the other hand, the leaves o f com,
sorghum, soybean and wheat are all relatively high in N and low in fibre and so decompose
rapidly.
There are also differences among species o f grasses regarding the amount o f nitrogen
that is available for decomposition. Vallis and Jones (1973) indicated that leaves and litter o f
legumes Desmodium intorturm cv Greenleaf and Phaseolus atropurpureus cv Siratro had similar
N and lignin content. The N mineralized from the former was less than that from P.
atropurpureus and therefore attributed it to a much higher polyphenol content o f the D.
intorturm. Bartholomew (1965) and Mahendrappa (1978) also demonstrated that the addition of
elemental nitrogen to natural litter materials and incorporated crop residues respectively enhance
their rate o f decomposition. Thus, a high N content in litter facilitates N mineralization by
encouraging a high rate o f decomposition and ensuring that N mineralization exceeds
immobilization by considerable extent (Haynes et al., 1986). Increased nitrogen deposit may
10
Page 26
temporarily enhance forest carbon sequestration in nitrogen-limited ecosystems, leading to a
short-term carbon gain in net primary productivity.
Fertilization with nutrients sometimes increases rates o f decomposition (Gill and
Lavender 1983; Hunt et al., 1988; Prescott et al., 1992; O ’Connell, 1994; Downs et al., 1996;
Hobbie and Vitousek, 2000). However, fertilization often has little or no effect on
decomposition (Staaf, 1980; Pastor et al., 1987; Hunt et al., 1988; Theodorou and Bowen, 1990;
Van Vuuren and Vander Eerden, 1992; Andren et a l , 1993; Prescott, 1995; Downs et al., 1996;
King et al., 1997; Hobbie and Vitousek, 2000). Indeed it may even decrease the rates o f
decomposition (Gill and Lavender, 1983; Titus and Malcolm, 1987; Fog, 1988; O ’Connell,
1994; Prescott, 1995; Berg and Matzner, 1997; Magill and Aber, 1998). Studies have shown
that N addition speeded decomposition of low-lignin but not high lignin leaves (Hobbie, 2000).
2.4.I.3. Relative size of substrate
The relative size o f a substrate is the ratio of the surface area to the weight. The
relative size o f plant residues affects their rate o f decomposition and build-up o f organic matter.
Crop residues that are chopped and broken up by stalk choppers or tillage equipment have
smaller particle sizes than residues that are left undisturbed. A study by Vigil and Sparks (2002)
has shown that the breaking up o f a crop residue into smaller particles sizes exposes more
residue surface area to microbial attack. Thus, broken crop residues decompose faster than
residues that are left intact. For example, wheat or millet stems are inherently smaller and have
greater specific surface area o f residue material than com, sorghum or sunflower stalks. A given
weight of the smaller wheat and millet stem residues decomposes faster than the same weight o f
com, sorghum or sunflowers under the same conditions o f soil temperature, water and tillage.
11
Page 27
Crop residues that have also been chopped and tilled are more intimately mixed with the soil
microbial population. These residues are physically in a more favorable position for greater
microbial attack and should decompose faster than residues that are left standing and
undisturbed.
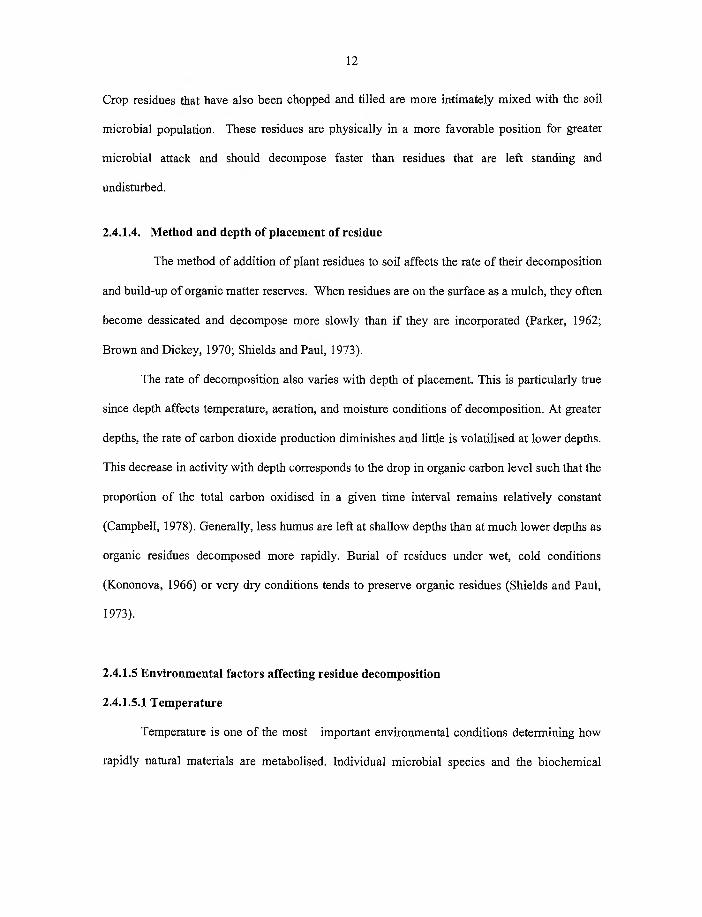
2.4.I.4. Method and depth of placement of residue
The method o f addition o f plant residues to soil affects the rate o f their decomposition
and build-up o f organic matter reserves. When residues are on the surface as a mulch, they often
become dessicated and decompose more slowly than if they are incorporated (Parker, 1962;
Brown and Dickey, 1970; Shields and Paul, 1973).
The rate o f decomposition also varies with depth o f placement. This is particularly true
since depth affects temperature, aeration, and moisture conditions o f decomposition. A t greater
depths, the rate o f carbon dioxide production diminishes and little is volatilised at lower depths.
This decrease in activity with depth corresponds to the drop in organic carbon level such that the
proportion o f the total carbon oxidised in a given time interval remains relatively constant
(Campbell, 1978). Generally, less humus are left at shallow depths than at much lower depths as
organic residues decomposed more rapidly. Burial o f residues under wet, cold conditions
(Kononova, 1966) or very dry conditions tends to preserve organic residues (Shields and Paul,
1973).
2.4.1.5 Environmental factors affecting residue decomposition
2.4.1.5.1 Temperature
Temperature is one o f the most important environmental conditions determining how
rapidly natural materials are metabolised. Individual microbial species and the biochemical
12
Page 28
capacities o f the population as a whole have temperature optima. The mesophillic bacteria
actinomycetes and fungi have a temperature optima range o f 0-45 °C while the thermophillic
types have a range o f 45-60 °C, (Alexander, 1977). Thus, a change in temperature will alter the
composition o f the species o f the active flora, the total number o f species and also the total
number o f microbial cells.
According to W hite (1979) decomposition rates increase in an exponential fashion, as
described by an Arrhenius or Q10 type relationship, with increasing temperature across the
range o f temperatures occurring in most soil environments (e.g. < 0-35 °C). Short-term
laboratory incubations from numerous studies support this basic control on the metabolism of
soil biota, whereby respiration typically increases by a factor o f 2 or more for every 10° C
increase in temperature (Paul and Clark, 1989). This response to temperature is the basis for
many predictions that global warming will greatly increase C loss from many terrestrial
ecosystems (Jenkinson et al., 1991)
Brady (1990) also indicated that the decomposition o f organic matter in general is
accelerated in warm climates; a lower rate o f decay is the rule in cool regions while within belts
o f uniform moisture condition and comparable vegetation, the average total organic matter and
nitrogen increases from two to three times for each 10 °C decline in mean annual temperature.
Hence decomposition is slower at lower than at higher temperatures. Increased temperature is
associated with greater carbon dioxide release.
Appreciable organic matter decomposition can occur at 5 °C and probably at cooler
values, but decomposition o f plant residue is increased with progressively warmer conditions
(Campbell, 1978). Moreover, increasing the temperature shortens the time required before
maximum rate o f carbon dioxide evolution is attained. Hence, since the composition o f the
13
Page 29
microbial flora varies from one locality to the other and is also altered even in single site treated
with different plant residues, a single optimum for organic matter decomposition cannot be
found. Rather, a wide range, 28 to 40 °C, has been postulated, (Alexander, 1977). Below 25 °C,
the rate o f decomposition will accelerate with increased temperature. The high rate o f organic
matter decline in tropical soils has been attributed to the higher temperatures than in the
temperate regions. Above 40° C, organic matter decomposition again slows down, except where
thermophillic organisms abound (Alexander, 1977).
Liski et al. (1999) also showed that carbon storage in soils o f both high- and low-
productivity boreal forests in Finland actually increased with increasing temperature, thereby
putting to rest the idea that rising temperatures will enhance carbon losses from soils and trees
and exacerbate global warming.
The effect o f temperature on microbial activity is that activity increases with rising
temperature until there is some interference with life processes o f the microbes or unless the soil
first becomes relatively dry. Microbial activity normally halts in dry soil (Bowman et al. 2002).
The higher rates o f decomposition above 35 °C are associated with higher rates o f respiration.
Carbon dioxide evolution continues to increase and remains higher at temperatures up to about
70 °C but the decomposition is probably more chemical than biological at temperature above
50 °C.
2.4.1.5.2 Moisture content of soil
Organisms differ in their response to the moisture content o f their environment. In
general, fungi and actinomycetes are relatively tolerant to low moisture potentials (White, 1979).
According to W ilson and Griffin (1975), an active micro-flora is maintained down to a soil
14
Page 30
moisture potential o f approximately -1500 kPa while bacteria become inactive below -800 to
1500 kPa. Maximum microbial growth and activity require the presence o f sufficient water and
therefore decomposition o f organic matter is very slow in dry soils. On the other hand, because
oxygen is required in microbial metabolism, decomposition is faster under aerobic conditions.
At very high soil moisture contents the rates o f microbial activity and decomposition are
decreased due to lack of oxygen (Yoshida, 1975). Thus, saturation of the soil with water
impedes the diffusion o f oxygen into the soil hence maximum decomposition occurs in soils that
are near field capacity.
Vigil and Sparks (2002) noted that decomposition is slow at soil water contents with less
than 40 % water- filled pore space (barely moist to the touch but not dusty dry) and stops in soils
that are air dry. Glenn et al. (1993) also indicated that soil carbon decomposition is dependent
on soil moisture and so dry soils are less likely to lose carbon. In swampy areas, the slow rate of
decomposition results in the formation o f peaty soils, containing very high amount o f organic
matter (White, 1979). W ater-logging impede loss in organic matter with the accumulation of
large amounts o f organic acids as intermediates o f the decomposition process.
2.4.I.5.3. Soil pH
Many changes in soil microbial populations and activities occur as soil pH changes.
Characteristically, the population shifts from bacteria to actinomycetes and then to fungi as soil
pH declines, although acid tolerances o f individual species vary widely, (Alexander, 1980).
Carbon mineralization is most rapid in neutral to slightly alkaline soils, (Alexander, 1977). Soil
pH has little effect, except below 4 when the decomposition rate slows as in the case o f mor
humus and many upland peats, (White, 1979). The treatment o f acid soils with lime accelerates
15
Page 31
the decay o f soil organic matter, (Edmeades et al., 1981). Thus liming o f acid soils enhances
carbon dioxide volatilisation.
2.4.1.5.4 The carbon: nitrogen ratio of the soil
The ratio o f the percentage o f carbon to that o f nitrogen is termed the carbon: nitrogen
ratio, or the C:N ratio, which is the relative quantities o f these two elements in fresh
organic materials, humus, or in the whole soil body (Thompson, 1957). Considering the
diversity o f soil, climate conditions and the plant materials entering soils, it is truly remarkable
that the C:N ratio o f soil organic matter as a whole is quite stable and differs little from that
of humus which ranges from about 8 10:1 (Miller et al., 2004) to 10-12:1 (McGill et
al., 1981; Juma and McGill, 1986).
When organic materials with a C:N ratio o f greater than 30 are added to soils, there is
immobilization o f soil nitrogen during the initial decomposition process. For ratios between
20 and 30, there may be neither immobilization nor release o f mineral nitrogen. I f the organic
materials have a C:N ratio o f less than 20 there is usually a release o f mineral nitrogen early in
the decomposition process (Thompson and Troeh,1978). During the initial stages o f the
decomposition of fresh organic material, there is a rapid increase in the number o f heterotrophic
organisms accompanied by a large evolution o f carbon dioxide. I f the C: N ratio o f the fresh
material is wide there will be net immobilization. As decay proceeds, the C: N ratio narrows
and the energy supply (carbon) diminishes. Some o f the microbial populations die because of
the decreased food supply, and ultimately, a new equilibrium is reached (Tisdale and Nelson,
1966). The attainment o f this new equilibrium is accompanied by the release o f mineral
nitrogen resulting in the final soil level having nitrogen higher than the original level. There
16
Page 32
may also be an increase in the level o f stable organic m atter or humus, depending on the
quantity and type o f fresh organic material originally added. The time required for the
decomposition cycle to run depends on the quantity o f organic m atter added, the supply of
utilizable nitrogen, the resistance of the material to microbial attack (the amount o f lignin, waxes
and fats present) and temperature and moisture level in the soil, (Tisdale and Nelson, 1966).
Alexander (1977) stated the critical C:N ratio for net N mineralization to occur to be less than
20 -30, whereas a C:N ratios greater than 30 would favour net N immobilization.
2.4.1.5.5. Cultivation /Tillage
The physical condition o f a soil affects crop residue decay. Severe soil compaction
caused by improper tillage or intense traction impedes both water and air m ovement into a soil.
Consequently, if the soil is left in that condition for an extended period, decomposition will be
less (Bowman et al., 2002). Cultivation enhances organic matter destruction. This is because
apart from chopping plants parts into smaller fractions, aeration is enhanced for fast microbial
activity. Cultivation and tillage o f soil tends to break down the structure so that organic matter
in sterile pore is exposed to micro organisms and its decomposition rate is accelerated, (White,
1979). Frequent and intensive tillage often accompanied by increased soil erosion tends to
accelerate decomposition and thereby reduces the amount o f carbon dioxide absorbed by
vegetation such that much o f the carbon dioxide remains in the atmosphere.
Disturbance o f soil aggregates by natural or anthropogenic (tillage) forces increases the
decomposition o f physically protected organic materials (Rice and Angle, 2004). Tillage
practices that conserve soil structure are important for increasing soil carbon storage and
retaining sequestered carbon. Long-term studies elsewhere showed that a no-tillage practice
17
Page 33
accumulated more soil carbon compared with tilled soils and the amount o f carbon stored was
also related to the amount o f precipitation on the site and crop rotation (Fabrizzi et al., 2004).
2.4.I.5.6. Texture and mineralogy
Texture affects drainage and aeration. Thus, because o f the high moisture content and
relatively poor aeration o f poorly- drained soils, organic matter and nitrogen content are
generally much higher in them than their better drained equivalent. Generally, soils high in clay
and silt are able to protect the protein nitrogen from degradation through organomineral
complexes that are formed, which then result in a high organic matter content o f the soil
(Nichols, 1984). Decomposition and humus formation is therefore low in coarse- textured soils
than in fine- textured soil (Brady, 1990). Thus, fine textured soils contain about twice as much
total organic matter as do sandy soils (Brady, 1990).
According to White (1979), the adsorption o f various compounds by clays and
sesquioxides generally serves to slow down their rate o f decomposition. The organic matter held
in the relatively stable pores in clay soils o f diameter < l|im is less accessible to microbial
attack. Positive correlations between soil organic carbon and clay contents have also been
observed (Schimel et al., 1985; Spain, 1990; Feller et al., 1991).
Soil texture and mineralogy affect the micro and macro structure o f soils and the binding
forces in soils that enable the formation of mineral-organic matter complexes in soil (Hassink,
1996). Since all primary plant compounds are susceptible (to varying degrees) to breakdown by
enzymes produced by soil micro organisms, the role o f soil minerals in ‘protecting’ organic
matter (by restricting its accessibility to enzymatic action) is crucial in stabilizing organic matter
in soil over longer periods o f time.
18
Page 34
I t’s been well accepted that soil texture is a key variable affecting soil organic carbon
(SOC) stocks- sandy soils have low organic matter contents and SOC stocks tend to increase
with increasing proportions o f silt and clay (Burke et al., 1989). Greater attention in the past has
been placed on organo-mineral complexation due to negative charges on clay surfaces that
enable an electrostatic binding to negatively charged organic colloids via positively charged
metal cations (e.g. Ca2+, Mg2+). Thus, 2:1 clays (e.g. smectites), have more negative surface
charge,and more effectively stabilized organic matter compared to more low charged clay
minerals such as 1:1 clays (e.g. kaolinite) (Hassink et al., 1997).
2.5 Processes involved in organic matter decomposition
The dynamic nature o f soil organic matter cannot be over emphasized. Plant residues
undergo extensive alteration in the soil before they become humus. Various types o f micro
organisms attack the residues and decompose their constituents. The residues serve as a source
o f nutrients and energy for the life processes o f the micro organism. As plant materials are
added to the soil, as much as two-thirds o f the carbon may be lost to the atmosphere as CO2 in a
single season as a result o f decomposition (Feng and Li, 2001a). Subsequent decomposition,
however, slows resulting in accumulation o f stable organic carbon in soils. The gross turnover
time o f soil organic carbon, expressed as the ratio o f total amount o f organic carbon in the soil at
steady state to the annual rate of addition, can be more than 20 years in temperate regions (Stout
et al., 1981).
Residues added to the soil are first broken down to their basic organic components by the
extracellular enzymes produced by heterotrophs (White, 1979). The number and type o f flora
19
Page 35
involved in the decomposition process depends on the type, quantity and availability o f the
organic matter (Campbell, 1978).
Each individual organism has its own complex enzymes which allows it to decompose
certain chemical compounds. The first group o f heterotrophs (the primary flora) attack the basic
components o f the added carbonaceous substances: these are succeeded by the secondary flora
which thrives on the cells and by-products o f the primary flora. Addition o f simple sugars
causes proliferation o f bacteria, starch stimulates actinomycetes, cellulose benefits fungi while
the proteins and amino acids influence spore-forming bacilli (Alexander, 1961). The water-
soluble material decomposes first followed by cellulose and hemicellose at equal rates while the
lignin fractions become the most resistant and tend to accumulate in the soil (Alexander, 1961).
Thus, the percentage o f available carbon in a substrate decreases with time while the percentage
o f resistant materials increases (White, 1979). There is an increase in lignin percentage in the
substrate with time regardless o f the environment. An increase in microbial cell constituents
also occurs. There is an apparent decrease in OH groups and OCH3 (in lignin) and an increase in
COOH groups which are reactive and responsible for cation exchange (McBridge, 1994).
Cation exchange capacity o f decomposing material increases soil nutrient content.
There is also a change in the elemental composition o f the decomposing material during
decomposition. The mineralization o f carbon is unique because its end-products (carbon dioxide
and methane) are volatile and so can be lost to the atmosphere (Thien and Graveel, 1997). The
N:P ratios tend to increase as decomposition proceeds, except in cases where nitrogen products
are volatile so that only a small percentage remains. On the other hand, higher litter nitrogen
concentrations generally lead to higher initial rates o f CO2 loss from decomposing plant litter.
This might be viewed as a negative outcome, but over the longer term it appears that initially
20
Page 36
enhanced loss o f CO2 from the soil-litter ecosystem is more than compensated for by enhanced
carbon savings stimulated by the addition of nitrogen (Hu et al., 2001).
After a quarter to a third o f the original plant litter has decomposed and has disappeared,
decomposition tends to become slower where there is a higher N concentration in the litter. A
reason for the deceleration has been attributed to an increase in concentration of the stable
lignin. Also, several species o f fungi with the ability to decompose lignin via lignin-degrading
enzymes do not seem to be able to produce the necessary enzymes in the presence of plentiful
N-rich compounds. This failure to synthesize the enzymes may be related to a scarcity o f
manganese, the concentration o f which often has been observed to decline as soil nitrogen
availability rises (Berg and Matzner, 1997).
The C:N ratio o f plant material entering the soil may vary from 10 for green legumes to
more than 50 for straws. (Thompson and Troeh, 1978). The C: N, C: P, C: S ratios therefore
decrease with time until equilibrium is reached. According to Larson et al. (1972) the C: N, C:
P, N: P and N: S ratios increased with increasing rate of residue addition while the S: P ratio
remained relatively constant. The equilibrium level is therefore determined by the composition
and demands o f the microbial cells. While a high rate o f organic matter decomposition is a good
index o f microbial activity, it may not correspond to maximum number o f micro organisms.
Studies indicate that the maximum number o f microbes is between 300 and 350 (Thompson,
1957).
2.6. Contribution of cereal and legume residues to carbon sequestration
The chemical compositions of various crop residues differ greatly in the amount of
carbon dioxide produced when added to the soil. Studies by Abdurahman et al. (1998) illustrate
that even within one crop group, large differences in organic matter production occur. The
21
Page 37
studies showed that dry leaf production from pigeon pea yielded 3 t ha ' 1 whilst that o f cowpea
produced only 0.14 t h a '1. This shows that the choice o f crop has a major influence on how
much carbon can be sequestered by an agricultural system. Curtin et al. (2000) demonstrated
the advantage o f cereals over legumes for achieving maximum carbon sequestration. According
to them whilst black lentil fallow in semi-arid regions o f Canada added between 1.4 and 1.8 t
C h a '1, a wheat crop would add 2-3 times this amount o f carbon annually.
Works done by Grant and Bailey (1994) also indicate that residues from cereal crops
contain much more carbon than nitrogen and may stimulate micro organism to tie up nutrients.
In contrast, legume residue has more nitrogen, which favours nutrient release by micro
organisms. O f the plant residue returned to the soil, about 15 % can be expected to be converted
to passive soil organic carbon (Lai, 1997). Gregorich et al. (1998) reported that although the
chemical composition o f the plant residue affects its rate o f decomposition there is little effect
on the organic matter formed.
According to Hu et al. (2001), the key factor responsible for enhanced carbon storage in
grassland sites is the high carbon input derived from plant roots. It is this high root production
that provides the potential to increase soil organic matter in pastures and vegetated fallows
compared to cropped systems. Root debris tends to be less decomposable than shoot material
because o f their higher lignin content (Woomer et al., 1994). Consequently, the key to
maintaining and increasing carbon sequestration in grassland systems is to maximise grass
productivity and root inputs (Trumbore et al., 1995).
Grasses have also been shown to sequester more carbon than leguminous cover crops
(Lai et al., 1999). Hence, because o f the high C: N ratio o f grasses, their residues decompose
slowly and soil nitrogen availability may be substantially decreased following their
22
Page 38
incorporation into the soil. Grasses also have the potential to sequester carbon on previously
degraded land. Garten and W ullschleger (2000) using a modelling approach estimated that a 12
% increase in soil carbon could be obtained under switchgrass (Panicum virgatum L.) on a
degraded land for ten years.
2.7 Techniques for estimating carbon sequestration potential
Rapid and accurate measurement o f carbon in soil samples is essential to evaluate the
amount o f carbon that can be sequestered in soils and for modelling global change. Two options
are available to this purpose, direct experimental measurement and monitoring and predictions
with soil organic carbon models (Bruce et al,. 1999). To be o f practical value to the producers
and farmers, these changes need to be evaluated over relatively short periods, from a few years
to a decade. Changes o f soil organic carbon, however, is slow and occurs over much longer
time periods (Bruce et al., 1999).
Direct measurement and monitoring o f soil organic carbon changes over short periods
must deal with uncertainties o f sampling and measurement errors, and more importantly,
uncertainties resulting from non-uniformity o f field soils. The most direct means o f determining
soil carbon sequestration is to measure over time sequential changes in soil carbon. Such
measurements are complicated by the spatial and temporal heterogeneity o f soil carbon
contents and its slow relative rate o f change.
Soil carbon can exhibit significant field-scale variability due to spatial varying
topography and parent material or past differences in vegetation or management history. Even in
seemingly ‘uniform’ fields, soil carbon contents can vary by as much as 100 % (Elliott, 1994).
In addition, the seasonality o f plant growth and decomposition processes can cause temporal
variability in carbon fractions, in roots, plant litter and microbial biomass. Finally, short-term
23
Page 39
changes in total carbon can be difficult or impossible to detect against the large ‘background’ of
carbon already present in the soil.
Many o f these problems can be overcome through the use o f well-designed sampling and
analysis procedures that minimize effects o f spatial and temporal variability and standardize
sample preparation (Bruce et al., 1999). Measurement o f specific soil carbon fractions may be
useful as early indicators o f change, although it may still be necessary for monitoring periods of
several years to verify changes in total soil carbon. M ost data on soil carbon changes in
agricultural soils are derived from long-term field experiment (Paul et al., 1997). Where
treatments have been properly randomized, significant differences in soil carbon as a function of
different agricultural management practices can be statistically inferred.
Prediction based on models validated against available experimental evidence is another
option. Models are used to investigate how soil organic matter varies across regions and
landscapes as a function o f climate, vegetation, topography, soils and other environmental
factors. The most widely used simulation models conceptualize soil organic matter as being
composed o f 3 to 4 fractions, which vary in physical and chemical properties affecting turnover
rates (McGill, 1996). Crop residues are similarly subdivided into 2 to 3 fractions varying in
decomposability.
The environmental factors controlling soil organic matter in most models include soil
temperature and moisture, soil aeration or drainage class, soil texture and mineralogy. The rate
of organic matter input as crop residues, manure, sludge, or other amendments is a major
determinant o f soil carbon levels. Some models simulate crop growth and residue inputs
directly, while others require that organic matter addition rates be specified as inputs to the
model. Intergovernmental Panel on Climate Change guidelines addresses empirical modeling.
24
Page 40
The use o f soil organic matter models range from the field level (Jenkinson et al., 1987) to
regional (Parton et al., 1987) and global applications (King et al., 1996).
Thus, in formulating models, the following must be noted: The model must be easy to
use, based on sound theoretical description o f soil organic carbon processes and contains only
parameters that are physically meaningful and experimentally measurable. The models must also
be able to reproduce both the quick decomposition o f plant residues within a single season and
the very old organic carbon deposits in soils with which it could be considered valid for
predictions in both the short term changes in soil organic carbon, i.e., a few years to decades,
and for predictions in much longer term stabilization o f soil organic carbon (Bruce et al., 1999).
2.8 Modeling residue decomposition
Residue decomposition depends on the biochemical fractions o f the material (Heal et al.,
1997). The concentrations o f nutrients, structural carbohydrates, and other compounds (i.e.,
lignin and other polyphenols) ratios have been used as indices o f biochemical quality. More
specifically, great efforts have been devoted to develop a residue quality index that best
describes C and N residue release rates. For example, in incubation studies, total N
concentration (Frankenberger and Abdelmagid, 1985) or its inverse (Quemada and Cabrera,
1995) were reported to be the best indices for C and N residue release rates o f legume and grass
residues. Others identified soluble C (Oglesby and Fownes, 1992; Kuo and Sainju, 1998),
cellulose (Bending et al., 1998), or lignin (Muller et al., 1988; Giller and Cadisch, 1997) to be
most closely related to residue decomposition or C and N mineralization rates. Furthermore,
some ratios, such as lignin to N (Vigil and Kissel, 1991) or polyphenol plus lignin to N
(Constantinides and Fownes, 1994), have also been used as indice o f residue nutrient release.
Mechanistic models such as Century (Parton et al., 1994) use the lignin/N ratio to partition
25
Page 41
residue biomass into easily decomposable (soluble carbohydrates and proteins) and recalcitrant
(fibres and lignin) pools.
The biochemical components controlling residue decomposition change with time.
Soluble nutrients are more relevant at earlier decomposition stages and structural carbohydrates
or lignin at later stages (Heal et al., 1997). Consequently, the length o f the decomposition
period being analyzed will determine which fractions have more control or are more relevant in
residue decomposition. The C: N ratio (C: N) is the most widely used index o f residue quality
and predictor o f decomposition rate (Heal et al., 1997). However, the use of the initial C:N of
the residues does not consider the availability o f these nutrients for microbial growth.
Consequently, it has failed to be a reliable predictor o f decomposition or, mineralization (Smith
et al., 1992; Honeycutt et al., 1993; McKenney et al., 1995). Vigil and Kissel (1995) concluded
that N mineralization parameters were estimated poorly by C: N, especially when C: N ranged
from 1 0 to 28.
Gilmour et al. (1998) also concluded that decomposition rate variations among years
and type o f residues were not related to crop species, year, N content, and /or C: N. These
authors intimated that the variability in the kinetic parameters needs to be explained. It is
therefore accepted that dynamic models that include a more detailed description of
decomposition o f the various chemical compounds are needed to improve prediction o f C and N
turnover (Dendooven et al., 1997; Heal et a l , 1997). Earlier report suggests the use o f C and N
concentration in the residue soluble fractions as a better indicator o f residue C and N release
processes (Cochran et al., 1980; Reinertsen et al., 1984; Henriksen and Breland, 1999).
Bowman (1990) described a progression in the efforts to model plant residue
decomposition and soil organic matter dynamics. The earliest models o f litter decomposition and
26
Page 42
soil organic matter dynamics were first-order decline functions. According to Swift et al. (1979)
this type o f model is useful in the description o f rapidly decomposing leaf litters and for readily
metabolisable substrate additions such as carbohydrate. An advantage o f this mathematical
approach is that the exponential decline coefficient (k) can be compared between substrates and
sites when this coefficient is calculated on a relative basis (litter remaining/ initial litter) and the
units o f time are the same.
Work done by Jenny et al. (1949) and Greenland and Nye (1959) indicate that the first-
order exponential decline functions assume a constant decline in absolute terms. Swift et al.
(1979) also showed that many coniferous and broad leafed litter materials are well described by
this decline function, as are the individual components o f the litter material. A difficulty with
this approach is that while the function is asymptotic, the remaining material approaches zero at
the same proportional rate as does the increment o f decomposed material, not allowing for the
effect o f a more recalcitrant fraction as decomposition progresses. The assumption is that all
added organic materials become entirely mineralized at the same rate throughout the
decomposition process.
The K-Model developed by Feng and Li (2002) takes a different approach. The K model
recognised that carbon dynamics in soils can be represented by three basic processes. Thus, plant
material entering the soil is divided into compartments with different rate constants to account
for both the initial, fast decomposition and subsequent slow decomposition (Jenkinson and
Rayner, 1977; McGill et al., 1981; Van Veen and Paul, 1981; Parton et al. 1983, Parton et al.,
1987; Jenkinson, 1990; Smith et al., 1997).
Plant residue added to the soil, including manure and other organic materials, is
characterized by a metabolic fraction o f relatively fast decomposition and a more resistant
27
Page 43
structural fraction. The relative quantities o f the two fractions are determined by the C: N ratio
o f the plant residue. For example in Roth Carbon model (Jenkinson, 1990), soil organic carbon
is divided into decomposable and resistant plant materials (representing the annual input into the
soil) and biomass and physically and chemically protected soil organic matter. The rate
constants used to describe these compartments range from 4.5 /year for decomposable plant
material to 3.5-10 /year for resistant soil organic matter.
Particularly the Century model has been used widely in climate change compartments.
Frissel and Van Veen (1981) developed an N transformation model based on four stages o f
organic matter transformation. The stages used in the model are: (1) C: N ratio controls
mineralization and immobilization. (2) Consideration was made for differences in
decomposition rates o f organic compounds in plant residues for amino acids, cellulose, lignin
fractions and microbial mass (in this stage the authors assumed that the organic matter
decomposition is controlled by C uptake by the biomass rather than the C/N ratio). (3) N
transformations were incorporated into a multi-layer soil model. (4) Soil organic m atter (SOM)
fractions were incorporated into the C and N pool.
The model was based on the assumption that soil organic matter can be represented by
several carbon and nitrogen pools. The biomass growth rate was controlled by the carbon
availability from the added soil pool, and it was assumed that there was no change in the
microbial population if no carbon was added to the soil. Nitrogen immobilization was
proportional to biomass growth and it was assumed that mineralization occurred simultaneously
and independently o f immobilization. The authors used the C:N ratio to characterize
mineralization and immobilization. They assumed that if the C:N ratio was less than 20 or 30,
then net mineralization occurs; otherwise, net immobilization occurs (Donigan, 1994).
28
Page 44
2.9. Importance of organic matter
The significance o f soil organic matter to soil fertility is that it influences so many
different soil properties. It is a dual source and a sink for nutrient elements which can form
organic moieties (Mulongoy and Merckx, 1991). It has physical and chemical properties which
facilitate aggregation with mineral particles, particularly clays, and in turn modify soil physical
structure and influence soil water regimes. It is a source o f energy for the soil biota and thus
influences many o f the biologically-mediated processes o f soil. Thus, soil organic matter itself
represents a set o f attributes rather than an entity.
Organic matter content is higher under grassland vegetation than under forest cover (Hu
et al., 2001). Some o f the functions of organic matter are that in fine textured soil it helps to
maintain good soil structure (Allison, 1973). It also increases the cation exchange capacity,
thereby reducing leaching losses o f elements such as potassium, calcium and magnesium.
Report by Allison (1973) indicate that the organic matter o f most mineral soils accounts for
about 30-65 % o f the total cation exchange capacity (CEC). For instance, in sandy and organic
soils, more than 50 % o f the CEC is likely to be due to the organic component o f the soil.
Allison (1973) stated that the organic matter o f different soils vary greatly in their CEC. The
more humified the organic matter the higher its CEC. Grim (1953) also gave values for
kaolinitic, illitic, vermiculitic and montmorillonitic clays as 3-15, 10-40, 100-150 and 80-150 c
mol/kg, respectively. Organic matter serves as a reservoir for soil nitrogen and improves soil-
water relation; its mineralization provides a continuous though limited supply o f nitrogen,
phosphorus and sulphur to the crop.
29
Page 45
CHAPTER 3
M ATERIALS AND METHODS
3.1. Experimental site
3.1.1 Location and physiography
This study was conducted within the framework o f an on-going experiment to assess the
contribution o f 7 fallow management systems involving different plant species to soil carbon
storage within a maize-cropping system at Kpeve (Lat, 6 0 43.45’N, Long 000 0 20.45’E) in the
Volta Region o f Ghana, and also within a similar cropping system at the University o f Ghana
Farm, Legon (Lat 5° 39’N and Long 0° 11 ’W). The location o f the project at Kpeve falls within
the Forest-Savanna transition zone which receives about 1400 mm rainfall annually. The
vegetation consists o f scattered trees and grasses such as elephant grass. At the University Farm,
Accra, annual rainfall received is between 635-1143 mm and the ecological zone is the Coastal
Savanna.
3.2 Soils and sampling
The soil from Kpeve is classified as Haplic Lixisol (WRB, 1998) which has a dark
greyish brown top soil and greyish brown to brown sub soil. The soil contains abundant small to
large sized quartz stones and moderate amounts o f low activity clay, (Adiku et al., 2003
unpublished). The soil was sampled from a 0-20 cm depth at the Experimental Site o f the
Ministry o f Food and Agriculture Station at Kpeve in the Volta Region.
The soil from the University o f Ghana Farm, Legon is classified as Haplic Luvisol
(WRB, 1998). Morphologically, the soil is deep to very deep, varies from red to brown,
moderately heavy to medium-textured soil and devoid o f concretions and gravel at least to 0 . 6 m
30
Page 46
from the surface. The soil has developed from weathered products o f tertiary sands (Brammer,
1962). The soil, among others, is good for both mechanized and hand cultivation in the coastal
savanna areas o f Ghana (Acquaye and Laryea, 1982; Ahenkorah et al., 1994). Both the soil at
Kpeve and die University Farm are well drained and contain large amounts o f low activity clays.
The soils sampled from Kpeve were air-dried, roots and other debris removed and then
lightly ground and passed through a 2mm sieve. The sieved soil samples were stored in sacks
and kept in cupboard for further use. The physico-chemical properties o f the soil are determined
as described below.
3.3 Determination o f physico-chemical properties of the Haplic Lixosol
3.3.1 Soil texture
The various particle fractions were determined using the hydrometer method
(Bouyoucos, 1962). Forty (40) grammes o f the fine earth fraction o f the (< 2mm) soil was
dispersed in a 5 % 100-ml sodium hexametaphosphate solution prepared by dissolving 50g o f
calgon in a litre o f water.
The suspension was allowed to stand for about 10 min followed by mixing for 5 min
with a Vortex mixer after which the suspension was transferred into a sedimentation cylinder
and brought to 1 Litre mark wht the addition o f distilled water. The suspension was allowed to
equilibrate and the initial temperature taken. A plunger was inserted close to the bottom o f the
cylinder and the suspension stirred vigorously by moving it up and down several times (about 1 0
times). Timing was started immediately with a stopwatch and the hydrometer reading was taken
at 5 mins and at 5h from the time of mixing the suspension. The sand fraction was recovered by
decantation and the dry weight recorded after it had been oven-dried for 2 days and cooled in a
31
Page 47
dessicator. The clay and silt fractions were determined by the difference in the 5 mins and 5hr
readings. The percentage clay and silt were estimated by the fraction contained in the amount o f
soil taken. The textural class o f the sand, silt and clay were determined using the USDA textural
triangle.
3.3.2 Field capacity determination
A 1 3 0 0 g soil sample was weighed into a 1.2 L plastic pot with drainage holes
underneath. The soil sample was packed in the pot to an average bulk density ( D b ) o f about 1 . 3
kg/m3 which approximated that o f the field soil and about 1 0 0 0 ml o f water was added until the
soil became saturated and began to drain from the bottom. The wet soil was allowed to drain for
48 hours, while the surface was covered with plastic sheets to prevent evaporation. Thereafter,
the gravimetric water content (0 g) o f the soil on was determined after oven drying at 1 0 5 ° C for
24 hours according to the formula
B g = Mw g/g (3.1)
Ms
where: Mw = Water in soil (Initial weight o f soil when m oist - Oven dry weight) / g
Ms = W eight o f oven dry soil/ g
The results obtained multiplied by the bulk density ( D b ) gives the volumetric moisture content
{9 „), Dw = Density o f water. (Phogat et al., 1999).
9 „ = 9 „ * Dk (3.2)
Dw
32
Page 48
3.3.3 Soil pH
Soil pH was measured in 1:1 (soil: water) suspension using the electrode MV 8 8
Praitronic pH meter. A 20 g soil sample was weighed in a 50-ml beaker and 20 ml o f distilled
water added. The mixture was stirred with a glass rod for 30 minutes and allowed to stand for 1
hour. The pH o f the suspension was read on the electronic pH meter and recorded as pH in 1:1
soil: water ratio.
3.3.4 Organic carbon
The Walkey - Black method as modified by Allison (1965) was used to determine
the organic carbon content o f the soil. Potassium dichromate (IN , 10 ml) solution and 20 ml of
concentrated (98 %) sulphuric acid (H2SO4) were added to a 0.5 g soil (which had been passed
through a 0.5 mm sieve) in an Erlenmeyer flask. The flask was swirled round and allowed to
stand for 30 minutes and 200 ml o f distilled water was added, mixed and allowed to cool. The
residual dichromate remaining in solution after the oxidation o f the oxidizable organic material
in the soil sample was titrated against 0.2 N ammonium ferrous sulphate solution after 10 ml of
orthophosphoric acid (85 %) and 2 ml indicator solution (barium diphenylamine sulphate) have
been added and titrated to a green end-point. A blank in which the same procedure was
followed but without any soil sample preceded the soil as a check. The carbon content (OC) was
calculated as follows.
% Q C = n 0 - X * N ) 0.3 * 1.33 (3.3)
W
Where X =Volum e o f ferrous ammonium sulphate solution titrated.
N = Normality o f ferrous ammonium sulphate solution (10/ Volume o f ammoniun
sulphate titrated with the blank.
33
Page 49
W = W eight o f soil sample taken.
0.3 = milliequivalent weight o f Carbon
1.33 = correction factor. Walkey and Black averaged 77 % recovery o f organic carbon
(OC) by this method and introduced this correction factor.
The percentage organic matter (OM) was estimated by multiplying percent organic
carbon by 1.724, the Van Bemmelen factor.
3.3.5 Total nitrogen
The Kjeldahl method (Hesse, 1971) was used to determine total nitrogen. A 2 g soil
sample was put into a micro Kjeldahal flask and lg o f digester accelerator (lOg K2SO4 + lg
CUSO4 5 H2O and 0.1 g selenium) added. About 1 ml distilled water was added to moisten the
soil and 5 ml concentrated Sulphuric acid also added.The flask was put on a digestor and the
mixture was allowed to digest for at least two hours until the digest became clear. It was then
allowed to cool and then transferred with distilled water into a 50 ml volumetric flask and made
up to the volume. A 5 ml aliquot was put into a Markham distillation apparatus and 5 ml o f 40
% NaOH was added and distilled. The distillate was collected into a 5 ml (2 % boric acid) to
which about three drops o f a mixture of methl red and methelene blue indicator solution had
been added. The distillate was titrated with 0.01 N HC1 from a green to an indicator reddish end
point. Total Nitrogen was calculated using the formula.
% Nitrogen = N *X *50*0.014*100 (3.4)W * V
N= Normality o f HC1 used. (N)
X= Volume of HC1 used for the titration (ml)
34
Page 50
V= Volume o f filtrate (aliquot used for the distillation (ml)
W = W eight o f soil used for the digestion (g)
3.3.6 Exchangeable Bases
10 g soil was weighed into an extraction bottle and 100 ml o f IN ammonium acetate
solution was added. The mixture was shaken for one hour after which the content was filtered
through a No. 42 Whatman filter paper. Aliquots o f the extract were used for the determination
o f Ca2+, Mg2+, K+ and Na+.
Calcium was determined by taking 10 ml aliquot o f the sample solution and adding 10
ml o f potassium hydroxide and 1ml o f IN triethoanolamine. About three drops o f potassium
cyanide (10 % w/v) solution and a few crystals o f cal-red indicator were added. The mixture was
then titrated with 0.02N EDTA solution from red to a blue end point.
Exchangeable Ca and Mg were determined by pipetting 10 ml aliquot o f the sample
solution and adding 5ml o f ammonium chloride -ammonium hydroxide buffer solution and 1ml
triethanolamine. Potassium cyanide solution and Erichrome Black T solution (0.2 g
Erichrome Black T indicator dissolved in a mixture of 50 ml methanol and 2g
hydroxylamine hydrochloride) o f about three drops each were also added. The mixture was
then titrated with 0.02 N EDTA solute ion from red to a blue end point. The amount o f
exchangeable Mg was estimated as the difference between this titration and that o f Calcium.
Exchangeable Na and K were determined using the flame photometer by calibrating the
photometer with standard 10 ppm Na+ and K1' solutions and reading the Na+ and K+
concentrations of the extractant.
35
Page 51
3.3.7 Cation exchange capacity
A 10 g soil sample was put into an extraction bottle and 100 ml o f IN ammonium acetate
solution was added. The bottle with its content was shaken for 30 mins on a mechanical shaker.
The content was filtered through a No.42 W hatman filtered paper. The sample was then leached
four times with 25 ml o f 0.0 IN methonol to wash o ff excess ammonium. Another 25ml portion
o f acidified potassium chloride was used to leach the soil four times. An amount o f 5 ml o f the
leachate was transferred into a Kjeldahl flask, and 5ml o f IN sodium hydroxide and some
distilled water were added. The distillate was collected into 5 ml boric acid and then titrated
with 0 .0IN hydrochloric acid from greenish to a violet end-point. The cation exchange capacity
(CEC) was calculated using the principle o f normality and the value expressed in c mol (+)/kg
3.3.8. Available phosphorus
The available phosphorus was determined according to the method by Bray and
Kurtz (1945). A 10 g soil sample was put into an extraction bottle and 50 ml o f extractant
(0.03N NH4F in 0.025N HC1) was added and shaken for about two minutes on a mechanical
shaker. It was filtered and an aliquot o f 5 ml was used to develop the colour using the Murphy
Riley (1962).method
A 20 ml aliquot o f the sample was put into a 50 ml volumetric flask. The pH was
adjusted by adding drops o f p-nitro phenol indicator and few drops o f 4 N NH 4OH until the
solution turned yellow. Then 2 ml o f reagent B (1.056g o f ascorbic acid in 200 ml o f reagent A)
was added. Reagent A was made by dissolving 12 g o f ammonium molybdate in 250 ml of
distilled water and adding 0.2998 g o f antimony potassium tartarate. The dissolved reagents
36
Page 52
were added to 1000 ml o f 5N H 2S O 4 (148 ml conc.H 2SC>4 per litre) and mixed thoroughly and
made up to 2 L. The solution was made up to volume with distilled water, and a blank was also
prepared using the same procedure but without the soil. The spectrophometer was calibrated
using standard phosphorus solution by pipetting 5 ml o f the standard phosphorus solution (5
ppm) into a 50 ml volumetric flask and adding 2 drops of ammonium solution and p-nitro
phenol solution and 8 ml o f Reagent B and distilled water to develop the colour. The intensity of
the colour at a wavelength o f 712 nm was measured with the spectrophotometer and recorded.
Available phosphorus/mg/kg= V * (R1-R2) (3.5)
m * vi
V= Volume o f extractant used
Rl= Sphectrophotometer reading for the aliquout used
R2 ~ Sphectrophotometer reading for the blank.
W= Weight o f soil used.
Vl= Volume o f aliquot taken for the reading.
3.4 Green house residue incubation studies
3.4.1 Introduction
Residues o f different fallow plants from the fallow management experiment at Kpeve
briefly described in Table 3.1 were used for the incubation studies. The fallow plants described
in Table.3.1 were planted at the onset o f the minor season o f September 2003 after the major
season (May to June) maize. Only treatment RT5 benefited from the residual fertilizer o f the
previous maize crop. In all other cases, the previous maize was unfertilized. The fallow plants
37
Page 53
were harvested in March 2004 and kept in a cold room until their use in this study in June 2004.
Treatment RT6 is included as the control.
Table 3.1. Description o f plant residues used in the incubation study
38
Designation o f Residue Description
RT1 Pennisetum spp (elephant grass) obtained from natural- fallow following
unfertilized maize.
RT2 Cajanus cajan (Pigeon pea) residue following unfertilized maize
RT3 Vigna unguiculata (Cowpea) residue following unfertilized maize
RT4 Mucuna pruriens (mucuna) residue following unfertilized maize
RT5 Pennisetum spp (elephant grass) following fertilized maize.
RT6 Residue free (control)
3.4.2 Plant residue
The fallow residues (essentially made up o f leaves and stems) were chopped into about
2-3 cm lengths and thoroughly homogenized. The materials were oven dried in brown paper
bags at a temperature of 60 °C for 72 hours until samples attained constant weight. Thereafter, a
portion o f each residue type was ground for the determination o f oxidizable carbon, nitrogen and
phosphorus. The carbon content o f the plants was determined following the wet oxidation
method of Walkey -B lack as modified by Allison (1965) but in this case, 0.2 g o f ground plant
residues was used. The nitrogen content (0.2 g sample) was determined using the Kjeldahl
Page 54
method. Total phosphorus content was by digesting 0.2 g o f plant sample with 5ml concentrated
H2SO4 and further oxidized with H2O2 (35%) reagent on a sand bath. The digest was thoroughly
mixed with distilled water and made up to 100 ml. 5 ml o f the solution was taken for colour
development using the Murphy and Riley (1962) method.
3.4.3 Pot experiment
Eight hundred gram sieved (2 mm) soil samples were packed into 1.2 L pots to the same
bulk density as stated in section 3.3.2. The pots had holes at the bottom to allow free drainage
and uptake o f water from below. Litter bags o f 10 cm x 6 cm size were prepared from mosquito
netting and 8 g o f dried residue samples were placed in them. The plant residues in their litter
bags were then placed horizontally at a depth o f 1 cm below the soil surface in the pot. The soils
in the pots were brought to three moisture levels; field capacity (FC) = W l, 70% FC = W2 and
40% FC = W3 and thereafter maintained by periodically weighing the pots and re-wetting. The
treatments were placed in the greenhouse at an average temperature o f 30 °C with a maximum
o f 32 °C and minimum o f 28 °C.
The experimental design was completely randomised design with 6 residue types and 3
water treatments. Residues from the pots were retrieved in triplicates 10, 20, 30, 50, 80, 120,
150 and 180 days after the onset o f the incubation studies. Thus, in total there were 432 pots in
all. A t each retrieval, the litter bags were emptied and the dry weight o f the material remaining
determined after oven drying at 60 °C for 72 hours. Further, the soil in the pots after each litter
bag retrieval was homogenized and analysed for carbon and total nitrogen content.
39
Page 55
3.5 Field studies
A field study was carried out at the University o f Ghana farm from July-September 2005
to compare the results in the green house with that in the field. The fallow management at the
University farm was similar to that at Kpeve. However, the soil at the University Farm was
different (Haplic Luvisol) from that o f Kpeve. Further, soil moisture content and temperature
could not be controlled on the field. The pH, CEC, Available P, Organic carbon and nitrogen
properties o f the soil were also determined.
Plant residues consisting o f Pennisetum spp, RT5 (Elephant grass following previously
fertilized maize), Cajanus cajan, RT2 (Pigeon Pea following unfertilized maize), Mucuna
pruriens, RT4 (Mucuna spp. following unfertilized maize) and a control RT6 which was a bare
plot kept weed-free were the treatments used. Plant residue treatment for Vigna unguiculata
(Cowpea, RT3) was not available at the on-set o f the experiment and so could not be considered.
The plant residues were from the previous minor season (October 2004 planting) harvest in
June. Plant residues grown in situ from an estimated plot area o f 1 m 2 were used for the study.
Unlike the greenhouse, fallow vegetation was planted in situ in the field. Plants growing
in-situ were harvested and their biomass determined. The biomass were equivalent to 2000
kg/ha, 2200 kg/ha and 3500 kg/ha for RT2, RT4 and RT5 respectively. The field studies
involved the incorporation o f 350 g plant residues into litter bags made o f 1 mm nylon netting
which were 72 cm in length and 42 cm in width. Plant residues were chopped to about 30 cm
length and buried 1 cm below the surface of the soil. The experimental lay out was Randomised
Complete Block Design with 4 replicates.
The litter bags were retrieved 10, 20, 30, 50 and 80 days after the onset o f the field study.
On retrieval, the litter bags containing the plant residues were thoroughly shaken to remove all
40
Page 56
soil particles and the contents emptied into brown paper bags. The residues were oven dried at
60 °C for 72 hours and weighed. Organic carbon content o f the soil taken at a depth o f 0-15 cm
on the day o f retrieval o f the residue was also determined. The soil o f the control (bare plot),
was sampled along side the other treatments on residue retrieval dates.
3.6 Statistical analysis
The data were subjected to analysis o f variance using the Genstat software. The
significance o f the treatments effects were tested at 5 % level o f probability. The Least
Significant Difference (LSD) was used to separate the means o f the treatments.
41
Page 57
CHAPTER 4
RESULTS AND DISCUSSION
4.0 Greenhouse studies
4.1 Soil physical and chemical properties
Table 4.1 shows some physical and chemical properties o f the Haplic Lixisol from the
Kpeve site. Soil texture is sandy loam as is typical o f soils o f the Togo series (Brammer, 1962)
and with a fairly high water holding capacity o f 0.23 g/g. Drainage and aeration would be
expected to be high in such a soil. Particle size distribution shows a 15 % silt and 20 % clay
content which are quite low. The texture is more o f the coarse type (Brady, 1990), hence
organic carbon content would also be low as the protein nitrogen are not well protected from
degradation and drainage.
Soil pH o f 7.5 is between neutral and slightly alkaline and therefore expected to support
nutrient availability by increasing rate o f decomposition since low pH retard decomposition,
(White, 1979). The dominance o f low activity clays (Adiku et al., 2003 unpublished) may
explain the low CEC value o f 26.72 cmol (+) /kg and the inherent fertility, even though the
available P o f 13.48 mg/kg is fairly high for tropical soils. According to Manu et al. (1991),
CEC for W est African soils depends more directly on soil organic carbon (r = 0.86) than on soil
clay content (r = 0.46). Organic carbon content o f (1.62 %) coupled with the low exchangeable
bases particularly calcium also reflect the generally low fertility o f the soil. The low organic
carbon content o f (1.62 %) is also typical o f most Tropical soils (Ankomah et a l , 1995). The
total nitrogen content o f (0.08 %) is also quite low and together with a C:N ratio o f = 20.3,
decomposition rates o f added materials could be fairly high.
42
Page 58
43
Table 4.1 Some physical (a) and chemical (b) properties o f Haplic Lixisol *
(a) physical
Particle size distribution Moisture content at field canacitv 2 /e Textural class
Sand % Silt % Clay %
65 15 2 0 0.23 Sandy loam
(b) Chemical
pH OC TN Avail.P Exchangeable bases ( c m ol(+Vkg)
( 1 :1) (%) (%) mg/kg Ca2+ Mg2+ Na+ K+ CEC
7.5 1.62 0.08 13.48 13.9 2.7 0.89 1.18 26.72
pH 1:1 Soil pH measured in 1:1 soil: water ratio CEC: Cation Exchange Capacity
OC % : Organic Carbon % TN %: Total Nitrogen %
Avail. P: Available Phosphorus mg/kg
* : All values are means o f 3 observations
Microbial growth in the soil requires the C: N: P ratios to be within the range of
120:10:1. for biodegradation o f organic substances (Alexander, 1977; Kowalenko, 1978). For
the Haplic Lixisol, the C: N: P ratio o f 16.2: 0.8: 0.0135 is quite good. Hence, microbial growth
in such a soil is expected to be quite favourable for decomposition processes.
Page 59
4.2 Some chemical characteristics o f the plant residues
Table 4.2 shows some chemical properties o f the plant residues from the Kpeve site. The
results indicate that the oxidizable carbon content (C) o f the residue is between 334.9 g/kg and
470.3 g/kg with the least value obtained for RT4 (M: Mucuna spp following unfertilized maize)
and the highest, RT1 (EG: Elephant grass following unfertilized maize) as shown below
Table 4.2:
44
Some chemical properties o f plant residues obtained from kpeve.
Residues type
Description
Carbon
g/kg
Total Nitrogen
g/kg
Total Phosphorus
g/kg
C: N C: P
RT1 (EG) 470.3 15.8 43.0 29.77 109.37
RT2 (PP) 404.6 20.3 53.0 19.93 76.34
RT3 (CP) 420.7 17.9 47.0 23.5 89.51
RT4 (M) 334.9 17.9 41.0 18.71 81.68
RT5 (EFF) 401.6 16.1 40.0 24.94 100.4
(EG = Elephant grass; PP = Pigeon Pea; CP = Cowpea; M = M ucuna spp., following
unfertilized maize) and EFF = Elephant grass following fertilized maize.
It has been widely reported that the total carbon concentration in plant tissue is very
stable and close to 400 g kg ' 1 (Honeycutt et al., 1993; Kuo et al., 1997). The values for carbon
in this study are close to this figure. W oomer et al. (1994) also indicated that on the average,
crop residues contain between 40-50 % carbon which is close to the range o f 33.5- 47 % carbon
content present in these plant residues. Although R T land RT5 are grasses, the high carbon
Page 60
content o f RT1 more than RT5 may be due to more structural polysaccharides nature o f the cell
The total nitrogen (N) content o f the plant residues also ranges from 15.8 g/kg to 20.3
g/kg with RT1 (EG) having the least value and RT2 (PP) the highest value respectively.
Generally, the legume residues unlike the grasses tend to have more N content due to the
nitrogen fixing ability o f the plant. This is through a symbiotic association with the nitrogen
fixing bacteria, Bradyrhizobium, in their root nodules (Brady, 1990). The N content o f the
residues particularly the legumes are however low as compared to the 2 % stated by Fox et. al.
(1990) for decomposition.
The C:N ratio o f the plant residues also ranges from 18.71- 29.77 with the lowest value
obtained for RT4 (M) and the highest for RT1 (EG). The C: N is dependent on the proportion
o f carbon and nitrogen present in the substrate as stated by Cowling and Merrill (1966). The
higher the proportions o f N present, the lower the ratio, while the greater the carbon content, the
higher the C: N ratio. The legume materials RT2 (PP), RT3 (CP) and RT4 (M) have lower C: N
than the grasses; RT1 (EG) and RT5 (EFF), because o f the high N content o f the plant obtained
from the nitrogen fixing bacteria in the root nodules (Brady, 1990).
It could also be noted that there is variation within the legumes. RT3 (CP) and RT4 (M)
have the same N content o f 17.9 g/kg (or 1.79 % N) yet their ratios are different. RT2 (PP) has a
high N content o f 2.03 %, yet it’s C: N ratio is more than RT4 (M). The difference in the C: N
o f the RT3 (CP) and RT4 (M) could be attributed to their carbon content. In addition,
considering the morphological nature of the plant materials, the constituents of cowpea cell wall
are o f more structural polysaccharides which have a relatively stable carbon concentration
(Chesson, 1997) unlike the mucuna which is herbaceous and therefore had less structural
45
Page 61
polysaccharides (Brady, 1990). Thus, the proportion o f carbon present in the former will
certainly be higher than the latter. The slightly lower C: N ratio o f the grasses; RT5 (EFF) than
RT1 (EG) may be attributed to the high N %, probably due to the residual fertilizer obtained
from the previously fertilized maize plot.
Generally, Buckman and Brady (1969 ) noted that the C:N ratio o f plant material is
variable ranging from 20:1 or 30:1 for legumes and farm manure to as high as 90:1 or even
more, in certain straw residues and to as high as 400:1 in sawdust. According to Thompson and
Troeh (1978) the break-even point for decomposition o f organic material is 32:1 while White
(1979) stated that C: N ratio > 25 results in net immobilization and < 25 net mineralization
occurs. Hence, materials with narrow C: N ratios tend to decompose about 50 % faster than
those that are deficient in nitrogen. Ease of decomposition would therefore be RT2 >RT4.
According to Fox et al. (1990), nitrogen content of plant material should be greater than 2 % for
mineralization to proceed while when less than 2 % immobilization generally occurs. This tends
to have an important implication for the decomposition processes and nutrient release by
different kinds and age o f plants. From Table 4.2, it will be only RT2 (PP) which would satisfy
this requirement.
Thompson (1957) indicated that P content o f organic material is approximately 0.5 %
and therefore by this the values obtained (0.4-0.53 % P) for the various residues are reasonable.
Generally, the P content o f legumes tends to be more than the grasses in agreement with the
report o f Maikslenien (2000) that cereals remove relatively little phosphorus from the soil. This
high P content o f legumes may be linked to the ability o f its roots to probably have more
phosphorus solubilizing bacteria around the root zone and therefore making it more accessible
46
Page 62
for the plant to use and conserve and also due to the fact that P is used for nodulation. (Brady,
1990)
It could also be observed that the C: P ratio o f the plant residue was high for the grasses
with values o f 100.4 and 109.37 for RT5 (EFF) and RT1 (EG) respectively whereas the legume
residues had lower values o f between 76.34 and 89.51. The wide C: P ratio o f the grasses is
expected to cause immobilization of phosphorus and therefore limit nutrient availiablity. The C:
P ratios o f the plant residues also show a similar trend like that o f the C: N. Lower values o f
76.34 to 89.51 were obtained for the legumes and higher values o f 100.4 and 109.37 for the
grasses. No clear explanation could be given but it could be attributed to the low P content of
the grasses and the high carbon content with the exception o f the M ucuna spp (M) in this case.
A study by Nziguheba (2001) reports C: P ratio for dry matter o f crop residue to be in the range
o f 140 -250. This shows that the values obtained were much lower as compared to the values o f
Nziguheba (2001). It is expected that the C: P ratio like the C: N may also have some important
effect on the decomposition o f the plant materials although more emphasis is laid on the C: N
ratio in this study.
4.3 Decomposition of residues during greenhouse studies
Residue decomposition is affected by many factors such as temperature, moisture, soil
pH, substrate quality and quantity. A t the greenhouse where temperature o f the environment was
monitored and substrate quantities were also the same, the effect o f the other variables such as
residue (type) and moisture could be assessed.
4.3.1 Effect of residue type
Figure 4.1 shows the variation o f residue dry weight with time for water treatment W1 (field
capacity) for (a) grass residue and (b) legume residue; observed data are symbols and fitted
47
Page 63
48
Fig.4.1: Variation o f residue dry weight with time for water treatment W1 (a) Grass
residue (b) Legume residues; observed data are symbols and fitted curves are lines.
Page 64
curves are lines. Generally, both graphs are curvilinear and decomposition pattern for the
grass (a) seems to be quite slower than for the legumes.
In order to assess the effect o f residue type, three dates were selected namely, the 20th,
80lh and 150th day to conform to two commonly observed phases o f decomposition namely, the
initial fast decomposition stage and the subsequent slow decomposition stage (McGill et. al.,
1981; Parton et. al., 1987; Jenkinson, 1990; and Smith et al., 1997). The results from this study
show that for the first 20 days o f incubation, decomposition patterns o f the grasses; RT1 (EG)
and RT5 (EFF) were somewhat similar with Fig.4.(la), having each lost 15 % o f their intial dry
weight, with soil water treatment W l. The legume residues generally showed a faster
decomposition pattern than the grasses as in Fig 4. (lb ). Dry weight lost for RT3 (CP) and RT4
(M) were 21 % and 24 % respectively while RT2 (PP) showed a much faster loss o f about 38
% o f the original weight by the 20th day o f incubation. This trend is in agreement with the
general view that lower C: N ratios lead to faster residue decomposition. These results also
suggest that residue N availability is more critical in controlling biomass decomposition. (Ruffo
and Bollero, 2003)
Significant differences in decomposition patterns became evident w ith time. It may be
deduced from Fig.4.1 (a) and (b) that the days to 50 % loss o f weight (half- life) was 58 days for
RT1 but only 38 for RT2 as shown in Table 4.3.
The rest o f treatments RT3, RT4 and RT5 had half lifes values between 34 to 40 days.
By 80 days o f incubation, RT1 (EG) lost a little over 50% o f its residue while RT2 (PP) lost
almost 75 %. The other plant residues lost about 60 % o f their initial weight by 80 days o f
incubation. By 150 days, a great proportion o f all the residues had decomposed so that there
was no significant difference between residues remaining, irrespective o f type. This indicate that
49
Page 65
as decomposition proceeds to a certain level, the plant materials irrespective o f type tend to
decompose at similiar rate thereby approaching that o f humus.
Figures 4. 2 and 4.3 also show the variation o f residue dry weight with time for water
treatment W2 (70 % field capacity) and W3 (40 %field capacity) for (a) grass residue and (b)
legume residues, respectively. Residue decomposition patterns for the W2 and W3 water
treatments followed the same pattern described for W1 in section 4.3.1, but with this,
decomposition was much slower.
The grass residues RT1 (EG) and RT5 (EFF) in Fig.4.2 (a) show quite a similar trend of
decomposition. By 20 days, 11.3 % and 10.9 % o f RT1 (EG) and RT5 (EFF) have decomposed
respectively. By 80 days, 45.5 % and 41.5 % had decomposed and similarly, by 150 days,
84.3% and 81.3 % had decomposed. This probably indicates that, there is no significant
difference between RT5 and RT1 when the moisture content is slightly low as at W2. Thus
explaining the one line curve for the two plant residue even though RT5 may have benefited
from the residual fertilizer.
Fig.4.2 (b) did not also show much variation among the treatments. By 20 days, 25.9 %,
21.3 % and 30.3% o f RT2 (PP), RT3 (CP) and RT4 (M) had decomposed respectively showing a
faster decomposition than the grasses. By 80 days, 60.9% o f RT2, 75.6 % o f RT3 and 61% o f
RT4 had decomposed. These losses in weight o f residue seem to be slightly higher than the W1
legumes although values did not differ much except for RT3 (CP) which showed a greater loss
in weight. By 150 days, 89.5% o f RT2 (PP), 85.6% o f RT3 (CP) and 90.9 % o f RT4 (M) had
decomposed.
50
Page 66
51
O RTl
• RT5
Expon. (R T 1)
— Expon. (RT5)
RTl_y = 100e°°llx RT5_y=100e'OOI,x
0.0 -I------ 1 ,-----T 1 r — t — t , T ,
0 20 40 60 80 100 120 140 160 180 200
Time / Days
100.0
g1 80.0
1 60.0 i—<L>
j 12 40.0I COI p
| J 20.0a.
0.00 20 40 60 80 100 120 140 160 180 200
Time / Days
Fig.4.2: Variation o f residue dry weight with time for water treatment W2. (a) Grass
residues (b) Legume residues; observed data are symbols and fitted curves are lines.
Page 67
52
Fig.4.3: Variation o f residue dry weight with time for water treatment W3 (a) Grass residues (b)
Legume residues; observed data are symbols and fitted curves are lines.
Page 68
In Fig 4.3 o f W3, RT2 (PP) was the least decomposed while RT1 (EG) was the fastest to
decay. The slow decomposition o f RT2 (PP) could be attributed to a greater portion o f the
insoluble part o f the plant material present in the residue despite its high N content o f 2.03 %. It
may also be due to the low moisture content o f the soil inhibiting decomposition o f the woody
parts. The fast decomposition o f RT1 (EG) was unexpected as its nitrogen content was low and
so decomposition was expected to be slow. Hence, the fast decomposition could be attributed to
an unknown factor other than nitrogen or phosphorus contents.
The observed differences in residue decomposition patterns may be attributed to the
differences in C:N ratios. The C:N ratio o f organic matter in cultivated surface soil range from
8 :1 to 15:1 and this is relatively uniform among different soils within a climatic region
(Brady, 1990). According to Thompson and Nelson (1966), heavily leached soils are likely to
have higher C:N ratios o f 30:1 while forest soils have C:N ratio o f 20:1. A C:N ratio > 25 will
result in immobilization and mineralization will occur when C:N ratio drops below 20:1.
Considering the fairly high C:N ratio o f 20:1 o f this soil, decomposition was expected to be slow
as the low soil nitrogen content o f 0.08 % would limit microbial growth leading to an initial
immobilization o f nutrients (Fox et al., 1990). Thus, the addition o f a plant material high in
nitrogen or with low C:N ratio will imply the microbes will resort to use the nitrogen in the
residue to build up their population, produce more enzymes to speed up decomposition and
subsequently, decomposing the material at a faster rate (Aber and Melillo, 1991).
In contrast, grass residues like RT1 (EG) with a high C:N ratio o f 29.77:1 are expected
to tie up their limited nutrients in the soil as nitrates leading to the priming effect o f nitrate
depression in the soil. The microbes would therefore not have access to it and therefore may not
be stimulated to grow to increase activity and cause decomposition (Grant and Bailey, 1994).
53
Page 69
Decomposition was therefore expected to be slow. It is in this regard, that decomposition of
plant residues follow the order; RT2 > RT4 > RT3> RT5 > RT1 with time, with the legumes
residue obviously decomposing faster than the grasses. The order o f decrease is related to the
lower C: N ratios o f the plants as stated earlier.
A t 80 days o f incubation, there was no significant difference between the legume
decomposition, nor was there any difference between the legumes and RT5 (EFF). Thus, even
though RT5 was an elephant grass, the apparent benefit it derived from the residual fertilizer
after maize resulted in a lower C: N ratio than RT1 (EG) and hence a faster decomposition rate.
By 150 days, a great proportion o f all the residues had decomposed so that there were no
significant difference among residues remaining, irrespective o f type.
It is o f interest to note that the rate o f decrease o f plant residues in soils is influenced not
only by the C: N ratio but other residue components such as lignin and polyphenol content
(Melillo et al., 1982; Taylor et al., 1989). But since these were not determined, the discussion is
limited to C: N ratios alone as it plays a major role in the decomposition process.
54
Page 70
Table 4.3 below shows the half-life for the various residue types at the different water treatments
derived from Figures 4.1, 4.2 and 4.3. H alf life in this case was regarded as the number o f days
for half o f the plants residue to have been decomposed.
Table 4.3 H alf -life o f residue dry weight (Days) for the different water treatments
55
Residue treatments
H alf -
W l
-life for water treatments (Days)
W 2 W 3
R T 1 (EG) 5 8 a 6 2 a 8 0 a
R T 2 (PP) 3 8 b 4 8 a -Ooo
R T 3 (CP) 4 0 b 5 0 a J3oo
R T 4 (M) 3 4 b 5 0 a 7 6 c
R T 5 (EFF) 4 0 b 6 2 a 1 0 4 d
* Figures bearing same subscripts in each column are not significantly different
Results from the table indicate that at W l, half-life for RT1 (EG) was 58 days, 38 days
for RT2 (PP) and only 34 days for RT (M). The rest o f the treatments RT3 (CP), and RT5 (EFF)
had half-lifes of about 40 days. RT4 (M), RT3 (CP) and RT5 (EFF) also appear to be similar
while RT1 (EG) seems to be significantly different from the rest. As moisture content decreases
to W2, differences in the half-lifes were not significant for both the grasses and the legumes.
The residues may be said to be decomposing at similar rate regardless o f the type. At W3,
differences between the residues were quite evident with RT1 (EG) decomposing even faster
Page 71
than the legumes RT2 (PP) and RT3 (CP). It implies that despite the high C:N and C:P ratios o f
the EG, decomposition was still high, hence the results. RT2 (PP) and RT3 (CP) had almost the
same number of days while RT5 (EFF) took 104 days for half o f its residue to decompose with
RT4 (M) having only 76 days. The lower number o f days for RT4 (M) agrees with the results o f
Brady (1990) and Larson et al. (1972) on fast decomposition for lower C: N ratio residues.
4.3.2 Effect of soil water on residue decomposition
It is known that apart from plant factors, residue decomposition also depends on
environmental factors such as temperature and soil water, among others (Olson, 1963). With
temperature being generally uniform in the greenhouse, soil water was the dominant factor for
consideration. Figures 4.1, 4.2 and 4.3 show the decline o f residue dry weight with time not
only for the various plant residues treatments (RT) but also at soil water treatments W l, W2 and
W3. Comparisons between the figures show very important features.
First, decomposition patterns show high probabilities for the higher soil water treatments
(W l: Fig. 4. 1) than for the drier soil (W3: Fig.4.3). Secondly, the total dry weight loss at 180
days for each residue type was higher in W l than W2 and W3. At the end o f an incubation
period of 1 2 0 days, all residue types lost more than 80 % o f their initial dry weights in W l while
in W3 water treatments, some residues like, RT2, RT3 and RT5 still had more than 40% o f their
initial dry weight still remaining. These observations agree with the findings o f Glenn et al.
(1993) that decomposition rate decreases as moisture content o f soil reduces. Vigil and Sparks
(2 0 0 2 ) also observed that, soil moisture must be near field capacity for decomposition to occur,
and that at soil moisture less than 40 % of field capacity, decomposition rates become very slow.
56
Page 72
Thirdly, as shown in Table 4.4, the h a lf- life (days to 50 % weight loss) o f the residue
decomposition vary considerably with water treatments; W l, W2 and W3. Results indicate that
for W l, half life o f RT1 (EG) was 58 days but this increased to 62 days for W2 and 80 days for
W3. In RT2 (PP), half life increased from 38 days in W l to 48 days in W2 and to 85 days in
W3. It is worth noting that although half-life for RT3 (CP) at water W l and W2 were different,
the difference was not significant (P < 0.05). Statistical analysis o f the data indicates that the
effect o f water treatments on half -life was highly significant (P<0.05). As can be observed
decomposition takes longer time as moisture contents o f soil reduces for each residue type.
Significant differences in decomposition patterns became evident with time.
Fourthly, the order o f decomposition in W3 was also altered with RT1 showing not
only relatively faster rate o f decomposition but also higher loss o f plant material by day 1 2 0 than
all the other treatments. The order o f decomposition at W3 was RT1> RT4> RT2 > RT3 > RT5.
No clear explanation for this observation could be given, but it can be suggested that as the soil
was slightly dry, only low microbial population could be supported and so, the composition
could be altered to favour those that may survive on low N but require high C and P. In that
case, RT1 residue may be a more suitable substrate.
However, according to Berg and Matzner, (1997), several species o f fungi with the
ability to decompose lignin via lignin-degrading enzymes do not seem able to produce the
necessary enzymes in the presence o f abundant N-rich compounds. This failure to synthesize the
enzymes was attributed to a scarcity o f manganese, the concentration o f which often has been
observed to decline as soil nitrogen increases but, considering the nitrogen content o f the soil
(0.14%) being low, the fimgi-concept would fail in this regard.
57
Page 73
58
Table 4.4 H a lf-life o f residue dry weight (Days) for three water treatments
H alf - life (Days)
Residue treatments
Water treatments RT1 RT2 RT3 RT4 RT5
W l 5 8 a 3 8 a 4 0 a 34 a 4 0 a
W 2 6 2 b 4 8 b 5 0 a 5 0 b 6 2 b
W3 8 0 c 8 5 c 8 4 b 7 6 c 1 0 4 c
* Figures bearing same subscripts in each column are not significantly different
Table 4.5. Effect o f soil water on the decay constants (k) g/d for various plant residues obtained
from fitted equation.
k-values
Plant residue type
Water treatments RT1 RT2 RT3 RT4 RT5
W l 0 . 0 1 3 a 0 .0 2 0 a 0 . 0 1 8 a 0 .0 2 2 a 0 . 0 1 8 a
W 2 0 . 0 1 1 a 0 . 0 1 5 a 0 . 0 1 4 a 0 . 0 1 4 b 0 .0 1 1 a
W 3 0 . 0 0 9 a 0 . 0 0 8 b 0 . 0 0 8 b 0 . 0 0 9 c 0 . 0 0 7 a
Figures bearing same subscripts in each column are not significantly different.
Page 74
Table 4.5 also shows the effect o f soil water on the decay constants (k) g/d for the
various residue types. As was observed for the half-life, decay constants decline with soil
dryness especially for RT2, RT3, RT4 and RT5.
A general trend o f decline in the decay constants can however be observed as seen in the
Table. 4.5. From W l to W3, RT2 (PP), RT3 (CP), RT4 (M) and RT5 (EFF) decay constants
declined by 0.6%, 0.56%, 0.59 % and 0.61 % respectively. The table also indicates that for W l,
decay constant for RT1 (EG) was 0.013 g/d but this decreased to 0.011 g/d for W2 and to 0.009
g/d for W3. This shows a 0.31 % decline from W l to W3 and therefore a considerably slowing
down o f the decomposition process. This implies less material decomposing and therefore less
carbon dioxide will be released as compared to the rest o f the treatments.
Values for the legumes residues seem to be quite higher than the grasses for W l and
W2. Thus, rate o f residue decomposition is generally faster for the legumes than for the grasses.
Statistical analysis indicates that the effect o f water on the treatments for the decay constants
was significant (P< 0.05) for some o f the residue treatments. Generally, the difference between
water treatments W l and W2, W 2 and W3 was very small as compared to that between W l and
It is important to note that as observed from the rate constants (k), decreasing order of
decomposition at W l is RT4 > RT2 >RT3, RT5 >RT1. At W2 order o f decomposition was
RT2> RT3> RT4>RT5>RT1. At W3, the RT1 had a high value o f 0.009 g/d like that o f RT4
compared to the rest o f the treatments. Rate o f decomposition was in the order RT1, RT4 >RT2,
RT3, >RT5. Thus if desired to store carbon in agricultural plant residues, then they should be
applied in very dry soils at moisture content o f 40 % field capacity or less.
59
Page 75
4.4 M odelling the dynamics of residue decomposition
The dynamics o f carbon in soils, residue decomposition, C and N release rates are often
complex and can be improved with models that include biochemical fractions and their
interactions (Henriksen and Breland, 1999). Feng and Li (2002) advanced the K-model,
recognizing that carbon dynamics in soils can be represented by three basic processes: the initial
attack of the plant residue by soil microbial population, the growth and death o f the soil
microbial biomass and the decomposition o f the dead soil microbial biomass residue. The
model focuses on the fraction o f added residue which remains un-decomposed at any time and
observes that this fraction decreases continuously with time but at a diminishing rate, as shown
in Figs. 4.1 to 4.3. Gordillo and Cabrera (1997) in an incubation study proposed a two-pool
first-order kinetic model to describe N mineralization in broiler litter.
The most common approach to develop a predictive model o f decomposition or
mineralization rates based on residue quality has been to relate decomposition parameters to the
different residue biochemical fractions either by multiple regression (Muller et al., 1988;
Trinsoutrot et al., 2000) or correlation (Thomas and Asakawa, 1993; Bending et al., 1998).
Since the different biochemical fractions are highly correlated (Muller et al., 1988; Kuo and
Sainju, 1998), multiple regression by ordinary least squares is not appropriate for the estimation
of parameter coefficients due to the presence o f multicollinearity among the predictor variables.
When multicollinearity exists among the predictor variables, the variances o f the parameter
estimates are inflated and statistically unstable (Dillon and Goldstein, 1984; Johnson and
Wichem, 1998). In addition, the results are difficult to interpret and very sensitive to the
inclusion or lack o f inclusion o f specific variables or to small changes in data points (Dillon and
Goldstein, 1984).
60
Page 76
Accordingly, most residue decomposition models employ double exponential decay
equation, with two decay constants, describing the fast and slow rates respectively. Using the
curve-fit software and following SAS (1991), an equation o f the form
Y= A*exp ('klt) + B* exp ('k2t) (4.1)
where Y - weight o f plant residue (g) remaining at t (days). A, B, k l and k2 are constants fitted
to data on residue and water treatments.
The results in Table 4.6 indicate the dependence of the decay constants k l and k2 on
water for a given residue type. The values for the various residue types and soil water
treatments were obtained from the fitted equation above. Results from the data indicate that k l
which is the initial fast decomposition does not differ much from the k2 which is the slow
decomposition stage. There is also a general decline in the k l and k2 values as water content o f
soil decreases except for RT2, RT3 and RT4 treatments which have an unusual high k l values at
W3 and particularly RT2 at W3 for the k2 value. The exceptionally high value obtained for the
k l at W3 seem to imply that, rate o f decay was obviously faster for the legumes than for the
grasses. These observed values at W3 seem to contradict the earlier conception that
decomposition tends to decrease as moisture content reduces.
Decay constants (kl and k2) for the grasses; RT1 and RT5 seem to maintain some form
of consistence at their respective water contents. There is however no significant difference
between the two pools for all the water treatments. This lack o f signifiacant difference may be
attributed to an increase in surface area of the plant residues resulting from the cuttings. Studies
by Vigil and Sparks (2002) indicate that chopping plant residue to smaller sizes hasten
decomposition process and therefore this may have resulted in the lack o f difference between
the two pools k l and k2. Another probable factor could also be the high temperture of 30 °C
61
Page 77
which might have hastened the decomposition process. The small amount o f residues imputed
may also be a contributing factor to the pools.
Table 4.6 Effect o f soil moisture; W l, W2, W3 on the decay constants; k land k2 (g/day) pools
for the various residue types obtained from fitted equation.
62
Water treatments W l W2 W3
k values
Residue tvpe
k l k2 k l k2 k l k2
RT1 0 . 0 1 2 0 . 0 1 2 0 . 0 1 0 0 . 0 1 0 0.008 0.008
RT2 0.032 0.015 0.014 0.014 0.076 0.076
RT3 0.015 0.016 0.014 0.014 0.056 0.006
RT4 0.015 0.016 0.013 0.013 0.059 0.007
RT5 0 . 0 1 2 0 . 0 1 2 0 . 0 1 2 0 . 0 1 2 0 . 0 1 0 0 . 0 1 0
It is evident from the foregoing discussions that the decay rate constant depend on both
the type of residue and the soil water, hence any dynamic description must at least consider
these effects. In a study by Ruffo and Bollero (2003) first-order exponential single-pool decay
model was used to analyze biomass decomposition, carbon and nitrogen residue released with
time either expressed as degree- day with base temperature 0°C (Honeycutt and Potaro, 1990) or
decomposition -day (Stroo et al., 1989; Steiner et al., 1999). Thus, it would be appropriate to
use a single pool to describe this model. Even though it is known that temperature exerts
Page 78
tremendous effects on decomposition rates through Arrhenius relations, it is not a major variant
in the tropics in comparison to soil water. For simplicity, simple decay functions are used to
describe the decomposition in this study. A simple exponential equation o f the form below is
proposed.
Y = Ae _kt (4.2)
Y = dry weight o f plant residue remaining un-decomposed in grams, A = initial dry weight o f
applied residue, k = decay constant (g/day), e is the base of the natural logarithm and t is
time/day. Soil water effect on the k was highly significant with P < 0.05 (appendix 5 to 7).
Using the above equation 4.2, another equation can be formulated using a ken which depends on
soil water.
The exponential equation derived to predict residue decomposition under variable soil water is:
Yr= A e fe e)t (4.3)
Where Y = dry weight o f plant residue remaining un-decomposed, A = initial dry weight o f
applied residue in grams, keff= effective decay constant, r is residue type, 0 is soil water g/g, e
is the base of the natural logarithm and t is time/day.
Assuming that the optimum soil water for decomposition is 0fc (corresponding to field
capacity) and that at air dry soil water content, 0 d, decomposition ceases, then at any given soil
water content 0 , ke/ / may be expressed as:
63
k -d r ~ k I 'C
e - ed@FC ~
(4.4)
with k fC being the decomposition rate constant for field capacity obtained from W l for
each residue type as shown in Table 4.5. Soil water beyond field capacity may incapacitate the
Page 79
growth o f microbes that require good aeration for decomposition. This aspect has not been
considered in equation (4.4) but can be easily incorporated. The effect o f residue type r on
decomposition rate may not lend itself to direct formulation but r classes can be derived based
the on C: N ratios.
Figures 4.4 and 4.5 show predicted patterns for the residue treatments (RT) using the keff
value calculated at soil water content (0) o f 0.16 g/g (70 % FC) and 0.09 g/g (40 % FC). Air-
dried soil (Orf) o f 0.019g/g was put into equation 4.4. The result obtained for the k ^ w a s then put
into equation 4.3 to give the calculated plant residue dry weight.
Thus, figure 4.4 presents the variation o f observed (symbols) and calculated (lines) plant
residue dry weight for (a) Natural elephant grass; RT1 (b) Elephant grass from fertilized maize
plot; RT5, (c) Pigeon pea; RT2, (d) Cowpea; RT3, (e) M ucuna spp ; RT5 at 70 % field capacity.
The calculated plant residue remaining in (a) and (b) suggest that grass had a higher proportion
of the fast decomposing fraction which was reflected in a higher loss o f the original dry weight
during the 30th and 50th day for (a) and almost through out the period o f incubation for (b),
respectively. The observed values for (a) were slightly above the estimated for the first 30 days
and slightly below the estimated values from the 120 day onwards. This indicate that possible
modelling for decomposition o f grass may be best fitted at the early stages (0-30 days) o f
incubation and towards the latter end (120-180 day) as it shows a similar trend to the line.
Figs.4. (c), (d) and (e) o f W2 give quite a remarkable trend. The observed did not depart
markedly from the calculated values but fell within or close to the lines. This suggests that the
decomposition o f legumes probably linked to the higher nitrogen content, may have resulted in
better prediction o f residue decomposition rate at the moisture content o f 70 % field capacity.
The agreement between the observed and the calculated was quite perfect.
64
Page 80
65
Time/ Days
Fig 4.4 Variation o f observed (symbols) and calculated (lines) plant residue dry weight for
residue treatments ;(a) RT1, (b) RT5; (c) RT2 (d) RT3 (e) RT4 .at 70 % field capacity (W2
Page 81
Figure 4.5 shows the variation o f observed (symbols) and calculated (lines) plant residue
dry weight for (a) Natural elephant grass; RT1 (b) Elephant grass from fertilized maize plot;
RT5, (c) Pigeon pea; RT2, (d) Cowpea; RT3, (e) Mucuna sp; RT4 at 40 % field capacity. The
graphs are curvilinear but steep especially for (a). The observed fell within or very close to the
calculated (lines) in the entire figure. This implies that the performance o f the model in
predicting the decompostion o f the residue was fairly good.
However, from the 120 day onward, Fig.4.5 (a) showed a deviation from the calculated
and therefore much faster rate o f decomposition is expected. It is o f interest to note that although
in Fig. 4.5 (b), RT5 which is elephant grass showed quite a similar trend o f decomposition like
that o f the legumes, (c), (d) and (e) and this could be attributed to the beneficial nitrogen it
obtained. The model for determining rate o f decomposition is much better when moisture
content is much lower as at 40 %. This implies a prediction o f decomposition is dependent on
soil water content for a residue type.
66
Page 82
67
100.0 0,000 c 'S'51u. „nP3
•0
80.0
60.0
40.0
20.0
0.0
o(a) RT1
0 20 40 60 80 100 120 140 160 180 200
Time / Days
100.0 ■
80.0 -j
60.0 -I
40.0 j
20.0 J
0.0
(c) RT2
0 20 40 60 80 100 120 140 160 180 200
Time/ Days
W )a
1 0 0 . 0 •
. S
£
80.0 -
S-H 60.0 -<D £
- aC/J0)
40.0
MCL
20.0 -
(b) RT5
o.o -i0 20 40 60 80 100 120 140 160 180 200
Time / Days
0 20 40 60 80 100 120 140 160 180 200 I Time / Days
100.0
<D \P 3 ° .12
80.0
’« ts/) O s 60.0Z 'Si ' i
§40.0
20.0
0.0
XX (e) RT4
0 20 40 60 80 100 120 140 160 180 200
Time / Days
Fig 4.5 .V ariation o f observed (sym bols) and calculated (lines) p lant residue dry w eight for
residue treatm ents ; (a) RT1, RT5 (b), ( c ) RT2, (d) RT3, e) R T4 at 40 % field capacity
Page 83
Figure 4.6 shows the predicted versus observed plant residue dry weight o f (a) Natural
elephant grass; RT1 (b) Elephant grass from fertilized maize plot; RT5, (c) Pigeon pea; RT2, (d)
Cowpea; RT3, (e) M ucuna sp\ RT5 at 70 % field capacity. The dotted line is 1:1 showing the
theoretical relationship between the predicted and observed values while the continuous line is a
linear regression. The mean coefficient o f determination (R2) using linear regression analysis
was high (R2 > 0.94) and the slope between 0.80 and 1.05. This shows a positive correlation
between the predicted values and the observed. The 1:1 line also shows a similar trend o f good
relation for all the figures except for Fig.4.6 (b) which had the 1:1 line slightly above the
predicted versus observed values. This suggests that Fig. 4.6 (b) was under estimated.
Figure 4.7 shows the predicted versus observed plant residue dry weight o f (a) Natural
elephant grass; RT1 (b) Elephant grass from fertilized maize plot; RT5, (c) Pigeon pea ; RT2,
(d) Cowpea; RT3, (e) Mucuna sp; RT5 at 40 % field capacity. The dotted line is 1:1 and the
continuous line is a linear regression. In all the treatments there is perfect agreement between
observed and predicted residue dry weight except for RT1. The correlation between the
predicted and the observed is high as R2 > 0.98 and the 1:1 line was also perfect except for
Fig.4.7(a) which deviated much from it. The high values o f RT1 show a slight over estimation o f
the model. The model therefore indicates that decomposition rate o f plant residue will be better
predicted at lower moisture content than that at higher moisture level. It could also be observed
that figures having the dotted lines above them have negative intercepts except for Fig. 4.7(b)
while those with a fair distribution o f points around the dotted lines gave better predictions.
68
Page 84
69
100.0
80.0<DJ5 sp T3fi g> 60.0 ■§ :§o g 40.0W e
20.0
0.00.0 20.0 40.0 60.0 80.0 100.0
Observed residue rem aining / %
(e) RT4y = 1.0451x-0.5489
R = 0.98
Observed residue remaining / %
Fig 4.6 .Predicted versus observed plant residue dry w eight o f (a) R T 1 ; (b) RT5;
y = 0.8048x + 0.887 (a) R T1 R2 = 0.96
(b) RT5■1.0351X- 1.0721
R2 = 0.94
Observed residue rem aining / %
100.0
(d) RT3y = 0.9388x + 0.358
R2 = 0.98
0.0 20.0 40.0 60.0 80.0 100.0Observed residue remaining / %
80.0 -
60.0 -
40.0 -
20.0 -
0.0 -
( c) RT2; (d) RT3; (e) RT4; at 70 % field capacity (W 2), dotted lines; 1:1
Page 85
70
80.0
100.0
20.0
0.0
y = 0.6229x + 2.7106(a) RT1 R2 = 0 .98
0.0 20.0 40.0 60.0 80.0 100.0Observed residue remaining / %
y = 0.9895x- 0.076(b) R T5 r 2 = 0,98
Observed residue remaining / %
y = 0.963x + 0.3663
(e )R T 4 y = i-0504x + 0.0173 R2 = 0.98
Observed residue remaining / %
Fig 4.7 . Predicted versus O bserved plant residue dry w eight o f (a) RT1; (b) RT5
100.0
80.0
' t i 60.0
• | 40.0
- 20.0
0.00.0 20.0 40.0 60.0 80.0 100.0
Observed residue remaining / %
(c) R T2; (d) RT3; (e ) RT4;. at 4 0 % field capacity (W 3), dotted lines; 1:1
Page 86
4.5 Soil carbon and nitrogen accumulation during incubation studies
The amount o f carbon stored in the soil is a balance between the quality and quantity o f
material input, amount decomposed and the amount released into the atmosphere as carbon
dioxide (Christensen, 1996; Turner and Lambert, 2000; Paustian et al., 2002). Table 4.7, shows
the effect o f the various residue treatments on the organic carbon and nitrogen accumulated in
the soil at field capacity (FC) W l at different times (A= 20, B= 80, C= 180 days from the
commencent o f the incubation study). It must be noted that treatment RT6 is the control which
received no residue.
71
Table 4.7. Effect o f various residue treatments on soil organic carbon and nitrogen / %
accumulation during the incubation period at soil water treatment W l.
______________ Organic Carbon %_____________________________ Total Nitrogen %
A B C A B C
Treatments % % % % % %
RT1 1.74 2.14 1.61 0.13 0.16 0.13
RT2 1.75 1.78 1.65 0.15 0.15 0.18
RT3 1.78 2.08 1.74 0.16 0.16 0.16
RT4 1.83 2.19 1.68 0.14 0.20 0.21
RT5 1.81 2.06 1.71 0.14 0.17 0.14
RT6 1.64 1.64 1.44 0.08 0.10 0.12
LsdP<0.05
0.230.54
0.370.04
0.220.11
A:20 days after incubation B: 80 days after incubation C: 180 days after incubation .
Page 87
72
Initial organic carbon and nitrogen contents o f the soil were 1.62 % and 0.08 %
respectively at the start o f the experiment. There was a general increase in % carbon at the initial
phase o f decomposition with RT4 (M) having the highest followed by RT5 (EFF), RT3 (CP),
RT2 (PP), RT6 (C) and RT1 (EG) in that order. The % carbon in each soil changes with time.
A low carbon content was observed at the end o f the experiment in all the cases although each
was higher than the control. Results from the table indicate that at 20 and 180 days, the organic
carbon content did not differ significantly among the treatments. This implies the carbon stored
at the early stage o f decomposition are the same and this could be attributed to the fast
decomposition rate o f the residues.
However, soil samples taken 80 days after showed significantly (P < 0.05) higher values
for the grass RT1 (EG), RT3 (CP), RT4 (M) and RT5 (EFF). The high organic carbon o f RT4
(M) and RT3 (CP) were unexpected because their decomposition was faster and so loss o f
carbon was expected to be high. Comparison among the treatments at 80 days o f incubation also
indicates that apart from pigeon pea (RT2) which was not significantly different from the
control, the legumes and non legumes treatments were similar.
It could also be noted that soil carbon content for the various treatments were all
significantly above the control (RT6). This indicates the differences in the contribution o f plant
residues to carbon storage based on their composition. As stated earlier carbon accumulated at
the end o f the 180 days o f incubation for the various treatments were not significantly different.
Thus, it takes quite a long time for carbon storage to show any significant difference with time
irrespective o f residue treatment which suggests that net carbon accumulation takes quite a long
time as noted by Van Faaseen and Smilde, (1985).
Page 88
Nitrogen content o f the soil on the respective days was not significantly different from
the control. However it can be observed that nitrogen % o f the soil increased with increasing
decomposition especially for the legumes and less so for the grasses, with RT5 (EFF) behaving
similarly like the legumes although fluctuation could be observed in the trend. In RT1 (EG) N
% was stablized. The high amount o fN % in the legumes agrees with the report o f Vine (1953)
that legumes increase the nitrogen content o f soil. RT3 (C) however maintained some
consistency in % nitrogen at the different times.
Some o f the residues typically represent the main situations in the N dynamics o f the
soil during decomposition : the highest total N (0.21 % N) was obtained for mucuna spp (RT4)
and the lowest (0.13% N) for elephant grass from unfertilized maize plot (RT1) at the end o f the
incubation period.
An N mineralization was observed throughout the entire incubation period in only
mucuna spp (RT4) and pigeon pea (RT 2). The incorporation into the soil o f the other residues
for example RT1 and RT5 appears to cause some N immobilization although the amounts o f N
immobilized may vary with the residue type. Thus, N mineralization was followed by an N
immobilization phase, the amount o f which varied between residues types. Generally, 180 days
after incorporating the residues into the soil, the concentrations o f mineral N present in the
treated soils were more than those in the corresponding control.
The C: N ratio for the various treatments shows a general decrease in the carbon to
nitrogen content o f the soil as decomposition progressed. The rate o f mineralization was
expected to be high at all the days since C: N ratios were within 8 - 1 3 . 4 with the exception o f
the control which had a higher value o f 20. The control however appeared to show some
amount o f mineralization as the C: N ratio decreased with time. The initial C: N o f the residue
73
Page 89
was between 24 and 30. Addition o f this material will after 180 days result in lower C: N ratio o f
the soil than the corresponding control.
As decomposition proceeded, the proportion o f water soluble compounds like sugar and
free amino acid had less influence on the rate o f C mineralization because these fractions had
been largely degraded. It has been shown that the decomposition o f crop residues can be
affected by the availability o f N since the C: N ratio o f the decomposers is far lower than the
C: N ratio o f many crop residues. Thus, very often, the availability o f soil inorganic N will, at
least in the short term, control the kinetics o f C decomposition, as has been shown with cereal
residues (Recous et al., 1995; Henriksen and Breland, 1999; Corbeels et al., 2000).
Consequently the relative weight o f the carbon coming from the residue by primary
decomposition falls during the course o f decomposition. Thus only the initial rates o f
decomposition can be explained by the biochemical characteristics o f the residues.
Table 4.8 presents the effect o f the various treatments on the organic carbon and nitrogen
accumulated in the soil during the incubation period at soil water treatment, W2. A similar trend
like that described above could be observed. However, there was a significant difference
between the treatments on the 20th and 80th days. By the 80th day, all the legumes and RT5
were significantly different from the control except RT1. By 180 days, all treatments had
similar organic carbon content that was significantly different from the control.
It could be observed that soil carbon accrued from the legumes was higher than that for
the grasses. In addition, although treatments were not significantly different, RT1 (EG) at the 80
day had a carbon content even much lower than the residue free treatment, (RT6) and this may
be attributed to some form o f immobilization o f the carbon in the soil by the microbes.
74
Page 90
Nitrogen content o f the soil at the selected days was not significantly different. However, it can
be observed that high nitrogen content was obtained for the legumes than the grass (RT1).
Table 4.9 also shows a similar trend for carbon accrued for water treatment W3. Results
indicated the amount o f carbon stored at 20 and 180 days were significantly different. It could
be observed that carbon content for the control (RT6) was lower than the other treatments. The
N % of the soil for the respective treatments was highr for the legumes than the grasses at the
end o f the period. A general C: N ratio o f all the treatments at the end o f the incubation showed
a value o f below 20 and hence quite feasible for mineralization process.
Table 4.8. Effect o f the various residue treatments on soil organic carbon and nitrogen (%)
accumulation during the incubation period at soil water treatment W2
75
Organic Carbon % Total Nitrogen %
A B C A B C
Treatments % % % % % %
RT1 1.73 1.70 1.68 0.12 0.14 0.16
RT2 2.03 2.08 1.84 0.17 0.27 0.17
RT3 2.12 2.09 1.72 0.18 0.21 0.17
RT4 2.10 2.16 1.71 0.19 0.25 0.18
RT5 1.92 2.15 1.75 0.14 0.16 0.15
RT6 1.68 1.76 1.52 0.09 0.12 0.11
LsdP<0.05
0.270.02
0.16<0.001
0.190.06
A: 20 days after incubation B: 80 days after incubation C: 180 days after incubation period
Page 91
76
Table 4.9. Effect o f the various residue treatments on soil organic carbon and nitrogen /
% accumulation during the incubation period at soil moisture W3
Organic Carbon (%) Total Nitrogen (%)
Treatments
A B C A B C
RT1 1.92 1.89 1.75 0.12 0.15 0.15
RT2 2.13 2.14 1.72 0.15 0.16 0.19
RT3 2.00 1.88 1.69 0.13 0.16 0.17
RT4 1.88 2.15 1.82 0.16 0.13 0.18
RT5 1.98 1.80 1.73 0.13 0.16 0.15
RT6 1.71 1.79 1.55 0.11 0.12 0.11
LsdP>0.05
0.220.03
0.360.14
0.014<0.001
A:20 days after incubation B: 80 days after incubation C: 180 days after incubation
Page 92
4.6 Field Studies
4.6.1 Some physical and chemical properities of Haplic luvisol
Table 4.10 shows some physical and chemical properities o f the field soil from the
University o f Ghana Farm. Soil texture is sandy loam and like that o f the Haplic lixisol from
Kpeve, drainage and aeration are expected to be high. The pH o f the soil ranges from 6.4 to 6.7
which are near the neutral zone and so availablilty o f nutrients are also expected to be very high.
Although, organic carbon content o f the soil ranged from 0.33 % to 0.41 % and total nitrogen
content from 0.052 to 0.059 % which were very low, the C:N ratio o f the soil which is between
7.59 and 5.59 was quite low and so mineralization o f nutrients would also be expected to be
high. The available phosphorus content between 14.9 mg/kg and 15.38 mg/kg are also quite high
confirming the high nutrient status o f the soil. The Cation exchange capacity (CEC) values
between 10-13 cmol(+)/kg may be quite low but considering the geneally low values obtained
for it’s organic carbon content, the value obtained was quite reasonable. Field capacity o f the
soil was 0.19 g/g with a wilting point o f 0 .115g/g.
4.7 Field residue decomposition study
4.7.1 Some chemical characteritics of plant residues obtained from the field
Table 4.11 shows some chemical properties o f the plant residue used for the field study.
RT2 and RT4 were used to represent a typical legume fallow residue and RT5, a typical grass
fallow. Results from the Table indicate that the carbon content o f 493.8 g/kg and 459.1 g/kg for
the RT2 (PP) and RT4 (M) residues respectively were quite high while that for RT5 (EFF) was
77
Page 93
78
Table 4.10 Some physical (a) and chemical (b) properities* o f the field soil from the
University Farm.
(a) physical
Treatments Sand % Silt %_______ Clay % Textural class Field capacity g/gRT2 (PP) 64.0 25 5 Sandy loam 0.19RT4 (M) 66.8 22.5 7.5 Sandy loam 0.19RT5(EFF) 69.6 25 5 Sandy loam 0.19RT6(C) 66.8 25 5 Sandy loam 0.19
(b) chemicalpH
CEC( cmol (+,/kgTreatment 1:1 O C % TN % Avail.P mg/kgRT2 (PP) 6.7 0.37 0.058 15.5 13RT4 (M) 6.6 0.33 0.059 15.2 12RT5(EFF) 6.4 0.38 0.052 15.9 12RT6(C) 6.5 0.41 0.054 14.9 10
1:1 Soil/ water suspensionOC: Organic carbonTN : Total NitrogenAvail. P: Available PhosphorusCEC: Cation exchange capacity* All values are means o f four observations
Page 94
79
Table 4.11 Some chemical properties of the plant residues used for the field studies
Residue treatments
C g/kg N g/kg P g/kg C: N C:P
RT2 (PP) 493.8 1.89 2.81 26.11 175.88
RT4 (M) 459.1 1.68 3.19 27.33 143.92
RT5 (EFF) 334.7 0.88 3.41 38.25 98.15
RT2 (PP: Pigeon pea following unfertilized maize), RT4 (.M: M ucuna spp. following
unfertilized maize) RT5 (EFF: Elephant grass following previously fertilized maize).
Carbon ranged from 33.47 to 49.38 % which conforms to the results o f W oomer et al.
(1994), hence the values obtained are quite reasonable. RT2 (Pigeon pea) had the highest
nitrogen content o f 1.89 g/kg although according to Fox et al. (1990), all the nitrogen content in
the treatment are below the 2 % stated for decomposition. The N content o f RT5 (EFF) was
quite very low 0.88 % as it was expected to have benefited from the residual fertilizer in the soil.
The C: N ratio was also below 30 for the legumes while that o f the grass was quite high
(38:3). This indicates that decomposition would be faster for the legume as compared to the
elephant grass from the fertilized maize plot. Usually phosphorus content o f plant residue vary
and is much higher in legume than in grasses Maikslenien, (2000). Thus, the high value
obtained for the grass was unexpected although the high P content o f the soil (15.9 mg/kg) may
have contributed to this phenomenon. The C:P ratio for the legumes (RT2 and RT4) was higher
Page 95
80
than that for the grass (RT5) and this may be attributed to the high amount o f P present in the
residue.
4.7.2 Effect o f residue type on decomposition
Figure 4.8 shows the variation o f residue dry weight with time for the RT2; Pigeon pea,
RT4 Mucuna spp. and RT5; Elephant grass from fertilized maize plot under field conditions.
Decomposition, as observed was faster for RT4 than RT2 and then RT5. Thus decomposition
was generally faster for the legume residues than the grass as expected.
Considering the intial fast phase o f decomposition to be 20 days, 71.43 % and 66.67 %
of RT2 and RT4 were respectively remaining while RT5 had 78.3 % residue left. The time taken
for half o f the plant residues (half-life) to decompose was 42, 28 and 52 days for RT2, RT4 and
RT5 respectively. This shows that decomposition o f the grass (RT5) was slightly slower than the
RT2 although under green house condition, they seem to be the same. RT4 (M) however
decomposed very fast due to the herbaceous nature o f the residue. A t the end o f the 80 day
study, only 19.84 % o f RT2 and 12.22 % o f RT4 residue were left while RT5 had 34.09 %
residue remaining. This implies, that grass (EFF) residue would be a better contributor to carbon
storage as a result o f its slow rate o f decomposition (Bruce et al., 1999).
Page 96
81
0 20 40 60 80 100Time/Days
100 X
3 £ 80
i i 60"S ' I 40os ga, g 20
0
X (b) RT 4
X
X------
X RT4
— - - Expon. (RT4) j
y = lOOe R2 = 0.981
— -X
20 40 60
Tim e/D ays
80 100
Tim e/ Days
Fig.4.8. V ariation o f residue dry w eight w ith tim e for (a) RT2; (b) RT4;
( c) RT5; used for the field studies; observed data are sym bols and fitted curves are lines
Page 97
The rate o f decomposition (k) from Table 4.12 for RT2, RT4 and RT5 were 0.020g/day,
0.026 g/day and 0.014 g/ day respectively. The effect o f residue on decomposition is more
related to the C: N o f the plant residues. Most authors, Paul and Clark (1989) and W hite (1979)
have suggested that net N mineralization occurs when C/N ratios o f residues are < 25.
Nevertheless, Thompson and Troeh (1978) stated a C:N ratio of 32 as the threshold. It has been
shown that residues with low C/N ratio can cause net immobilization o f the soil mineral N
Jensen, (1994). In fact, most studies referring to a C/N ratio threshold value carried out in the
field did not monitor precisely the changes occurring in soil mineral N with time.
In this study, C:N ratio of all the residues was between 26.11 and 38.25 and therefore
was expected to cause net N immobilization in the early stages o f decomposition in agreement
with the literature. Considering the net effect o f the residues after 80 days o f incorporation, the
legume residues possibly had a C/N ratio below 25 and may have induced net N
mineralization, whereas the grass with a C/N ratio slightly above 32 might have caused net
immobilization o f soil mineral N.
Finally, it seems much more important to consider the kinetics o f decomposition rather
than just the amounts mineralized by the end o f decomposition, as the relationships between C
mineralization and N and the intrinsic characteristics o f the residues are temporally dynamic
(Vanlauwe et al., 1996; Quemada and Cabrera, 1995).
4.7.3 Comparison between greenhouse pot experiment and the field residue studies.
Table 4.12 shows the comparison between the decay rate constant k (g/day) for field and under
greenhouse experiments at W l, W2 and W3 for RT2, RT4 and RT5 residues. The results
82
Page 98
indicate that values obtained at W l were slightly quite close to that o f the field although
decomposition rates o f the plant residues was quite faster on the field than with the pot studies.
Table 4.12 Comparison between decay rate constant k (g/day) for the greenhouse pot
experiment and that o f the field for some o f the plant residue treatments
83
Residue type W l__________ W2_________ W3_________On the field
RT2 0.020 0.015 0.008 0.019 ± 0.011
RT4 0.022 0.014 0.009 0.026 +. 0.007
RT5 0.018 0.011 0.007 0.014 + 0.005
W ater content o f the soil at field capacity (W l) for the pot experiment in the greenhouse
was (0.23g/g) while that for the field was 0.185 g/g with a wilting point o f 0.115 g/g. Thus, the
soil in the field had a lower water holding capacity compared to the pot although the flutuations
in temperature and termites may have hastened its residue decomposition on the field. RT5
(EFF) was however slightly faster at W l than on the field. Thus, in order to make a reasonable
assement between the pot experiment and that o f the field, soil water (which was not controlled)
was assumed to be at 70 % field capacity (W2) throughout because the study was conducted
during the rainy season and this W 2 (0.16 g/g) is also much closer to the field capacity o f 0.185
g/g . Hence, the decay rate constants could be compared at 70 % FC for both greenhouse and
field studies (Table 4.12). The result obtained indicated that decomposition was slightly faster in
the field than in the greenhouse pot experiment especially for RT4.
Page 99
In the field, residue decomposition rates are controlled by many environmental factors
(Martin and Haider, 1986). Especially important are water content and temperature (Parr and
Papendick, 1978). Temperature o f the field fluctuated with time and was between 26 °C and 32
°C. The changes in the temperature may probably have resulted in the fast decomposition o f the
residue since temperature in the greenhouse hardly exceeded 30 °C and was less variable.
Comparison between W3 (40 %FC) and that for the field also showed that under drier
conditions, decomposition o f plant residue will be even faster in the field than in the greenhouse.
From the greenhouse studies, equation 4.3 on page 63 was applied to calculate residue
decomposition for field studies using the rate constant (k)/g/day obtained for W 2 observed in the
greenhouse (Table 4.12). Figure 4.9 show variation o f observed (symbols) and calculated (lines)
plant residue dry weight for (a) Pigeon pea, RT2 (b) Mucuna spp., RT4 and (c) Elephant grass
from fertilized maize fallow plot, RT5.
The figures illustrate that the calculated decomposition did not depart markedly from the
observed as in RT2 and RT5. Thus the values observed in this study fell within or close to the
predicted. It therefore gave an indication that comparison between the field and that in the
greenhouse is feasible and so modelling o f pot experiments could be quite useful for assessing
field scale decomposition provided the necessary factors like moisture content are known.
It can also be observed that it was only RT4 which had its observed values generally
lower than the calculated for the field. The half life for the predicted RT4 (M) was high about 42
days compared to the observed o f about 28 days.
84
Page 100
Time / Days
Fig 4.9 .Variation o f observed (symbols) and calculated (lines) plant residue dry weight for
(a) RT2; (b) RT4 ; (c) RT5; with time for the predicted field study
Page 101
4.7.4 Soil carbon accumulation during field study
Table 4.13 shows the amount o f carbon stored in the soil up to 80 days under field
conditions. The soil was initial sampled ju st before residue incorporation. Results from the data
indicate that organic carbon content for the various treatments at the start o f the experiment were
not significantly different from each other except for the control. The high organic carbon at the
beginning o f the study for the control (RT6) may be attributed to a previous cropping o f the
land with a high biomass plant like M ucuna pruriens.
Table 4.13 Oxidizable carbon (%) to the soil during field studies.
86
Days after commencement o f studies
Days 0 20 8 0
PlantResidues treatment
RT2 0 .3 7 a 0 .4 9 a 0 . 6 7 a
RT4 0 . 3 3 a 0 .4 6 a 0 .6 0 b
RT5 0 .3 8 ab 0 . 4 1 b 0 . 6 1 b
RT6 0 . 4 lab 0 .2 1 c 0 . 2 6 c
Figures bearing same subscript in each column are not significantly different.
P < 0.001
Lsd 0.05
It could also be observed that there is general build up o f carbon from the 20-80 days as
decomposition proceeded except for RT6. The control however seemed to show a state of
Page 102
decline which may be due to immobilization and perhaps leaching o f the carbon in the soil. The
RT5 which is from the fertilized maize plot also seemed to accumulate much carbon than the
legumes at the begining o f the experiment.
From the start o f the study to the 20th day, RT2, RT4 and RT5 tended to have a 0.12 %,
0.13 %, 0.02 % increase in carbon storage respectively while the control (RT6) to declined by
0.20 %. All the residue treatments were also significantly higher than the control. The soil
under treatment RT5 at the 20th day had the lowest organic carbon content compared to the other
residue treatment which was not expected because gramineae (grasses) contain relatively high
amount o f lignin which tends to decompose slowly hence preserving the carbon. The soil in
treatment RT2 had the highest levels o f organic carbon stored on the 80th day. This was also not
expected as much o f the residues were observed to have decomposed. However, this observation
could be attributed to some of the resistant plant residue still present.
Results also indicate that RT6 had the highest carbon content at 80 days. A t the end of
the 80 days period, there was no significant difference between the residue treatments but, each
treatment was significantly higher than the control indicating that additions o f a plant residue
certainly increased soil carbon to the soil although minimal. RT2, RT4 and RT5 had 1.81 %,
0.27, 0.21% carbon respectively above the initial carbon content o f their soil. The control plot
had a much low carbon content at the end of the period.
87
Page 103
CHAPTER 5
CONCLUSION
This study investigated the decomposition o f plant residues as affected by substrate
quality and other environmental factors such as soil moisture. The C: N ratio o f the plant
residues was found to greatly influenced decomposition rate such that plant residues with high
nitrogen content showed faster decomposition than those with lower nitrogen content. Legume
residues with low Carbon: Nitrogen ratios decomposed faster than grass residues. Thus, the
order o f decomposition decreased with RT2 (Pigeon pea) > RT4; {Mucuna spp.) >RT3
(Cowpea) > RT5 (elephant grass from fertilized maize plot) > RT1 (elephant grass from
unfertilized maize plot). Although, legumes residues which showed rapid decomposition would
contribute less to soil carbon storage in a long term, they would in short term increased soil
productivity greatly in agricultural field as compared with the grasses.
. The moisture content o f the soil was found to have a remarkable influence on the rate o f
decay. High soil moisture content resulted in faster decomposition rates o f plant residues
although some exceptions may occur. Thus, decomposition rate o f plant residue generally
increased in the order 40 % moisture content < 70 % moisture content < 1 0 0 % moisture
content. There is therefore increased storage o f carbon in soils under conditions o f low soil
moisture content below the field capacity content.
There is a good relation between rate of decomposition for a plant residue type in the a
greenhouse and that in field such that knowing the environmental conditions pertaining on the
field, it may be possible to estimate field scale decomposition using parameter derived from
greenhouse studies. The amount o f carbon stored in the field has a bearing on the type o f plant
residue incorporated into the soil. Each residue type however added some carbon which is
Page 104
certainly better the bare control soil. The study has also shown that simple equations could be
used to describe the effect o f soil moisture on plant residue decomposition. A good agreement
between the predicted versus observed residue decomposition under varying soil water was
found using a simple model developed in this study.
Recommendation
Even though this study sought to assess the effect o f residue type and soil water on
residue decomposition, the type effect was only limited to carbon and nitrogen due to lack of
facilities. Thus, detailed studies on residue factors such as lignin content, cellulose and
polyphenol content would be recommended in future studies since these factors significantly
affect decomposition rates.
Also, since grasses have been found to be better contributors o f carbon storage in soil
under low moisture content below the field capacity, it would be imperative to assess the
different types o f the grass family which might contribute better to soil carbon. Furthermore
farmers are entreated to leave the grasses on the soil when weeding the land to conserve carbon
storage instead o f burning them.
Furthermore as the microbes are the major agents o f decomposition process, the
microbial dynamics and diversity with time need to be determined in order to assess which
microbes influence decomposition at a particular stage.
Finally, the information gained from such detailed studies could be used to improve the
calibration and validation o f some carbon tum-over models.
89
Page 105
90
REFERENCES
Abduranhman, M.D., Seeling, B, Rego, T.J. and Reddy B.B. 1998. Organic m atter imputs by
selected cropping systems on a vertisoil in the semi-arid Tropics o f India. Annuals o f
Arid Zones.37, 363-371.
Aber, J.D. and Melillo, J. M. 1980. Litter decomposition: M easuring relative contributions o f
organic matter and nitrogen in forest soils.Can.J.Bot. ppl. .416- 421.
Aber, J. D. and Melillo, J. M. 1991. Terrestrial ecosystems Philadelphia. Soil Survey o f
Kalamazoo County, Saunders College Publishing, Austin, FR 1979. Pennsylvania, USA. p
436.
Acquaye, D.K. and Laryea. K.B. 1982. Unpublished soil report o f the University o f Ghana
Farm. Legon. Dept, o f Soil Science, University o f Ghana.
Adiku, S.G.K., G .N.N. Dowuona and Kumaga, F. K. 2003. M easuring and Assessing soil
carbon sequestration by Agricultural Systems in Developing Countries. Unpublished
Annual report No. 2003/002. Dept, o f Soil Science, University o f Ghana. 50 pp.
Ahenkorah, Y., Amatekpor, J.K., Dowuona, G.N.N. and Duah-Yentumi, S. 1994. A field survey
report on soil and water resources o f Ghana. Their conservation, management and
constraints to their utilization for sustainable development, United Nations University
Institute for Natural Resources in Africa Report. November, 1994. pp. 131.
Alexander, M.1961. Introduction to Soil Microbiology.W iley, New York, N,Y.,472pp
Alexander, M.1977. Introduction to Soil Microbiology; 2nd ed.John W iley and Sons, New York,
NY. 133-146.
Page 106
Alexander, M. 1980. Effect o f acidity on micro organisms and microbial processes in soil. In
effects o f acid precipitation on Terrestrial Ecosystems (Hutchinson, T.C and.Havas, M.
eds).pp 363-380. Plenum, New York.
Allison, L.E.1965. Organic Carbon, W alkey-Black method. In: C.A. Black, D.D.Evans,
J.L. White, L.E. Ensminger and F.E.Clark (eds). Methods o f soil analysis.Part 2, Chemical
and Microbiological properties. American Society o f Agronmy Inc.Madison, Wisconsin,
pp .1372-1376.
Allison, F.E.1973. Soil Organic Matter and its Role in Crop Production. Developments in Soil
Science, 3. Elsevier, Amsterdam. 637-670 pp.
Andren O., Kalman, R. and Katterer, T. 1993. W ater and temperature dynamics in a clay soil
under winter wheat: influence on straw decomposition and N immobilization. Biol. Fertil
Soils 15:1-8.
Ankomah, A.B., Zapata, F.Z., Danso, S.K.A. and Axmann, H. 1995. Cowpea Varietal
Differences in uptake o f Phosphorus from Gafsa Phosphate rock-P. Ultilization. Fert.Res
41: 219-22
Bartholomew, W.V.1965. Mineralization and immobilization o f nitrogen in the decomposition
o f plant and animal residues. In: Soil Nitrogen (W.V. Bartholomew and F.E.Clark,eds),
pp. 285-306.Am.Soc.Agron., Madison,Wisconsin.
Bending, G.D., Turner, M.K. and Bums, I.G. 1998. Fate o f nitrogen from crop residues as
affected by biochemical quality and the microbial biomass. Soil Biol. Biochem. 30:
2055-2065.
91
Page 107
Berg, B. and Matzner, E. 1997. Effect o f N deposition on decomposition o f plant litter and soil
organic matter in forest ecosystems. Environmental Reviews 5: 1-25.Green Alert April 12,
2002. Vol. 1, No. 25
Bouldin, D.R. 1988. Effect o f Green manure on soil organic m atter content and nitrogen
availability .In International Rice Research Institute,eed, Green manure in Rice
fanning Proceedings o f a Symposium on sustainable agriculture.IRRI,Los Banos,
Philippine, pp 151-164, Los Bonos, Philippines.
Bouyoucos, G.J. 1962. Hydrometer method improved for making particle size analysis o f soils.
Agron. J.54:464-465.
Bowman, A.F. 1990. Exchange o f greenhouse gases between terrestrial ecosystems and the
atmosphere. In: Bowman, A.F. (ed) Soils and the Greenhouse Effect. Chechester, UK;
John Wiley, New York. Pp 66-127
Bowman, R.., Sucik, M., Rosales, M. and Saunders, J. 2002. Conservation Tillage Fact
Sheet.No.2-98 .USDA-ARS, USDA-NRCS and Colorado, Central Great Plains Research
Station, 2002 Annual Report, pp 1-5
Brady, N.C.1990. The Nature and Properties of Soils. 10thed. MacMilian publ., New York, NY.
pp.96-97,279-300, 328.
Brammer, H. 1962. Soils o f Ghana. In: J.B.Wills (ed) Agriculture and Land use in Ghana ,p
88-126,151-154 .Oxford University Press, New York.
Bray, R. H. and Kurtz. L.T. 1945. Determination o f total organic and available forms of
phosphorus in soils. Soil Sci.59: 39-45.
92
Page 108
Broder, M.W and Wagner,G.H. 1988. Microbial colonization and decomposition o f com, wheat,
and soybean residue. Soil Sci. Soc. Am. J. 52:112-117.
Brown, P.L. and Dickey, D.D., 1970. Soil Sci.Soc.Amer.Proc., 34:118-121
Brace, J. P., Frame, M., Haites, E., Janzen, H., Lai, R. and K. Paustian. 1999. Carbon
sequestration in soil. J. Soil W ater Cons. 54:382-389.
Buckman H.O. and Brady, N. C. 1969. The Nature and Properties o f Soils. 7th edition, The
Macmillian Company/ Collier-Macmillan Limited, London.ppl47-148
Burke, I.C., Yonker, C.M., Parton, W.J., Cole, C.V., Flach, K. and Schimel, D.S. 1989. Texture,
climate, and cultivation effects on soil organic matter content in U.S. grassland soils. Soil
Sci Soc Am J 53:800-5.
Campbell, C.A. 1978. Soil organic carbon, nitrogen and fertility. In Soil organic matter
(M.Shnitzer and S.U.Khan eds) pp 173-263. Am. Elsevier, New York
Chesson, A. 1997. Plant degradation by ruminants: Parallels with litter decomposition in soils, p.
47-66. In G. Cadisch and K.E. Giller (ed.) Driven by nature: Plant litter quality and
decomposition. CAB Int., Cambridge, UK
Christensen B.T.1996. Matching measurable soil organic matter fractions with conceptual pools
in simulation models o f carbon turnover: Revision o f model structure. In: Evaluation of
Soil Organic Matter Models (eds Powlson D.S., Smith P, Smith J.U.), NATO ASI Series
l,Vol.38. Springer-Verlag, Berlin.
Cochran, V.L., Elliott, L.F. and. Papendick, R.E. 1980. Carbon and nitrogen movement from
surface-applied wheat (Triticum aestivum L.) straw. Soil Sci. Soc. Am. J. 44:978-982.
93
Page 109
Cole, C.V., Duxbury, J., Freney, J., Heinemeyer, O., Minami, K., Mosier, A.., Paustian,
K.,Rosenberg, N., Sampson, N., Saverbeck,D.and Zhao, Q. 1997. Global estimates o f
potential mitigation o f greenhouse gas emissions by agriculture. Nutrient Cycling
Agroecosyst. 49: 221-228
Constantinides, M. and Fownes, J.H. 1994. Nitrogen mineralization from leaves and litter o f
tropical plants: Relationship to nitrogen, lignin, and soluble polyphenol concentrations.
Soil Biol. Biochem. 26:49-55.
Corbeels ,M.., Hofman, G. and Van Cleemput, O. 2000. Nitrogen cycling associated with the
decomposition o f sunflower stalks and wheat straw in a vertisol. Plant Soil; 218:71-82.
Cowling, E.B.and Merrill, W.1966. Nitrogen in wood and its role in wood deterioration. Can. J.
Bot. 44, 539-554.
Curtin, D., Wang, H., Selles, F., Zentner, R.P., Biederbeck, V.O. and Campbell, C.A. 2000.
Legume green manure as partial fallow replacement in semiarid Saskatchewan: Effect on
carbon fluxes. Canadian Journal o f Soil Science 80, 499 -505
Dendooven, L., Merckx, R., Verstraetem, L.M.J. and. Vlassak, K .1997. Failure o f literative
curve-fitting procedure to successfully estimate two organic N pools. Plant Soil
195:121-128
Dillon, W.R. and Goldstein, M. 1984. M ultivariate analysis: M ethods and applications. John
Wiley & Sons, New York. 587 pp
94
Page 110
Donigan, A.S. 1994: Assessment o f alternative management practices and policies affecting soil
carbon in agroecosystems o f the Central United States pp 32
Downs, M.R., Nadelhoffer, K.J., Melillo, J.M., Aber, J.D., 1996. Immobilization o f a N—
labeled nitrate addition by decomposing forest litter. Oecologia 105:141-50.
Duncan, R.R.1996. Breeding and improvement o f forage sorghums for the tropics, p. 161-185.
In D.L. Sparks (ed) Advances in agronomy. Vol.57. Academic Press, Inc.
Edmeades, D.C., Judd, M. and Sarathchandra, S.U. 1981.The effect o f lime on nitrogen
mineralization as measured by grass growth. Plant soil 60,177-186.
Elliott, E.T. 1994. “Embodying process information in models evaluated with site network
information: Nnairobi workshop.” 10th W orld Congress o f Soil Science 9 (Supplement):
163-177.
Fabrizzi ,K,P., Rice, C.W, Staggenborg ,S. 2004. Managing the microbial community for soil
management. In 2004 Agronomy Abstracts [in press]. ASA, Madison, WL p 5
Feller, C., Frisch, E., Poss, R. and Valentin, C. 1991. Effects o f the texture on the storage and
dynamics o f organic matter in some low activity clay soils (W est Africa particularly)
Cah. ORSTOM, Ser.Pedol. XXVI: 25-36.
Feng, Y. and X. Li. 2001a. An analytical model o f soil organic carbon dynamics based on a
simple hockey stick” function. Soil Science, vol 166: 431-440
Feng, Y. and Li, X. 200lb.Carbon sequestration potential in Agricultural soils. AIDIS-
CANADA Environmental Project. Canadian International Development Agency
(CIDA), Alberta Research Council Inc. (ARC) and AIDIS. 1- 5
95
Page 111
Feng, Y. and Li, X. 2002. A tool to determine Long-term Sustainable Manure Application Rate
for Alberta Soils. Report to Canadian-Alberta Beef Industry Development Fund. p l20 .
Fog, K .1988. The effect o f added nitrogen on the rate o f decomposition o f organic matter. Biol
Rev 63:433-62p
Fox, R. H., Myers, R.J.K. and Vallis, I.. 1990. The Nitrogen mineralization rate o f legume
residues in soil as influenced by their polyphenol, lignin and Nitrogen contents, Plant
Soil 29:251-254
Frankenberger, W.T. Jr. and Abdelmagid, H.M. 1985. Kinetic parameters o f nitrogen
mineralization rates o f leguminous crops incorporated into soil. Plant Soil 87:257-271
Frissel, M.J.and Van Veen, J.A. 1981. Simulation model for nitrogen immobilization and
mineralization. In: Modelling W astewater Renovation by Land Disposal. I.K.
Iskandar(ed.) John W iley et al., New York, P. 359-381.
Garten, C.T. and Wullschleger, S.D. 2000. Soil carbon dynamics beneath switchgrass as
indicated by stable isotope analysis. Journal o f Environmental Quality 29, 645-653
Gill, R.S. and Lavender D.P. 1983. Litter decomposition in coastal hemlock (Tsuga
heterophylla) stands: impact o f nitrogen fertilizers on decay rates. Can J For Res 13:116—
21.
Giller, K.E. and Cadisch, G .1997. Driven by nature: A sense of arrival or departure? p. 393-
499. In G. Cadisch and K.E. Giller (ed.) Driven by nature: Plant litter quality and
decomposition. CAB Int., Cambridge, UK.
Gilmour, J.T., Mauromoustakos, A., Gale, P.M. and Norman, R.J. 1998. Kinetics o f crop residue
decomposition: Variability among crops and years. Soil Sci. Soc. Am. J. 62:750-755
96
Page 112
Glenn, E., Squires, V., Olsen, M. and Frye. 1993. .Potential for Carbon sequestration in
Drylands, Water, Air and Soil pollution 70, 341-355
Goings, K.A. 2001. Basic Biological factors o f soil carbon and nitrogen. National Soil Survey
Center NRCS,USDA, Lincoln, Nebraska.
Gordillo, R.M. and Cabrera, M.L. 1997. Mineralizable nitrogen in broiler litter: I. Effect o f
selected litter chemical characteristics. J. Environ. Qual. 26:1672-1679
Grant C.A. and Bailey, L.D. 1994. The effect o f tillage and KCL addition on pH,
Conductance, P,K,CL. Can. J. Soil Sci: 74:307
Greenland, D.J. and Nye, P.H. 1959. .Increase in the carbon and nitrogen contents o f tropical
soils under natural fallows. J. Soil Science 10:284-99.
Gregorich, E.G., Rochette, P., McGuire, S., Liang, B.C. and Lessard, R. 1998. Soluble organic
carbon and carbon dioxide fluxes in maize fields receiving spring-applied manure.
Journal o f Environmental Quality 27, 209-214.
Grim,R .E.,1953.Clay Mineralogy.McGraw Hill, NewYork.N.Y.,384pp
Hassink, J. 1996. Preservation o f plant residues in soil differing in unsaturated protective
capacity. Soil Science America Journal 60, 487-491
Hassink, J., Whitmore, A.P. and Kubat, J., 1997. Size and density fractionation o f soil organic
matter and the physical capacity o f soils to protect organic matter. European Journal o f
Agronomy 7, 189-199.
Haynes, R.J., Cameron, K.C., Goh, K.M. and Sherlock, R.R. 1986. Mineral Nitrogen in the
Plant-Soil Systems pp 82-106.Academic Press,Inc.
Page 113
Heal, O.W., Anderson, J.M. and Swift, M.J. 1997. Plant litter quality and decomposition: An
historical overview, p. 3-30. In G. Cadisch and K.E. Giller (ed.) Driven by nature: Plant
litter quality and decomposition. CAB Int., Cambridge, UK.
Henriksen, T.M. and T.A. Breland. 1999. Evaluation o f criteria for describing crop residue
degradability in a model o f carbon and nitrogen turnover in soil. Soil Biol. Biochem.
31:1135-1149.
Hesse, P.R. 1971. A textbook o f soil chemical analysis. New York, John Murray Publishers
Ltd.
Hobbie, S.E. 2000. Interactions between litter lignin and soil nitrogen availability during leaf
litter decomposition in a Ha-waiian montane forest. Ecosystems 3:484—94.
Hobbie S.E. and Vitousek, P.M. 2000. Nutrient regulation o f decomposition in Hawaiian
montane forests: do the same nutrients lim it production and decomposition? Ecology.
81:1867-1877.
Honeycutt, C.W. and Potaro, L.J. 1990. Field evaluation of heat units for predicting crop residue
carbon and nitrogen mineralization. Plant Soil 125:213-220
Honeycutt, C.W., Potaro, L. J., Avila, K.L. and. Halterman, W .A .1993. Residue quality, loading
rate, and soil temperature relations with hairy vetch ( Vicia villosa Roth) residue carbon,
nitrogen, and phosphorus mineralization. Biol. Agric. Hortic. 9:181-199.
98
Page 114
Hu, S., Berkeley, F.S., Chapin, II., Firestone, M.K., Field, C.B and Chiariello, N.R. 2001.
Nitrogen limitation of microbial decomposition in a grassland under elevated CO2.
Carnegie Institution o f Washington. Published: Nature .Jan. 11, 2001.
Hunt, H.W., Ingham, E.R, Coleman, D.C, Elliott, E.T. and Reid, C.P.P. 1988. Nitrogen
limitation o f production and decomposition in prairies, mountain meadow, and pine forest.
Ecology 69:1009-1016.
IPCC .2000. Land-use, Land use Change, and Forestry .Eds: Watson, R.T., Noble, I.R.,
Bolin,B., Ravindranath, N.H.., Verado, D.J. and Dokken, D.J. A Special Report o f the
Intergovernmental Panel on Climate Change, pp .30. Cambridge University Press, NY.
IPCC. 2001. Climate Change 2001: Impacts, adaptation and vulnerability . Eds: McCarthy, J.J.,
Canziani, O.F., Leary, N.,A., Dokken D.J and White,K.S. A Special Report o f the
Intergovernmental Panel on Climate Change, pp. 30. Cambridge University Press, NY.
Jenkinson,D.S. and Rayner, J.H. 1977. The turnover o f soil organic matter in some o f the
Rothamsted classical experiments. Soil Sci., 123:298-305
Jenkinson, D.S., Hart, P.B.S., Rayner, J.H. and. Parry, L.C. 1987. Modeling the turnover o f
organic matter in long-term experiments at Rothamsted. INTECOL Bulletin 15, 1-8.
Jenkinson D.S.1990.The turnover o f organic carbon and nitrogen in soil. Philosophical
Transactions o f the Royal Society .London series.B.329, 361-368.
Jenkinson, D.S., Adams, D.E. and Wild, A. 1991. Model estimates o f CO2 missions from soil in
response to global warming. Nature 351:304-306.
Jenny, H., Gessel, S.P. and Bingham, F.T.1949. Comparative study o f decomposition rates o f
organic matter in tropical and temperate regions. Soil Science 68:419-32.
Page 115
Jensen, E.S. 1994. Mineralization-irrimobilization o f nitrogen in soil amended with low C/N
ratio plant residues with different particle size. Soil Biol. Biochem. 26:519-521 b.
Johnson, R.A. and W ichem, D.W. 1998. Applied multivariate statistical analysis. 4th ed.
Prentice Hall, Upper Saddle River, NJ. 816p
Juma, N. G. and McGill, W. B. 1986. Decomposition and nutrient cycling in agro-ecosystems,
pp 74-136 In M. J. Mitchell and J. P. Nakas (ed) Microfloral and faunal interactions in
natural and agro-ecosystems. Martinus Nijhoff/Dr. W. Junk Publishers
Kaboneka, S., Sabbe, W.E. and Mauromoustakos, A. 1997. Carbon decomposition kinetics and
nitrogen mineralization from com, soybean, and wheat residues. Commun. Soil Sci. Plant
Anal. 28 (15&16): 1359-1373.
King, A.W., Post, W.M. and. Wullschleger, S.D. 1996. “The potential response o f terrestrial
carbon storage to changes in climate and atmospheric CO2 .” Climate Change 35: 199—
228
King J.S., Allen, H.L., Dougherty, P. and Strain, B.R. 1997. Decomposition o f roots in loblolly
pine: effects o f nutrient and water availability and root size class on mass loss and nutrient
dynamics. Plant Soil 195:171-84.
Kononova, M.M. 1966. Soil organic matter, its nature, its role in soil formation and in soil
fertility. Pergammon Press, Oxford, pp 252.
Kowanlenko, C.G. 1978. Organic Nitrogen, Phosphorus and Sulfur in Soils pp 95-136. In: Soil
Organic Matter.M.Schnitzer and S.U Khan-(eds). Elsevier Scientific Publishing Co.,
Newyork,NY
100
Page 116
Kreger, C. 2004. Exploring the environment global climate change.Wheeling Jesuit University
NASA. 1-12p
Kuo, S., Sainju, U.M. and Jellum, E.J. 1997. W inter cover cropping influence on nitrogen in
soil. Soil Sci. Soc. Am. J. 61:1392-1399.
Kuo, S. and Sainju, U.M. 1998. Nitrogen mineralization and availability o f mixed leguminous
and non-leguminous cover crop residues in soil. Biol. Fertil. Soils 22:310-317.
Lai, R. 1997. Residue management, conservation tillage and soil restoration for mitigating
greenhouse effect by C 0 2- enrichment. Soil & Tillage Research. 43, 81-107.
Lai, R., Kimble, J.M., Follett, R. F. and Cole, C.V. 1999. Managing U.S. cropland to sequester
carbon in soil. Journal o f Soil W ater Conservation. 54: 374-381.
Larson, W.E., Clapp, C.E., Pierre, W.H. and Morachan, Y.B., 1972. Effects o f increasing
amounts o f organic residues on continous com. II. Organic carbon, nitrogen, phosporus
and Sulphur. Agron.J. 64: 204-208
Liski, J., Ilvesniemi, H., Makela, A. and Westman, C.J. 1999. CO2 emissions from soil in
response to climatic warming are overestimated - The decomposition o f old soil organic
matter is tolerant o f temperature. Ambio 28: 171-174
Magill, A.H.and Aber, J.D. 1998. Long-term effects o f experimental nitrogen additions on foliar
litter decay and humus formation in forest ecosystems. Plant Soil 203:301-11
Mahendrappa, M.K. 1978. Changes in the organic layers under a black spruce stand fertilized
with urea and tripple superphosphate. Can. J .For .Res.8, 237-242.
Maikslenien, S. 2000. Possibilities o f primary tillage reduction in clay loam soil. The results o f
long- term field experiments in Battic States, p p l0 6 -l 13.Jelgava.In Lauringson ,E.,
Page 117
Talgre.L.,, Roostatu ,H. and Vooper,H. Agronomy Research 2 ( i i ) ,63-70,2004.The effect
o f tillge and crop rotation on the content o f available nitrogen, phosphorus and
potassium.
Manu, A., Bationo, A. and Geiger, S.C. 1991. Fertility status o f selected millet producing soils
o f W est Africa with emphasis on phosphorus. Soil Sci. 152:315-320.
Martin, J.P. and Haider, K 1986. Influence o f mineral colloids on turnover rates o f soil organic
carbon, p. 283- 304. In P.M.H.;M. Schnitzer (ed.) Interactions o f Soil Minerals with
Natural Organics and Microbes. SSSA Spec. Publ. 17. Soil Sci. Soc. Amer., Madison,
WL
McBridge, M.B.1994. Environmental chemistry o f soils. Oxford University Press, Oxford,UK.
p336
McGill, W.B. 1996. “Review and classification o f ten soil organic matter (SOM) models.” In
D.S.Powlson, P.Smith, and J.U. Smith (eds), Evaluation o f soil organic m atter models
using existing, long-term datasets. NATO ASI Series, Global Environmental Change,
Vol. 38, pp. 111-132, Springer Verlag, Berlin.
McGill, W.B., Hunt, H.W., Woodmansee, R.G. and Reuss, J.O. 1981. PHOENIX: A model o f
the dynamics o f carbon and nitrogen in grassland soils. Ecol. Bull., 33: 49-115.
McKenney, D.J., Wang, S.W., Drury, C.F. and Findlay, W.I. 1995. Denitrification,
immobilization, and mineralization in nitrate limited and non limited residue-amended
soil. Soil Sci. Soc. Am. J. 59:118-124.
McNelly, J. 1999. National Technological Composting systems. Inc, http;//www; composter.
com.thus sep.2:13, 43:12
Page 118
Melillo, J.M., Aber, J.D. and Muratore, J.F.1982. Nitrogen and lignin control o f hardwood leaf
litter decomposition dynamics. Ecology 63:621-6.
Merritts, D., Dewet, A. and Menking, K. 1998. Environmental Geology. An Earth System
Science Approach. W.H. Freeman and company, New York, N Y .1-179
Miller, P., Engel, R.and Brinklemyer, R. 2004. Soil carbon Sequestration: Farm Management
Practices Can Affect Greenhouse Gases. MontGuide Fact Sheet #200404/Agriculture
from the Montana State University Extension Service Issued April 2004
Muller, M.M., Sundman, V.., Soininvaara, O. and Merilainen, A.. 1988. Effect o f chemical
composition on the release o f nitrogen from agricultural plant materials decomposing in
soil under field conditions. Biol. Fertil. Soils 6:78-83.
Mulungoy, K. and Merckx, R. 1991. Soil Organic Matter Dynamics and Sustainability o f
Tropical Agriculture.John Wiley and Sons, Chichester-New York, Toronto. pp7-10
Murphy, J. and Riley, J.P. 1962. A modified single method for the determination o f phosphate in
natural waters. Anal. Chim. Acta. pp. 27: 31-31.
Nichols, 1984. Relation o f organic carbon to soil properties and climate in the Southern Great
Plains. Soil Sci.Soc. Amer, J.pp 1382-1384.
Nziguheba, G. 2001. Improving phosphorus availiablility and maize production through organic
and inorganic amendments in phosphorus deficient soils in W estern Kenya. PhD Thesis
Katholieke University Leuven, Belgium .pp .462
O’Connell, A.M. 1994. Decomposition and nutrient content of-litter in a fertilized eucalypt
forest. Biol Fertil Soils 17:159-66.
103
Page 119
Oglesby, K.A.and Fownes, J.H. 1992. Effects o f chemical composition on nitrogen
mineralization from green manures o f seven tropical leguminous trees. Plant Soil
143(1): 127—132.
Olson, J.S.1963. Energy Storage and the balance o f producers and decomposers in ecological systems. Ecology 44:322-330.
Parker, D.T., 1962. Decomposition in the field o f buried and surface cornstalk residue. Soil Sci.
Soc.Am.Proc., 26: 559-562.
Parr, J.F. and Papendick, R.I. 1978. Factors affecting the decomposition o f crop residues by
microorganisms, p. 101-129. In: W.R. Oschwld (ed.) Crop residue management systems.
ASA Spec. Publ. 31. ASA, CSSA, SSSA, Madison, WL
Parton, W.J., Anderson, D.W., Cole, C.V. and Stewart, J.W.B. 1983. Simulation o f soil organic
matter formation and mineralization in somi-arid agroecosystems, pp. 533-550 In R.R.
Lowrance et al. (ed) Nutrient Cycling in Agricultural Ecosystems. University o f Georgia
special Publications, vol. 23.
Parton, W.J., Schimel, D.S., Cole, C.V. and. Ojima,D.S. 1987. Analysis o f factors controlling
organic matter levels in Great Plains grasslands. Soil Sci. Soc. Am. J. 51:1173-1179.
Parton, W.J., Ojima, D.S., Cole, C.C. and Schimel, D.M. 1994. A general model for soil organic
matter dynamics: Sensitivity to litter chemistry, texture and management, p. 147-167. In
R.B. Bryant and R.W. Arnold (ed.) Quantitative modeling o f soil forming processes.
SSSA Spec. Publ. 39. SSSA, Madison, W l
Pastor, J., Stillwell, M.A. and Tilman, D. 1987. Little blue stem litter dynamics in Minnesota
old fields. Oecologia 72:327-30.
Page 120
Paul, E.A. and Clark F.E. 1989. Soil Microbiology and Biochemistry. 2nd ed. San Diego: Academic Press, p 11 -234
Paul, E.A., Paustian, E., Elliott, T.and Cole, C.V. 1997. Soil organic matter in temperate
agroecosystems: Long-term Experiments in North America. CRC Press, Boca Raton,
FL.224 p
Paustian, K. 1998. Opportunities for Agriculture to mitigate greenhouse gases: A Grass Roots
Approach. Agricultural Outlook forum. Feb.23, 10:30-12:15
Paustian, K., Conant, R., Ogle, S., Paul, E. and Six, J. 2002. Environmental and Management
drivers o f soil organic carbon stock changes. University o f Califomia-Davis 15-18
October Plenary Session 2 OECD Expert Meeting on Soil Organic Carbon Indicators for
Agricultural Land. Ottawa, Canada
Phogat, V.K., Agrawal, R.P., Oswal, M.C. and Kuhad, M.S. 1999. Laoratory Manual for Soil
Physical Analysis.Dept, o f Soil Sci., CCS Haryana Agricultural University, India, Pp 16-
18.
Prescott, C.E. 1995. Does nitrogen availability control rates o f litter decomposition in forests?
Plant Soil Vol. 168-9:83-8.
Prescott ,C,E., Corbin, J.P. and Parkinson, D. 1992. Immobilization and availability o f N and P
in the forest floors o f fertilized Rocky Mountain coniferous forests. Plant Soil 143:1-10
Purves, W. K. and Orians, G.H. and Helle, H.C.1995. Life. The Science o f Biology. Fouth
Edition, Sinaver Associates, Inc., Sunderland. M.A. pp. 305
Quemada, M. and Cabrera., M.L. 1995.Carbon and nitrogen mineralization from leaves and
stems o f four cover crops.Soil Sci.Soc.Am.J.59:471-477.
Page 121
Recous, S., Robin, D., Darwis, D. and Mary, B. 1995. Soil inorganic N availability: effect on
maize residue decomposition. Soil Biol. Biochem.; 27:1529-1538
Reinertsen, S. A., Elliott, F.F., Cochran, V.L. and Campbell, G.S. 1984. Role o f available carbon
and nitrogen in determining the rate o f wheat straw decomposition. Soil Biol. Biochem.
16:459-464.
Rice, C.W. and Angle J.S. 2004. Applications o f biotechnology to mitigation o f greenhouse
warming: A role for genetically modified organisms in soil carbon sequestration. P. 61-78.
In: Proceeding o f the St. M ichael’s II Workshop, April 2003.
Rice, C.W., White, P. M., Fabrizzi, K. P. and Wilson, G. W. T. 2004. M anaging the microbial
community for soil carbon management.In: Sighn B (ed) Supersoil. 2004 3rd Australian
New Zealand Soil Conference, 5-9 Dec. 2004. University o f Sydney. Australia
Ruffo, M .L. and Bollero., G. A. 2003 .Residue Decomposition and Prediction o f Carbon and
Nitrogen Release Rates Based on Biochemical Fractions Using Principal-Component
Regression In Modeling rye and hairy vetch residue decomposition as a function o f
degree-days and decomposition-days. Agron. J. 95:1034-1040.
SAS Institute. 1991. SAS user's guide: Version 6.03 ed. SAS Inst.Statistics. SAS Inst., Cary,NC.
Schimel, D.S., Stillwell, M.A. and R.G.W oodmansee, 1985. Biochemistry o f C, N and P in a
soil catena of the short grass steppe. Ecol.66:276-282.
Schlesinger, W.H. 1997. Biogeochemistry. An analysis o f global change. 2nd ed. San Diego.
Academic Press.p.156
Page 122
Science Daily Magazine 1995— 2003.Editor@Science daily.com
Shields, J. A and Paul, E.A. 1973. Decomposition o f 4 C qabeled plant m at under field
conditions. Can.J.Soil Sci.., 53: 297-306.
Smith, J.L., Papendick, R.I., Bezdicek, D.F. and. Lynch, J.M. 1992. Soil organic matter
dynamics and crop residue management, p. 65-94. In: B. Metting (ed.) Soil microbial
ecology. Marcel Dekker, New York.
Smith, P., Smith, J.U., Powlson, D.S., McGill, W.B., Arah, J.R.M., Chertov, O.G., Coleman, K.,
Franko, U., Frolking, S., Jenkinson, D.S., Jensen, L.S., Kelly, R.H., Klein Gunnewiek,
H., Komarov, A.S., Li, C., Molina, J.A.E., Mueller, T., Parton, W.J., Thomley, J.H.M.,
Whitmore, A.P. and. Elliott, E.T. 1997. A comparison o f the performance o f nine soil
organic matter models using datasets from seven long-term experiments. Geoderma
81:153-225.
Spain, A. 1990 .Influence o f environmental conditions and some soil chemical properties on the
carbon and nitrogen o f some Australian rainforest soils.Aust.J.Soil Res 28:828-839.
Staaf, H. 1980. Influence o f chemical composition, addition o f raspberry leaves and nitrogen
supply on decomposition rates and dynamics of nitrogen and phosphorus in beech (Fagus
sylvatica) leaf litter. Oikos 35:55-62
Steiner, J.L., Schomberg, H.H., Unger, P.W. and Cresap. J. 1999. Crop residue decomposition in
no-tillage small-grain fields. Soil Sci. Soc. Am. J. 63:1817-1824]
Stroo, H.F., Bristow, K.L., Elliott, L.F., Papendick, R.I. and Campbell, G.S. 1989. Predicting
rates o f wheat residue decomposition. Soil Sci. Soc. Am. J. 53:91-99.
Page 123
Stout, J.D., Goh, K.M. and R after,!. A. 1981. Chemistry and turnover o f naturally occurring
resistant organic compounds in soil. In: Soil Biochemistry (E.A. Paul and J.N.Ladd eds)
Vol.5. pp .1-73. Dekker, New York.
Swift, M.J., Heal, O.W and Anderson, J.M. 1979.The influence o f resources quality on
decomposition processes, In: decomposition in Terrestrial Ecosystems, Oxford, UK,
Blackwel.
Taylor, B.R., Parkinson, D. and Parsons, W.F.J. 1989. Nitrogen and lignin as predictors o f litter
decay rates: a microcosm test. Ecology. 70:97-104.
Theodorou, C. and Bowen, G.D. 1990. Effects o f fertilizer on litterfall and nitrogen and
phosphorus release from decomposing litter in a Pinus radiata plantation. For Ecol
Manage 32:87-102.
Thien, S.J. and Graveel, J.G. 1997. Laboratory Manual for Soil Science, 7th ed. Agricultural
and Environmental Principles, pp. 167-183.
Thomas, R.J. and Asakawa., N. M. 1993. Decomposition o f leaf litter from tropical forage
grasses and legumes. Soil Biol. Biochem. 25:1351-1361
Thompson, L.M. 1957. Soils and Soil Fertility. 2nd edition. Mcgraw-willly book Company.New
York.Toronto London .. pg. 85-102.
Thompson, L.M. and Troeh, F.R. 1978. Soils and Soil Fertility,4th edition. Mcgraw -H ill book
Company.5:120-122.
Tisdale, S.L. and Nelson, W.L. 1966. Soil Fertility and Fertilizers. 2nd edition. Macmillan
Company, New York, Colliner-macmillan limited. London. 5:133-137.
Page 124
Titus, B.D. and Malcolm, D.C. 1987. The effect o f fertilization on litter decomposition in
clearfelled spruce stands. Plant Soil 100: 297-322.
Trinsoutrot, I., Recous, S., Bentz, B., Lineres, M., Cheneby, D. and Nicolardot, B. 2000.
Biochemical quality o f crop residues and carbon and nitrogen mineralization kinetics
under non-limiting nitrogen conditions. Soil Sci. Soc. Am. J. 64:918-926.
Trumbore.S.E., Davidson,E.A, de Camargo, P.B, Nepstad, D.C,Martinelli, L.A. 1995.
Belowground cycling o f carbon in forests and pastures o f Eastern Amazonia.Global
Biogeochemical Cycles 9, 515-528.
Turner, J. and Lambert, M. 2000. Change in organic carbon in forest plantation soils in eastern
Australia. Forest Ecology and M anagement 133, 231-247.
Vallis, I. and Jones, R. 1973. Net mineralization o f nitrogen in leaves and leaf litter of
Desmodium intortum and Phaseolus atropurpureus m ixed with soil. Soil
Biol.Biochem.5:391-398.
Van Faasen, H.G. and Smilde, K.W, 1985. Organic matter and nitrogen turnover in soils. In:
Proceedings o f Symposium, Nitrogen Management in Farming Systems in Humid and
Subhumid Tropics. Kang, B.T. and Van der Heide, J. (eds) International Institute o f
Tropical Agriculture, Ibadan, Nigeria and Institute o f Soil Fertility, Haren, The
Netherlands, pp.39-55.
Vanlauwe, B., Nwoke, O.C., Sanginga, N. and Merckx, R. 1996.Impact o f residues quality on
the C and N mineralization o f leaf and root residues o f three agroforestry species. Plant
Soil; 183:221-231.
Van Veen, J.A. and Paul, E.A. 1981 : Organic carbon dynamics in grassland soils.1.
Background information and computer simulation. Can. J. Soil Science (61), P. 185-201
Page 125
110
Van Vuuren, M.M.I. and Van der Eerden, L.J. 1992. Effects o f three rates o f atmospheric
nitrogen deposition enriched with decomposition in a heathland. Soil Biol Biochem
24:527-32.
Vigil, M.F. and. Kissel. D.E 1991. Equations for estimating the amount o f nitrogen mineralized
from crop residues. Soil Sci. Soc. Am. J. 55:757-761
Vigil, M.F., and Kissel. D.E. 1995. Rate o f nitrogen mineralized from incorporated crop
residues as influenced by temperature. Soil Sci. Soc. Am. J. 59:1636-1644
Vigil, M.F. and Sparks, D.L. 2002. Factors affecting the Rate o f Crop Residue Decomposition
under field conditions. Conservation tillage Fact Sheet No.3-95. Published by USDA-
ARS, USDA-NRCS, Alamosa, Co. p 1-5
Vine, H. 1953. Experimentation on the maintenance o f soil fertility at Ibadan, Nigeria, 1922-51.
The Empire. J.of Exp. Agric .21:65-85.
White, P.M. Jr., Rice, C.W. and Tuinstra, M.R. 2003. Potential for enhanced soil carbon
sequestration using lodging-resistant grain sorghum varieties. In: 2003 Agronomy
Abstracts [CD-ROM]. ASA, Madison, Wl.
White, R.E .1979. Introduction to the Principles and Practices o f Soil Science. Blackwell-
Scienticfic publications. Oxford, London Edinburgh Melbourne. 3: 24-37.
Wielopolski, L .\ Mitra, S., Hendrey, G., Orion, I., Prior, S.A., Rogers Jr, H.H., Runion, G.B.,
Torbert III, H.A. 2004. Non-Destructive Soil Carbon Analyzer (Nd.sa). Technical Report,
Terrestrial Carbon Processess (Tcp).Program o f the office o f science, Biological and
Page 126
Environmental Research. (Ber), US. Department o f Energy, Germantown, Md.89
Brookhawn National labourtory report 72, 2000 -2004.
Wilson, J.M. and Griffin, D.M. 1975. W ater potential and the respiration o f microorganisms’
science in the soil .pp 141-163. In Soil Biol.Biochem.7, 199-204.
Wise, R. and Cacho, O. 1999. A Bioeconomic Analysis o f Soil Carbon Sequestration in
Agroforests.W orking paper. C C 02. ACIAR project ASEM. 1999/093.
Woomer, P.L., Martin, A., Albrechit, A.R. and Scharpenseel, H. W.1994. The importance of
management o f soil organic matter in the tropics. 74-80 In: Biological Management o f
Tropical Soil Fertility.PL W oomer andMJ Swift (eds) John W iley Chichester, UK.
World Reference Bases (WRB-Reference Groups (FAO/ISICI/ISSS, 1998). Food and
Agriculture Organization o f the United Nations Europeon Commission-Joint Research
Centre.Intemational Soil Reference and Information Centre.
Yoshida, T.1975. Microbial metabolism o f flooded soils. In: Soil Biochemistry (E.A.Paul and
A.D. McLaren, eds), Vol.3. pp 83-112. Dekker, New York.
I l l
Page 127
112
APPENDIX 1
Analysis o f variance for half-life at W ater treatment W l
Source o f variation d.f. s.s. m.s. v.r. F pr.
treatments 4 1032.00 258.00 14.02 0.001**
Rep 2 110.80 55.40 3.01 0.106
Residual 8 147.20 18.40
Total 14 1290.00
Tables o f means
Residue treatments 1.00 2.00 3.00 4.00 5.00 L.S.D.
58.0 38.0| 40.0 34.0i 40.0 8.08
APPENDIX 2
Analysis o f variance for H alf -life of residue drv weight ('Days’) for W2 water treatments
Source o f variation d.f. s.s. m.s. v.r. F pr.
Treatments 4 585.60 146.40 2.63 0.114
Rep 2 12.40 6.20 0.11 0.896
Residual 8 445.60 55.70
Total 14 1043.60
Tables o f means
Treatment 1.00 2.00 3.00 4.00 5.00 L.S.D S.E
62.0 48.0 50.0 50.0 62.0 14.05 4.31
S.E. -standard error o f the means
Page 128
Analysis o f variance for H alf-life of residue dry weight ('Days') for W3 water
Source o f variation d.f. s.s. m.s. v.r.
Residue treatments 4 1394.400 348.600 108.94
Rep 2 176.400 88.200 27.56
Residual 8 25.600 3.200
Total 14 1596.400
Tables o f means
Residue treatments 1.00 2.00 3.00 4.00 5.00 L.S.D
80.00 85.00 84.00 76.00 104.00 3.368
113
APPENDIX 3
APPENDIX 4
Analysis o f variance for the k -value for residue RT1
Source of variation d.f. s.s. m.s.
Water level
k-reps
Residual
Total
Tables of means
Water levels
kreps
2
2
4
1.00
1.00
- 0.0110
2.00
-0.0130 -0.0110
2.00
-0.0097
3.00
-0.0090
3.00
-0.0123
v.r.
0.00002400 0.00001200 0.54
0.00001067 0.00000533 0.24
0.00008933 0.00002233
0.00012400
L.S.D
0.01071
0.01071
treatments
F pr.
<001**
<.001**
S.E
1.033
F pr.
0.621
0.798
S.E.
0.00273
0.00273
Page 129
114
APPENDIX 5
Analysis o f variance for the k-value for residue treatment RT2
Source o f variation d.f. s.s. m.s. v.r. F pr.
Water levels 2 0.000218 0.00010900 6.67 0.053*
k-reps 2 0.00004267 0.00002133 1.31 0.366
Residual 4 0.00006533 0.00001633
Total 8 0.00032600
Tables o f means
Water levels 1.00 2.00 3.00 L.S.D S.E
0.0200 -0.0150 -0.0080 0.0092 0.00233
APPENDIX 6
Analysis o f variance o f the k-value for residue treatment RT3
Source o f variation d.f. s.s. m.s. v.r. F p r.
Water level 2 0.152E-03 0.760E-04 14.25 0.015*
k-reps 2 0.107E-04 0.533E-05 1.00 0.444
Residual 4 0.213E-04 0.533E-05
Total 8 0.184E-03
Tables o f means
Water levels 1.00 2.00 3.00 L.S.D S.E
-0.01800 -0.01400 -0.00800 0.0052 0.0013
k-reps 1.00 2.00 3.00
-0.01333 -0.01467 -0.01200
Page 130
115
APPENDIX 7
Analysis o f variance for the k-value for residue treatment RT4
Source o f variation d.f. s.s.
W ater levels 2 0.258E
k-reps 2 0.267E-05
Residual 4 0.533E-05
Total 8 0.266E-03
Tables o f means
Water level 1.00 2.00 3.00
-0.02200 -0.01400 -0.00900
kreps 1.00 2.00 3.00
-0.01500 -0.01433 -0.01567
m.s. v.r.
0.129E-03 96.75
0.133E-05
0.133E-05
1.00
F pr.
<001**
0.444
L.S.D. S.E.
0.002618 0.00067
APPENDIX 8
Analysis o f variance for the k-value for residue treatment RT5
Source o f variation d.f. s.s. m.s. v.r. F pr.
Water levels 2 0.0002 0.00013 0.89 0.115
k-reps 2 0.00005 0.00002711 1.00 0.444
Residual 4 0.000108 0.00002711
Total 8 0.00037356
Page 131
116
Tables o f means
W ater level 1.00 2.00 3.00 L.S.D
-0.0187 -0.0110 -0.0070 0.01180
k-reps 1.00 2.00 3.00
-0.0120 -0.0153 -0.0093
S.E
0.00301