+ All Categories
Home > Documents > ASSESSING THE SUCCESS OF SIX SIGMA: AN EMPIRICAL STUDY …

ASSESSING THE SUCCESS OF SIX SIGMA: AN EMPIRICAL STUDY …

Date post: 19-Mar-2022
Category:
Upload: others
View: 4 times
Download: 0 times
Share this document with a friend
14
ELK Asia Pacific Journals Special Issue ISBN: 978-81-930411-4-7 ASSESSING THE SUCCESS OF SIX SIGMA: AN EMPIRICAL STUDY S. K. Tiwari Department of Production Engineering Birla Institute of Technology, Mesra, Deoghar Campus Deoghar, Jharkhand, India. Pin Code: 814142 Email: [email protected] R. K. Singh Department of Production Engineering Birla Institute of Technology, Mesra Ranchi, Jharkhand, India. Pin Code: 835215 Email: [email protected] S. C. Srivastava Department of Production Engineering Birla Institute of Technology, Mesra Ranchi, Jharkhand, India. Pin Code: 835215 Email: [email protected] Abstract-In response to the ever increasing demand of customer and prompt changing economic conditions, various industrial engineering and quality management strategies such as ISO 9000, total quality management (TQM), lean manufacturing, manufacturing recourse planning, modular design, reengineering, flexible manufacturing system (FMS), etc., are adopted by the corporations to compete in the current competitive market. However, from the last three decades a new paradigm, known as “Six Sigma”, has made its prime impact in the area of manufacturing strategies to solve the problems related to the quality and productivity. In this paper, a case of Indian foundry unit has been presented to explore the effectiveness of six sigma methodology. The DMAIC (Define-Measure-Analyze-Improve- Control) approach of six sigma has been followed here to reduce percentage of defects in green sand casting process. In addition, Taguchi method of parameter design is used to set the optimal process parameters in the ‘Improve phase’. Analysis of variance (ANOVA) is then performed to find the optimal parameter levels and to identify the statistical significance and contribution of each factor on the casting defects. Finally, a confirmation test is performed using the optimal parameter setting, which shows that the casting defects can be minimized, effectively. The results show that after successful deployment of six sigma, the percentage of casting defects is reduced by 25.44%. Key Words: green sand casting, six sigma, casting defects, Taguchi technique, design of experiment (DOE), orthogonal array (OA), signal-to-noise ratio, analysis of variance (ANOVA). I. INTRODUCTION Six sigma is a systematic business management philosophy which concentrates on identifying and eliminating defects, mistakes and variations in a product, process, or service in order to ameliorate the quality at minimum cost. In general, six sigma is a fact-driven, disciplined and statistical approach that is traced to eliminate defects and lead processes to achieve perfection. Being a multifarious system in making business leadership performance more preponderant, six sigma doesn’t work based on any single theory/strategy, but it is based on the results driven strategies. The primary goal of six sigma is to ameliorate customer contentment by reducing variation in the process which in turn reduces defects. Six sigma is a quality amelioration initiative that has been evolved over 25 years of scientific management and perpetual amendment theories. Originally, it was originated by Bill Smith and first utilized by Motorola Corporation in 1986 and targeted a truculent goal of 3.4 defects per million opportunities (DPMO) [1] and had been recognized as a systematic and structured methodology that endeavors to ameliorate operations by eliminating the root causes of defects through focusing on customer needs. After, Motorola won the Malcom Balridge National Quality Award in 1988 for achieving business excellence through six sigma philosophy, six sigma propagated and the six sigma revolutions were on [2]. GE and other companies like Bank of America, Caterpillar, Honeywell International (previously known as Allied Signal), Raytheon and Merrill Lynch popularized the concept later in the 1990’s by its effective application [3]. The six sigma program has been widely accepted to be one of the most prosperous process amendment systems available to businesses. Today, six sigma is well established in virtually every industry and many organizations worldwide have modified six sigma methodology and tools to accommodate their own operations. Six sigma was initially introduced in manufacturing processes; today, however, it slowly makes its monarchy in cross-functional problem solving issues [4]. This made six sigma one of the most prominent area for both industry and academia. In spite, much of the literatures on six sigma are available only on its definition [4], needs [5], deployment [6], hurdles [7], project selection [8- 10], critical success factors [11], framework [12-
Transcript

ELK Asia Pacific Journals – Special Issue

ISBN: 978-81-930411-4-7

ASSESSING THE SUCCESS OF SIX SIGMA: AN EMPIRICAL STUDY

S. K. Tiwari

Department of Production

Engineering

Birla Institute of Technology,

Mesra, Deoghar Campus

Deoghar, Jharkhand, India. Pin

Code: 814142

Email: [email protected]

R. K. Singh

Department of Production

Engineering

Birla Institute of Technology,

Mesra

Ranchi, Jharkhand, India. Pin

Code: 835215

Email: [email protected]

S. C. Srivastava

Department of Production

Engineering

Birla Institute of Technology,

Mesra

Ranchi, Jharkhand, India. Pin

Code: 835215

Email: [email protected]

Abstract-In response to the ever increasing demand of

customer and prompt changing economic conditions,

various industrial engineering and quality

management strategies such as ISO 9000, total quality

management (TQM), lean manufacturing,

manufacturing recourse planning, modular design,

reengineering, flexible manufacturing system (FMS),

etc., are adopted by the corporations to compete in

the current competitive market. However, from the

last three decades a new paradigm, known as “Six

Sigma”, has made its prime impact in the area of

manufacturing strategies to solve the problems

related to the quality and productivity. In this paper,

a case of Indian foundry unit has been presented to

explore the effectiveness of six sigma methodology.

The DMAIC (Define-Measure-Analyze-Improve-

Control) approach of six sigma has been followed

here to reduce percentage of defects in green sand

casting process. In addition, Taguchi method of

parameter design is used to set the optimal process

parameters in the ‘Improve phase’. Analysis of

variance (ANOVA) is then performed to find the

optimal parameter levels and to identify the statistical

significance and contribution of each factor on the

casting defects. Finally, a confirmation test is

performed using the optimal parameter setting, which

shows that the casting defects can be minimized,

effectively. The results show that after successful

deployment of six sigma, the percentage of casting

defects is reduced by 25.44%.

Key Words: green sand casting, six sigma, casting

defects, Taguchi technique, design of experiment

(DOE), orthogonal array (OA), signal-to-noise ratio,

analysis of variance (ANOVA).

I. INTRODUCTION

Six sigma is a systematic business management

philosophy which concentrates on identifying and

eliminating defects, mistakes and variations in a

product, process, or service in order to ameliorate

the quality at minimum cost. In general, six sigma

is a fact-driven, disciplined and statistical approach

that is traced to eliminate defects and lead

processes to achieve perfection. Being a

multifarious system in making business leadership

performance more preponderant, six sigma doesn’t

work based on any single theory/strategy, but it is

based on the results driven strategies. The primary

goal of six sigma is to ameliorate customer

contentment by reducing variation in the process

which in turn reduces defects.

Six sigma is a quality amelioration initiative that

has been evolved over 25 years of scientific

management and perpetual amendment theories.

Originally, it was originated by Bill Smith and first

utilized by Motorola Corporation in 1986 and

targeted a truculent goal of 3.4 defects per million

opportunities (DPMO) [1] and had been recognized

as a systematic and structured methodology that

endeavors to ameliorate operations by eliminating

the root causes of defects through focusing on

customer needs.

After, Motorola won the Malcom Balridge National

Quality Award in 1988 for achieving business

excellence through six sigma philosophy, six sigma

propagated and the six sigma revolutions were on

[2]. GE and other companies like Bank of America,

Caterpillar, Honeywell International (previously

known as Allied Signal), Raytheon and Merrill

Lynch popularized the concept later in the 1990’s

by its effective application [3]. The six sigma

program has been widely accepted to be one of the

most prosperous process amendment systems

available to businesses. Today, six sigma is well

established in virtually every industry and many

organizations worldwide have modified six sigma

methodology and tools to accommodate their own

operations.

Six sigma was initially introduced in manufacturing

processes; today, however, it slowly makes its

monarchy in cross-functional problem solving

issues [4]. This made six sigma one of the most

prominent area for both industry and academia. In

spite, much of the literatures on six sigma are

available only on its definition [4], needs [5],

deployment [6], hurdles [7], project selection [8-

10], critical success factors [11], framework [12-

ELK Asia Pacific Journals – Special Issue

ISBN: 978-81-930411-4-7

13] and organizational infrastructure required for

implementation [14]. But only a few studies are

reported regarding real life six sigma

implementation [15-20].

This paper presents a real case of six sigma

implementation in a modern foundry industry. The

paper provides set-by-step application of six sigma

DMAIC framework to reduce rejection rate in

green sand casting process. In addition to that in

improve phase, Taguchi Design of Experiment

(DOE) is used to set the optimal process parameters

in the ‘Improve phase’. Analysis of variance

(ANOVA) is then performed to find the optimal

parameter levels and to identify the statistical

significance and contribution of each factor on the

casting defects. Finally, a confirmation test is

performed using the optimal parameter setting

which shows that the casting defects can be

minimized effectively.

II. RESEARCH METHODOLOGY

There are basically two frameworks namely,

DMAIC and DMADV, which are used for the

implementation of six sigma improvement strategy

as defined by Motorola [3]. In this paper, six sigma

DMAIC methodology is applied to identify the root

causes for the casting rejections and proposes

solutions that can have significant impact on

customer, product quality and business from the

economic viewpoint.

The first phase is focused on understanding the

process under investigation from the point of view

of customers, suppliers and operators. The second

phase seeks to measure current performance, the

third to analyze contributors to poor performance

and variation. The fourth phase uses the outputs of

the earlier phases to define, test and operationalise

improvements and the final phase seeks to ensure

that changes are embedded, successful and, where

appropriate, transferred to other processes. Table I

summarizes the phase, purpose and key outputs

[21-22].

III. INDUSTRIAL CASE

A case study has been carried out in a leading

ferrous casting unit of southern India. All the data

required for the research has been collected from

the same industry. As an agreement with the

company its name should be made confidential and

thus for the research purpose it has been named as

XYZ company Ltd. XYZ has since been a

significant and diligent participant in the ferrous

casting industry, producing superior quality

castings for many industries. Today, it is one of

India's largest suppliers of the finest ductile iron,

grey iron and mild steel castings ranging from 0.5

Kg to 260 Kg in weight, having turnover of about

3000 tons per month. The company is catering to

the needs of commercial vehicle industry, Tractor

industry, car manufacturers and it also full fills the

casting needs of many other industries.

Despite of adopting these world class standards and

continuously striving for the improvements, the

company is unable to fulfill the increased demand

in the last ten years due to globalization and boom

in automobile sector. After continual effort and

brainstorming with the production data, it can be

concluded that the main culprit of this problem is

reworks/rejections which basically due to defects in

the products and unreliable process. So, the top

management of the company decided to implement

the world’s prominent methodology namely six

sigma DMAIC methodology in order to reduce the

reworks/rejections thus making the process so

robust that the present demand can be fulfilled with

the existing resources.

IV. SIX SIGMA DEPLOYMENT

A. Define Phase

The aim of this phase is to define the scope and

goal of the improvement project in terms of

customer requirements and to develop a process

that delivers these requirements. In this concern, a

project charter is made with all the necessary

details of the project (Table II). This helps the team

members in understanding the project objective,

duration, resources, roles and responsibilities of

team members, project scope and boundaries,

expected results from the project, etc., [23]. Since

there is a cross-functional team for executing this

project, thus the team decided to perform SIPOC

(Supplier–Input–Process–Output–Customer)

analysis to have a better understanding of the

process. SIPOC diagram is presented in Fig.1.

TABLE I. SUMMARY OF DMAIC

Phases Purpose

Define Define the project’s purpose and scope

Measure Gather information regarding existing process conditions to provide a baseline

ELK Asia Pacific Journals – Special Issue

ISBN: 978-81-930411-4-7

assessment of current performance levels and narrow the scope of inquiry to the most important problems

Analyze Identify the root causes of the problems that were clarified in the Measure Stage

Improve Develop, implement, and evaluate solutions intended to eliminate the root causes

of problems identified in the analyze stage

Control Ensure that problems remain fixed and that the new methods can be improved

over time

TABLE II. PROJECT CHARTER

Project Charter

Project title To reduce rejection rate in green sand casting process.

Background/Reason Currently, the rejection rate is as high as 10.64% approximately, which costs approximately 2 crore per month. In addition, various other losses such as raw material, machine hour, man

hour, etc., are associated with the rejection of the casting.

Critical to quality Percentage of casting rejections (approximately 89.67% of total) due to core making unit,

mould making unit and melting unit.

Project scope Green sand casting process.

Project leader Manufacturing head.

Team members Production manager, manager from quality assurance department, shop floor operators,

foundry technicians, author.

Expected benefits Saving of approximately 2 crore per month.

Schedule Define: 2 weeks

Measure: 3 weeks

Analyze: 3 weeks Improve: 2 weeks

Control: 4 weeks

Fig. 1. SIPOC Diagram
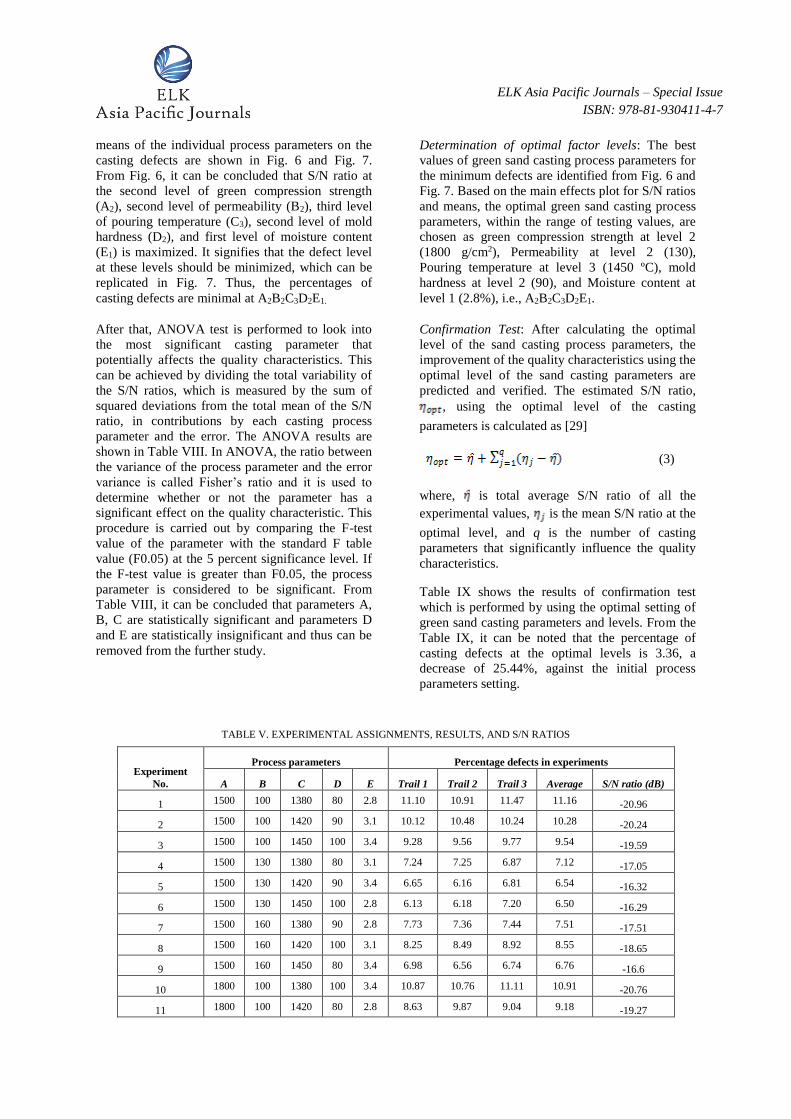
B. Measure Phase

The objective of the measure phase is to understand

and establish the baseline performance of the

process in terms of process capability or sigma

rating. For this the team has collected the defect

data of five months (Jan, 14 to May, 14) of various

shops/units and the data for the same is depicted in

Table III. It can be concluded from Table III that

maximum number of defects are coming from core

making unit (11.18%), mould making unit

(60.56%) and melting unit (17.93%) in the form of

defective casting/product. These three units

contribute 89.67% of the total defects. A bar graph

is constructed to represent the percentage of

defective products coming from each unit and is

shown in Fig. 2.

The defects occurring in the above three units are

significantly affecting the production and

performance of the company. A meeting of all the

team members are called to analyze the various

defects occurring in these units and to discuss the

remedial action for streamlining the whole process.

Fig.3 shows the various casting defects and their

significance to make the casting defectives. It can

be concluded from the Fig. 3 that scab, blow holes,

bad core, sand drop, sand inclusion, shrinkage, core

shift and cold shut are erupting as the prime

Supplier

Vendors

Input

Manpower,

Machines, Raw

Materials, Fluxes &

Consumables

Process

Detailed flowchart

of the process is

given in Annexure 1

Output

Ductile Iron and

Grey Iron Castings

Customer

Automobile

Companies

ELK Asia Pacific Journals – Special Issue

ISBN: 978-81-930411-4-7

reasons for 80% of the defective castings (i.e., vital

few).

Next, the team measured the overall sigma value of

the casting process in order to have a clear picture

of the current state of the production. The

calculation of sigma level is based on the number

of defects per million opportunities (DPMO). In

order to calculate the DPMO, three distinct pieces

of information are required:

a) The number of unit produced.

b) The number of defect opportunities per unit.

c) The number of defects.

The actual formula is:

(1)

In the present study, the number of unit produced =

119967, the number of defects = 12771 (refer to

Table III), and the number of defect opportunities

per unit = 14 (refer to Fig. 3).

Therefore,

Referring to six sigma table [24], the sigma value

for 7,603.87 DPMO is 3.9.

TABLE III. DEFECT DATA FROM VARIOUS UNITS

Processes Number of defects

Jan,14 Feb,14 March,14 April,14 May,14 Sum

Core making 285 326 227 310 280 1428

Mould making 1684 1388 1535 1480 1648 7735

Melting 462 405 448 478 498 2291

Shot blasting I 40 38 56 48 52 234

Fettling / grinding 151 190 210 181 226 958

Shot blasting II 20 15 18 23 16 92

Painting 5 4 7 9 8 33

Total defectives 2647 2366 2501 2529 2728 12771

Total units produced 23962 22811 23780 24520 24894 119967

% Of defects 11.05 10.37 10.52 10.31 10.99 10.64

Fig. 2. Percentage of total defect observed in various units

Fig. 3. Pareto chart for the analysis of vital few

ELK Asia Pacific Journals – Special Issue

ISBN: 978-81-930411-4-7

C. Analyze Phase

In this phase the collected data is verified, analyzed

and prioritized in order to explore the possible root

causes and their relationship to output. For this

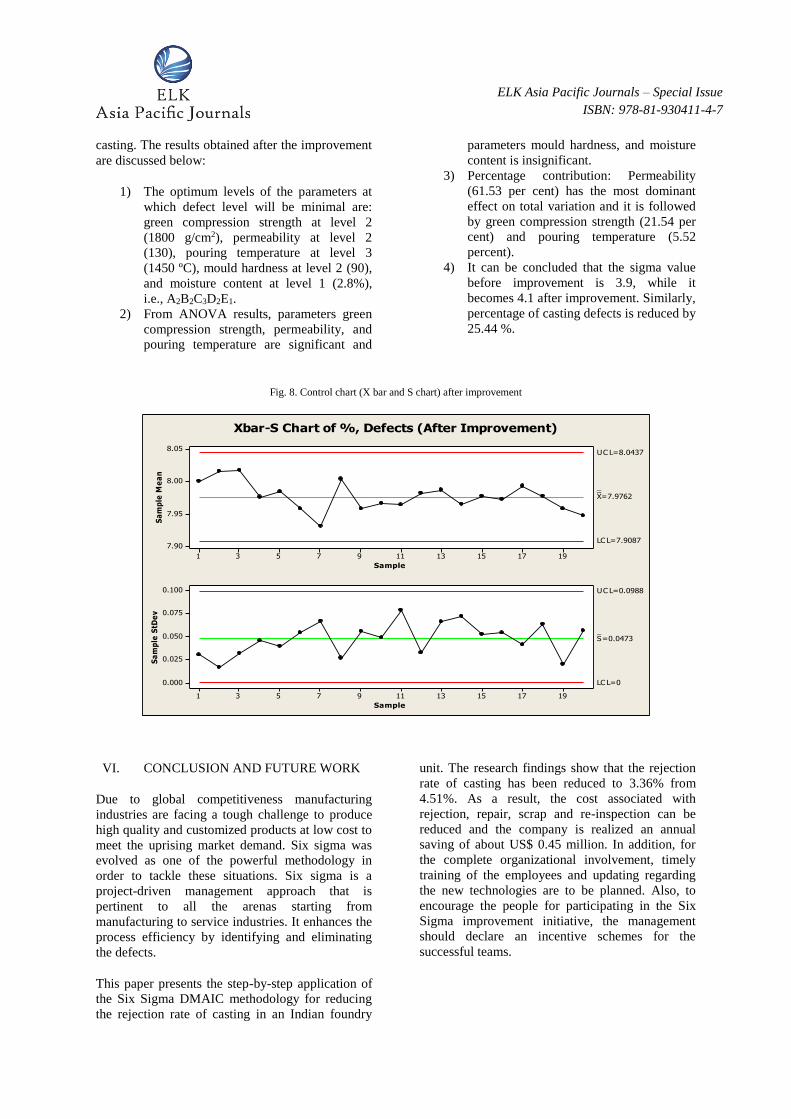
purpose the team decided to first construct a control

chart in order to check the current condition of the

process, shown in figure 4. At this point, it is

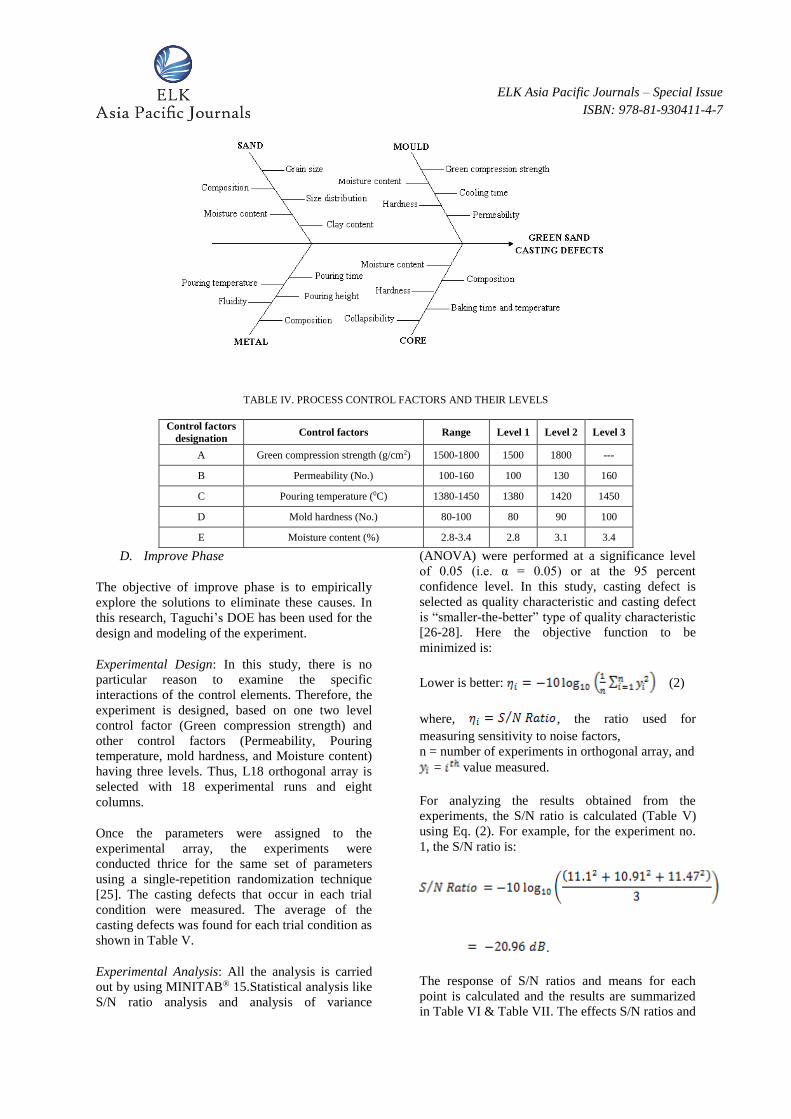
essential to identify the possible causes of casting

defects and thus a cause and effect diagram is

constructed in order to identify, sort, and display

the possible causes of the problem shown in Fig. 5.

From the cause and effect diagram, it may be

concluded that the most significant factors that

affect casting defects are green compression

strength, permeability, pouring temperature, mould

hardness and moisture content. Table IV shows the

selected process parameters, along with their

ranges.

Fig. 4. Control chart (X bar and S chart) before improvement

191715131197531

11.10

10.95

10.80

10.65

10.50

Sample

Sa

mp

le M

ea

n

__X=10.69

UC L=10.9628

LC L=10.4172

191715131197531

0.4

0.3

0.2

0.1

0.0

Sample

Sa

mp

le S

tDe

v

_S=0.1911

UC L=0.3993

LC L=0

11

11

Xbar-S Chart of %, Defects (Before Improvement)

Fig. 5. Cause and effect diagram

ELK Asia Pacific Journals – Special Issue

ISBN: 978-81-930411-4-7

TABLE IV. PROCESS CONTROL FACTORS AND THEIR LEVELS

Control factors

designation Control factors Range Level 1 Level 2 Level 3

A Green compression strength (g/cm2) 1500-1800 1500 1800 ---

B Permeability (No.) 100-160 100 130 160

C Pouring temperature (0C) 1380-1450 1380 1420 1450

D Mold hardness (No.) 80-100 80 90 100

E Moisture content (%) 2.8-3.4 2.8 3.1 3.4

D. Improve Phase

The objective of improve phase is to empirically

explore the solutions to eliminate these causes. In

this research, Taguchi’s DOE has been used for the

design and modeling of the experiment.

Experimental Design: In this study, there is no

particular reason to examine the specific

interactions of the control elements. Therefore, the

experiment is designed, based on one two level

control factor (Green compression strength) and

other control factors (Permeability, Pouring

temperature, mold hardness, and Moisture content)

having three levels. Thus, L18 orthogonal array is

selected with 18 experimental runs and eight

columns.

Once the parameters were assigned to the

experimental array, the experiments were

conducted thrice for the same set of parameters

using a single-repetition randomization technique

[25]. The casting defects that occur in each trial

condition were measured. The average of the

casting defects was found for each trial condition as

shown in Table V.

Experimental Analysis: All the analysis is carried

out by using MINITAB® 15.Statistical analysis like

S/N ratio analysis and analysis of variance

(ANOVA) were performed at a significance level

of 0.05 (i.e. α = 0.05) or at the 95 percent

confidence level. In this study, casting defect is

selected as quality characteristic and casting defect

is “smaller-the-better” type of quality characteristic

[26-28]. Here the objective function to be

minimized is:

Lower is better: (2)

where, , the ratio used for

measuring sensitivity to noise factors,

n = number of experiments in orthogonal array, and

= value measured.

For analyzing the results obtained from the

experiments, the S/N ratio is calculated (Table V)

using Eq. (2). For example, for the experiment no.

1, the S/N ratio is:

.

The response of S/N ratios and means for each

point is calculated and the results are summarized

in Table VI & Table VII. The effects S/N ratios and

ELK Asia Pacific Journals – Special Issue

ISBN: 978-81-930411-4-7

means of the individual process parameters on the

casting defects are shown in Fig. 6 and Fig. 7.

From Fig. 6, it can be concluded that S/N ratio at

the second level of green compression strength

(A2), second level of permeability (B2), third level

of pouring temperature (C3), second level of mold

hardness (D2), and first level of moisture content

(E1) is maximized. It signifies that the defect level

at these levels should be minimized, which can be

replicated in Fig. 7. Thus, the percentages of

casting defects are minimal at A2B2C3D2E1.

After that, ANOVA test is performed to look into

the most significant casting parameter that

potentially affects the quality characteristics. This

can be achieved by dividing the total variability of

the S/N ratios, which is measured by the sum of

squared deviations from the total mean of the S/N

ratio, in contributions by each casting process

parameter and the error. The ANOVA results are

shown in Table VIII. In ANOVA, the ratio between

the variance of the process parameter and the error

variance is called Fisher’s ratio and it is used to

determine whether or not the parameter has a

significant effect on the quality characteristic. This

procedure is carried out by comparing the F-test

value of the parameter with the standard F table

value (F0.05) at the 5 percent significance level. If

the F-test value is greater than F0.05, the process

parameter is considered to be significant. From

Table VIII, it can be concluded that parameters A,

B, C are statistically significant and parameters D

and E are statistically insignificant and thus can be

removed from the further study.

Determination of optimal factor levels: The best

values of green sand casting process parameters for

the minimum defects are identified from Fig. 6 and

Fig. 7. Based on the main effects plot for S/N ratios

and means, the optimal green sand casting process

parameters, within the range of testing values, are

chosen as green compression strength at level 2

(1800 g/cm2), Permeability at level 2 (130),

Pouring temperature at level 3 (1450 ºC), mold

hardness at level 2 (90), and Moisture content at

level 1 (2.8%), i.e., A2B2C3D2E1.

Confirmation Test: After calculating the optimal

level of the sand casting process parameters, the

improvement of the quality characteristics using the

optimal level of the sand casting parameters are

predicted and verified. The estimated S/N ratio,

, using the optimal level of the casting

parameters is calculated as [29]

(3)

where, is total average S/N ratio of all the

experimental values, is the mean S/N ratio at the

optimal level, and q is the number of casting

parameters that significantly influence the quality

characteristics.

Table IX shows the results of confirmation test

which is performed by using the optimal setting of

green sand casting parameters and levels. From the

Table IX, it can be noted that the percentage of

casting defects at the optimal levels is 3.36, a

decrease of 25.44%, against the initial process

parameters setting.

TABLE V. EXPERIMENTAL ASSIGNMENTS, RESULTS, AND S/N RATIOS

Experiment

No.

Process parameters Percentage defects in experiments

A B C D E Trail 1 Trail 2 Trail 3 Average S/N ratio (dB)

1 1500 100 1380 80 2.8 11.10 10.91 11.47 11.16 -20.96

2 1500 100 1420 90 3.1 10.12 10.48 10.24 10.28 -20.24

3 1500 100 1450 100 3.4 9.28 9.56 9.77 9.54 -19.59

4 1500 130 1380 80 3.1 7.24 7.25 6.87 7.12 -17.05

5 1500 130 1420 90 3.4 6.65 6.16 6.81 6.54 -16.32

6 1500 130 1450 100 2.8 6.13 6.18 7.20 6.50 -16.29

7 1500 160 1380 90 2.8 7.73 7.36 7.44 7.51 -17.51

8 1500 160 1420 100 3.1 8.25 8.49 8.92 8.55 -18.65

9 1500 160 1450 80 3.4 6.98 6.56 6.74 6.76 -16.6

10 1800 100 1380 100 3.4 10.87 10.76 11.11 10.91 -20.76

11 1800 100 1420 80 2.8 8.63 9.87 9.04 9.18 -19.27

ELK Asia Pacific Journals – Special Issue

ISBN: 978-81-930411-4-7

12 1800 100 1450 90 3.1 7.77 7.90 8.06 7.91 -17.96

13 1800 130 1380 90 3.4 5.26 5.30 5.53 5.36 -14.59

14 1800 130 1420 100 2.8 5.16 5.10 5.20 5.15 -14.24

15 1800 130 1450 80 3.1 4.51 4.46 4.57 4.51 -13.09

16 1800 160 1380 100 3.1 5.74 5.59 5.46 5.60 -14.96

17 1800 160 1420 80 3.4 5.72 4.46 4.67 4.95 -13.95

18 1800 160 1450 90 2.8 4.16 3.82 4.68 4.22 -12.54

TABLE VI. RESPONSE TABLE FOR S/N RATIOS

Level A B C D E

1 -18.13 -19.80 -17.64 -16.82 -16.80

2 -15.71 -15.26 -17.11 -16.53 -16.99

3

-15.70 -16.01 -17.41 -16.97

Delta 2.43 4.53 1.63 0.89 0.19

Rank 2 1 3 4 5

TABLE VII. RESPONSE TABLE FOR MEANS

Level A B C D E

1 8.22 9.83 7.94 7.28 7.29

2 6.42 5.87 7.44 6.97 7.33

3

6.27 6.57 7.71 7.34

Delta 1.80 3.96 1.37 0.74 0.05

Rank 2 1 3 4 5

Fig. 6. Main effects plot for S/N ratios

18001500

-15.0

-16.5

-18.0

-19.5

160130100 145014201380

1009080

-15.0

-16.5

-18.0

-19.5

3.43.12.8

a

Me

an

of

SN

ra

tio

s

b c

d e

Main Effects Plot for SN ratiosData Means

Signal-to-noise: Smaller is better

Fig. 7. Main effects plot for means

ELK Asia Pacific Journals – Special Issue

ISBN: 978-81-930411-4-7

18001500

10

9

8

7

6

160130100 145014201380

1009080

10

9

8

7

6

3.43.12.8

a

Me

an

of

Me

an

s

b c

d e

Main Effects Plot for MeansData Means

TABLE VIII. ANOVA SUMMARY

Source Degree of

freedom

Sum of

square Variance F

Significance

of F

Percent

contribution

A 1 26.518 26.518 31.28 0.001 21.54

B 2 75.030 37.515 44.32 0.000 61.53

C 2 8.269 4.1345 4.88 0.041 5.52

D 2 2.451 1.2255 1.45 0.291

E 2 0.130 0.065 0.08 0.927

Error 8 6.782 0.8477

11.41

Total 17 119.179

100.00

TABLE IX. RESULTS OF CONFIRMATION TEST

Level

Percentage defects S/N ratios (dB)

A2B2C3D2E1 A2B2C3D2E1

Initial parameters setting 4.51 -13.09

Optimal parameters setting 3.36 -9.76

Improvement (%) 25.44 25.44

E. Control Phase

The objective of control phase is to ascertain that

the current process must be in control after the

successful implementation of improvement

solutions that has been determined in the improve

phase. The team should timely monitor the process

in order to ensure sustainability of the achieved

results. If any special causes are determined,

corrective actions should be taken before

nonconformities are produced. For this the team

decided to construct the control chart of the

existing process (i.e., after improvement) in order

to determine the current situation of the process as

depicted in fig. 8. The interpretation of the control

chart shows that the current process is under

control and also the variation is reduced. In

addition, the current sigma value is calculated

which is found to be approximately 4.1.

The main purpose of six sigma is not only making

process improved but also having the optimum

results sustained in long run. Hence, the

standardization of the process is required. For that,

proper documentation of the process and

appropriate training of the people associated with

the process should be conducted so that they can

able to manage the process effectively.

V. RESULTS AND DISCUSSION

In this study six sigma DAMIC methodology is

used to reduce rejection rate of the green sand

ELK Asia Pacific Journals – Special Issue

ISBN: 978-81-930411-4-7

casting. The results obtained after the improvement

are discussed below:

1) The optimum levels of the parameters at

which defect level will be minimal are:

green compression strength at level 2

(1800 g/cm2), permeability at level 2

(130), pouring temperature at level 3

(1450 ºC), mould hardness at level 2 (90),

and moisture content at level 1 (2.8%),

i.e., A2B2C3D2E1.

2) From ANOVA results, parameters green

compression strength, permeability, and

pouring temperature are significant and

parameters mould hardness, and moisture

content is insignificant.

3) Percentage contribution: Permeability

(61.53 per cent) has the most dominant

effect on total variation and it is followed

by green compression strength (21.54 per

cent) and pouring temperature (5.52

percent).

4) It can be concluded that the sigma value

before improvement is 3.9, while it

becomes 4.1 after improvement. Similarly,

percentage of casting defects is reduced by

25.44 %.

Fig. 8. Control chart (X bar and S chart) after improvement

191715131197531

8.05

8.00

7.95

7.90

Sample

Sa

mp

le M

ea

n

__X=7.9762

UC L=8.0437

LC L=7.9087

191715131197531

0.100

0.075

0.050

0.025

0.000

Sample

Sa

mp

le S

tDe

v

_S=0.0473

UC L=0.0988

LC L=0

Xbar-S Chart of %, Defects (After Improvement)

VI. CONCLUSION AND FUTURE WORK

Due to global competitiveness manufacturing

industries are facing a tough challenge to produce

high quality and customized products at low cost to

meet the uprising market demand. Six sigma was

evolved as one of the powerful methodology in

order to tackle these situations. Six sigma is a

project-driven management approach that is

pertinent to all the arenas starting from

manufacturing to service industries. It enhances the

process efficiency by identifying and eliminating

the defects.

This paper presents the step-by-step application of

the Six Sigma DMAIC methodology for reducing

the rejection rate of casting in an Indian foundry

unit. The research findings show that the rejection

rate of casting has been reduced to 3.36% from

4.51%. As a result, the cost associated with

rejection, repair, scrap and re-inspection can be

reduced and the company is realized an annual

saving of about US$ 0.45 million. In addition, for

the complete organizational involvement, timely

training of the employees and updating regarding

the new technologies are to be planned. Also, to

encourage the people for participating in the Six

Sigma improvement initiative, the management

should declare an incentive schemes for the

successful teams.

ELK Asia Pacific Journals – Special Issue

ISBN: 978-81-930411-4-7

Acknowledgement

The authors would like to thank the reviewers

for their constructive suggestions and

recommendations.

References

[1] R. Andersson, H. Eriksson, and H. Torstensson,

“Similarities and differences between TQM, six

sigma and lean,” The TQM Magazine, vol. 18, no. 3,

2006, pp. 282-96, 2006.

[2] P. Thomas, The six sigma revolution, Quality

America Inc., 2008.

[3] R. Snee, and R. Hoerl, Leading six sigma – a step by

step guide based on experience with GE and other six

sigma companies, Prentice-Hall: New Jersey, 2003.

[4] F.W. Breyfogle, Implementing Six Sigma: Smarter

Solutions Using Statistical Methods, Wiley: New

York, 2003.

[5] P. Pande, R. Neuman, and R. Cavanagh, The six

sigma way: how GE, Motorola and other top

companies are honing their performance, McGraw-

Hill: New York, 2000.

[6] P.A. Keller, Six Sigma Deployment, Quality

Publishing House: Arizona, 2001.

[7] E.V. Gijo, and T.S. Rao, “Six sigma

implementation—hurdles and more hurdles,” Total

Quality Management & Business Excellence, vol. 16,

no. 6, pp. 721-725, 2005.

[8] P. Pande, R. Neuman, and R. Cavanagh, The six

sigma way team field book: an implementation guide

for process improvement teams, Tata McGraw-Hill:

New Delhi, 2003.

[9] S. Boran, H.R. Yazgan, and K. Goztepe, “A fuzzy

ANP-based approach for prioritizing projects: a six

sigma case study,” Int. J. Six Sigma and Competitive

Advantage, vol. 6, no. 3, pp.133–155, 2011.

[10] S.K. Tiwari, R.K. Singh, and S.C. Srivastava, “Six

sigma project selection using extent fuzzy AHP: an

empirical study,” Int. J. Research in Industrial

Engineering, vol. 2, no. 2, pp. 50-63, 2013.

[11] D.A. Desai, J. Antony, and M.B. Patel, “An

assessment of the critical success factors for six

sigma implementation in Indian industries,”

International Journal of Productivity and

Performance Management, vol. 61, no. 4, pp. 5 – 5,

2012.

[12] G. Celano, S. Fichera, A. Costa, and G. Tringali,

“Linking six sigma to simulation: a new roadmap to

improve the quality of patient care,” International

Journal of Health Care Quality Assurance, vol. 25,

no. 4, pp. 2 – 2, 2012.

[13] C. Heavey, and E. Murphy, “Integrating the

Balanced Scorecard with six sigma,” The TQM

Journal, vol. 24, no. 2, pp. 108 – 122, 2012.

[14] S. Taghizadegan, Essentials of lean six sigma,

Elsevier: New Delhi, 2006.

[15] R.G.P. Prasada, and R.V. Venugopal, “Process

improvement using six sigma – a case study in small

scale industry,” International Journal of Six Sigma

and Competitive Advantage, vol. 6, nos. 1/2, pp. 1–

11, 2010.

[16] E.V. Gijo, and J. Scaria, “Reducing rejection and

rework by application of six sigma methodology in

manufacturing process,” Int. J. Six Sigma and

Competitive Advantage, vol. 6, nos. 1/2, pp.77–90,

2010.

[17] E.V. Gijo, J. Scaria, and J. Antony, “Application of

six sigma methodology to reduce defects of a

grinding process,” Quality and Reliability

Engineering International, vol. 27, pp. 1221—1234,

2011.

[18] P.C. Gholap, and T.N. Desai, “Reduction of rework

the six sigma way: case study of an Indian small

scale industry,” Int. J. Six Sigma and Competitive

Advantage, vol. 7, no. 1, pp.92–116, 2012.

[19] A. Kumaravadivel, and U. Natarajan, “Application of

six sigma DMAIC methodology to sand-casting

process with response surface methodology,”

International Journal of Advance Manufacturing &

Technology, vol. 69, pp. 1403–1420, 2013.

[20] B.J. Singh, and D. Khanduja, “Ambience of six

sigma in Indian foundries – an empirical

investigation,” Int. J. Six Sigma and Competitive

Advantage, vol. 7, no. 1, pp. 12–40, 2012.

[21] G. Knowles, L. Whicker, J.H. Femat, and F.D.C.

Canales, “A conceptual model for the application of

six sigma methodologies to supply chain

improvement,” International Journal of Logistics

Research and Applications, vol. 8, no. 1, pp. 51-65,

2005.

[22] A.Y.T. Szeto, and A.H.C. Tsang, “Antecedents to

successful implementation of Six Sigma,” Int. J. Six

Sigma and Competitive Advantage, Vol. 1, No. 3,

pp. 307–322, 2005.

ELK Asia Pacific Journals – Special Issue

ISBN: 978-81-930411-4-7

[23] J. Antony, E.V. Gijo, and S.J. Childe, “Case study in

six sigma methodology: manufacturing quality

improvement and guidance for managers,”

Production Planning and Control, iFirst, pp. 1-17,

2011.

[24] http://home.xtra.co.nz/hosts/smtconz/Quality/Simple

%20Six%20Sigma%20Calculator.xls

[25] P.J. Ross, Taguchi Technique for Quality

Engineering, 2nd Edition, Tata McGraw-Hill, 1988.

[26] T.P. Bagchi, Taguchi methods explained, practical

steps to robust design, Prentice Hall of India Pvt.

Ltd., New Delhi, India, 1993.

[27] P.B. Barua, P. Kumar, and J.L. Gaindhar,

“Optimization of mechanical properties of V-

process casting by Taguchi method,” Indian

Foundry Journal, pp. 17-25, 1997.

[28] G. Taguchi, Introduction to quality engineering:

Design quality into products and process, Asian

Productivity Organization, Tokyo, Japan, 1986.

[29] M.S. Phadke, Quality engineering using robust

design, Prentice-Hall, Englewood Cliffs, NJ, 1989.

ELK Asia Pacific Journals – Special Issue

ISBN: 978-81-930411-4-7

Annexure 1 (Process Flow Diagram)

OK

Mould Making

OK

Not OK

Reject Mould

Not OK

Reject Core

Not OK

Rework

Scrap

Reject and Return to

Supplier

Incoming Material

Inspection

Not OK

Melting Shop Mould Making Shop Pattern Making Shop Core Making Shop

Not OK

Liquid Metal Preparation

Adjust the

composition

Pouring of Molten Metal

OK OK

Core Setting in the Mould

Mould Closing and Clamping

Cooling of Poured Mould

Removal of Casting by Breaking

The Mould and Decoring &

Degating

Continued

ELK Asia Pacific Journals – Special Issue

ISBN: 978-81-930411-4-7

OK

Not OK In-process Inspection &

Testing

Reject & Review the Defective

Casting

OK

Not OK

Continued

Shot Blasting I

Fettling and Grinding

Shot Blasting II

Online Inspection Reject & Review the Defective

Casting

Painting

OK

Not OK Final Inspection & Testing Rework/Reject the Defective

Casting

Packing & Dispatch


Recommended