Physics Contribution Assessing the Uncertainty in QUANTEC’s DoseeResponse Relation of Lung and Spinal Cord With a Bootstrap Analysis Minna Wedenberg, MSc Medical Radiation Physics, Department of Oncology-Pathology, Karolinska Institutet, Stockholm, Sweden, RaySearch Laboratories, Stockholm, Sweden Received Mar 11, 2013, and in revised form May 27, 2013. Accepted for publication Jun 13, 2013 Summary Doseeresponse relations are typically estimated from limited numbers of patients, rendering the relation uncer- tain. Therefore, conclusions about toxicity risk drawn from these relations must account for the associated uncertainty. In this study, the uncertainty in 2 doseeresponse relations presented by QUANTEC, pneumonitis and myelopathy, is assed with a bootstrap method. The method provides confidence intervals of toxicity risk, and model parameter values with confidence inter- vals and their interrelation. Purpose: To apply a statistical bootstrap analysis to assess the uncertainty in the doseeresponse relation for the endpoints pneumonitis and myelopathy reported in the QUANTEC review. Methods and Materials: The bootstrap method assesses the uncertainty of the estimated population-based dose-response relation due to sample variability, which reflects the uncertainty due to limited numbers of patients in the studies. A large number of bootstrap replicates of the original incidence data were produced by random sampling with replacement. The analysis requires only the dose, the number of patients, and the number of occurrences of the studied endpoint, for each study. Two doseeresponse models, a Poisson-based model and the Lyman model, were fitted to each bootstrap replicate using maximum likelihood. Results: The bootstrap analysis generates a family of curves representing the range of plausible doseeresponse relations, and the 95% bootstrap confidence intervals give an estimated upper and lower toxicity risk. The curve families for the 2 doseeresponse models overlap for doses included in the studies at hand but diverge beyond that, with the Lyman model suggesting a steeper slope. The resulting distributions of the model parameters indicate correlation and non-Gaussian distribution. For both data sets, the likelihood of the observed data was higher for the Lyman model in >90% of the bootstrap replicates. Conclusions: The bootstrap method provides a statistical analysis of the uncertainty in the esti- mated doseeresponse relation for myelopathy and pneumonitis. It suggests likely values of model parameter values, their confidence intervals, and how they interrelate for each model. Finally, it can be used to evaluate to what extent data supports one model over another. For both data sets conside- red here, the Lyman model was preferred over the Poisson-based model. Ó 2013 Elsevier Inc. Reprint requests to: Minna Wedenberg, MSc, Karolinska Institutet, Department of Oncology-Pathology, 17176 Stockholm, Sweden. Tel: (þ46) 8 400 509 21; E-mail: [email protected]This research was supported by the Swedish Research Council (VR). Conflict of interest: none. NotedAn online CME test for this article can be taken at http:// astro.org/MOC. AcknowledgmentsdThe author would like to thank Bjo ¨rn Ha ˚rdemark, Bengt K. Lind, and Iuliana Toma-Dasu for helpful discussions. Int J Radiation Oncol Biol Phys, Vol. 87, No. 4, pp. 795e801, 2013 0360-3016/$ - see front matter Ó 2013 Elsevier Inc. All rights reserved. http://dx.doi.org/10.1016/j.ijrobp.2013.06.2040 Radiation Oncology International Journal of biology physics www.redjournal.org CME
Transcript
International Journal of
Radiation Oncology
biology physics
www.redjournal.org
CME
Physics Contribution
Assessing the Uncertainty in QUANTEC’s DoseeResponseRelation of Lung and Spinal Cord With a BootstrapAnalysisMinna Wedenberg, MSc
Medical Radiation Physics, Department of Oncology-Pathology, Karolinska Institutet, Stockholm, Sweden, RaySearchLaboratories, Stockholm, Sweden
Received Mar 11, 2013, and in revised form May 27, 2013. Accepted for publication Jun 13, 2013
Summary
Doseeresponse relations aretypically estimated fromlimited numbers of patients,rendering the relation uncer-tain. Therefore, conclusionsabout toxicity risk drawn fromthese relations must accountfor the associated uncertainty.In this study, the uncertainty in2 doseeresponse relationspresented by QUANTEC,pneumonitis and myelopathy,is assed with a bootstrapmethod. The method providesconfidence intervals of toxicityrisk, and model parametervalues with confidence inter-vals and their interrelation.
Reprint requests to: Minna Wedenberg, M
Department of Oncology-Pathology, 17176
(þ46) 8 400 509 21; E-mail: minna.wedenberg
This research was supported by the Swedis
Conflict of interest: none.
Int J Radiation Oncol Biol Phys, Vol. 87, No. 4
0360-3016/$ - see front matter � 2013 Elsevie
http://dx.doi.org/10.1016/j.ijrobp.2013.06.2040
Purpose: To apply a statistical bootstrap analysis to assess the uncertainty in the doseeresponserelation for the endpoints pneumonitis and myelopathy reported in the QUANTEC review.Methods and Materials: The bootstrap method assesses the uncertainty of the estimatedpopulation-based dose-response relation due to sample variability, which reflects the uncertaintydue to limited numbers of patients in the studies. A large number of bootstrap replicates of theoriginal incidence data were produced by random sampling with replacement. The analysisrequires only the dose, the number of patients, and the number of occurrences of the studiedendpoint, for each study. Two doseeresponse models, a Poisson-based model and the Lymanmodel, were fitted to each bootstrap replicate using maximum likelihood.Results: The bootstrap analysis generates a family of curves representing the range of plausibledoseeresponse relations, and the 95% bootstrap confidence intervals give an estimated upperand lower toxicity risk. The curve families for the 2 doseeresponse models overlap for dosesincluded in the studies at hand but diverge beyond that, with the Lyman model suggestinga steeper slope. The resulting distributions of the model parameters indicate correlation andnon-Gaussian distribution. For both data sets, the likelihood of the observed data was higherfor the Lyman model in >90% of the bootstrap replicates.Conclusions: The bootstrap method provides a statistical analysis of the uncertainty in the esti-mated doseeresponse relation for myelopathy and pneumonitis. It suggests likely values of modelparameter values, their confidence intervals, and how they interrelate for eachmodel. Finally, it canbe used to evaluate towhat extent data supports onemodel over another. For both data sets conside-red here, the Lyman model was preferred over the Poisson-based model. � 2013 Elsevier Inc.
Sc, Karolinska Institutet,
Stockholm, Sweden. Tel:
@raysearchlabs.com
h Research Council (VR).
NotedAn online CME test for this article can be taken at http://
astro.org/MOC.
AcknowledgmentsdThe author would like to thank Bjorn Hardemark,
Bengt K. Lind, and Iuliana Toma-Dasu for helpful discussions.
Table 1 Model parameter values for pneumonitis andmyelopathy
Organ Model Parameters [mean, (95% CI)]
Lung Poisson-based D50 Z 32.4 Gy (28.9-37.3)g Z 0.57 (0.47-0.68)
Lyman D50 Z 31.4 Gy (28.5-35.6)m Z 0.49 (0.42-0.58)
Spinal cord Poisson-based D50 Z 73.3 Gy (68.8-80.3)g Z 2.96 (2.01-4.48)
Lyman D50 Z 72.9 Gy (69.4-77.9)m Z 0.10 (0.07-0.14)
Abbreviation: CI Z confidence interval.
Wedenberg International Journal of Radiation Oncology � Biology � Physics796
Introduction
With advanced treatment planning tools, imaging devices, deliverytechniques, and the use of new types of radiation, the ability to directradiation to the desired location has increased considerably. None-theless, the dose to the tumor is often limited by the tolerance of thesurrounding normal tissue. Knowledge of how the radiation dosedistribution affects normal tissue is crucial, and numerous studiesinvestigate the normal tissue doseevolumeeresponse relation.However, limited numbers of patients per study and the lowincidence of toxicities render our understanding of the relationuncertain. An important task is therefore to bring together the resultsof different studies to obtain a better overview. In the classic articleby Emami and coworkers (1), the clinical data of many organs thenavailable was reviewed and guidelines to normal tissue constraintswere given. Recently, the Quantitative Analyses of Normal TissueEffects in the Clinic (QUANTEC) initiative published a review toprovide an updated summary of doseevolumeeresponse data and toupdate the recommendations for irradiation of several organs.Unfortunately, studies are often difficult to combine formeta-analyses. Important limitations include the incompletereporting of the results and the difficulty to define common clinicalendpoints (2). Therefore, despite the relatively high number ofstudies, the amount of data available for combined analysis is stilllimited.
Knowledge of the doseevolumeeresponse relations is impor-tant for treatment planning both with physical dose based ordose-volume based objective functions and constraints, and inradiobiological models such as normal tissue complication prob-ability models. Radiobiological models can potentially direct theoptimization toward clinically more advantageous treatments, butthe uncertainties of the models and their parameters describing therelationship between dose distribution and tissue responseprobability have so far restricted their use. It is of importance tounderstand how large the uncertainties in a doseeresponse rela-tion are to not overstate the safety of a treatment or to be overlypessimistic of the reliability of the relation. In this study, theuncertainties in two of the clinical endpoints reported in theQUANTEC report are studied: myelopathy of the cervical spinalcord and pneumonitis.
A bootstrap analysis was applied to assess the uncertainty inthe predicted population-based doseeresponse relation due tosampling variability. The sampling variability reflects theuncertainty associated with an estimate based on a subset ofpatients rather than all possible patients in a population.Conclusions about normal tissue toxicity risk drawn froma limited number of patients must be viewed in light of theassociated uncertainty. If the study were to be repeated witha new sample of patients from the same population, a somewhatdifferent outcome would be observed. Bootstrapping is a statis-tical resampling technique first introduced by Efron (3), wheresampling variability can be estimated without strong assumptionsof its distribution such as normality. Instead, the bootstrap usesthe observed variability of the original data, often allowing forstraightforward analysis in situations that may not be tractableanalytically. By random sampling with replacement, alternativesamples are simulated. In the setting considered here, the boot-strap provides information on the uncertainty in the underlyingclinical outcome data, and from that, the uncertainty in theestimated doseeresponse relation is obtained. Two
doseeresponse models are used: a Poisson-based model and theLyman model. The volume effect is not accounted for.
The aim of the study is to apply a bootstrap method to assessthe uncertainty in 2 clinical doseeresponse relations presented byQUANTEC. We obtain 95% confidence intervals of thedoseeresponse relations for myelopathy and pneumonitis. Thedistributions of the model parameters of the Poisson-based modeland of the Lyman model are estimated with their confidenceintervals and their interrelation. Finally, the likelihood of theobserved data for the 2 doseeresponse models is compared.
Methods and Materials
Clinical data
Two endpoints were considered: myelopathy of the cervical spinalcord and symptomatic pneumonitis. The dose and incidence datawere obtained from the QUANTEC review and the referencestherein.
The data of the spinal cord is obtained from Table 1 in theQUANTEC report (4). The 2-Gy dose equivalent (EQD2), numberof cases of myelopathy, and total number of patients are used. Thedata from irradiation using conventional fractionation originatesfrom 5 studies (5-9) originally reviewed by Schultheiss (10). TheEQD2 reported was calculated assuming an a/b ratio of 0.87 Gyof the linear-quadratic model.
The lung data is obtained from Figure 2 in Marks et al (11) andfrom the original articles (12-17). It presents the incidence ofpneumonitis after partial lung irradiation, and the mean lung doseis reported. The number of patients included in the study and thenumber of occurrences of the endpoint for each dose level wasneeded in the analysis, and data points for which this informationcould not be determined were omitted. Six of the original 10references could be used.
The bootstrap method
A Monte Carlo-based bootstrap method was applied to assess theuncertainty of the estimated doseeresponse relation. The analysisrequires only the dose, the number of patients, and the number ofoccurrences of the studied endpoint. In this setting, the outcome foreach patient is binary, reflecting whether or not they experienced
Volume 87 � Number 4 � 2013 Assessing uncertainty of doseeresponse 797
a particular side effect. A large number of bootstrap replicates (104)of the original incidence data was produced by random samplingwith replacement within each dose. That is, for each dose, newsamples of the same size N as in the original data were generated inwhich each original data point may or may not be drawn and can bedrawn more than once. For each thus generated bootstrap replicate,the number of resampled patients with the side effect is computed.This is conceptually equivalent to generating N random numbersuniformly distributed between 0 and 1 and identifying the number ofpatients with the side effect as the number of random numbers lessthan P, the proportion of patients with the side effect at this dose inthe original data. Hence, each bootstrap replicate represents analternative outcome in a conceived different sample of patient of thesame size from the same population giving a somewhat different setof estimated incidence rates compared with the original data. The
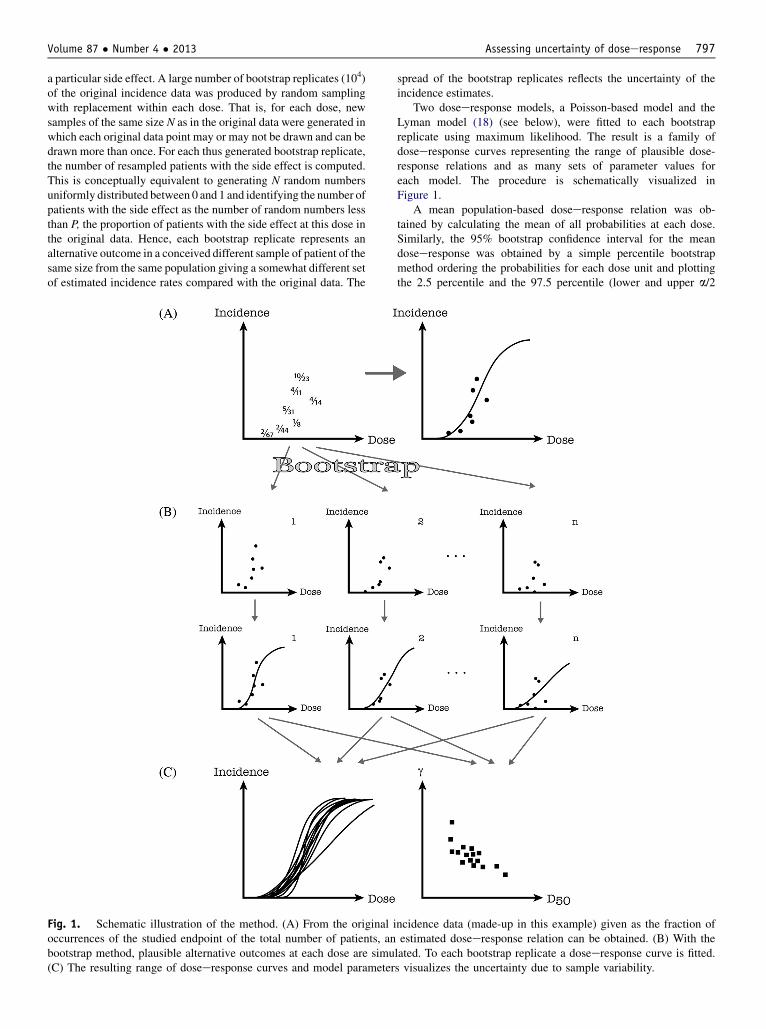
Fig. 1. Schematic illustration of the method. (A) From the original ioccurrences of the studied endpoint of the total number of patients, anbootstrap method, plausible alternative outcomes at each dose are simu(C) The resulting range of doseeresponse curves and model parameter
spread of the bootstrap replicates reflects the uncertainty of theincidence estimates.
Two doseeresponse models, a Poisson-based model and theLyman model (18) (see below), were fitted to each bootstrapreplicate using maximum likelihood. The result is a family ofdoseeresponse curves representing the range of plausible dose-response relations and as many sets of parameter values foreach model. The procedure is schematically visualized inFigure 1.
A mean population-based doseeresponse relation was ob-tained by calculating the mean of all probabilities at each dose.Similarly, the 95% bootstrap confidence interval for the meandoseeresponse was obtained by a simple percentile bootstrapmethod ordering the probabilities for each dose unit and plottingthe 2.5 percentile and the 97.5 percentile (lower and upper a/2
ncidence data (made-up in this example) given as the fraction ofestimated doseeresponse relation can be obtained. (B) With thelated. To each bootstrap replicate a doseeresponse curve is fitted.s visualizes the uncertainty due to sample variability.
Fig. 2. The incidence rate calculated separately in each of thebootstrap replicates in 2-Gy bins for the pneumonitis data. Thedata points are weighted by the number of bootstrap occurrencesand the number of patients in each dose bin.
Wedenberg International Journal of Radiation Oncology � Biology � Physics798
percentile) of the probability at each dose. This provides a 95%pointwise confidence band.
A 95% confidence area of the model parameter distributionwas constructed based on principal component analysis. From theresulting eigenvectors and eigenvalues, an ellipse encompassing95% of all parameter values was made.
Fig. 3. Doseeresponse curves shown for 2$103 bootstrapreplicates of the original pneumonitis incidence data. The Lymandoseeresponse model was used. The original data points areweighted by the number of patients, N: N<10 blue squares,10�N<20 cyan diamonds, 20�N<30 green triangles, 30�N<50magenta circles, N�50 red squares.
Doseeresponse models used
Two doseeresponse models were chosen. The linear Poissonmodel expresses the relation between the probability of responseand dose D as
PPoissonðDÞZexp
�� exp
�eg� D
D50
ðeg� lnðlnð2ÞÞÞ��
ð1Þ
where D50 and g are free parameters and denote the dose givinga 50% probability of response and the normalized doseeresponsegradient (19), respectively. The second doseeresponse model, theLyman model, is expressed as
PLymanðDÞZ 1ffiffiffiffiffiffi2p
pZ t
�N
exp
��x2
2
�dxZ
1
2
�1þ erf
�tffiffiffi2
p��
; ð2Þ
where
tZD�D50
m,D50
and m denotes the slope. In both models the dose D used is theEQD2 (spinal cord) or mean dose (lung) as in the QUANTECreport.
To facilitate the comparison of the resulting parameters fromthe 2 models, the parameter m describing the steepness of thedoseeresponse curve in the Lyman model, is converted to thenormalized slope at D50 by the relation
g50Z1
mffiffiffiffiffiffi2p
p ð3Þ
The slope g in the Poisson-based model represents the maximumnormalized slope which for this model occurs around the dosegiving a 37% probability of response. The slope can be convertedto g50 by the relation
g50Zlnð2Þ2
ðeg� lnðlnð2ÞÞÞ ð4Þ
The models were fitted to data using maximum likelihoodestimation. The outcome data are expressed as the proportion ofpatients in which the studied endpoint was detected givinga binomial distribution of the outcome. The Likelihood functioncan therefore be expressed as
LðqjN; casesÞZY
iPðDi;qÞcasesið1� PðDi;qÞÞNi�casesi ; ð5Þ
where N denotes the total number of patients in the study, casesdenotes the number of occurrences of the studied endpoint, and qdenotes the parameters of the doseeresponse model used.
Results
The bootstrap method generates a range of plausible outcomeprobabilities based on the underlying uncertainty in the clinicaloutcome data. Figure 2 shows the bootstrapped incidence forpneumonitis grouped in 2-Gy bins. The size of the circles is based onthe number of bootstrap replicates with that incidence and the totalnumber of patients within the dose bin. Figure 3 shows a fraction ofthe doseeresponse curves fitted with the Lyman model to thebootstrap replicates of the pneumonitis data. As expected, the rangeof response probabilities is narrower in the dose range of existingdata and broadens beyond that. The range of response curves isvisualized in Figure 4 by the mean response at each dose and the95% bootstrap confidence interval. The doseeresponse curvesshown for pneumonitis andmyelopathy were obtained with both the
Fig. 4. Mean doseeresponse curves and 95% confidence intervals for the Poisson-based model (gray curves) and the Lyman model (blackcurves). The original incidence data of pneumonitis in panel A and of myelopathy in panel B are shown with estimated standard deviations.
Volume 87 � Number 4 � 2013 Assessing uncertainty of doseeresponse 799
Poisson-based model and the Lyman model. In both data sets, the95% confidence intervals of the curve families for the 2 modelsalmost overlap for doses included in the clinical study but divergeand broaden beyond that. The Lyman model indicates a steeperslope than does the Poisson-based model.
The likelihood of the observed data was higher for the Lymanmodel than for the Poisson-based model in both data sets. Thisresult was robust over the bootstrap analysis with higher likeli-hood of the Lyman model in >90% of the bootstrap replicates, inboth data sets. However, the difference in likelihood between the 2models in each bootstrap replicate was typically small.
Fig. 5. Model parameter distributions for the lung case (A and B) andmodel (A and C) and with the Lyman model (B and D). The ellipses s
Figure 5 shows the distributions of the model parameters ob-tained for the 2 doseeresponse models. The parameters D50 and yof the Poisson model (D50 and m of the Lyman model) indicatea negative (positive) correlation. Pearson’s correlation coefficientsfor the lung were �0.73 and 0.69 for the parameters of thePoisson-based model and the Lyman model, respectively. Thecorresponding coefficients for the spinal cord were �0.56 and0.59, respectively. The joint confidence ellipses encompass 95%of the parameter pairs, and Table 1 lists the mean parameter valuesand individual confidence intervals. The parameters g and mdescribing, respectively, the slope of the Poisson-based model and
for the spinal cord case (C and D) obtained with the Poisson-basedhow 95% confidence bounds.
Fig. 6. Comparison of g50 and D50 of the Poisson-based model(gray dots) and the Lyman model (black dots) for the lung case.
Wedenberg International Journal of Radiation Oncology � Biology � Physics800
the slope of the Lyman model are converted to g50 for comparisonbetween models. The distribution is shifted toward higher g50
values and somewhat lower D50 values for the Lyman modelcompared with the Poisson-based model in both data sets. Figure 6shows the resulting parameter distribution in the lung case. Themean g50 obtained for the lung was 0.67 (95% confidence interval:0.57-0.77) for the Poisson-based model and 0.82 (0.68-0.96) forthe Lyman model. The corresponding parameter values for thespinal cord were 2.92 (2.02-4.35) and 3.93 (2.92-5.81).
Discussion
We do not know the true population-based doseeresponse relationsimply because the clinical data from which this relation is esti-mated is based on only a small subset of the population. The esti-mated doseeresponse relation is therefore uncertain. It is valuableto quantify this uncertainty because, for example, an underestima-tion of the risk of normal tissue damage may have severe conse-quences for the patient. On the other hand, an overly cautiousapproach may jeopardize the probability of tumor cure. Confidenceintervals can give upper and lower limits of the relation.
With the bootstrapmethod proposed in this study, the uncertaintyin the clinical outcome data was assessed and translated into anuncertainty in the doseeresponse relation described by 2 commonlyused models. Because both models describe a sigmoid curve usingonly 2 parameters each, and each bootstrap replicate contains a datapoint for each dose, the resulting range in doseeresponse curve wassmaller than the range in bootstrapped incidence data. The resultingspread in doseeresponse curves was visualized by confidence bandsencompassing 95% of the probabilities at each dose.
Several mathematical expressions have been proposed for thetypical sigmoid relation between dose and normal tissue compli-cation probability, and there is no consensus on whichdoseeresponse model that should be used. It has been argued that itis impossible to discriminate between models in general because oftheir similarities in the fit to data in combination with noisy data
(20). We applied 2 doseeresponse models: a Poisson-based modeland the Lyman model. Our results show that the mean responsecurves and the 95% confidence intervals almost overlap for the 2models in the dose region with available data. However, eventhough the difference in likelihood of the observed data is small forthe 2 models, the Lyman model is preferred over the Poisson modelin >90% of the bootstrap replicates. This preference of the Lymanmodel is obtained for both data sets despite their difference in theshape of the doseeresponse curves. Nevertheless, the difference infit is unlikely to be of clinical relevance.
The resulting model parameters are not independent. D50 and yof the Poisson-basedmodel showa negative correlation, andD50 andm of the Lymanmodel show a positive correlation of the same order.It is possible to create confidence intervals for the parametersindividually (given in Table 1), but by plotting the parameter pairsobtained from each bootstrap replicate the correlation is visualized.Not only are they correlated, they are non-Gaussian distributed. Theellipse areas encompass 95% of all parameter pairs but, as seen inFigure 5, the normal distribution assumptionmadewith the ellipse isnot perfect because of the skewed distribution.
The parameters of the 2 models were also converted to D50 andg50 to enable comparison of the resulting parameters. The Lymanmodel gave a higher g50 and a somewhat lower D50 comparedwith the Poisson-based model in both the lung case and spinalcord case. D50 and g50 are sometimes viewed as generaldescriptors of the position and slope of a doseeresponse relation.However, as seen also in this study, different D50 and g50 valuescan be obtained from the same underlying data depending on themodel used. Therefore, awareness of the model used is neededwhen comparing parameter values (20).
In the QUANTEC report, a mean lung dose �20 Gy is recom-mended to limit the incidence rate of pneumonitis in a population to�20%. In this study, a mean lung dose of 20 Gy gives an estimatedincidence rate in the range 19.5% to 27% according to the 95%confidence limits of the doseeresponse curves. The other wayaround, a 20% rate might result already at a mean lung dose equal to16.5Gy. Furthermore,QUANTECsuggests an uppermean dose limitto 7 and 27Gy to limit the risk to 5%and40%, respectively. The rangeof risk for these doses is here estimated to 2% to 7.5% and 33% to46%, respectively. The corresponding lower dose that would give anincidence rate of 5% and 40% is 3 and 25 Gy, respectively. For irra-diation of the spinal cord including the full cord cross-section,QUANTEC report a 0.2%, 6%, and 50% risk of developingmyelopathy of the cervical spinal cord for max doses 50, 60, and 69Gy, respectively. The conservative dose limit obtained here for theserisk levels are 46, 58, and 69Gy, respectively; 50, 60, and 69Gy givesrisk estimates in the range 0.0% to 0.7%, 0.25% to 10.5%, and 17% to50%. It should be noted that the estimated uncertainties are derivedfor the average response for the population and not for an individualpatient.
The only uncertainty accounted for in this study is the oneowing to sample variability. We assume that the original incidencedata comprise a representative subset of the population, and wesample per study and dose combination. In reality, many factorscontribute to variations in the doseeresponse relation. Somedifferences arise from discrepancies from the planned and deliv-ered dose distribution, patient-to-patient variability in the sensi-tivity to radiation, differences in the inclusion/exclusion criteria ofthe study, definition of outcome, follow-up time, and more. Thetrue total uncertainty is therefore underestimated, and the uncer-tainty range presented here should be interpreted as a lower limit.A next step could be to include interexperimental variation and
Volume 87 � Number 4 � 2013 Assessing uncertainty of doseeresponse 801
uncertainties in dose. With information on the delivered dosedistribution, the volume effect can also be included.
In conclusion, the proposed bootstrap method enables statisticalanalysis of the uncertainty of the estimated doseeresponse rela-tions based on the variability inherent in the incidence data fromwhich they are derived. The method also identifies likely values ofmodel parameters, their confidence intervals, and how they inter-relate for each model. Finally, it can be used to evaluate to whatextent data supports one model over another, and the data at handdid indicate stronger empirical support for the Lyman model.
References
1. Emami B, Lyman J, Brown A, et al. Tolerance of normal tissue to
therapeutic irradiation. Int J Radiat Oncol Biol Phys 1991;21:109-122.
2. Jackson A, Marks LB, Bentzen SM, et al. The lessons of QUANTEC:
Recommendations for reporting and gathering data on dose-volume
dependencies of treatment outcome. Int J Radiat Oncol Biol Phys
2010;76(Suppl. 3):S155-S160.
3. Efron B. Bootstrap methods: Another look at the jackknife. Ann Statist
1979;7:1-26.
4. Kirkpatrick JP, van der Kogel AJ, Schultheiss TE. Radiation dose-
volume effects in the spinal cord. Int J Radiat Oncol Biol Phys
2010;76(Suppl, 3):S42-S49.
5. McCunniff AJ, Liang MJ. Radiation tolerance of the cervical spinal
cord. Int J Radiat Oncol Biol Phys 1989;16:675-678.
6. Abbatucci JS, Delozier T, Quint R, et al. Radiation myelopathy of the
cervical spinal cord: Time, dose and volume factors. Int J Radiat
Oncol Biol Phys 1978;4:239-248.
7. Atkins HL, Tretter P. Time-dose considerations in radiation myelop-
athy. Acta Radiol Ther Phys Biol 1966;5:79-94.
8. Marcus RB Jr., Million RR. The incidence of myelitis after
irradiation of the cervical spinal cord. Int J Radiat Oncol Biol Phys
1990;19:3-8.
9. Jeremic B, Djuric L, Mijatovic L. Incidence of radiation myelitis of
the cervical spinal cord at doses of 5500 cGy or greater. Cancer 1991;
68:2138-2141.
10. Schultheiss TE. The radiation dose-response of the human spinal cord.
Int J Radiat Oncol Biol Phys 2008;71:1455-1459.
11. Marks LB, Bentzen SM, Deasy JO, et al. Radiation dose-volume
effects in the lung. Int J Radiat Oncol Biol Phys 2010;76(Suppl. 3):
S70-S76.
12. Hernando ML, Marks LB, Bentel GC, et al. Radiation-induced
pulmonary toxicity: A dose-volume histogram analysis in 201
patients with lung cancer. Int J Radiat Oncol Biol Phys 2001;51:
650-659.
13. Kong FM, Hayman JA, Griffith KA, et al. Final toxicity results of
a radiation-dose escalation study in patients with non-small-cell lung
cancer (NSCLC): Predictors for radiation pneumonitis and fibrosis. Int
J Radiat Oncol Biol Phys 2006;65:1075-1086.
14. Oetzel D, Schraube P, Hensley F, et al. Estimation of pneumonitis risk
in three-dimensional treatment planning using dose-volume histogram
analysis. Int J Radiat Oncol Biol Phys 1995;33:455-460.