27
Assessing Vulnerability of Food System in Rohini-Tinau-Banaganga (RTB) basins in Nepal, Tarai Nepal Water Conservation Foundation 2005, Kathmandu
| Date post: | 13-Dec-2015 |
| Category: |
Documents |
| Upload: | corey-carr |
| View: | 219 times |
| Download: | 1 times |

Assessing Vulnerability of Food System in
Rohini-Tinau-Banaganga (RTB) basins in Nepal, Tarai
Nepal Water Conservation Foundation2005, Kathmandu
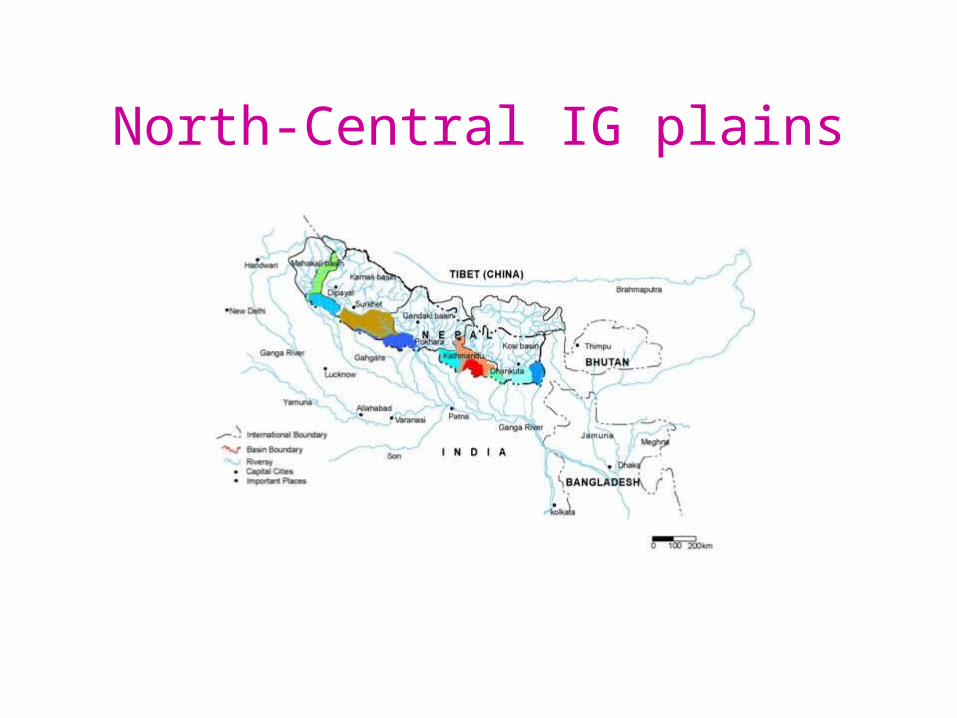
North-Central IG plains

Physiography

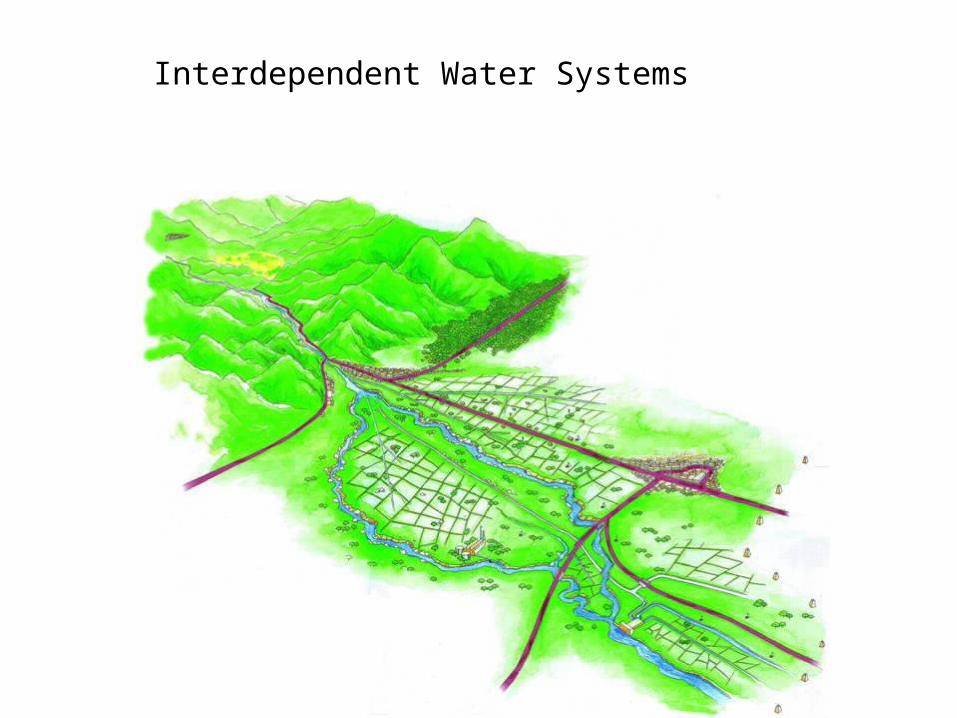
Interdependent Water Systems

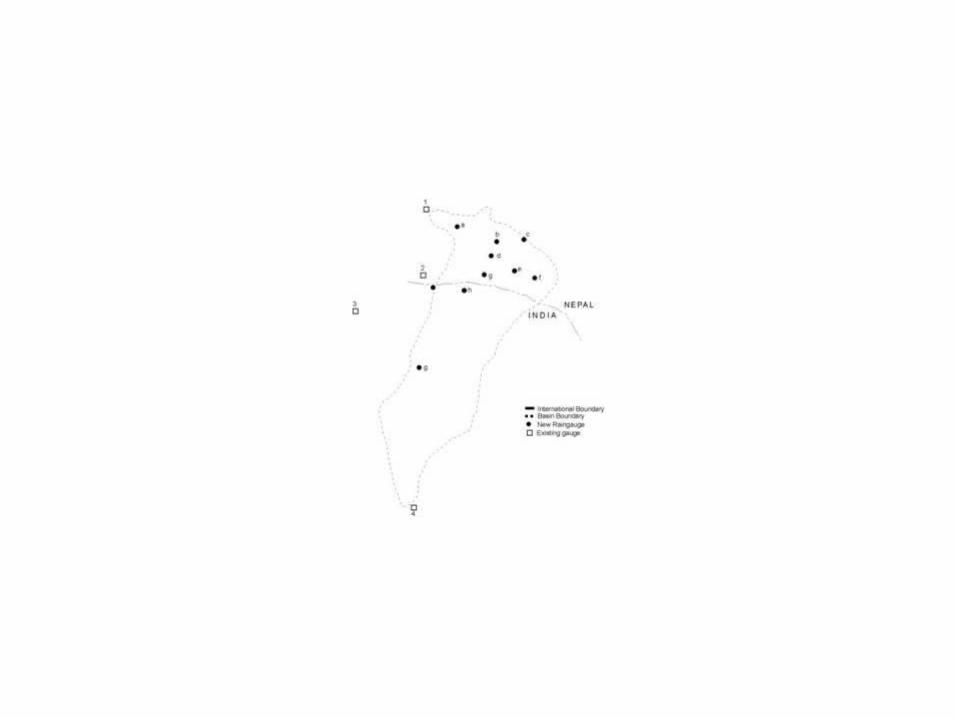
Administrative Map


Average Households Annual Income of
Source RohiniIncome (Rs) Per cent
Agriculture 14,065 13.9
Livestock 6,732 6.7
Service 28,007 27.7
Trade/Business 2,694 2.7
Cottage Industry
1,001 1.0Others 48,589 48.0
Total 1,01,080 100
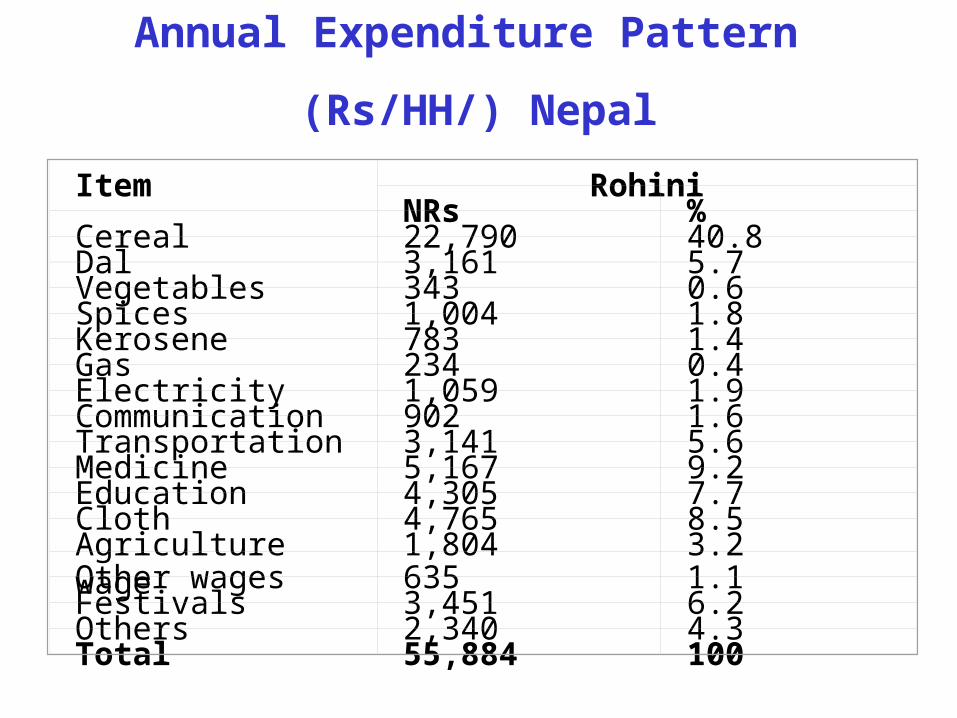
Item RohiniNRs %
Cereal 22,790 40.8Dal 3,161 5.7Vegetables 343 0.6Spices 1,004 1.8Kerosene 783 1.4Gas 234 0.4Electricity 1,059 1.9Communication 902 1.6Transportation 3,141 5.6Medicine 5,167 9.2Education 4,305 7.7Cloth 4,765 8.5Agriculture wage 1,804 3.2Other wages 635 1.1Festivals 3,451 6.2Others 2,340 4.3Total 55,884 100
Annual Expenditure Pattern
(Rs/HH/) Nepal

Close to mountains. Variation in the IG plain
Drained by rivers that originate in the Chure hills
Flood and bank cutting, water shortage in
winter
Sites Selection
Perceived breadbasket but food deficit
Many irrigation systems (large and small, old and new)
Major people’s movement route between Bhairahawa and Gorakhpur
Movement of people for employment, trade and pilgrim
New settlements, mixed population of both Tarai and hill origin

Transition region between the lower IGP and hills
Physical intervention has changed hydrological character of eastern part. Conventional water management approach not effective
Clearing of forest for settlement and East-West introduced transformation
Local industries and new livelihood opportunities.
Since 1995, NWCF involved in local water management and local adaptation study.
Outputs : • Rethinking the mosaic, • Fluid mosaic, and • Livelihood resilience.
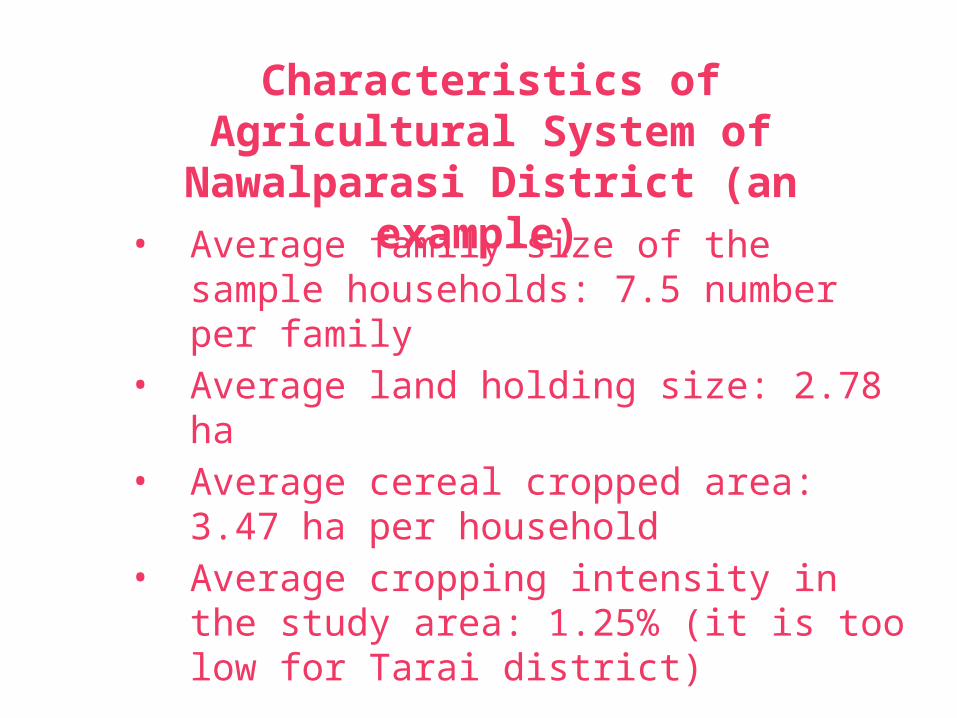
• Average family size of the sample households: 7.5 number per family
• Average land holding size: 2.78 ha• Average cereal cropped area: 3.47 ha
per household• Average cropping intensity in the
study area: 1.25% (it is too low for Tarai district)
Characteristics of Agricultural System of Nawalparasi District (an example)
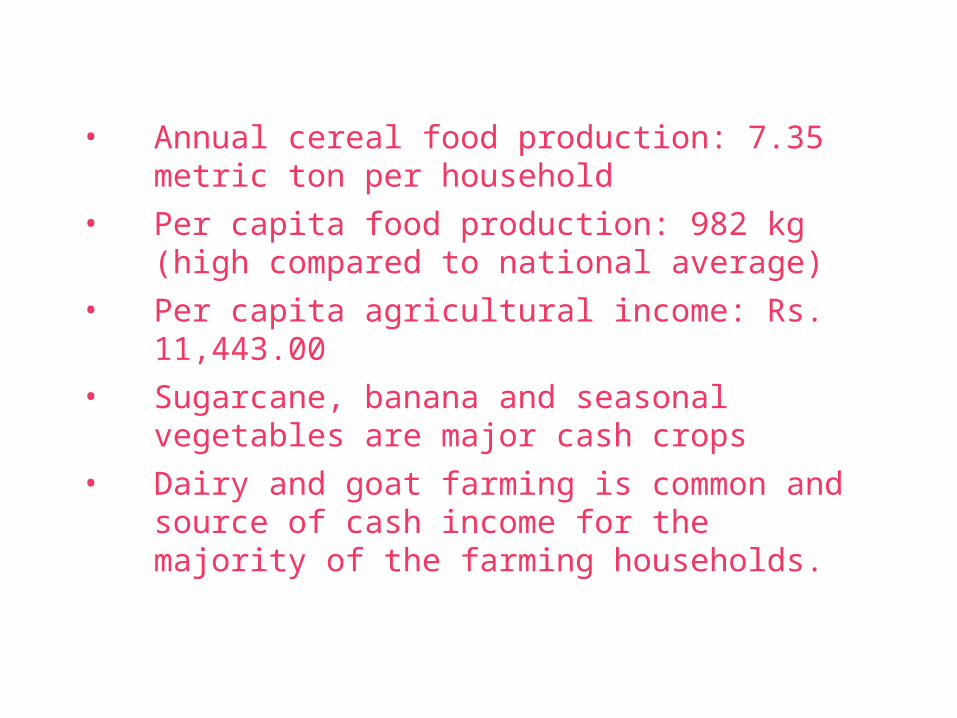
• Annual cereal food production: 7.35 metric ton per household
• Per capita food production: 982 kg (high compared to national average)
• Per capita agricultural income: Rs. 11,443.00
• Sugarcane, banana and seasonal vegetables are major cash crops
• Dairy and goat farming is common and source of cash income for the majority of the farming households.
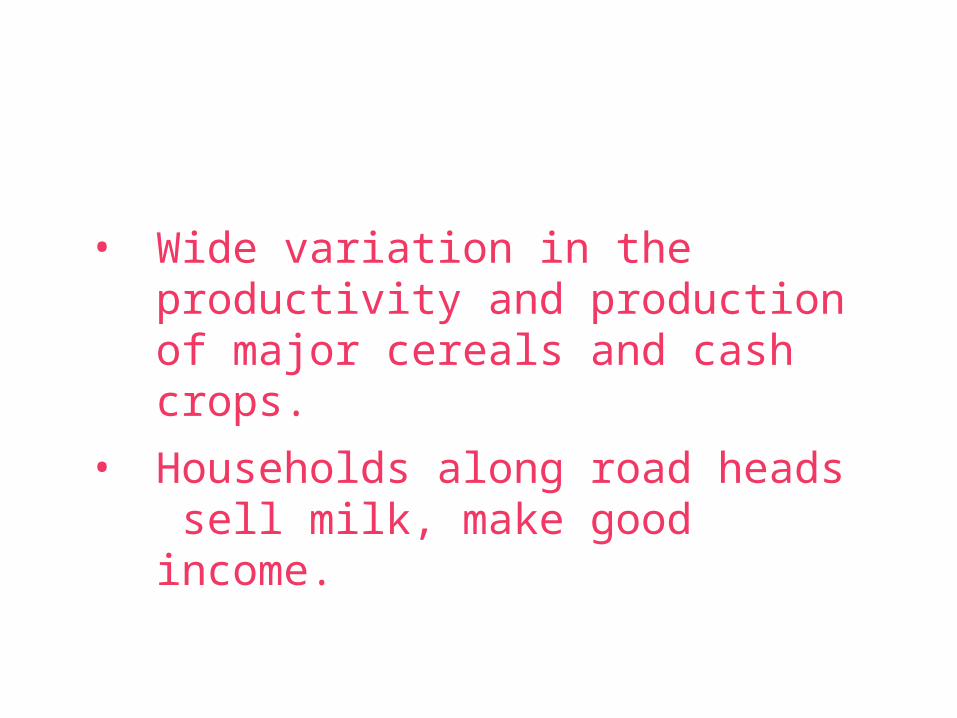
• Wide variation in the productivity and production of major cereals and cash crops.
• Households along road heads sell milk, make good income.
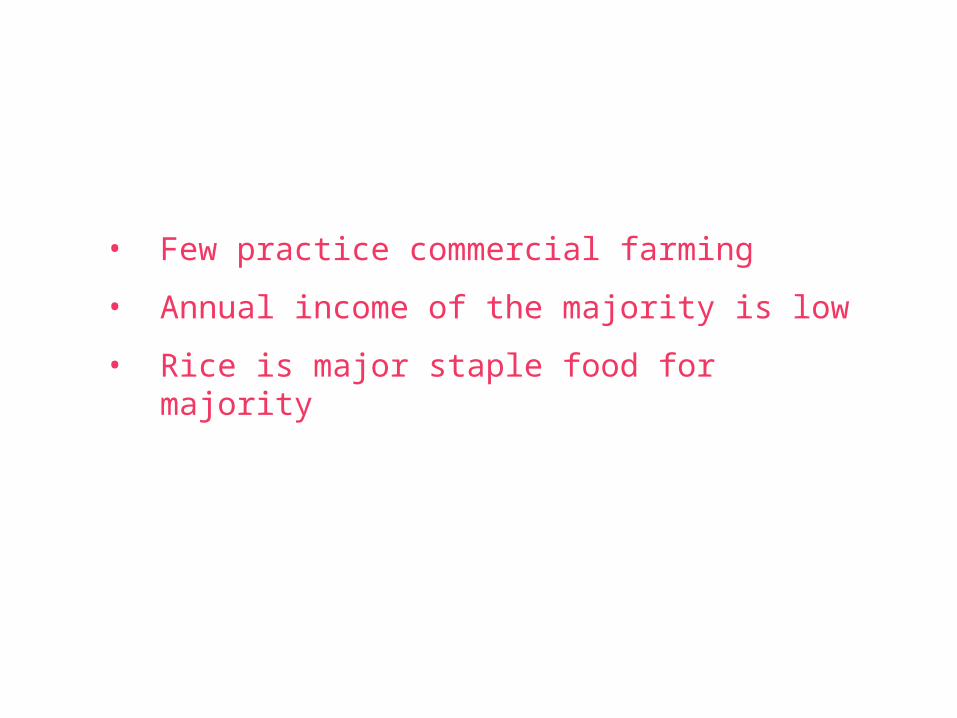
• Few practice commercial farming
• Annual income of the majority is low
• Rice is major staple food for majority
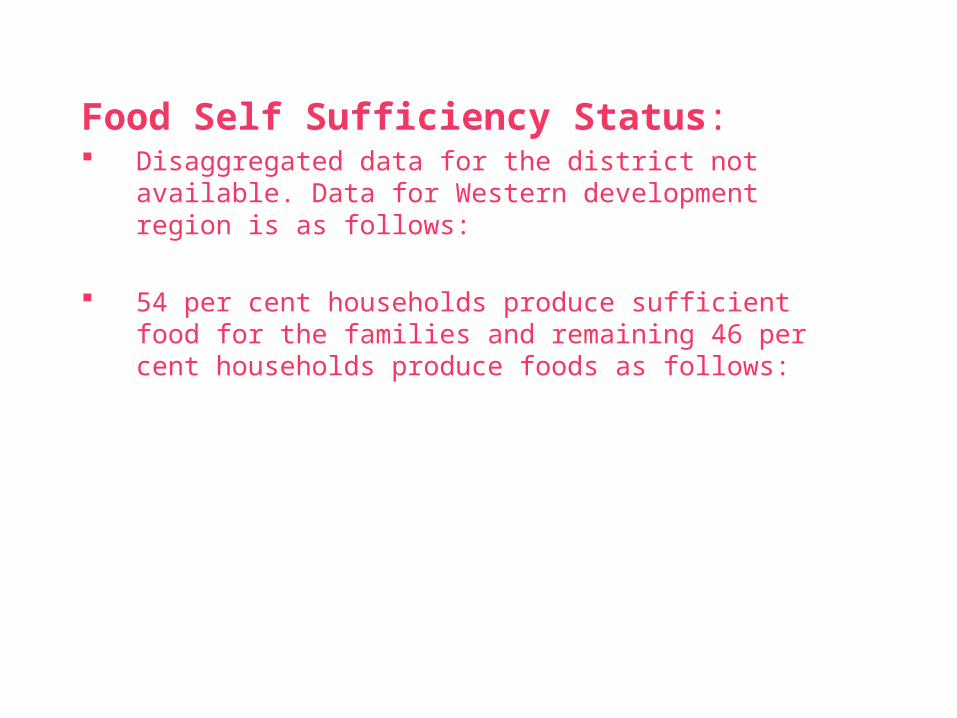
Food Self Sufficiency Status: Disaggregated data for the district not available. Data
for Western development region is as follows:
54 per cent households produce sufficient food for the families and remaining 46 per cent households produce foods as follows:
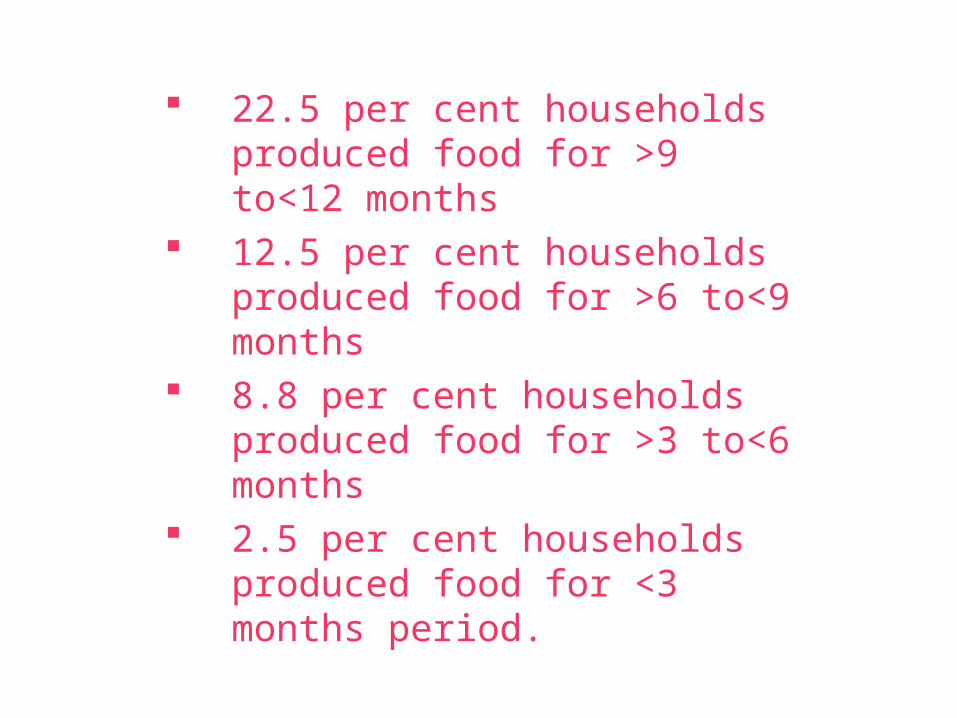
22.5 per cent households produced food for >9 to<12 months
12.5 per cent households produced food for >6 to<9 months
8.8 per cent households produced food for >3 to<6 months
2.5 per cent households produced food for <3 months period.
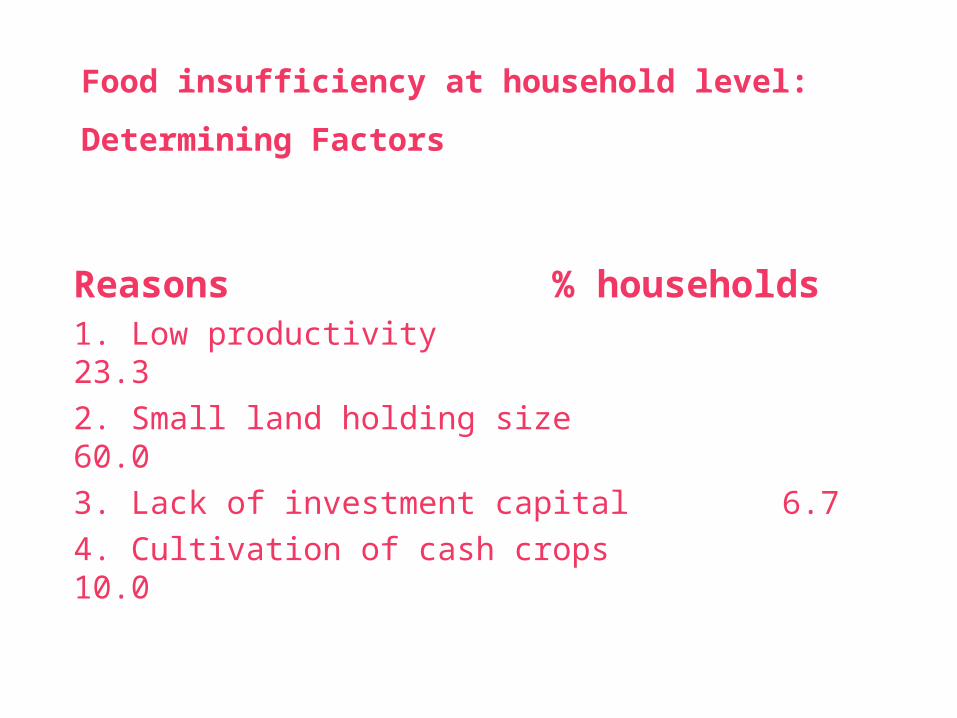
Food insufficiency at household level:
Determining Factors
Reasons % households1. Low productivity 23.32. Small land holding size 60.03. Lack of investment capital 6.74. Cultivation of cash crops 10.0
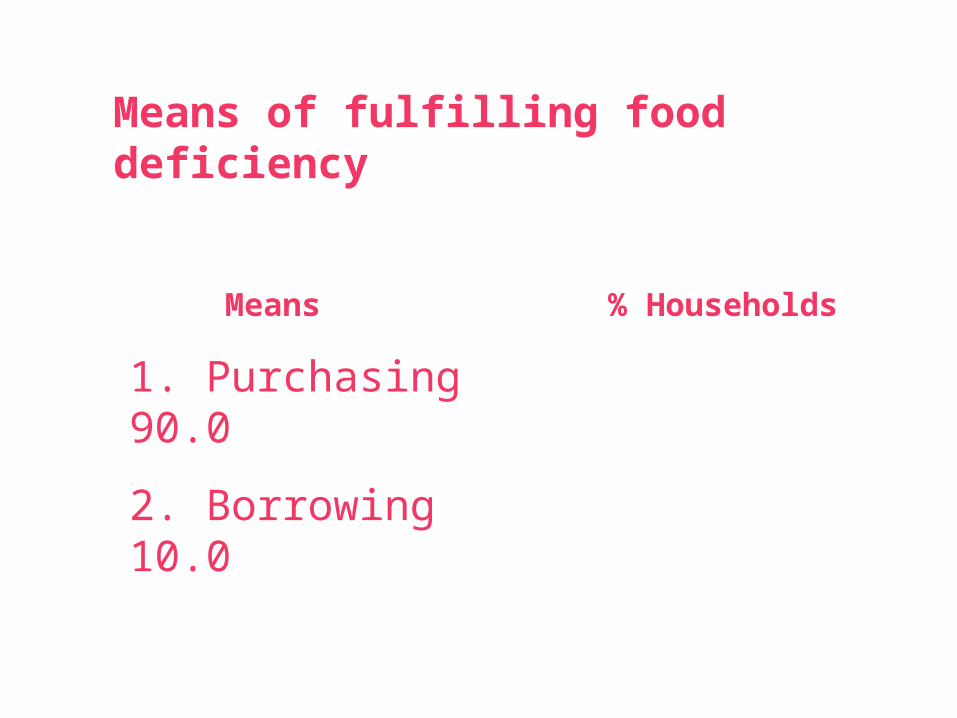
Means of fulfilling food deficiency
Means % Households
1. Purchasing90.0
2. Borrowing 10.0

From adaptive study: Another perspective
Occupation
Population on agriculture 36%
Labor 16.3%
Services and teaching 9.5%
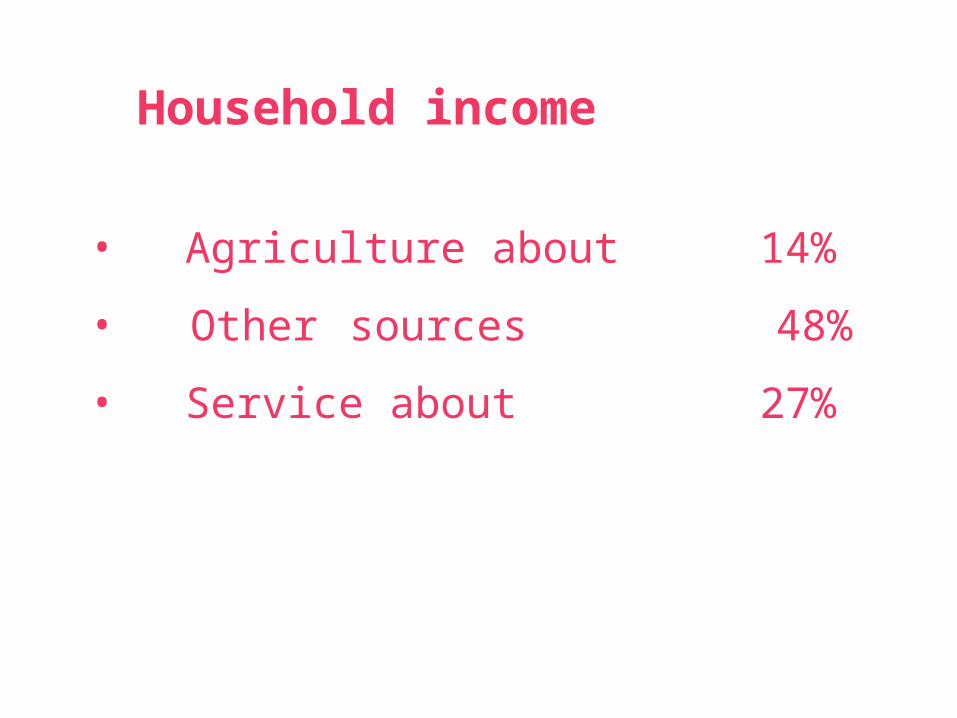
Household income
• Agriculture about 14%
• Other sources 48%
• Service about 27%
Migration
About 36% have lived for more than 20 years.
About 64% has migrated in the recent past.
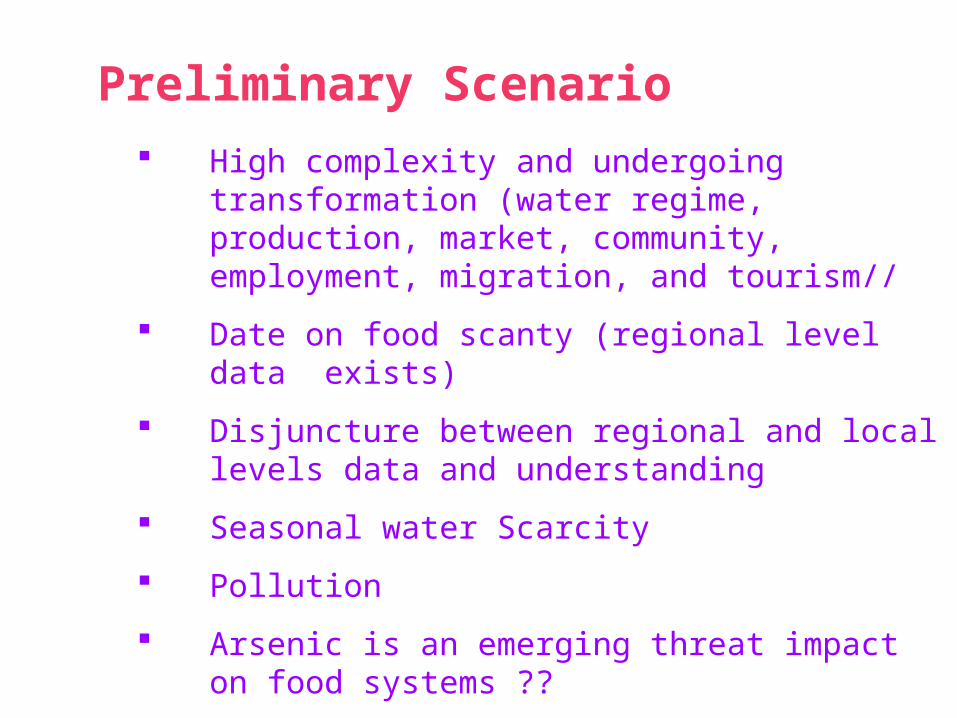
High complexity and undergoing transformation (water regime, production, market, community, employment, migration, and tourism//
Date on food scanty (regional level data exists)
Disjuncture between regional and local levels data and understanding
Seasonal water Scarcity
Pollution
Arsenic is an emerging threat impact on food systems ??
Preliminary Scenario


