35
Assessing Workers’ Compensation Schemes in an Incomplete Contracts Framework Arlene Wong University of New South Wales Supervisors: Dr. Kieron Meagher and Dr. Sachi Purcal
| Date post: | 21-Dec-2015 |
| Category: |
Documents |
| View: | 213 times |
| Download: | 0 times |

Assessing Workers’ Compensation Schemes in an Incomplete Contracts
Framework
Arlene Wong
University of New South Wales
Supervisors: Dr. Kieron Meagher and Dr. Sachi Purcal

Purpose of Study
• A range of Workers’ Compensation schemes exist in Australia
• Our aim is to evaluate the different schemes in achieving its objectives
– Incomplete contracts model– Empirical Study
• Consider the choice of scheme as a policy tool
• Extend the incomplete contracts literature to understand the effect of competition on incentives.

Central Scheme
Managed Scheme
Competitive State Fund
Highly Regulated
Partially Regulated
Monopoly Hybrid
Unregulated
Competitive
QLD
Canada
Washington
NSW
SA
Victoria
Oregon
Colorado
SouthCarolina
Wisconsin Western Australia
TAS
ACT
NT
Texas
Germany
CentralSchemeCentral Scheme
Motivation
Aims
Claims management
Adequate compensation of injured workers
High quality of service to workers and employers
ManagedScheme
ManagedScheme
Partially RegulatedPartially Regulated
UnregulatedUnregulated

Agenda
• Key conclusions… details later
• Methodology
• Theoretical results
• Empirical Results
• Policy Implications

Key Conclusions
• Dispersion in performance of WC schemes in Australia.
• Partly explained by differences in incentives to cost cut and improve quality of service.– Schemes with lower government control have a greater
incentive to cut costs, but also improve quality of service.
• Empirical evidence suggests pursuing a government run scheme is preferable.

Agenda
• Key conclusions… details later
• Methodology
• Theoretical results
• Empirical Results
• Policy Implications

WC Insurance
Agent
Benefit B
Employers
Workers
Compensation R
G
Costs C

Approach
1. Theoretical Incomplete Contracts Model
• Social Optimum1) Central Scheme2) Monopoly Managed Scheme3) Oligopoly Managed Scheme4) Monopoly Private Scheme5) Oligopoly Private Scheme
2. Empirical Investigation
Hart, Shleifer, Vishny (1997)

What is an ‘incomplete contract’?
• A contract between a publisher and an author.
• Idea on twist in the plot – how much effort to put in?

Incomplete Contracts Framework
Date 0 Date 1
Contract written between G & Mk
Mk chooses the level of investment.
1. Quality improving innovation
2. Cost-cutting innovation
Renegotiation of contract occurs.
Mk is remunerated.
Date 2
Source: Hart (1995)
Mk chooses the level of investment in:
1. Cost-cutting innovations
2. Quality improving innovations
Source: Hart (1995)B = B0 - b(e)B = B0 - b(e) + β(i)
C = C0 + e – c(e)
R = R0 + J(e)
C = C0 + e – c(e) + i
R = R0 + J(e) – R(i)
Three Effects: Operating costs, Quality of service and Claim costs

Incomplete Contracts Framework
Date 0 Date 1
Contract written between G & Mk
Mk chooses the level of investment.
1. Quality improving innovation
2. Cost-cutting innovation
Renegotiation of contract occurs.
Mk is remunerated.
Date 2
Source: Hart (1995)
Mk chooses the level of investment in:
1. Cost-cutting innovations
2. Quality improving innovations
i
$
MC
MR1MR2
i1i2
Managed Scheme

Relative bargaining payoffs
• Social Optimum
• Case 1: Central Scheme
• Case 2: Monopoly Managed Scheme
• Case 3: Oligopoly Managed Scheme
,
max e i
N e i
,
max ( ) ( ) ( ) ( ) ( )e i
N b e c e i R i J e e i
0 0,
1max [ { ( ) ( )} ( ) ]2 k k k k kM M M M Me i
N P C i R i c e e i
[ ( ) ( ) ( ) ( ) ( )]2 b e c e i R i J e
,
max [ ( ) ]e i
N c e e i 1 { ( ) ( )}2 i R i
kP

Modelling Competition
• Consumer utility model
• Probability of choosing insurer k
0 0( )k k kY S i
1
1
1
Pr max
( ) ( ) ( ) ( ) Pr ,...,
( ) ( ) ( )
k k j
k k nk n k
k
j k
P Y Y
i i i i
i if x F x dx
Two factors: Small σ and Large n

Relative bargaining payoffs
• Case 4: Monopoly Private Scheme
• Case 5: Oligopoly Private Scheme
( )VR i
0 0 0,
max [ ( ) ( ) ( ) ]k k k k k
V Vk k
V V V V Ve i
N P R C c e R i J e e i
0 0 0,
max [ ( ) ]V V
V V Ve i
N P R C c e e i ( )VJ e
kP
Two factors: Different remuneration and levels of competition

Agenda
• Key conclusions… details later
• Methodology
• Theoretical results
• Empirical Results
• Policy Implications

Distortions
• Incomplete contracts.
• Privatised schemes do not consider quality.
• Competition can cause excessive investment.

Sub-optimal Investments
High
Low
HighLow
Central Scheme
Managed Monopoly
Private Monopoly
Level of Cost-Cutting (e)
Level of Quality
Innovation (i)
Social Optimal

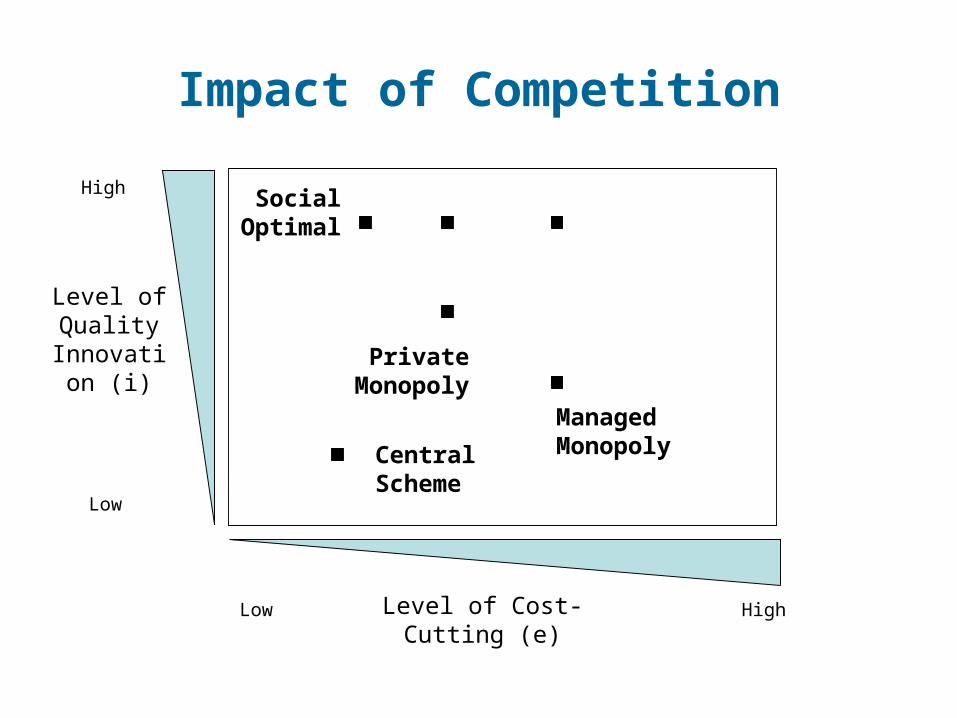
Impact of Competition
High
Low
HighLow
Central Scheme
Managed Monopoly
Private Monopoly
Level of Cost-Cutting (e)
Level of Quality
Innovation (i)
Social Optimal

Impact of Competition
• Investment increases in n and decreases in σ
• Overinvestment: Small σ– Reduce n
• Underinvestment: Large σ– Increase n

Impact of Competition
High
Low
HighLow
Central Scheme
Managed Monopoly
Private Monopoly
Level of Cost-Cutting (e)
Level of Quality
Innovation (i)
Social Optimal
Impact of Competition
High
Low
HighLow
Central Scheme
Managed Monopoly
Private Monopoly
Level of Cost-Cutting (e)
Level of Quality
Innovation (i)
Social Optimal

In the end, it is a question of trade-offs
High
Low
HighLow
Central Scheme
Managed Monopoly
Managed Oligopoly
Private Monopoly
Private Oligopoly
Level of Cost-Cutting (e)
Level of Quality
Innovation (i)

Relative dominance of effects
High
Low
HighLow
Central Scheme
Managed Monopoly
Managed Oligopoly
Private Monopoly
Private Oligopoly
Level of Cost-Cutting (e)
Level of Quality
Innovation (i)

Scheme Predictions
(e)
(i)
Central Scheme
Private Monopoly
Managed Monopoly
Managed Oligopoly
Private Oligopoly
Claims QualityCentral Low HighManaged Medium MediumPrivate High High
Predictions
Cost cutting dominates quality
improvements
Rank1 2
3Low
Central Private Managed

Agenda
• Key conclusions… details later
• Methodology
• Theoretical results
• Empirical Results
• Policy Implications

Sources: *National Workers’ Compensation Statistics Database
4
6
8
10
12
14
16
18
20
1995 1996 1997 1998 1999 2000
ManagedPrivateCentral
Duration of Injury (weeks)* Total Scheme Costs**
**Australian Comparative Performance Monitoring Report
1.0
1.5
2.0
2.5
3.0
1998 1999 2000 2001 2002 2003 2004
ManagedPrivateCentral
%

Source: *Australian Comparative Performance Monitoring Report
Frequency Rate Asset to Liability Ratio
6
8
10
12
14
16
1998 1999 2000 2001 2002 2003 2004
ManagedPrivateCentral
40
60
80
100
120
140
160
1998 1999 2000 2001 2002 2003 2004
ManagedPrivateCentral
%

Quality of service
2.5
3.0
3.5
4.0
4.5
1999 2000 2001 2002 2003 2004 2005
ManagedPrivateCentral
Out of5.0

Empirical Modelling• Indicators of claims management:
– Frequency rate, claims costs, asset to liability ratio and average premium rates.
• Explanatory variables:– Proportion of male– Proportion of full-time workers– Proportion of workers over 55– Unemployment rate– AWE
1 21
n
it k ikt i i itk
y X M P

Empirical Results
Mean Variable Aim
Central Private Managed
Frequency rate Lower 3 1 2
Total Costs Lower 1 2 3
AL Ratio Higher 1 2 3
Premium Rate Lower 1 2 3
Overall 1 2 3
Variance Variable Lower
Ranking
Similar across all schemes.

Agenda
• Key conclusions… details later
• Methodology
• Theoretical results
• Empirical Results
• Policy Implications

Policy Implications
• There are differences in incentives across schemes– The ‘optimal’ WC scheme depends on the relative importance of
the different investments.
• A government controlled scheme appears favorable in light of the aims of WC insurance.
• The choice of scheme is an effective policy tool to be considered.
• Competition between agents may move the incomplete contract outcome further away from the social optimum.

Questions and Comments Welcome

Cost cutting is higher in schemes with less government control
1
e*op eMk = eM
eVk = eV
* * *[ '( ) '( ) '( )]2 G G Gb e c e J e
* * *'( ) '( ) '( )op op opb e c e J e
* *'( ) '( )k kV Vc e J e
*'( )kMc e
eVk = eV eG
Backup

Quality Improvements is higher in schemes with less government control
1
iG i*op iM iMk
* *[ '( ) '( )]2 G Gi R i
* *1 [ '( ) '( )]2 M Mi R i
* * * ** * * *
0 0
'( ) '( ) ( ) ( )'[0]. '( ).[ ( ) ]
2 [0] 2k k k k
k k k k
M M M MM M M M
i R i i R iFi P C c e e i
F
* *'( ) '( )op opi R i
iV
iVk
Backup


