Assessment of Advective Porewater Movement Affecting Mass Transfer of Hydrophobic Organic Contaminants in Marine Intertidal Sediment YEO-MYOUNG CHO, † DAVID WERNER, ‡ KEVAN B. MOFFETT, ¶ AND RICHARD G. LUTHY* ,† Department of Civil and Environmental Engineering, Stanford University, Stanford, California 94305, School of Civil Engineering and Geoscience, Newcastle University, NE1 7RU, England, U.K., and Department of Environmental Earth System Science, Stanford University, Stanford, California 94305 Received November 25, 2009. Revised manuscript received June 23, 2010. Accepted June 25, 2010. Advective porewater movement and molecular diffusion are important factors affecting the mass transfer of hydrophobic organic compounds (HOCs) in marsh and mudflat sediments. This study assessed porewater movement in an intertidal mudflat in South Basin adjacent to Hunters Point Shipyard, San Francisco, CA, where a pilot-scale test of sorbent amendment assessed the in situ stabilization of polychlorinated biphenyls (PCBs). To quantify advective porewater movement within the top 0-60 cm sediment layer, we used temperature as a tracer and conducted heat transport analysis using 14-day data from multidepth sediment temperature logging stations and one- dimensional heat transport simulations. The best-fit conditions gave an average Darcy velocity of 3.8cm/ d in the downward vertical direction for sorbent-amended sediment with a plausible range of 0cm/ d to 8cm/ d. In a limiting case with no net advection, the best-fit depth-averaged mechanical dispersion coefficient was 2.2 × 10 -7 m 2 / s with a range of 0.9 × 10 -7 m 2 / s to 5.6 × 10 -7 m 2 / s. The Pe ´ clet number for PCB mobilization showed that molecular diffusion would control PCB mass transfer from sediment to sorbent particles for the case of uniform distribution of sorbent. However, the advective flow and mechanical dispersion in the test site would significantly benefit the stabilization effect of heterogeneously distributed sorbent by acting to smooth out the heterogeneities and homogenizing pollutant concentrations across the entire bioactive zone. These measurements and modeling techniques on intertidal sediment porewater transport could be useful for the development of more reliable mass transfer models for the prediction of contaminant release within the sediment bed, the movement of HOCs in the intertidal aquatic environment, and in situ sequestration by sorbent addition. Introduction Sediments accumulate hydrophobic organic compounds (HOCs) such as polychlorinated biphenyls (PCBs), polycyclic aromatic hydrocarbons (PAHs), and dichloro-diphenyl- trichloroethane (DDT). Sediments thus act as reservoirs, exposing HOCs to benthic biota, releasing HOCs into porewater, and contributing HOCs to the aquatic food web. Recent research shows that certain sediment particle types, known as black carbon (BC), may have stronger sorption capacity than inorganic particles with coatings or inclusions of natural organic matter (1). Char, charcoal, soot, and their derivatives are such types with strong sorption capacity. Once the HOCs are sorbed into the BCs, they become much less available than HOCs sorbed on other mineral-based particles (1, 2). These findings motivated studies of a novel in situ sediment treatment strategy using activated carbon (AC) as a strong sorbent to sequester HOCs. By incorporating AC into HOC-contaminated sediment, HOCs would be redis- tributed, sorbed on to AC particles and become less available to porewater and biota. The proof of concept was demon- strated in a series of laboratory and field studies (3-11). For instance, introducing 3.4 dry wt% of AC into well-mixed sediment-water slurries in the laboratory yielded about 90% reductions of PCBs, PAHs, and DDTs in water phases and benthic organisms (3-9). Mixing about 2% AC into the top 30-cm sediment layer at a mudflat in San Francisco Bay, CA yielded 50-66% reduction in HOC concentrations in pore- water, passive samplers and benthic test organisms (10, 11). Other than AC dosage, the difference in performance between laboratory and field trials may have been a result of HOC mass transfer in the field occurring without continuous and complete mixing of AC and sediment. In this case, diffusion between sediment and AC particles may be a limiting process for HOC mass transfer. To explain HOC mass transfer in a stagnant system, Werner et al. (12) built a mass transfer model of an unmixed sediment system that considered intra- and interparticle movement of HOCs by sorption-retarded molecular diffusion. The model predictions showed that the HOC mass transfer to AC in a quiescent system would be greatly retarded and the full effect of reduction in aqueous HOC concentration by AC would be delayed for a number of years (12). This model did not account for possible advective porewater movement in an intertidal mudflat (13-16), which could affect HOC mass transfer. Several mechanisms are believed to result in advective movement in intertidal or subtidal areas: bottom currents, propagating waves, subtidal pumping, bottom water density changes, resuspension of bed sedi- ments, and bottom microtopography (13, 17, 18). The quantification of the porewater movement is challenging because the intertidal system undergoes rapid changes (13, 19). To assess advective porewater movement within the upper 0-60 cm sediment layer in a intertidal mudflat, we used “heat as a tracer” (20). The use of heat as a tracer of vertical groundwater flow has been a standard tool in hydrogeology (20), and remains a powerful tool in cases with predominantly vertical fluid and heat transport (20, 21). Such a case was the nearly horizontal intertidal mudflat of this study (slope approximately 0.25-0.5%, estimated from (22)). The low local relief and lack of significant inland water drainage imply very low horizontal hydrologic gradients at this site. The sediment surface temperature of intertidal areas fluctuates because of tidal action and solar radiation (23, 24). Heat * Corresponding author e-mail: [email protected]. † Stanford University, CEE. ‡ Newcastle University, CEG. ¶ Stanford University, EESS. Environ. Sci. Technol. 2010, 44, 5842–5848 5842 9 ENVIRONMENTAL SCIENCE & TECHNOLOGY / VOL. 44, NO. 15, 2010 10.1021/es903583y 2010 American Chemical Society Published on Web 07/07/2010
Transcript
Assessment of Advective PorewaterMovement Affecting Mass Transferof Hydrophobic OrganicContaminants in Marine IntertidalSedimentY E O - M Y O U N G C H O , † D A V I D W E R N E R , ‡
K E V A N B . M O F F E T T , ¶ A N DR I C H A R D G . L U T H Y * , †
Department of Civil and Environmental Engineering, StanfordUniversity, Stanford, California 94305, School of CivilEngineering and Geoscience, Newcastle University, NE1 7RU,England, U.K., and Department of Environmental EarthSystem Science, Stanford University,Stanford, California 94305
Received November 25, 2009. Revised manuscript receivedJune 23, 2010. Accepted June 25, 2010.
Advective porewater movement and molecular diffusion areimportant factors affecting the mass transfer of hydrophobicorganic compounds (HOCs) in marsh and mudflat sediments. Thisstudy assessed porewater movement in an intertidal mudflatin South Basin adjacent to Hunters Point Shipyard, San Francisco,CA, where a pilot-scale test of sorbent amendment assessedthe in situ stabilization of polychlorinated biphenyls (PCBs). Toquantify advective porewater movement within the top 0-60cm sediment layer, we used temperature as a tracer andconducted heat transport analysis using 14-day data frommultidepth sediment temperature logging stations and one-dimensional heat transport simulations. The best-fit conditionsgave an average Darcy velocity of 3.8cm/d in the downwardvertical direction for sorbent-amended sediment with a plausiblerange of 0cm/d to 8cm/d. In a limiting case with no netadvection, the best-fit depth-averaged mechanical dispersioncoefficient was 2.2 × 10⁻⁷m2/s with a range of 0.9 × 10⁻⁷m2/sto 5.6 × 10⁻⁷m2/s. The Peclet number for PCB mobilizationshowed that molecular diffusion would control PCB mass transferfrom sediment to sorbent particles for the case of uniformdistribution of sorbent. However, the advective flow andmechanical dispersion in the test site would significantly benefitthe stabilization effect of heterogeneously distributed sorbentby acting to smooth out the heterogeneities and homogenizingpollutant concentrations across the entire bioactive zone.These measurements and modeling techniques on intertidalsediment porewater transport could be useful for the developmentof more reliable mass transfer models for the prediction ofcontaminant release within the sediment bed, the movementof HOCs in the intertidal aquatic environment, and in situsequestration by sorbent addition.
Introduction
Sediments accumulate hydrophobic organic compounds(HOCs) such as polychlorinated biphenyls (PCBs), polycyclicaromatic hydrocarbons (PAHs), and dichloro-diphenyl-trichloroethane (DDT). Sediments thus act as reservoirs,exposing HOCs to benthic biota, releasing HOCs intoporewater, and contributing HOCs to the aquatic food web.Recent research shows that certain sediment particle types,known as black carbon (BC), may have stronger sorptioncapacity than inorganic particles with coatings or inclusionsof natural organic matter (1). Char, charcoal, soot, and theirderivatives are such types with strong sorption capacity. Oncethe HOCs are sorbed into the BCs, they become much lessavailable than HOCs sorbed on other mineral-based particles(1, 2).
These findings motivated studies of a novel in situsediment treatment strategy using activated carbon (AC) asa strong sorbent to sequester HOCs. By incorporating ACinto HOC-contaminated sediment, HOCs would be redis-tributed, sorbed on to AC particles and become less availableto porewater and biota. The proof of concept was demon-strated in a series of laboratory and field studies (3-11). Forinstance, introducing 3.4 dry wt% of AC into well-mixedsediment-water slurries in the laboratory yielded about 90%reductions of PCBs, PAHs, and DDTs in water phases andbenthic organisms (3-9). Mixing about 2% AC into the top30-cm sediment layer at a mudflat in San Francisco Bay, CAyielded 50-66% reduction in HOC concentrations in pore-water, passive samplers and benthic test organisms (10, 11).Other than AC dosage, the difference in performance betweenlaboratory and field trials may have been a result of HOCmass transfer in the field occurring without continuous andcomplete mixing of AC and sediment. In this case, diffusionbetween sediment and AC particles may be a limiting processfor HOC mass transfer.
To explain HOC mass transfer in a stagnant system,Werner et al. (12) built a mass transfer model of an unmixedsediment system that considered intra- and interparticlemovement of HOCs by sorption-retarded molecular diffusion.The model predictions showed that the HOC mass transferto AC in a quiescent system would be greatly retarded andthe full effect of reduction in aqueous HOC concentrationby AC would be delayed for a number of years (12). Thismodel did not account for possible advective porewatermovement in an intertidal mudflat (13-16), which couldaffect HOC mass transfer. Several mechanisms are believedto result in advective movement in intertidal or subtidal areas:bottom currents, propagating waves, subtidal pumping,bottom water density changes, resuspension of bed sedi-ments, and bottom microtopography (13, 17, 18). Thequantification of the porewater movement is challengingbecause the intertidal system undergoes rapid changes(13, 19).
To assess advective porewater movement within the upper0-60 cm sediment layer in a intertidal mudflat, we used“heat as a tracer” (20). The use of heat as a tracer of verticalgroundwater flow has been a standard tool in hydrogeology(20), and remains a powerful tool in cases with predominantlyvertical fluid and heat transport (20, 21). Such a case was thenearly horizontal intertidal mudflat of this study (slopeapproximately 0.25-0.5%, estimated from (22)). The low localrelief and lack of significant inland water drainage implyvery low horizontal hydrologic gradients at this site. Thesediment surface temperature of intertidal areas fluctuatesbecause of tidal action and solar radiation (23, 24). Heat
5842 9 ENVIRONMENTAL SCIENCE & TECHNOLOGY / VOL. 44, NO. 15, 2010 10.1021/es903583y 2010 American Chemical SocietyPublished on Web 07/07/2010
transport by conduction and convection determines thetemperature depth profiles in the sediment.
We used the porewater movement determined by invert-ing a heat transport model to assess its relative importancein HOC mass transfer compared to diffusive mass transfer.An innovative aspect of this study was its combination of (a)the inverse approach of Silliman et al. (25) to quantify thevertical pore water flow beneath a water body of a knowntemperature with (b) the effects of ephemeral surface floodingon vertical fluid and heat flow (26) and (c) sedimenttemperature profile data from the challenging environmentof an intertidal mudflat. This approach differs from previousdescriptive studies of sediment temperature profiles inmudflats (23, 27) and studies that specified a priori a specificmechanism of porewater convection prior to calculatingadvective velocities (e.g., thermal density instability (13)).Another innovative aspect of this study was its use of heatas a tracer for understanding HOC transport in the envi-ronment.
This work used field-collected temperature data and aheat transport model to estimate limiting values of verticalinterstitial porewater flow velocities and mechanical disper-sion coefficients. Then this information was applied tocalculate a ratio of the rate of advection to the rate ofmolecular diffusion (a dimensionless Peclet number) as wellas a ratio of the mechanical dispersion to the moleculardiffusion. The study concludes with a discussion of the relativeinfluences of advection, mechanical dispersion, and mo-lecular diffusion processes on PCB mass transfer within thesediment bed.
Materials and MethodsSite Description. The test site is a shallow tidal mudflat inSouth Basin adjacent to Hunters Point Shipyard, SanFrancisco, CA (Supporting Information (SI) Figure S1) withwater depth ranging from 1.8 m to less than 0.6 m (28). Thissite is rarely exposed at low tide, emerging only during thelowest stages of the lower low water events of this mixedsemidiurnal tidal system. Historical site activities at theshipyard resulted in the release of chemicals to the environ-ment, including offshore sediments (29). There exist no visiblesurface water channels on the test sites. A sheet pile wall andrip-rap exist along the shoreline to prevent possible con-tamination from the upland. The combined results ofSedflume experiments (30) with site sediment and compre-hensive hydrodynamic modeling studies (28) indicate thatthe South Basin area is a net depositional zone. The sitecomprises cohesive sediments not subject to exceedingsediment critical shear stress in most storm events (30). Thetop 10 cm of the sediment in the demonstration area comprisesmall gravel, shell, and clay particles. Underneath this toplayer is a more homogeneous layer of clay, characteristic ofbay mud. The sediment has a midrange PCB concentrationof 1-10 ppm (29). Because PCBs tend to adsorb to fine-grained sediment particles and organic matter, sedimentresuspension and deposition are major contaminant trans-port pathways in South Basin. The net sediment depositionrate is about 1 cm per year or less (30).
We utilized two of four test plots that were assessed in theprevious field-scale AC application project (11), identified asPlots D and E (SI, Figure S1(C)). The two plots were separatedby a distance of 4 m and were located approximately 25 mfrom the shoreline, within the tidal mudflat region. In PlotD, about 2 wt % of activated carbon(AC) was mechanicallymixed down to a nominal 30 cm depth in January 2006,whereas Plot E served as an unmixed reference plot. Detaileddescriptions of the test site, test plots, and AC introductionare given by Cho et al. (11).
Vertical Sediment Temperature Profile. Vertical sedi-ment temperature profiles were measured for 14 days in mid-
August 2007 and early March 2008. The sampling methodwas similar to the method described by Cho et al. (23). Ateach sampling time, two temperature logging stations wereinstalled at the center of each plot, separated by ap-proximately 0.6 m. After 14 days of data logging, the stationswere retrieved and data downloaded. Each temperaturelogging station had eight temperature loggers (iBCod Type22 L, Alpha Mach Inc.). These were situated at two levelsabove (15 cm, 2.5 cm) and at six levels below (2.5 cm, 5 cm,15 cm, 30 cm, 45 cm, and 60 cm) the sediment surface. Thetemperature loggers had a resolution of 0.0625 °C with aprecision of 0.5 °C (manufacturer-provided specifications(31)). The method is described more in detail in the SI.
During temperature sampling periods, incoming short-wave solar radiation was measured by a solar radiation sensor(Solar Radiation Sensor and Micro Station Data Logger, OnsetComputer Corporation) that was installed at the shore. Weused the tide predictions by the National Oceanic andAtmospheric Administration (NOAA) as sea level data, whichwas corrected to use the surface elevation of the test plots(0.5 m above mean sea level) as the new datum (32).
Heat Transport Model. We developed a heat transportmodel to assess the extent of heat transport by advectiveporewater movement in the saturated mudflat. The derivationand implementation of the heat transport equations followedthe method developed for the commercial numerical simu-lation program SHEMAT for reactive groundwater flow (33).Assuming no heat sinks or sources in the sediment layer, thechange in volumetric heat storage is equal to the sum of heattransport by diffusion and advection. For one-dimensionalheat flow in the vertical direction (z),
where Fb is the bulk density of the system (kgm-3), cb is thebulk specific heat capacity (Jkg-1K-1), T is the temperature(K), t is the time (s), kb is the bulk thermal conductivity(Wm-1K-1), Fw is the water density (kgm-3), cw is the waterspecific heat capacity (Jkg-1K-1), and v is the Darcy velocity(ms-1). We assumed a constant Darcy velocity independentof depth during model simulation time periods. We usedlinear combinations of solid and water contributions weightedby the porosity φ to estimate the bulk heat capacity (33). Forestimation of bulk sediment thermal conductivity, thegeometric mean model was used (34, 35). Assuming constantmaterial properties during the time interval and spatialhomogeneity,
where Fs is the solid density (kgm-3), cs is the solid specificheat capacity (Jkg-1K-1), ks is the solid thermal conductivity(Wm-1K-1), and kw is the water thermal conductivity(Wm-1K-1).
Additionally, the consideration of mechanical dispersionwill modify eq 2 as,
where Ddisp is the mechanical dispersion coefficient (m2s-1).Equation 3 was discretized forward in time and centrally inspace for numerical simulation. The discretization methodsand equations are shown in the SI. Model parameters wereobtained experimentally or from the literature (SI Table S1).
Solid thermal conductivity was determined by ex-situmeasurements (2.27 ( 0.27 Wm-1K-1 (36)). The initialtemperature conditions for each simulation were from themeasured data. The upper-boundary condition for simula-tions was the measured temperature at 2.5 cm depth. As thelower boundary condition at 60 cm, we assumed a constanttemperature.
For model calibration, two simulation scenarios wereconsidered and the best-fit parameter was determined bythe least root mean squared error (RMSE) between thesimulation results and field measurements. First, we testedthe limiting case that heat transport could be explained byheat diffusion and advection without mechanical dispersion.By neglecting the mechanical dispersion term we tried tomaximize the directional advective flow. The equation forthis scenario was,
The second limiting-case scenario assumed no advectionbut nonzero mechanical dispersion. This assumption wasintended to consider a plausible case of a mud flat with verysmall net advection but with considerable mechanicaldispersion. Although advective flow and mechanical disper-sion occur concurrently in real systems, these two hypo-thetical model scenarios bracket the limits of advection anddispersion rates, consistent with our primary objective toexplore the significance of fluid advection and dispersion inthe sediments of the field site. We therefore assumed thatthe contribution of the dispersion term is negligible whenfitting the maximum plausible vertical advective flow velocityin the first scenario and vice versa in the second scenario:
There is a limit to the minimum Darcy velocity andmechanical dispersion coefficient that can be reliably derivedfrom temperature measurements and heat transport model-ing. The minimum extractable parameter can be defined bythe ratio of the relative weight of each process with a certaintolerance level. In this study, we selected a relative toleranceof 1%, which was large enough to give an apparent change
in model simulation data plots. Therefore, the detection limitfor the dispersion coefficient would be,
The detection limit of Darcy velocity was indirectly calculatedusing the minimum detectable dispersion coefficient. Asdispersivity in a system is generally assumed as 10% of thelength of the system (i.e., the measured temperature profile,60 cm) (37), the minimum detectable Darcy velocity wouldbe 0.7 cm/d. These detection limits were also useful todetermine minimum simulation steps of mechanical disper-sion coefficient and Darcy velocity, where 1 × 10⁻⁸ m2/s and1 cm/d were selected respectively.
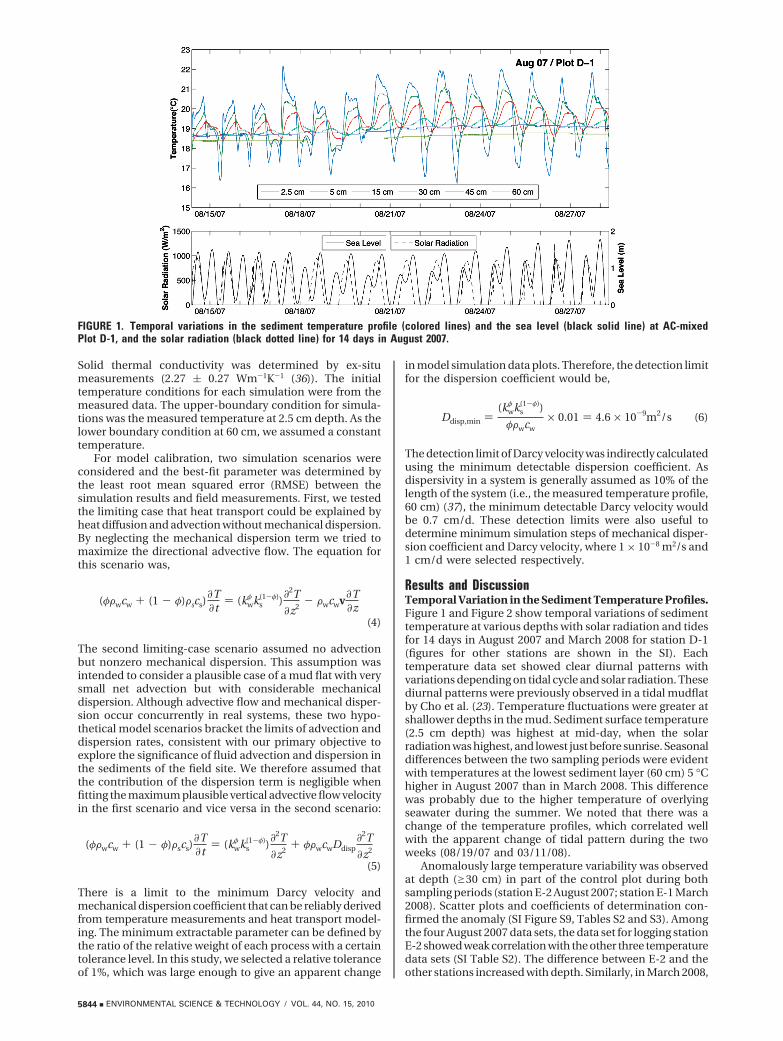
Results and DiscussionTemporal Variation in the Sediment Temperature Profiles.Figure 1 and Figure 2 show temporal variations of sedimenttemperature at various depths with solar radiation and tidesfor 14 days in August 2007 and March 2008 for station D-1(figures for other stations are shown in the SI). Eachtemperature data set showed clear diurnal patterns withvariations depending on tidal cycle and solar radiation. Thesediurnal patterns were previously observed in a tidal mudflatby Cho et al. (23). Temperature fluctuations were greater atshallower depths in the mud. Sediment surface temperature(2.5 cm depth) was highest at mid-day, when the solarradiation was highest, and lowest just before sunrise. Seasonaldifferences between the two sampling periods were evidentwith temperatures at the lowest sediment layer (60 cm) 5 °Chigher in August 2007 than in March 2008. This differencewas probably due to the higher temperature of overlyingseawater during the summer. We noted that there was achange of the temperature profiles, which correlated wellwith the apparent change of tidal pattern during the twoweeks (08/19/07 and 03/11/08).
Anomalously large temperature variability was observedat depth (g30 cm) in part of the control plot during bothsampling periods (station E-2 August 2007; station E-1 March2008). Scatter plots and coefficients of determination con-firmed the anomaly (SI Figure S9, Tables S2 and S3). Amongthe four August 2007 data sets, the data set for logging stationE-2 showed weak correlation with the other three temperaturedata sets (SI Table S2). The difference between E-2 and theother stations increased with depth. Similarly, in March 2008,
FIGURE 1. Temporal variations in the sediment temperature profile (colored lines) and the sea level (black solid line) at AC-mixedPlot D-1, and the solar radiation (black dotted line) for 14 days in August 2007.
the data from logging station E-1 showed anomalous behaviorcompared to the other three temperature data sets (SI TableS3, Figure S9). The shape of these temperature profilessuggests a degree of thermal homogenization by macroporemixing around the loggers. It is possible that the seal betweenthe instruments and surrounding sediments was compro-mised, permitting tidal flow and convective mixing withinthe profiles, but the confinement of this phenomenon to theundisturbed control plot suggests that the macropores maybe of natural origin due to bioturbation or buried debris.Therefore, in the following section, we conservatively with-held a conclusion from the model simulation results for PlotE, only showing them for reference in Table 1.
Heat Transport Model. The sediment temperature pro-files were simulated with either nonzero Darcy velocities(scenario one) or nonzero mechanical dispersion coefficients(scenario two) during four days (day 2 to day 6) of the firstweek of sampling and four days (day 8 to day 12) of thesecond week of sampling in August 2007 and March 2008(Table 1). The best-fit parameters were separately assessed
in each week to consider apparent changes in temperatureprofile pattern and the tidal pattern during the samplingperiod (Figure 1 and Figure 2).
Simulated temperature profiles with heat diffusion as theonly transport process yielded RMSEs between the field dataand the simulations much less than the precision of theloggers (0.5 °C) and close to the resolution (0.0625 °C) formost cases. For example, the simulation results for the firstweek of the March 2008 period at D-1 show that heat diffusionalone could explain the temperature fluctuation throughoutthe sediment profile with an RMSE value of 0.124 (Figure3A).
Although heat transport by diffusion alone could largelyaccount for the measured temperature fluctuations, stilldiscrepancies remained. In most cases, the addition of anadvection term enhanced the model fit. For the simulationresults of week 1 of March 2008 at D-1, the least RMSE (0.044)was obtained by including a downward 8 cm/d Darcy velocity,resulting in less than one-half of the RMSE without theadvection term (Figure 3B). For sorbent amended sediment
FIGURE 2. Temporal variations in the sediment temperature profile (colored lines) and the sea level (black solid line) at AC-mixedPlot D-1, and the solar radiation (black dotted line) for 14 days in March 2008.
TABLE 1. Heat Transport Model Simulation Summary Considering Diffusion Only or Addition of an Advection or Dispersion Terma
a Best-fit models are presented for Darcy velocity (v), the dispersion coefficient (Ddisp), and root mean squared error(RMSE). b Below tolerance criterion (0.7 cm/d).
(Plot D), the best fit Darcy velocity ranged from 0 to 8 cm/d,and the reduction in RMSE compared to the diffusion-onlysimulations ranged from 0% to 65%. Possible mechanismsfor the downward movement are density-driven convection(13) or a repetitive pressure head fluctuation coupled withpressure relief at a location not affected by tides (38).
It is also plausible that the saturated mudflat sedimentmay have no net fluid movement in the vertical direction.Instead, the sediments may experience oscillating flow dueto tidal pumping (38), so a mechanical dispersion term wasexamined to assess whether the model fit could be enhancedby consideration of nondirectional advective movement. Asshown in Table 1, the use of mechanical dispersion in alimiting case with zero advection also enhanced the modelfit compared to simulations with diffusion only, with aplausible range of dispersion coefficients from 0.9 × 10⁻⁷
m2/s to 5.6 × 10⁻⁷ m2/s for sorbent-amended plot D. Theenhancement in RMSEs compared to the diffusion-only casesranged from 15% to 46%. An average dispersion coefficientfor the mixed sediment plot D was 2.2 × 10⁻⁷ m2/s.
In summary, heat transport in the intertidal mudflat wasexplained largely by heat diffusion, while advective porewatermovement or mechanical dispersion further improved thematch of predicted and measured temperature profiles. Thebest-fit Darcy velocity and mechanical dispersion coefficientfor the AC mixed plot were 3.8 ( 2.5 cm/d and 2.2 × 10⁻⁷
( 1.7 × 10⁻⁷ m2/s, respectively (mean ( one standarddeviation).
Relative Importance of Advection and MechanicalDispersion for PCB Mass Transfer. To compare the relativecontribution of advection and molecular diffusion to PCBmass transfer within the sediment layer, the dimensionlessPeclet number (Pe ) (Lu)/(D)) was evaluated, where L is thecharacteristic length (m), u is the interstitial velocity ((Darcyvelocity)/(porosity), m/s), and D is a nominal diffusioncoefficient for PCBs (5 × 10⁻¹⁰ m2/s). Although PCB masstransfer would be retarded in the presence of sorbents by
sorption, it would not affect the ratio because both transferprocesses would be slowed equally. An average Darcy velocityof v ) 3.8 cm/d and a porosity of 0.57 gave an averageinterstitial velocity of u ) 6.7 cm/d.
The calculation of a Peclet number is sensitive to thecharacteristic length estimate. In this study, the characteristiclength was defined as the interparticle distance betweensediment particles and closest activated carbon (AC) particleconsidering the process of PCB stabilization by AC. Then,the characteristic length would greatly depend on the ACdistribution with a fixed AC dose. If the AC distribution is nothomogeneous, then the characteristic length for mass transfertends to increase.
First, we assessed an ideal case: a uniform distribution ofAC particles. Assuming 3 wt % of AC addition, the charac-teristic length was estimated as L ) 240 µm (see SI). Theresulting Peclet number is Pe ) 0.37, indicating that the PCBdiffusion process contributes more than directional advectivePCB transport to the sequestration of PCBs by AC, althoughinterstitial flow should not be ignored. The opposite extremecase would be an absence of AC-sediment mixing, where ACparticles are placed on the sediment surface just like a thincap. Then the characteristic length would be the entire targetsediment layer thickness or the bioactive zone thickness(10-15 cm), which would give a Peclet number larger than100. In an actual AC amendment application, the charac-teristic length would be in between these two extreme cases(probably a few mm to a few cm) indicating a significantcontribution by advective flow (Pe ) 1-10).
PCB mass transport may also be partially controlled bymechanical dispersion, which is driven by differential ad-vective porewater movement. In this study, the averagedispersion:diffusion coefficient ratio was on the order of400:1, which suggests that mechanical dispersion mayaccelerate PCB mass transport within the sediment bed. Ina homogeneously distributed AC-sediment system, the roleof mechanical dispersion would not be important because
FIGURE 3. Simulation results for day 2 to day 6 (week 1) in March 2008 at Plot D-1. A) Heat diffusion only. (B) Diffusion andadvection. Measurements (dotted line) and simulation results (solid line). The x-axes and y-axes represent day and temperature (°C),respectively.
the characteristic length is at the pore size scale. However,in the case of heterogeneous AC distribution, mechanicaldispersion can smooth out the heterogeneity and benefitthe treatment by AC within the sediment layer by homog-enizing pollutant concentrations across the entire bioactivezone.
Our heat transport simulation results showed that ad-vective flow as well as mechanical dispersion may varytemporally and spatially. The plausible interstitial flow ratewas up to u ) 14 cm/d (for Plot D, where Darcy velocity is8 cm/d), implying that PCB transport by advective porewaterflow could be more substantial at certain field conditions.The dispersion/diffusion ratio might also range from severalhundreds to thousands.
In brief, the advective flow and mechanical dispersionquantified in our test site would benefit the heterogeneousAC-sediment system by promoting PCB mass transfer fromremote sediment particles to AC particles.
Significance. In this study, we investigated the relativesignificance of molecular diffusion, directional advective flow,and mechanical dispersion for mass transfer of a PCB, atypical example of hydrophobic organic compounds (HOCs)in sediment. While the information may be useful to assessgeneral HOC transport and fate, it is especially useful topredict the long-term benefit of in situ treatment processessuch as sequestration by activated carbon (AC) sorbent withinthe sediment bed. The existence of advective flow andmechanical dispersion would accelerate the remedial actionby AC, shorten the monitoring period, and further increasepublic acceptance of the remediation option. Heat transportmodeling is a convenient and applicable indirect method toexamine such flow and dispersion for shallow mudflat ormarsh-like sediments. It should be noted that this methodhas certain detection limits for Darcy velocities and dispersioncoefficients. Heat diffusion is faster than molecular diffusionfor HOCs in many cases, so the model may be unable toextract values from a system with small, but still-significant,advective flow or mechanical dispersion properties underthe detection limits. However, these caveats did not severelyaffect the utility of the method in this study, since thesimulation results showed significantly higher values of Darcyvelocity (3.8 cm/d) and mechanical dispersion (2.2 × 10⁻⁷
m2/s) than the estimated detection limits (0.7 cm/d and 4.6× 10⁻⁹ m2/s). We expect this modeling framework andsimulation results could enable more reliable assessmentsof the fate and movement of HOCs within the sediment bedand thus benefit the prediction of the performance of in situsediment amendments.
AcknowledgmentsThis project was supported by the Department of DefenseEnvironmental Security Technology Certification Program(ESTCP), project ER-0510, and the Strategic EnvironmentalResearch and Development Program (SERDP), project ER-1552. Y.-M.C. was supported by a Stanford GraduateFellowship. K.M. was supported by National ScienceFoundation grant EAR-0634709. Collaboration with New-castle University was facilitated by the Leverhulme Trust,grant FOO 125/AA. We thank Keith Forman (U.S. Navy,NAVFAC Southwest Division, San Diego, CA) and DaneJensen (U.S. Navy, NAVFAC Southwest Division, SanDiego, CA, Remedial Project Manager for Hunters PointParcel F), and Leslie Lundgren (Tetra Tech EM, Inc., SanFrancisco, CA) for their assistance and support in thestudy.
Supporting Information AvailableModel discretization of the heat transport model, modelparameters, temperature measurement method, additionaltemperature profiles, coefficients of determination among
the four temperature profiles, and estimation of characteristiclength. This material is available free of charge via the Internetat http://pubs.acs.org. Also, raw sediment temperature profiledata, tide prediction data, and solar radiation data are freelyavailable from the authors.
Literature Cited(1) Ghosh, U.; Zimmerman, J. R.; Luthy, R. G. PCB and PAH
speciation among particle types in contaminated harborsediments and effects on PAH bioavailability. Environ. Sci.Technol. 2003, 37, 2209–2217.
(2) Ghosh, U.; Gillette, J. S.; Luthy, R. G.; Zare, R. N. Microscalelocation, characterization, and association of polycyclic aromatichydrocarbons on harbor sediment particles. Environ. Sci.Technol. 2000, 34, 1729–1736.
(3) Zimmerman, J. R.; Ghosh, U.; Millward, R. N.; Bridges, T. S.;Luthy, R. G. Addition of carbon sorbents to reduce PCB andPAH bioavailability in marine sediments: Physicochemical tests.Environ. Sci. Technol. 2004, 38, 5458–5464.
(4) Zimmerman, J. R.; Werner, D.; Ghosh, U.; Millward, R. N.;Bridges, T. S.; Luthy, R. G. Effects of dose and particle size onactivated carbon treatment to sequester polychlorinated bi-phenyls and polycyclic aromatic hydrocarbons in marinesediments. Environ. Sci. Technol. 2005, 24, 1594.
(5) McLeod, P. B.; Van den Heuvel-Greve, M. J.; Allen-King, R. M.;Luoma, S. N.; Luthy, R. G. Effects of particulate carbonaceousmatter on the bioavailability of benzo[a]pyrene and 2,2′,5,5′-tetrachlorobiphenyl to the clam, Macoma balthica. Environ.Sci. Technol. 2004, 38, 4549–4556.
(6) McLeod, P. B.; Van den Heuvel-Greve, M. J.; Luoma, S. N.; Luthy,R. G. Biological uptake of polychlorinated biphenyls by Macomabalthica from sediment amended with activated carbon. En-viron. Toxicol. Chem. 2007, 26, 980–987.
(7) McLeod, P. B.; Luoma, S. N.; Luthy, R. G. Biodynamic modelingof PCB uptake by Macoma balthica and Corbicula flumineafrom sediment amended with activated carbon. Environ. Sci.Technol. 2008, 42, 484–490.
(8) Millward, R. N.; Bridges, T. S.; Ghosh, U.; Zimmerman, J. R.;Luthy, R. G. Addition of activated carbon to sediments to reducePCB bioaccumulation by a polychaete (Neanthes arenaceoden-tata) and an amphipod (Leptocheirus plumulosus). Environ.Sci. Technol. 2005, 39, 2880–2887.
(9) Tomaszewski, J. E.; McLeod, P. B.; Luthy, R. G. Measuring andmodeling reduction of DDT availability to the water columnand mussels following carbon amendment of contaminatedsediment. Water Res. 2008, 42, 4348–4356.
(10) Cho, Y.-M.; Smithenry, D. W.; Ghosh, U.; Kennedy, A. J.; Millward,R. N.; Bridges, T. S.; Luthy, R. G. Field methods for amendingmarine sediment with activated carbon and assessing treatmenteffectiveness. Mar. Environ. Res. 2007, 64, 541–555.
(11) Cho, Y.-M.; Ghosh, U.; Kennedy, A. J.; Grossman, A.; Ray, G.;Tomaszewski, J. E.; Smithenry, D. W.; Bridges, T. S.; Luthy, R. G.Field application of activated carbon amendment for in-situstabilization of polychlorinated biphenyls in marine sediment.Environ. Sci. Technol. 2009, 43, 3815–3823.
(12) Werner, D.; Ghosh, U.; Luthy, R. G. Modeling polychlorinatedbiphenyl mass transfer after amendment of contaminatedsediment with activated carbon. Environ. Sci. Technol. 2006,40, 4211–4218.
(13) Rocha, C. Density-driven convection during flooding of warm,permeable intertidal sediments: The ecological importance ofthe convective turnover pump. J. Sea Res. 2000, 43, 1–14.
(14) Putnam, J. Loss of wave energy due to percolation in a permeablesea bottom. Trans. Am. Geophys. Union 1949, 30, 349–356.
(15) Huettel, M.; Ziebis, W.; Forster, S.; Luther, G. W. Advectivetransport affecting metal and nutrient distributions and inter-facial fluxes in permeable sediments. Geochim. Cosmochim.Acta 1998, 62, 612–631.
(16) Webb, J.; Theodor, J. Irrigation of submerged marine sandsthrough wave action. Nature 1969, 220, 682–683.
(17) Precht, E.; Huettel, M. Rapid wave-driven advective pore waterexchange in a permeable coastal sediment. J. Sea Res. 2004, 51,93–107.
(18) Tengberg, A.; Almroth, E.; Hall, P. Resuspension and its effectson organic carbon recycling and nutrient exchange in coastalsediments: In situ measurements using new experimentaltechnology. J. Exp. Mar. Biol. Ecol. 2003, 285-286, 119–142.
(19) Carpenter, K. In Biogeochemistry of Intertidal Sediments. ACritical Appraisal of the Methodology Used in Studies of Material
Flux between Saltmarshes and Coastal Waters, Chapter 4,Cambridge Environmental Chemistry Series 9; Jickells, T. D.;Rae, J. E., Eds.; Cambridge University Press: Cambridge, 1997;pp 59-84.
(20) Anderson, M. P. Heat as a groundwater tracer. Ground Water2005, 43, 951–968.
(21) Constantz, J. Heat as a tracer to determine streambed waterexchanges. Water Resour. Res. 2008, 44, W00D10, doi: 10.1029/2008WR006996.
(23) Cho, Y.-K.; Kim, T.-W.; You, K.-W.; Park, L.-H.; Moon, H.-T.;Lee, S.-H.; Youn, Y.-H. Temporal and spatial variabilities in thesediment temperature on the Baeksu tidal flat, Korea. Estuarine,Coastal Shelf Sci. 2005, 65, 302–308.
(24) Moffett, K. B.; Tyler, S. W.; Torgersen, T.; Menon, M.; Selker,J. S.; Gorelick, S. M. Processes controlling the thermal regimeof saltmarsh channel beds. Environ. Sci. Technol. 2008, 42, 671–676.
(25) Silliman, S. E.; Ramirez, J.; McCabe, R. L. Quantifying downflowthrough creek sediments using temperature time series: one-dimensional solution incorporating measured surface temper-ature. J. Hydrol. 1995, 167, 99–119.
(26) Constantz, J.; Thomas, C. L. Stream bed temperature profilesas indicators of percolation characterics beneath arroyos in thethe Middle Rio Grande Basin, USA. Hydrol. Processes 1997, 11,1621–1634.
(27) Harrison, S. J.; Phizacklea, A. P. Vertical temperature gradientsin muddy intertidal sediments in the Forth Estuary, Scotland.Limnol. Oceanogr. 1987, 32, 954–963.
(28) Brajas & Associates Inc.; Tetra Tech EM Inc., B. Final FeasibilityStudy Report for Parcel F Hunters Point Shipyard San Francisco,California, Final Report; Base Realignment and Closure ProgramManagement Office: West San Diego, CA, 2008.
(29) Battelle; Entrix; Neptune & Co., Hunters Point Shipyard ParcelF Validation Study Report San Francisco Bay, Draft Final; U.S.Navy Southwest Division NAVFAC: CA, 2004.
(30) Zimmerman, J. R.; Bricker, J. D.; Jones, C.; Dacunto, P. J.; Street,R. L.; Luthy, R. G. The stability of marine sediments at a tidalbasin in San Francisco Bay amended with activated carbon forsequestration of organic contaminants. Water Res. 2008, 42,4133–4145.
(32) Tide Predictions for Hunters Point, Station ID: 9414358; NOAA:San Francisco Bay, CA, http://tidesandcurrents.noaa.gov/.
(33) Numerical Simulation of Reactive Flow in Hot Aquifers:SHEMAT and Processing SHEMAT; Clauser, C.; Ed.; Springer:Berlin, 2003.
(34) Woodside, W.; Messmer, J. H. Thermal conductivity of porousmedia. I. unconsolidated sands. J. Appl. Phys. 1961, 32, 1688–1699.
(35) Goto, S.; Matshbayashi, O. Relations between the thermalproperties and porosity of sediments in the eastern flank of theJuan de Fuca Ridge. Earth Planets Space 2009, 61, 863–870.
(36) Maeba, D. G. P. Improved models of sediment remediationwith activated carbon: Deriving sediment porewater velocitiesfrom temperature measurements, Master’s thesis, NewcastleUniversity, School of Civil Engineering & Geosciences, 2009.
(37) ASCE Environmental Engineering Division Committee onGround Water Quality. Quality of Ground Water: Guidelines forSelection and Application of Frequently Used Models; AmericanSociety of Civil Engineers: Reston, VA, 1996.
(38) Moore, W. S.; Wilson, A. M. Advective flow through the uppercontinental shelf driven by stroms, buoyancy, and submarinegroundwater discharge. Earth Planet. Sci. Lett. 2005, 235,564–576.


![Why Do They Do It?–A Brief Inquiry into the Real Motives ... · PDF filemovement [because] their culture, ... recording, translating and textualizing Aboriginal narratives for the](https://static.documents.pub/doc/80x56/5aa707e37f8b9a6d5a8bc7f0/why-do-they-do-ita-brief-inquiry-into-the-real-motives-because-their-culture.jpg)


