i PG&E’s Emerging Technologies Program Assessment of an Energy Information System for the Grocery Sector ET Project Number: ET10PGE1031 Project Manager: Aaron Berndt Pacific Gas and Electric Company Prepared By: James Russell, Sonya Salanti and Jeff Mitchell PECI 100 SW Main Portland, OR 97204 Issued: Sept 19, 2011 Copyright, 2012, Pacific Gas and Electric Company. All rights reserved.
Transcript
i
PG&E’s Emerging Technologies Program
Assessment of an Energy Information System for the Grocery Sector ET Project Number: ET10PGE1031
Project Manager: Aaron Berndt Pacific Gas and Electric Company Prepared By: James Russell, Sonya Salanti and Jeff Mitchell PECI 100 SW Main Portland, OR 97204
Issued: Sept 19, 2011
Copyright, 2012, Pacific Gas and Electric Company. All rights reserved.
1. ii
PG&E’s Emerging Technologies Program
ACKNOWLEDGEMENTS Pacific Gas and Electric Company’s Emerging Technologies Program is responsible for this project. It was developed under internal project number ET10PGE1031. PECI conducted this technology evaluation for Pacific Gas and Electric Company with overall guidance and management from Aaron Berndt. For more information on this project, contact [email protected].
LEGAL NOTICE This report was prepared for Pacific Gas and Electric Company for use by its employees and agents. Neither Pacific Gas and Electric Company nor any of its employees and agents:
(1) makes any written or oral warranty, expressed or implied, including, but not limited to those concerning merchantability or fitness for a particular purpose;
(2) assumes any legal liability or responsibility for the accuracy, completeness, or usefulness of any information, apparatus, product, process, method, or policy contained herein; or
(3) represents that its use would not infringe any privately owned rights, including, but not limited to, patents, trademarks, or copyrights.
3.1 Research Questions ..................................................... 8
4 TECHNOLOGY EVALUATION 9
5 TECHNICAL APPROACH 9
5.1 Site Selection ............................................................ 10
5.2 Setup and Integration ................................................ 11
5.2.1 Whole Building Energy Metering ............................. 13 5.2.2 System-level Energy Submetering .......................... 13 5.2.3 System-level Operational Data ............................... 13
8.1 Potential for Grocery Sector Adoption ........................... 34
8.2 Assessment of Other Sectors and Approaches ............... 35
APPENDIX A – PROCEDURES FOR DATA INTEGRATION 36
REFERENCES 38
1
PG&E’s Emerging Technologies Program
EXECUTIVE SUMMARY Under contract with Pacific Gas and Electric’s (PG&E) Emerging Technology (ET) program, PECI performed a technical assessment of an Energy Information System software (EIS Software). The EIS Software provides a suite of web-based applications that are designed to track and manage energy usage and greenhouse gas emissions. The assessment was limited to the use of the EIS Software as an aid to energy efficiency and demand response in the grocery sector.
PROJECT GOAL This assessment focused on two applications of the EIS Software: one that provides tools for energy monitoring and analysis across multiple buildings, and a second that offers tools to define, analyze and prioritize individual projects. The EIS Software’s applications operate on a foundation of customer resource consumption data. In this assessment, we provided a robust foundation that included “behind the meter” system-level data.
The primary goal of this project was to understand how the EIS Software could be used to improve energy efficiency and demand response in the grocery sector. Put simply, we set out to test whether the EIS Software, using system-level data, would allow a grocery business to undertake more energy efficiency projects by aiding the identification of energy conservation measures and by facilitating decision making.
PROJECT DESCRIPTION PECI enlisted a supermarket chain with an interest in innovative energy management solutions as a partner in this study. Upfront, we judged that the difficulty of integrating system-level data would vary with store vintage. Thus two stores, one older and one newer, were used as test sites. PECI evaluated the software installation process at both stores, characterized the experience of user adoption, and tested the software’s capabilities for identifying project opportunities and supporting implementation of those projects. Those capabilities were then demonstrated to the supermarket customer, whose feedback was recorded and summarized.
To understand the potential for adoption in the grocery sector, we weighed the benefits for project identification and implementation against the costs of installation and challenges of user adoption. The comparison of benefits and costs is qualitative. This assessment provided a quantitative understanding of costs, which are largely incurred upfront. But a quantitative accounting of benefits wasn’t possible within the limited scope of this project.
PROJECT FINDINGS Benefits of the EIS Software
The EIS Software, with system-level data, has multiple applications that could aid energy management in the grocery sector. Key benefits of the software include 1) data visualization to aid identification of energy saving measures, verification of savings and persistence; 2) benchmarking to easily track and compare store performance over time; and 3) project planning features to prioritize and track project opportunities. For the purposes of measure
2
PG&E’s Emerging Technologies Program
identification, the software’s benefits are greatest if both system-level energy data (e.g., energy demand) and system-level operational data (e.g., temperature) are available in the software.
Costs and Challenges to Adoption
The study found that deployment of the software with system-level energy data will often require installation of submetering and automated communications architecture. Moreover, the operational data is collected by existing control systems, which are difficult to integrate. As a result, installation and integration with system-level data presents a high upfront cost.
The software was easy to learn, and the main challenge to adoption is allocating resources to ensure that it is used. Both PECI and the supermarket customer noted that the benefits of the software would only be achieved if a user dedicated time to actively analyze data and produce reports and recommendations. Where adoption of this software displaces other benchmarking or analysis tools, then the net change in staff time may be small or even negative. But for grocery customers without an active energy management program, allocating those resources poses a challenge to adoption.
PROJECT RECOMMENDATIONS Overall, this technology assessment found that implementation of the EIS Software with system-level data in the grocery sector currently has limited potential. Though the software has useful features and was easy to use, the potential energy saving benefits are only weakly tied to the software. A skilled analyst, project planning and investment are additional ingredients required to deliver energy saving projects. The high upfront costs and difficult to quantify benefits would present a significant challenge to the cost-effectiveness of a program utilizing this approach for the grocery sector.
Given the high cost of installing system-level metering and the current challenges of demonstrating cost-effectiveness, only small scale deployment of this particular EIS Software solution appears feasible in the near term. This deployment would focus on stores where energy submetering is already installed. The suggested features of a small scale program to deploy the EIS Software with system-level data are show in Table 1.
TABLE 1. SUGGESTED FEATURES OF A SMALL SCALE PROGRAM
Target Market Stores with existing web-connected submetering
Software configuration Whole building and submeter energy data is tied to the EIS Software. If operational data is available in web-enabled controls, it is also integrated into the Software. Whole building and system-level performance metrics are created.
Benefits of the Software A consultant uses the Software and limited site investigations to identify and analyze energy efficiency projects. The projects are compiled in the project viewer for supermarket managers to view and select.
Incentives The utility pays initial fees for implementation of the EIS Software and consulting fees for project identification. The supermarket is then obligated to undertake all projects that meet certain financial criteria. Ongoing software licensing and maintenance fees are paid by the supermarket if they choose to continue using the service.
In the long term, as system-level metering becomes more common and more evidence of the long-term benefits of EIS software is gathered, large scale deployment may be possible. In the meantime, a lighter solution, using only the building-level meter data, could be broadly deployed to achieve a subset of the benefits observed in this technology evaluation.
3
PG&E’s Emerging Technologies Program
The suggested features of a large scale program to deploy the EIS Software with building-level data are shown in Table 2.
TABLE 2. SUGGESTED FEATURES OF A LARGE SCALE PROGRAM
Target Market Grocery store chains
Software configuration Whole building interval meter data is tied to the EIS Software and metrics of whole building performance are created.
Benefits of the Software Supermarket managers are able to monitor and compare the performance of stores using the EIS Software dashboard.
Incentives The utility pays the software provider to create a standard design for the grocery sector. This service is then available to supermarkets at the cost of the EIS Software licensing. The EIS Software is used to channel stores to existing programs and incentives.
This assessment did reveal many ways this type of energy information technology could support energy efficiency projects and programs. We recommend further technology assessment that uses an EIS with building-level energy data to aid audits and retrocommissioning (RCx) investigations in a portfolio of buildings. Such an assessment could generate data on the marginal costs and benefits of an EIS by tracking two cohorts, one with software and one without. Or, more simply, the cost-effectiveness of the entire approach could be estimated by piloting the approach through the complete cycle of measure implementation, measurement and verification.
Finally, this assessment did not compare this particular EIS Software against other software that might play the same or a similar role in energy efficiency and demand response programs. Given the multitude of software packages, we recommend a critical comparison of software features and pricing before committing a program to any one software package.
4
PG&E’s Emerging Technologies Program
1 INTRODUCTION Information about energy use is widely regarded as a prerequisite for decision makers to invest in energy efficiency. If a consumer does not know how much energy he/she uses or how much less would be used after investing in efficiency, then it would be difficult to identify and justify such an investment. Stated in economic terms, inadequate information about energy efficiency opportunities prevents consumers from selecting the level of energy consumption that will maximize their welfare. This represents a market failure and an area where a public policy response could improve the overall social welfare.1
The State of California has recognized and taken steps to correct this market failure. For example, the California Public Utilities Commission authorized PG&E to invest in advanced metering, in part because providing utility customers with near real time energy information is expected to facilitate customers’ decisions to reduce energy use.2 Recently, California utilities have successfully made customers’ interval meter data available to them through the Green Button initiative.3
Despite these steps toward better access to energy information, the mechanism by which that information will lead to energy savings remains poorly defined. This is partly because the mechanism will vary by customer group. For example, a residential customer may be motivated to act when energy information and comparison to peers indicates room for improvement. With a tip on how to save energy, that customer may then reduce his thermostat setpoint and complete the path from information to energy savings. This normative approach has shown success in the residential sector.4 Individual energy users may also be moved to action by information coupled with a goal setting process.5
For business customers, the mechanism by which better information leads to energy efficiency improvement should, in theory, be more simple and uniform. When presented with an investment with a positive net present value, a firm should act. However, some evidence indicates that firms’ characteristics, such as their financial performance, influence their decisions to undertake such investments.6 And there’s also the question of how raw information is analyzed to present an investment opportunity. So again, while the need for information seems obvious, the question of how that information will be converted to action is open for speculation and seems likely to vary across customers.
Amidst this uncertainty, the energy information system (EIS) is emerging as a potentially important part of the information to energy saving mechanism. An EIS gathers energy data and presents it to the user in a graphic, often customizable, format. Some EIS have built-in modeling and decision analysis capabilities that could help users evaluate energy efficiency
1 Jaffe, Adam B. and Robert N. Stavins (1994) 2 CPUC (2009) 3 Sinai (2011) 4 Ceniceros, Bruce (2009) 5 McCalley, L.T. (2006) ; Constanzo, Mark et al (1986) 6 Decanio, Stephen J., William E. Watkins (1998)
5
PG&E’s Emerging Technologies Program
opportunities.7 Lawrence Berkeley National Lab (LBNL) has catalogued a variety of ways that an EIS could be used to facilitate energy efficiency.8
The EIS itself does not analyze the data, make the decision, or purchase and install new equipment. So, energy users, utilities and policymakers face a considerable challenge in valuing this emerging technology. The large number of vendors, who sometimes offer vague information about the software’s capabilities, further complicates the valuation.9 This assessment focuses on one software package, one market sector, and one approach to using an EIS for energy efficiency. With this focused evaluation, we set out to reduce the uncertainty in a particular area, knowing that further efforts will be required to explore alternative EIS uses.
2 BACKGROUND The landscape of hardware and software relating to the management of facility energy use can be confusing. What one vendor calls an energy management system (EMS) another may call an EIS. Terms are not used consistently and systems are continuously evolving to provide new features. In this assessment, we examine an EIS, based on the following definition:
…performance monitoring software, data acquisition hardware, and communication systems used to store, analyze, and display building energy data.10
With this definition, there are three important components to the EIS. First, hardware located at the field site gathers data. Second, communication systems collect that data and transmit it to a single repository. Third, the software displays the data to a user and provides tools for analysis.
There is no mechanism in the EIS for directly controlling energy use. This is different from a building automation system (BAS), which may be present in many commercial buildings and has the primary function of monitoring and controlling the operation of building systems.11 With the EIS, any action to reduce energy use must take place outside the EIS.
2.1 THE EIS SOFTWARE The EIS Software selected for this assessment provides an enterprise software solution with the intent of enabling organizations to track and manage energy and resource usage and greenhouse gas emissions and thereby reduce costs, risk and environmental impacts. The EIS Software offers a suite of web-based applications to achieve these aims.
This project focused on use of the EIS Software for energy efficiency and demand response. The EIS Software has two applications that were relevant to this focus. A monitoring 7 CCC (2011) 8 Granderson, J, Piette, MA, Rosenblum, B, Hu, L et al. (2011) 9 Granderson, Jessica, M.A. Piette, G. Ghatikar, and P. Price. (2009) 10 Granderson, J, Piette, MA, Rosenblum, B, Hu, L et al. (2011) 11 CCC (2011)
6
PG&E’s Emerging Technologies Program
application provides tools for energy monitoring, analysis, visualization and benchmarking across multiple buildings. A project viewer offers tools to define, analyze and prioritize projects. When coupled with external data acquisition hardware and communications systems, these applications provide an EIS. Additional capabilities of the EIS Software’s suite of applications, as reported by the vendor, are described in Appendix B.
The EIS Software’s applications are offered in a ‘software as a service’ model. Within the framework introduced by LBNL’s Energy Information Handbook, the applications provide many “Reporting and Tracking” capabilities and, depending on the level of data integration, some capabilities for “Fundamental Methods” that can be used to “reveal energy waste and opportunities for operational improvements.”12 In this study, we integrate system-level data (see Box 1) to support those Fundamental Methods.
The EIS Software’s applications are flexible and could be applied in a wide range of industries to displace or supplement a variety of energy tracking approaches. For example, an organization might adopt the EIS Software in place of more manual methods of displaying and analyzing data in spreadsheets or in place of free but less advanced software.13 It could also replace or complement analysis done using an existing BAS. Or, for users just beginning to track facility performance, the EIS Software may replace nothing other than a monthly, cursory inspection of the utility bill.
2.2 GROCERY SECTOR The grocery sector represents one of the most energy intensive commercial building sectors. According to California’s Commercial End-use Survey, the grocery sector uses, on average, 41 kWh of electricity per square foot each year. As a comparison, large office buildings use just 18 kWh per square foot.14 The high energy intensity of grocery stores is largely attributable to their refrigeration systems. Lighting and heating, ventilation and air conditioning (HVAC) systems, which operate for long hours, are also large energy users. As shown in Figure 1, below, refrigeration uses nearly 55% of electricity in the grocery sector, lighting uses 23% and HVAC another 14%.
12 Granderson, J, Piette, MA, Rosenblum, B, Hu, L et al. (2011) 13 The Energy Charting and Metrics (ECAM) Tool is one spreadsheet tool that can assist users interested in manual tracking (available at http://www.cacx.org/PIER/ecam/) and Energy Star Portfolio Manager is a free tool for tracking and benchmarking (available at https://www.energystar.gov/istar/pmpam/) 14 Itron (2006)
Box 1. System-level Information Energy use information is typically collected at the building level by utility meters. This building level information combines the uses of many building systems, notably refrigeration, HVAC and lighting. Once combined, it can be difficult to decipher the energy use patterns that hint at performance improvement opportunities within those systems. System-level energy information can be collected using submeters, which may strengthen project identification.
7
PG&E’s Emerging Technologies Program
FIGURE 1. ELECTRICITY END-USE BREAKDOWN FOR GROCERY SECTOR
PECI has defined a number of energy efficiency measures for reducing energy consumption in grocery stores. Not surprisingly, many of these measures focus on the refrigeration system. Some of the most common refrigeration measures for grocery stores are listed in Table 4, below, along with several common lighting and HVAC measures.
TABLE 3. COMMON ENERGY EFFICIENCY MEASURES FOR GROCERY STORES
Refrigeration Lighting HVAC
Strip curtains for walk-in coolers/freezers
Replacing overhead fluorescent lamps and ballasts with high efficiency models
Reprogramming HVAC controls
EC fan motor retrofits Lighting control upgrades Demand controlled ventilation
Floating head and suction pressure controls
Replacing fluorescent lamps in refrigerated cases with LED lamps
Controls for anti-sweat heaters
Refrigeration case replacements and upgrades
The grocery sector is diverse and there are a wide range of approaches to managing energy within the sector. Small independent grocery stores manage energy differently than regional or national supermarket chains, and newer stores tend to have more sophisticated monitoring and control systems than older stores. We addressed vintage diversity in this study by evaluating the EIS Software in one older store (more than 10 years old) and one newer store (less than 5 years old). However, both of these test stores were members of a large supermarket chain, so the results of this evaluation may be less applicable to small, independent grocers.
0.2%
7.0%6.3%
54.8%2.3%
20.9%
8.5% Heating
Cooling
Ventilation
Refrigeration
Exterior Lighing
Interior Lighting
Other
Data from Itron (2006)
8
PG&E’s Emerging Technologies Program
Some types of energy management and control technologies are already common in the grocery sector. A BAS is often used to control HVAC and lighting. Refrigeration systems are managed by controllers of varying complexity. Some stores have even adopted an EIS to aid aggregating and interpreting energy data. One purpose of this assessment was to identify where the EIS Software might fit in this landscape of hardware and software serving the grocery sector.
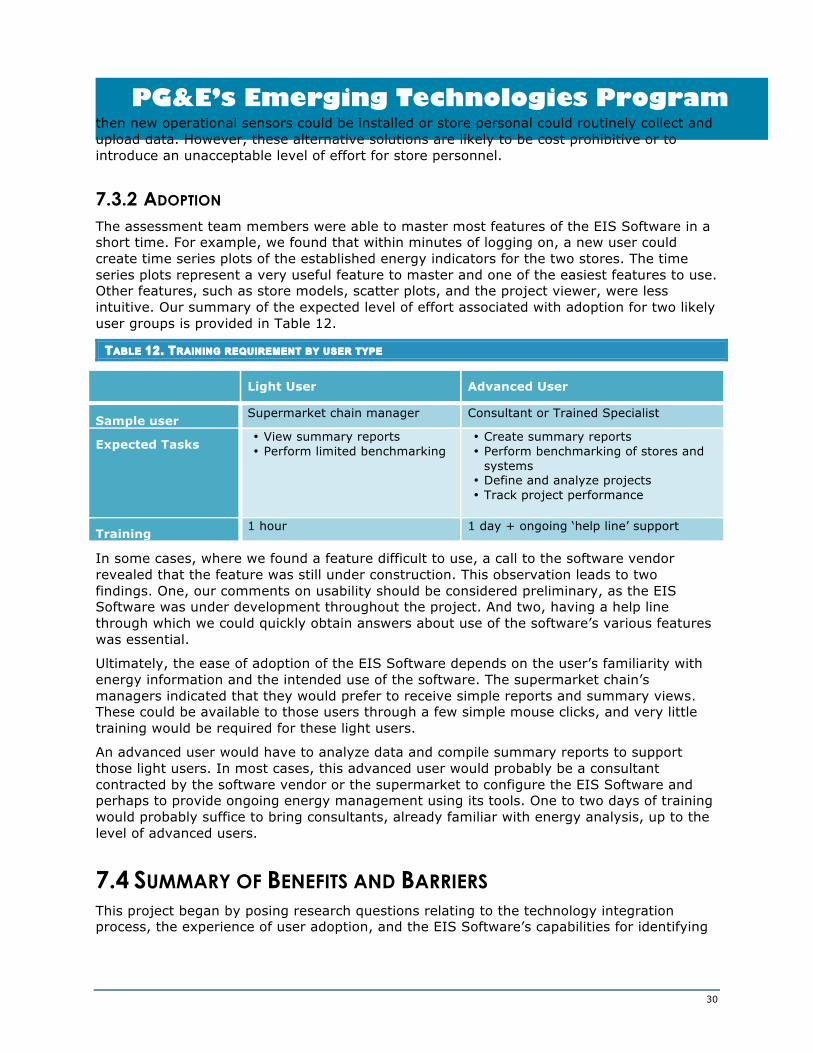
3 ASSESSMENT OBJECTIVES The overarching goal of this project was to understand how the EIS Software, as part of an EIS, could be used to improve energy efficiency and demand response in the grocery sector. Several specific objectives were defined early in the project to achieve this goal. These objectives were to evaluate the technology integration process, to characterize the experience of user adoption, and to test the Software’s capabilities for identifying project opportunities and supporting implementation of those projects.
This assessment does not determine energy savings and demand reduction attributable to the EIS Software. The problems of attribution are complex, and could not be addressed within the scope of this assessment. In particular, it is difficult to isolate the value of the software from that of the raw data, software user, and additional actions (e.g. operational changes or equipment retrofits) that are required to actually deliver energy savings or a demand reduction. With a large enough sample of test customers and long enough testing period, it would be possible to quantify the software’s value to a market sector with a reasonable degree of certainty. The sample size and duration of this project did not permit such an analysis.
3.1 RESEARCH QUESTIONS The sample in this study was limited to two sites provided by one business customer, and the duration of the field study was roughly six months. Within this scope, the assessment’s objectives were framed in the following set of research questions:
1. What are the setup and system integration costs?
2. What are the specific challenges that must be overcome for setup and integration?
3. What are the benefits of providing system-level energy information, relative to building level information?
4. What information does a supermarket need to act on a specific project opportunity?
5. What are the potential energy efficiency and demand response benefits from providing supermarkets with the information needed to act on project opportunities?
6. What are the potential cost savings and other benefits to a supermarket?
7. What are the barriers to adoption of the EIS Software by a supermarket?
9
PG&E’s Emerging Technologies Program
4 TECHNOLOGY EVALUATION There are several ways the EIS Software might be used to aid energy management in the grocery sector. The software has capabilities for Reporting and Tracking, and for Fundamental Methods of analysis, which depend on the level of data supplied by the data gathering hardware and communication elements of the EIS. This study focuses on a subset of the potential applications that relate to the use of EIS Software by a supermarket chain to plan and investigate energy efficiency projects and programs.
TABLE 4. POSSIBLE USES AND USERS OF THE EIS SOFTWARE IN THE GROCERY SECTOR
Applications
Possible Software Users
Individual Grocery Store
Supermarket Chain
Consultant Utility
Carbon Management
All Not assessed Not assessed Not assessed Not assessed
Energy Management
Planning Some assessment
Assessed Some assessment
Not assessed
Investigation Some assessment
Assessed Assessed Not assessed
Implementation Limited assessment
Limited assessment
Limited assessment
Not assessed
Ongoing commissioning
Limited assessment
Limited assessment
Limited assessment
Not assessed
Table 4 provides an overview of possible uses of the EIS Software and which of these were assessed in the study. For the most part, these correspond to Fundamental Methods defined by the LBNL handbook, which was under development at the time of this assessment. Though we have identified possible uses of the EIS Software throughout the lifecycle of energy projects, the scope of this study did not extend to project implementation or ongoing commissioning, so our assessment of the EIS Software’s use in these later project phases is limited.
5 TECHNICAL APPROACH We performed the following tasks to inform our research objectives and questions:
1. Task 1. Select sites with the characteristics required to support the assessment.
10
PG&E’s Emerging Technologies Program
2. Task 2. Setup and integrate the EIS Software at the sites. Once the EIS Software was operational at the test sites, we characterized the ways that it could be used as an energy efficiency and demand response enabling tool at each site.
3. Task 3. Demonstrate capabilities to the supermarket customer and record and summarize their feedback.
5.1 SITE SELECTION Site selection entailed recruiting a grocery business, screening stores within the business’s portfolio for suitability, obtaining access agreements for those stores, and then documenting an implementation approach for each store. PECI executed these procedures in the assessment. A utility or program implementer would perform similar tasks if the technology were to be adopted in the market.
PECI engaged a supermarket chain in the early stages of this assessment. The existing relationships between the utility, the assessment team, and the supermarket, together with the supermarket’s previous experience with energy submetering, allowed for quick formation of a project team. Moreover, the supermarket has aggressively pursued energy efficiency in its stores, and its project history provided a strong foundation for this assessment.
To identify test stores, we screened stores using a database of store metering infrastructure compiled from previous projects with the supermarket. The database identified the location, the type of whole building metering, the presence of system-level submeters, the type of refrigeration system controller (RSC), and the type of BAS for numerous stores in the Northern California region. For the assessment, we selected stores that would demonstrate a range of grocery store systems. The database was used to identify one older store with an older model RSC and BAS and one newer store with a modern RSC and BAS. The stores were also selected for their proximity to each other, which facilitated site visits during setup and integration.
The final step in the site selection process was to decide what energy and operational data would be most useful for identifying energy efficiency and demand response measures (see Box 2). The choice of which data to collect was based on three considerations: the reported capabilities of the EIS Software, the team’s experience identifying and implementing energy efficiency measures in the grocery sector, and knowledge of the stores’ existing data gathering hardware. The selected data and a short explanation of the rationale appear in Table 5.
TABLE 5. DATA SELECTED FOR COLLECTION AND ANALYSIS
Whole Building Data
In the EIS Software, whole building meter data may be used to provide a high level view of the stores’ energy performance. Collecting and analyzing the whole building data is also necessary in this assessment to determine the relative value of more detailed submeter data.
Box 2. Energy and Operational Data Energy data: The energy consumption (kWh) or energy demand (kW) of the store or equipment within the store. Energy data is collected by meters. Operational data: The services delivered by the store (revenue) or by equipment within the store (heating, cooling, and illumination). Operational data is collected by controls.
11
PG&E’s Emerging Technologies Program
System Data
HVAC
Energy data
Operational data
HVAC energy efficiency measures are often identified in grocery stores. Frequently identified measures include sensor upgrades, economizer repairs, and improved control strategies. To identify such measures requires energy and operations data for the stores’ rooftop HVAC units, as well as weather data.
Refrigeration
Energy data
Operational data
Energy efficiency measures for refrigeration systems represent a large and unique opportunity within the grocery sector. Commonly implemented measures range from installing night covers on refrigerated cases to introducing new control strategies for compressor and fan operation. Refrigeration measures may be identified using energy and operations data for the refrigeration system, in combination with weather data and the store operating schedule.
Lighting
Energy data
Installation of energy efficient lighting in grocery stores produces energy savings in the lighting system and, through the systems’ interactions, may also save energy in HVAC and Refrigeration. Analyzing the daily demand profile and power density of different lighting circuits may reveal the potential for schedule adjustments and lighting retrofits.
5.2 SETUP AND INTEGRATION Having identified the existing infrastructure at the test stores and the useful data points, the assessment team aided the software vendor in creating a process for data acquisition and integration into the EIS Software. The objective of this process was to enable the flow of information from the submetering and controls systems found at the two stores to the EIS Software. This section of the report provides an overview of this process. Detailed procedures for each building system are documented in Appendix A.
Both stores had an existing EIS. The existing EIS architecture combined submetering of store systems with a data management system that collected data from the submeters and made it available remotely through a web-server. Though use of the existing EIS by the supermarket was limited, its presence meant both stores had similar energy submetering. In contrast, the operational controls were unique to each store, so each site required a different approach for accessing, extracting and processing operational data.
Figure 2 and Figure 3 show the existing data connections and the new connections that we added through this project. As illustrated in the figures, the key distinguishing feature is the capability of the existing BAS and RSC controller(s). Though it may seem like a small difference, it is worth highlighting due to the large impact it had on data integration. The figures also show that PECI was an intermediary in the transfer of data. Our relationship with the customer and ability to extract data from the customer’s control system were needed to acquire and transfer data to the software.
12
PG&E’s Emerging Technologies Program
For each store, the assessment team assisted software vendor in developing a process to acquire energy data from submeters and operational data from the existing RSC and BAS. Both stores had a robust system for collecting energy data. Current transformers (CT) were
FIGURE 2. DATA ACQUISITION PROCESS FOR THE OLDER STORE
FIGURE 3. DATA ACQUISITION PROCESS FOR THE NEWER STORE
13
PG&E’s Emerging Technologies Program
in place to measure electricity use of lighting, refrigeration and HVAC at frequent (less than 15 minute) intervals. These measurements were aggregated by an electronic data manager, stored in a common format and made accessible remotely through a web-server. PECI extracted this energy data from the web-server and provided it to the software vendor for intermediate data formatting and upload to the online EIS Software.
The existing systems for collecting operational data were less robust. We performed extensive troubleshooting at both stores to access the operational data in the building’s systems. The following sections 5.2.1 through 5.2.4 discuss the procedures that were employed to setup and integrate each type of data—whole building energy data, system-level energy data, and system-level operational data.
5.2.1 WHOLE BUILDING ENERGY METERING The software vendor obtained whole building energy data for both the older and newer stores directly from PG&E. Both stores were equipped with electric interval meters, and historical electricity consumption in 15 minute intervals was available in a database maintained by PG&E. PG&E sent approximately one year of the historical interval data to the vendor, and the vendor then uploaded the data into the database supporting the EIS Software.
This type of whole building interval meter data is increasingly available, particularly for large energy consumers, as utilities roll out advanced metering infrastructure. It is relatively easy to integrate into the EIS Software and provides a useful look at building electricity profiles across a portfolio of buildings. The greater challenge of this project was to go behind the meter, to identify the added costs and benefits of gathering system-level data in grocery stores.
5.2.2 SYSTEM-LEVEL ENERGY SUBMETERING Energy data was available at both the older and newer test stores through the EIS architecture previously installed by the supermarket. This monitored the energy consumption of the major energy using store systems – HVAC, refrigeration, and lighting – and saved the data in a data manager for a period of one week. The weekly data was then pulled to a server connected by internet to the data manager.15 The presence of this existing submetering and data manager greatly facilitated system-level energy data collection. The presence of such a system is an example of the supermarket’s advanced energy management practices, and it is not expected to be a common feature in the grocery sector as a whole.
5.2.3 SYSTEM-LEVEL OPERATIONAL DATA System-level operational data is often used when investigating energy saving opportunities. Environmental parameters, such as temperature, can show whether spaces are overheated or overcooled and may suggest whether equipment is using a control strategy that optimizes performance based on the ambient conditions. Temperatures and pressures of
15 The term “data manager” is used in this report to refer to a device that records data collected by local meters and then communicates that data, using programmed data push or pull protocols, over the internet to a remote server for use by an individual or software application.
14
PG&E’s Emerging Technologies Program
fluids used for heating and cooling, as well as simple on/off signals for components, can be analyzed to gain further insight into the opportunities for energy savings.
The operational data parameters commonly used for identifying energy saving opportunities are already monitored, in many grocery stores, for purposes unrelated to energy efficiency and demand response. They are monitored to ensure that equipment is meeting its primary purpose. For example, sensors exist to ensure that refrigerant is provided to refrigerated cases at a temperature that prevents food from spoiling. The refrigerant’s return pressure to the compressor is also measured to prevent damage to the system. Such operational data is collected by a variety of control systems across the grocery sector.
HVAC
The accessibility of HVAC operational data differed markedly between the two stores. The older store featured an older BAS. It was a challenge to identify the correct software to access the system, and even after finding the software, we were unable to extract the data due to the proprietary access protocols used by the system.
The newer store featured a new BAS that controlled both the HVAC and refrigeration system, and saved operational data in a web-based software platform. Though we could have gained remote access to the data, support from the BAS vendor was readily available, and data was extracted from the system by the vendor and delivered to PECI.
REFRIGERATION
Like the HVAC data, we found the operational data for the refrigeration system far more accessible at the newer store than at the older store. At the newer store, the same web-enabled BAS that provided HVAC data also provided refrigeration system data. It was a far greater challenge to access refrigeration data at the older store, but after trying several approaches we were able to access to the RSC remotely through the existing phone line connection. However, the connection was tenuous, and the data extraction process was frequently disrupted. The RSC’s configuration further complicated matters. It was set to record data at a short, three minute interval, but only preserve the data for 2 days.
LIGHTING
The energy submetering for the lighting system provides both energy and a proxy for operational data. Light meters in the store would provide a more direct measure of the system’s operation. However, the demand profile that can be constructed from the energy submeters, in combination with general information about store sales floor area and hours of operation, was judged sufficient to identify common lighting efficiency measures. Thus, no operational data was collected for lighting aside from the energy submetering described above.
5.2.4 DATA COLLECTION AND TRANSFER For this assessment, as we defined processes for accessing the data, we acquired and transmitted the data to the software vendor. While the EIS Software’s data requirements are consistent, the format of data provided by energy submeters and the various control systems varies widely. Most of these data acquisition systems offer some type of flat file output, but these have different delimiters and different fields to decipher. The software
15
PG&E’s Emerging Technologies Program
vendor’s data upload team handles the conversion of these outputs to the EIS Software’s required format.
As the vendor loaded the data into the EIS Software’s database, PECI collaborated in commissioning the system. Commissioning tasks are shown in Box 3. Due to the large volume of data collected through diverse routes, parallel processes of acquiring, processing, loading and commissioning occurred simultaneously.
One of the key commissioning tasks was for a team member with a good understanding of the store’s systems to review the data after the initial upload and verify that the data was uploaded and labeled properly. Once this and the other commissioning tasks in Box 3 were complete, the EIS Software was ready for use.
5.3 TEST PLAN We tested several strategies for using the EIS Software as part of an EIS to enable energy efficiency and demand response. These ranged from basic portfolio tracking and benchmarking, to more advanced techniques for remotely investigating system performance. As this project specifically sought to assess the value of including behind the meter data in the EIS Software, greater attention was given to the more advanced techniques, particularly measure identification. Sections 5.3.1 through 5.3.5 introduce the capabilities that were tested and describe the qualitative and quantitative approaches used to assess each capability.
5.3.1 DATA VISUALIZATION AND BENCHMARKING Data visualization is perhaps the most obvious capability offered by the EIS Software. This refers to the software’s ability to present the user with graphic representations of the energy performance of a store and its systems. The assessment of data visualization in this project was entirely qualitative. The team at PECI created several types of charts in the software to assess the ease of use and versatility—meaning the ability to create the types of charts we typically find useful. The supermarket stakeholders’ response to a demonstration of the software’s features also provided insight into how a supermarket would use the EIS Software to advance energy saving projects.
Benchmarking refers to the comparison of a building’s energy performance against other similar buildings (cross-sectional) or against its own historical performance (longitudinal). In either case, the building energy performance metrics that are compared must often be adjusted to account for differences in key building characteristics or in the variables that influence building behavior, such as climate.16 Again, the assessment of the benchmarking capabilities is primarily qualitative, focusing on ease of use and versatility, and includes insights from the supermarket stakeholders.
16 CCC (2011)
Box 3. Commissioning Tasks Create graphical representation of
store Input store characteristics, such as
name, age, floor area, refrigeration space, etc.
Review and revise labels for primary, meaning uploaded, data
Create secondary, calculated indicators, such as energy use per square foot
16
PG&E’s Emerging Technologies Program
5.3.2 MEASURE IDENTIFICATION Enhanced measure identification capability is one of the key anticipated benefits of including behind the meter data in the EIS Software. Measure identification here refers to the ability to identify and define projects that can be implemented in a store to improve energy efficiency. The inclusion of system-level energy and operational data in the EIS Software was hypothesized to allow for measure identification with minimal onsite investigation.
Measure identification was not an automated feature of the EIS Software, but rather a capability that the Software might deliver when coupled with the services of an energy analyst. Thus, the measure identification capability was tested by tasking a skilled grocery sector energy analyst with identifying common grocery sector efficiency measures using EIS Software tools. There are both qualitative and quantitative results from this assessment. The qualitative result is a procedural description of how measure identification can be performed and the supermarket stakeholders’ impression of the value of this approach. The quantitative results are the estimates of the energy savings that might result from implementation of the measures that were identified using these procedures.
5.3.3 MEASUREMENT AND VERIFICATION Measurement and verification (M&V) activities are conducted along with most energy efficiency projects to ensure that the expected benefits of the project are achieved. These activities are often necessary to show that limited investment funds have been put to good use, and they also serve a valuable purpose of providing feedback that can be used to improve and support future, related projects.
Only a limited assessment of the EIS Software’s capabilities as an M&V tool was possible in this study. A rigorous assessment would have required implementing projects and then testing the software’s capabilities, for example, with respect to the IPMVP options A – D.17 As previously noted, project implementation was beyond the scope of this assessment. Thus, the assessment of M&V capabilities is limited to a qualitative discussion based on our observations of how the EIS Software’s capabilities may aid in M&V.
5.3.4 PERSISTENCE The value of an energy efficiency measure depends on how long it persists; the principle being that a measure that saves 1,000 kWh per year for 10 years is worth more than a measure that saves 1,000 kWh in the first year and then loses its effect. One of the potential values of the EIS Software for the grocery sector is helping to ensure the persistence of energy saving measures.
The ability to improve measure persistence is strongly related M&V capabilities. So, again, a rigorous quantification was outside the scope of this study. However, the assessment does provide some observations about the possibility of using the EIS Software to improve persistence.
17 EVO (2010)
17
PG&E’s Emerging Technologies Program
5.3.5 DEMAND RESPONSE Demand response is the reduction of energy use during a time of peak demand on the utility’s system.18 Specific capabilities that may allow a supermarket to engage in demand response include forecasting of loads, better control of loads, or enhanced communication with the utility. Early in the project, PECI reviewed the software to identify such features. Finding none, we focused the remainder of the assessment on the software’s capabilities for energy efficiency.
The lack of specific demand response enabling features does not mean the software has no potential demand response applications. Some of the software’s capabilities for measure identification and M&V that were assessed for energy efficiency projects could also be used to aid demand response. For example, the ability to compare the consumption of different systems at a given time of day could be useful for determining demand response potential. Such demand response applications are noted in the results.
6 RESULTS This section presents the results from this assessment in two parts. First, we describe the results of the setup and integration of the EIS Software with system-level submetered data. Second, we discuss the results related to testing of the EIS Software’s capabilities.
6.1 SETUP AND INTEGRATION The setup and integration phase of this project added system-level data to the EIS software for two grocery stores. We integrated both submetered energy data and, where possible, operational data. The key findings from this part of the assessment are:
• The process of screening stores for suitability was facilitated by prior knowledge of the existing metering infrastructure in the stores. If such a resource were not available, the grocery customer, software vendor, or a third-party would almost certainly need to perform site investigations to determine the existing metering or feasibility of adding metering.
• Our efforts to collect operational data for HVAC and refrigeration systems at the older store were hindered by the older control systems and ultimately provided incomplete data. We expect that at many older stores, collection of operational data will face similar barriers.
• The collection of system-level energy data at both stores was simplified by the existing submetering and data management system. We do not expect similar systems to be prevalent in the wider grocery sector, and the upfront hardware costs will often be higher than in this study.
Determining the setup and integration costs was a specific research question, and this topic is discussed further in the next section. 18 Energy Design Resources (2008), Design Brief: Demand Response.
18
PG&E’s Emerging Technologies Program
6.1.1 SETUP AND INTEGRATION COSTS The costs examined in this study relate to the cost of metering system-level data in a grocery store and integrating that data into the EIS Software. These are one-time costs associated with installing submeters, establishing the data connections, and configuring the EIS Software for the customer.
We were not provided with cost information for licensing the EIS Software, so we cannot present them here. Nor do we attempt to estimate the costs of operating and maintaining the EIS Software after completing integration. The grocery customer did not continue the implementation beyond the testing and demonstration discussed in this report and thus we have no data on the ongoing costs. Those additional costs would need to be considered to fully assess the cost effectiveness of market implementation.
TABLE 6. ESTIMATED PROJECT COSTS FOR SETUP AND INTEGRATION OF SYSTEM-LEVEL DATA AT TWO STORES
Effort (hr) Average Rate
Direct Costs Estimated Cost
Installation of submetering NA NA NA NA
Setup and data acquisition 230 $120 $0 $27,600
Integration of data 210 $230 $0 $48,300
Total $75,900
Table 6 shows the total setup and integration costs for both test stores in this assessment. It is difficult to distinguish between costs incurred for the older store versus those for the newer store, as setup and acquisition of energy data was performed simultaneously for both stores. Setup and acquisition of operational data is the one area where the level of effort was substantially different. We estimate that roughly twice as much effort was expended to acquire operational data from the older store as from the newer store. Once data was acquired, the level of effort for integrating the data in the EIS Software was similar for the two stores. Accounting for the different levels of effort to acquire operational data suggests a slightly higher project cost for the older store, roughly $41,000, compared to $35,000 for the newer store.
Based on our experience in the project and knowledge of the grocery sector, we constructed a market implementation scenario to estimate costs for a deployment to 20 stores. This scenario is intended to represent the cost of setup and integration at newer stores in a California supermarket chain. In it, we reduced the costs of ‘setup and data acquisition’ and ‘integration of data’ considerably due to the learning achieved through this technology assessment. However, additional costs are added for installing the system-level energy submetering that already existed in the test stores. The scenario assumes that operational data is gathered for HVAC and refrigeration systems using the type of web-enabled control system present in the assessment’s newer store. Without this type of web-enabled control system, we expect it will generally be cost prohibitive to integrate operational data in the EIS Software.
19
PG&E’s Emerging Technologies Program
TABLE 7. ESTIMATED COSTS OF SETUP AND INTEGRATION OF SYSTEM-LEVEL DATA FOR A 20 STORE SCENARIO
Effort (hr) Average Rate4
Direct Costs Estimated Cost
Installation of submetering1 80 $250 $300,000 $320,000
Setup and data acquisition2 300 $120 $0 $36,000
Integration of data3 130 $210 $0 $27,400
Total $383,400 1 Installation of metering and a data manager for lighting, HVAC and refrigeration; direct cost is the estimated turn-key delivery cost based on a vendor quote, and additional effort is for project management. 2 Performed by consultant. 3 Performed by software vendor. 4 These are estimates of the average rates that would be charged for project management, consulting, and software services.
As shown in Table 7, the cost of installing energy submetering dominates the total cost of a larger deployment of the EIS Software with system-level data for supermarkets. We estimate that submetering lighting, HVAC and refrigeration, with an associated electronic data manager to collect and upload data to a server, would have a direct cost of $15,000 per store.19 With the additional project management effort, the total cost of installing submetering in 20 stores is estimated at $320,000, or $16,000 per store. The estimated costs of consulting services for setting up the system and integrating data in the EIS Software are modest by comparison, averaging out to $3,200 per store in the 20 store deployment. Ongoing software licensing and maintenance fees are not included in these cost estimates.
There is considerable uncertainty in the cost estimates for this scenario, as actual costs will depend on the store configuration and vendor pricing. These costs could easily vary by ±25 percent.
6.2 TESTING THE EIS SOFTWARE After setup and integration, we tested the software’s capabilities for supporting energy efficiency in the grocery sector. Section 6.2.1 discusses our findings relating to the software’s capabilities for data visualization and benchmarking. Section 6.2.3 describes findings relating to M&V and persistence. Section 6.2.2. summarizes how the software can be used to facilitate measure identification and the estimated benefits of this approach.
6.2.1 DATA VISUALIZATION AND BENCHMARKING The EIS Software offered several tools for presenting energy related information about a supermarket. We could create a model of the store, plot performance indicators, and analyze proposed projects. Each of these capabilities is discussed below.
19 This estimate is based on a single vendor quote and subject to some uncertainty.
20
PG&E’s Emerging Technologies Program
STORE MODELS
The EIS Software offered tools that allow a user to construct a virtual model of a supermarket. The vendor constructed the models in this project and we observed that a user could represent a store, systems within the store, inputs, outputs and meters. The model created for this project received inputs of electricity and natural gas. These inputs are metered at the store level. Within the store, the systems included in the model are HVAC, sales lighting, track lighting, and two refrigeration systems. Emissions are shown as an output from the store, though we did not quantify emissions for this study.
We found the models to have some use for visualizing the scope of the project. However, the principal use of the tool appeared to be tracking equipment in the facility. That type of tracking was not performed in this assessment, though we imagine it could be a useful feature for facility managers. As our principal focus was on the energy and operational data tied to each of the systems, we were disappointed to find that the energy and operational data was not connected to the systems depicted in the models. For example, we could not click through the HVAC system in the diagram below to see the HVAC energy demand. It seems feasible for vendor to create that connection in a future version of the software.
PERFORMANCE INDICATORS
The EIS Software allows a user to plot a store’s energy indicators. A number of energy indicators were created by vendor as part of setup and commissioning of the software. These indicators were grouped in the following categories: Energy Consumption, Energy Cost, Intensity Calculations, Building Metrics, Refrigeration Metrics, GHG Emissions, Economic Measures, and Operations. In all, these eight categories contained more than 50 indicators, though some were software defaults that were not used in this study. The indicators ranged from the simple, Energy Consumption – Total Energy Usage (kBtu), to the more complex – Building Electricity Consumption per Linear Feet of Refrigerated Case.
We found it easy to display the individual indicators as time series plots and could do so at each level of disaggregation for which data was provided. In this project, the levels of disaggregation available were portfolio (two supermarkets), building (building electric meter), and system (submeters). Some data from sub-system operational control points was also included, such as suction and discharge pressures for compressors in the refrigeration systems.
One charting capability that we specifically looked for was the ability to create scatter plots, such as refrigeration system energy demand versus outside air temperature. This capability was not present in our first inspection of the charting features. However, the vendor reported adding that capability later in the project, though we could not verify the addition in our version of the software.
The EIS Software can monitor entire building portfolios and users may view and visually compare indicators across the full portfolio. We constructed comparisons of the whole building electricity consumption of each store. However, such comparisons can present a misleading view, if the data is not adjusted to account for store size. Thus, we found it more useful to create comparisons using an indicator that normalized whole building electricity consumption based on each store’s sales area. This type of comparison could also be made in the benchmarking tool. From this portfolio look at the indicators, the user may then look at a single store, and then further to a single system and to a single asset.
One limitation of the software that complicated data comparisons and overlays was the lack of user control over the color of the charted data. The software assigned the colors each time the user creates a chart, and may assign different colors to the same data each time a
21
PG&E’s Emerging Technologies Program
chart is created. Each chart can display a legend to show correspondence of colors to data points.
In addition to the indicators that appear in a particular chart, there are a number of options for plotting overlays that may provide a better understanding of store performance. Supermarket energy consumption varies in correlation with outdoor conditions, so including an overlay of outdoor air temperature adds an important context to the varying performance of stores over time.
Time series plots are one useful way to monitor store and system energy performance. Another valuable perspective is to view indicators using scatter plots. Scatter plots were not support by the EIS Software at the beginning of the assessment, but the vendor reported adding this functionality over the course of the project. Section 5.2 will discuss how these plots have added to the value of the EIS Software for supermarkets.
BENCHMARKING
The EIS Software includes a benchmarking tool that allows a user to view side-by-side comparisons of the facilities in the portfolio. Each facility is charted according to a selected indicator. Though we only had system level data for two stores, we did have billing data for a larger number of stores. The software automatically indicates the quartiles of performance. If the data were normalized for store characteristics, then these indicators could be useful for setting goals in the facilities. For example, all lower quartile stores could work to improve to the median level of performance.
We could view the characteristics of any of the benchmarked facilities in the bottom of the window simply by clicking on the facility. Such characteristics include location, building type and tariffs, as well as some metrics of the facility’s rank against other facilities in the portfolio. Once the data is integrated in the software, this type of benchmarking is easy to perform.
PROJECT VIEWER
Another feature provided by the EIS Software is the ability to enter project data and compare the modeled financial performance of various project opportunities under varying assumptions. In this project, we defined several potential project opportunities and the vendor entered data for those opportunities in the project viewer. Such data includes the project description and economics, including capital cost, taxes, available incentives, project life, discount rate, and energy savings.
It is important to understand that the characteristics of each project are defined by the user. Once defined, the software computes financial metrics such as net present value (NPV) and payback period then displays and ranks the projects according to a user’s preference.
6.2.2 MEASURE IDENTIFICATION A skilled energy analyst with grocery sector expertise used the EIS Software to aid measure identification. The analyst investigated energy savings opportunities for operational improvements and equipment upgrades and also explored some potential applications for retrocommissioning (RCx). The following sections describe the procedures developed for measure identification using the EIS Software. We provide our estimates of the energy saving potential for the identified measures, but not all of these savings can be attributed to
22
PG&E’s Emerging Technologies Program
the software. In fact, as the discussion will show, the energy analyst’s interpretation of the data that is presented by the software is critical for identifying measures and estimating their benefits.
OPERATIONS
The energy analyst examined time series graphs to identify opportunities for revising system operating schedules and to identify failed sensors or overridden setpoints. A straightforward example of this process can be show using lighting schedules. When the analyst overlaid the lighting schedules at the two comparable store locations he observed a potential opportunity to reduce fixture runtime at the older store by 2-hours per day. Such a project would reduce operating expenses and fixture replacements costs. To further validate this opportunity, the analyst verified with store personnel that store operating hours are the same at both locations.
Our inspection of the lighting profile of the older store suggests that lighting demand could be reduced by approximately 25 kW for two hours per day. Annually, this would amount to 18,000 kWh. Using the store’s average electricity cost calculated by the EIS Software of $0.16/kWh, this very low cost operational improvement would achieve annual energy cost savings of: 18,000 kWh/yr x $0.16/kWh = $2,900.
CAPITAL IMPROVEMENTS
The analyst investigated the system-level data displayed in the EIS Software to identify energy saving capital improvements. First, he used system-level benchmarking to identify systems that looked like likely candidates for retrofits. The lighting density (watts per square foot) was analyzed for the older and newer stores. The older store had a lighting power density that is nearly 30% greater than the newer store. Based on this difference, the analyst concluded that the older store may be a candidate for a lighting retrofit. If there were more stores and systems in the software, conclusions could be drawn from this type of benchmarking with greater confidence.
Once we identified the possibility of a lighting retrofit, we used hourly trends to verify the lighting system wattage and to estimate the operating hours. We can use those parameters in a simple engineering calculation to provide a preliminary estimate of the project’s energy saving potential.
In this case, if we assume the previously discussed schedule change is implemented, then the primary lighting system operating hours would be 9am to 11pm, or 14 hours per day. If lighting power density were reduced 30% by a retrofit, to achieve the same level as the newer store, then the savings would amount to approximately: 14 hrs/day x 365 days/yr x 25 kW x (1 - 0.30) = 90,000 kWh/yr. At $0.16 per kWh, this would achieve energy cost savings of roughly $14,000 per year, plus some additional savings from reduced demand charges.
This example illustrates that the analysis done using the EIS Software provided a preliminary estimate that suggests that further investigation is warranted. To fully design the project and better quantify costs and benefits, a contractor would need to visit the site, inspect the existing equipment, and propose a suitable replacement.
We believe this two stage process - first screening buildings for opportunities in the EIS and then sending a technician onsite for further investigation - would be required for any energy efficiency measures requiring capital improvements. In this process, the software facilitates
23
PG&E’s Emerging Technologies Program
the remote analysis that allows a portfolio manager to focus resources for investigation and project development in the stores that appear to have good project opportunities.
RETROCOMMISSIONING INVESTIGATIONS
Retrocommissioning (RCx) investigations typically go onsite to gather system-level data and then use that data to determine where controls sequences can be improved to achieve energy savings. With system-level energy and operational data provided in the EIS Software, we thought it worth exploring if some of these energy saving controls improvements could be defined without going onsite.
The energy usage patterns of HVAC and refrigeration systems depend on how the system controls vary operating parameters to meet the system load. We used outside air temperature as a proxy for load and viewed the resulting systems profiles in EIS to see if the resulting energy usage patterns indicated control deficiencies. With the software we created a chart that showed a multi-plex compressor rack’s system kW plotted against outside air temperature. The figure illustrated an energy usage pattern where the rack’s energy demand is strongly correlated to outside air temperature. This is characteristic of a properly functioning control sequence.
Over the same range of temperatures this rack shows a much lower correlation to outside air temperature. This low correlation suggests that there may be opportunities for improving the system’s performance, by adjusting control sequences, by recalibrating sensors, or through other means.
Again, our remote analysis of the data presented by the EIS Software was not sufficient to fully define an energy saving RCx project. Further investigation could have revealed that the system operated well and the variance was driven by an unobserved characteristic of the system, or we might have validated the opportunity for a controls improvement. One of the more common refrigeration control improvements is to implement floating head pressure control. Based on data from existing programs, that measure produces an average energy savings of 80,000 kWh.
This example suggests that the analysis of behind the meter data in the EIS Software could be used by a commissioning provider to screen stores for potentially valuable operational improvements. Where areas of concern are identified, the provider could then follow up with a site investigation.
6.2.3 M&V AND PERSISTENCE We looked for two features in the EIS Software when evaluating its use for M&V and persistence: the ability to simulate baseline performance and the ability to generate alerts. As currently implemented, the software has neither of these features. As previously noted, it does have strong features for visualizing energy use of stores and store systems which could provide some limited M&V and persistence benefits.
M&V, based on IPMVP Options A and B, requires tracking energy or operational parameters in the systems affected by a project. Similarly, Option C requires tracking whole building data energy data. However, all of these methods require adjustments to account for other changes that could affect the system, apart from the specific project that is being evaluated. A good example was illustrated in the previous section by the compressor multi-plex energy demand’s dependence on outside temperature. If the pre- and post- project period measurements are not adjusted to account for differing outside air temperature, then the comparison will not produce valid results. The EIS software provides a platform for viewing
24
PG&E’s Emerging Technologies Program
the relevant data but no mechanism to analyze or model an adjusted baseline to generate savings estimates.
Simulated performance could potentially be coupled with user alerts to aid in measure persistence. For example, if the previously described lighting scheduling change were implemented, then a model of the new hourly lighting energy demand could be created. If this model of lighting energy use as a function of time were to deviate from an expected range, then an alert (e.g. an email) could be sent to an appropriate party to determine whether the lighting schedule had been altered. Alerts are not currently a feature of the EIS Software.
The ability to simulate expected performance and to generate alerts would automate the M&V and persistence capabilities of the EIS Software. The software’s existing capabilities for visualizing energy use simply provides some assistance to a diligent user to manually evaluate performance for M&V and persistence.
6.3 RESULTS SUMMARY MATRIX Our testing of the EIS Software, with integrated system-level data, revealed multiple applications that could aid energy management in the grocery sector. These include preliminary identification of energy saving measures, visualizing data, and benchmarking. Table 8 summarizes the full range of applications for enabling energy efficiency that were identified by this assessment. The applications are shown for three store types across several stages of energy management: planning, investigation, implementation, and ongoing commissioning. Generally, the applications are similar where system-level energy data is provided in all stores. But in the Older and Typical store are more limited due the assumed lack of operational data.
TABLE 8. SUMMARY OF ENERGY EFFICIENCY APPLICATIONS FOR THE EIS SOFTWARE WITH INTEGRATED SYSTEM-LEVEL DATA
Key areas of energy
management
Store Type
Older and Typical Newer
Pla
nn
ing
Data Visualization
Present energy performance indicators in a customizable dashboard Enter and track equipment characteristics in the Facility Modeler
View time series energy demand plots over periods varying from hourly to annual
Benchmarking Compare normalized whole building and system-level energy performance across a portfolio
Financial Analysis
Enter project data to easily calculate financial metrics, graphically illustrate and rank projects
Inve
stig
atio
n
Operations View demand profiles and manually identify opportunities for adjusting schedules
Capital Improvements
Compare system energy demand profiles across a portfolio to focus efforts on inefficient systems
Controls Overlay demand profiles with outside air temperature Manually identify major system failures or commissioning opportunities
Overlay demand profiles with outside air temperature Manually identify major system failures or commissioning opportunities Overlay system setpoints with outside air temperature
25
PG&E’s Emerging Technologies Program
Key areas of energy
management
Store Type
Older and Typical Newer
Manually identify opportunities to modify system controls to improve efficiency
Imp
lem
enta
tio
n Savings
Analysis Examine system-level data to determine some inputs for savings estimates
Savings Verification
View whole building or system-level energy demand for a rough comparison against engineering estimates
View whole building or system-level energy demand for a rough comparison against engineering estimates Compare pre- and post-project system operations under similar conditions to verify implementation
On
go
ing
C
om
mis
sio
nin
g Retrofit
Persistence Periodically view whole building and system-level time series graphs for large unexplained deviations
Periodically view whole building and system-level time series graphs for large unexplained deviations Periodically view system-level scatter plots to confirm continued performance of control changes
Benchmarking Periodically repeat benchmarking to set new performance improvement goals
7 EVALUATION Through our software testing, we identified how the EIS Software could support measure identification. However, we also defined the limits of what the software offers and what supplementary effort must be provided by an energy analyst. On this basis, we summarize our evaluation of the EIS Software’s support for energy saving measures in section 7.1. The supermarket stakeholders who participated in this project provided another perspective on the potential use of the EIS Software in the grocery sector. Their evaluation is provided in section 7.2.
Section 7.3 describes our evaluation of the expected level of effort required for supermarket stakeholders to install and adopt the EIS Software. Our evaluation concludes with a summary of the benefits and barriers in section 7.4.
7.1 SUPPORT FOR ENERGY SAVING MEASURES Our testing of the EIS Software to support energy saving measures focused on its use by an experienced energy analyst for measure identification. The potential energy efficiency opportunities that the analyst was able to identify are summarized in Table 9.
TABLE 9. ENERGY EFFICIENCY OPPORTUNITIES IDENTIFIED BY THE ENERGY ANALYST
Measure Description Estimated Energy Savings
26
PG&E’s Emerging Technologies Program
Measure Description Estimated Energy Savings
Lighting schedule change 18,000 kWh per year, pending evaluation of feasibility
Lighting retrofit Perhaps 90,000 kWh per year; additional definition of the project is required
Refrigeration system commissioning
More investigation required to diagnose the problem and determine a solution. A typical measure associated with the opportunity might save 80,000 kWh over the standard measure life
The estimated energy savings in Table 9 cannot be fully, or even mostly, attributed to the EIS Software. The energy analyst plays an essential role in measure identification using the data presented in the software. And as indicated by the uncertainty in the savings estimates, some level of additional investigation is required to fully characterize customized measures. Moreover, additional effort will be needed to design and implement measures, and equipment must be purchased for capital improvements.
In the context of measure identification, the software demonstrated capabilities that would be useful for screening and prioritization of stores and store systems. The software also provides some basic capabilities for verifying project implementation and persistence, but not the more powerful simulation and alert features that could automate M&V and persistence.
7.2 SUPERMARKET STAKEHOLDERS’ EVALUATION The supermarket stakeholders’ evaluations were based on a demonstration of the EIS Software’s capabilities relating to the focus areas of the assessment. However, the stakeholders’ feedback also ranged beyond these focus areas. Rather than parsing this feedback among the focus areas and potentially losing some valuable insights, we provide the full range of the supermarket stakeholders’ feedback here.
PECI interviewed energy and maintenance managers in the participating supermarket chain to understand their goals for implementing energy management software in the chain. These pre-implementation interviews allowed us to construct a set of criteria against which key potential users of the EIS Software would judge its utility. Those criteria, together with the business reasons associated with the criteria, are shown in Table 10 below.
TABLE 10. SOFTWARE PERFORMANCE CRITERIA (PC) FOR SUPERMARKET CHAIN
PC# Software Performance Criteria Business Reason(s)
PC1 Visibility for decision makers into the entire building portfolio
Understand where energy dollars are spent
PC2 The ability to benchmark using normalized data
Identify high use areas
Inform equipment purchase
Validate cost-effectiveness of newer store designs
27
PG&E’s Emerging Technologies Program
PC3 View trends of energy use Verify energy use reduction from retrofit projects
PC4 Calculate time of use cost of energy consumption
Determine the financial savings from energy efficiency projects
PC5 Deliver automated reports Create a stream of actionable items that can be pursued to improve energy performance
Our final deliverable to the customer was a demonstration of the full range of the EIS Software’s capabilities, as built for this project. This demonstration began with a portfolio-level view of whole store energy performance, progressed to a breakdown of energy consumption in a single store, and then explored opportunities for project identification and analysis. The supermarket chain’s response to this demonstration provides valuable guidance for future projects by identifying where a grocery business finds value in the existing capabilities and also where additional capabilities were suggested.
The customer audience for the demonstration included the supermarket chain’s energy and maintenance manager, procurement specialists, store leaders, and third-party commissioning agents. This audience represented the supermarket’s key personnel in facilities performance and together they had experience in all aspects of energy efficiency project design and implementation. Table 11 summarizes their comments from the demonstration, as they relate to key features of the EIS Software. Some general suggestions relating to the entire platform are also included.
The feedback from the demonstration was generally positive and identified many ways that the EIS Software could provide value in a supermarket. The bold text indicates customer feedback that clearly related back to the specific performance criteria identified in Table 10. Most of the customer’s performance criteria were at least partially satisfied. The notable exception was the customer’s desire to have an automated reporting feature that would deliver simple, actionable messages. At the time of this project, that feature was not included in the EIS Software.
TABLE 11. CUSTOMER FEEDBACK ON EIS SOFTWARE DEMONSTRATION
Portfolio Viewa
Existing capability: • It is helpful to be able to compare the different stores’ energy
consumption, normalized by sales area. It suggests where it might be worth focusing efforts. (PC1)b
• Comparing new stores versus old stores is useful to validate the chain’s investment in more efficient designs and technologies for new stores. (PC2)
• It is useful to benchmark both against other stores in the chain and also against the entire market, though it is acknowledged that comparisons outside the chain are challenging due to different store models.
Suggested additions: • Adding water consumption may be interesting, as some assets trade water
consumption for energy consumption. • It would be helpful if the platform delivered simple messages, such as a
report showing the top and bottom performing stores. (PC5) Store Level Existing capability:
• The supermarket chain values competition. The EIS Software would enable them to organize competitions around energy use.
• If opportunities for energy saving behavioral changes are identified, then the information can drive action, with little or no investment requirement
• It could be used for tracking persistence of energy saving operational
28
PG&E’s Emerging Technologies Program
improvements introduced through commissioning projects. Suggested additions: • The system data energy consumption does not add to the whole store energy
consumption. It would be nice to fill in that gap. System-level
Existing capability: • The system-level data is essential. It provides needed foundation for a
business case for energy efficiency projects. The more one can drill down into energy consumption the better, especially if this is used for asset planning and tracking. (PC3)
• The ability to provide consultants with good data for their analysis is valuable. • The ability to identify some energy saving measures using the Software is helpful,
but it becomes more powerful when combined with a store leaders’ understanding of store operations.
Suggested additions: • More system data would be better. Ventilation hoods may be the next to add. • The data needs to be packaged in a way that some users can get a simple, high
level message, and other users can dig in to identify opportunities. • A more flexible regression tool would be useful for identifying energy saving
measures. Project viewer
• This feature is a potential game changer. It could help the supermarket adopt a longer term plan for energy saving upgrades, which would align well with a corporate goal for energy savings. By helping to make the business case for each project, it might unlock more investment funds and allow the supermarket to commit to more projects. (PC4)
Suggested additions: • Completing the connection into utility program and rebate offerings will
be very useful. These are often very important in investment decisions. (PC4)
• It would be very helpful if the tool facilitated a pay for performance incentive model, instead of the current measure by measure approach to calculating energy savings and incentives.
Other suggested additions
• Some of the key potential users of this type of EIS Software need periodic, automatically generated reports that include key indicators and help to direct their efforts. This automatic reporting feature would greatly improve the usefulness of the Software. (PC5)
• Similar to a reporting feature, an alert feature would add value to the Software. The alert would notify appropriate personnel when the energy performance of a store or a store system went outside of a set range. The supermarket sees the value in these alerts based on their experience with similar alerts used to maintain the performance of their refrigeration system.
• At the end of the day, investment decisions on energy efficiency projects are made on the basis of how much money will be saved. This type of Software will be most valuable to the supermarket if it can streamline the investment analysis. (PC4)
a The supermarket chain’s team had seen the portfolio view through a previous demonstration, so this summary may not fully capture their comments on that feature. b The performance criteria numbers in this table correspond to those shown in Table 9.
As shown in Table 11, not all of the customer’s feedback related directly to the performance criteria in Table 10. Once the supermarket personnel viewed the demonstration, they recognized new values for the software and thought of additional capabilities that they would like it to include. New values noted by the customer during the demonstration include: benchmarking against the entire grocery sector, store versus store competitions, energy saving behavior change programs, and supporting the work of energy consultants. Additional capabilities that the demonstration prompted the supermarket personnel to ask
29
PG&E’s Emerging Technologies Program
for include: alerts indicating when a store or system performs outside an expected range and connection to utility incentives that reward whole building performance improvements.
7.3 INSTALLATION AND ADOPTION Customer effort is required to install and to learn to use the EIS Software. This project carried the software implementation only as far as the demonstration, so the analysis of this customer impact of adoption is somewhat speculative. However, based on our knowledge of the grocery sector and our own experience setting up, learning and using the EIS Software, we provide an estimate of the customer effort required.
7.3.1 INSTALLATION In a typical supermarket chain, the decision to use the EIS Software with some level of energy submetering would require the installation of some data gathering and communication equipment at each store. The basic process of installing energy submetering with communication is shown in Figure 4.The submetering system must be designed, and an electrician must install current transducers. A technician must also install communications equipment, such as a data manager, and define the protocols by which it interprets data from the submeters and transmits that data to the database used by the software. Once equipment is installed, the submetering system must be tested, to ensure that it has been setup properly.
This equipment installation and testing, if conducted outside of business hours, could be completed with minimal impact on store operations. In most situations, the selection of points to meter and purchase of metering equipment would be carried out by the software vendor, or by a consultant under contract to the vendor or the supermarket chain. Store personnel would need to participate in scheduling the installation of metering equipment and would need to provide store access. The supermarket chain’s IT staff would then need to assist in connecting the submetering system to the store network and enabling data transfer.
Where operational data will also be gathered, as it was in this project, the installation will generally require a greater level of effort from all parties, including the supermarket or a consultant acting on its behalf. Someone must investigate the existing monitoring of operational data in the store and assess the feasibility of connecting those monitors to the EIS Software. This task requires knowledge of the project objectives and a firm understanding of grocery control systems. Even an experienced consultant requires assistance from the supermarket’s facilities managers and IT staff to access the existing control systems. If it is not possible to automate data transfer from the existing systems,
FIGURE 4. PROCESS FOR INSTALLING ENERGY SUBMETERING AND COMMUNICATIONS EQUIPMENT
30
PG&E’s Emerging Technologies Program
then new operational sensors could be installed or store personal could routinely collect and upload data. However, these alternative solutions are likely to be cost prohibitive or to introduce an unacceptable level of effort for store personnel.
7.3.2 ADOPTION The assessment team members were able to master most features of the EIS Software in a short time. For example, we found that within minutes of logging on, a new user could create time series plots of the established energy indicators for the two stores. The time series plots represent a very useful feature to master and one of the easiest features to use. Other features, such as store models, scatter plots, and the project viewer, were less intuitive. Our summary of the expected level of effort associated with adoption for two likely user groups is provided in Table 12.
TABLE 12. TRAINING REQUIREMENT BY USER TYPE
Light User Advanced User
Sample user Supermarket chain manager Consultant or Trained Specialist
• Create summary reports • Perform benchmarking of stores and
systems • Define and analyze projects • Track project performance
Training 1 hour 1 day + ongoing ‘help line’ support
In some cases, where we found a feature difficult to use, a call to the software vendor revealed that the feature was still under construction. This observation leads to two findings. One, our comments on usability should be considered preliminary, as the EIS Software was under development throughout the project. And two, having a help line through which we could quickly obtain answers about use of the software’s various features was essential.
Ultimately, the ease of adoption of the EIS Software depends on the user’s familiarity with energy information and the intended use of the software. The supermarket chain’s managers indicated that they would prefer to receive simple reports and summary views. These could be available to those users through a few simple mouse clicks, and very little training would be required for these light users.
An advanced user would have to analyze data and compile summary reports to support those light users. In most cases, this advanced user would probably be a consultant contracted by the software vendor or the supermarket to configure the EIS Software and perhaps to provide ongoing energy management using its tools. One to two days of training would probably suffice to bring consultants, already familiar with energy analysis, up to the level of advanced users.
7.4 SUMMARY OF BENEFITS AND BARRIERS This project began by posing research questions relating to the technology integration process, the experience of user adoption, and the EIS Software’s capabilities for identifying
31
PG&E’s Emerging Technologies Program
project opportunities and supporting implementation. The following discussions of benefits and barriers begin with a summary of our findings relating to each research question.
7.4.1 BENEFITS
Research Questions Responses
What are the benefits of providing system-level energy information, relative to building-level information?
System-level benchmarking allowed us to flag poor performing systems that were not distinguishable in a whole-building view. Specific projects opportunities are also more likely to be remotely identified with system-level data, which may allow contractors to define projects with less time on site.
What are the potential energy efficiency and demand response benefits from providing supermarkets with the information needed to act on project opportunities?
The supermarket customer suggested that defining a list of project opportunities in the project viewer would allow them to evaluate and commit to more projects. In this evaluation, an energy analyst used the EIS Software to remotely identify some project opportunities to include in the Project Analyzer. However, additional onsite work would be needed to define those projects at the level of detail we believe to be required for the supermarket to act.
What are the potential cost savings and other benefits to a supermarket?
The most significant potential cost savings are those due to reduced energy expenditures from the projects that are identified and acted on. However, this assessment found that none of those cost savings would be achieved without effort by an energy analyst and contractors that is similar to the level of effort for projects unaided by the EIS Software.
Using the EIS Software, a supermarket manager can easily benchmarking building or system-level energy performance to focus further investigation on poorly performing stores or systems. Once setup and integration is complete, such comparisons are easier to perform using the EIS Software than by the standard practice, which is to create spreadsheets. Identifying poor performance, even without knowing the cause, is a benefit to supermarkets and utilities because it avoids wasting resources investigating stores that are performing well. Supermarket managers rarely have the time to investigate the causes of poor performance, so further investigation likely falls to a contractor.
For a contractor looking for energy saving opportunities, a centralized, easily-accessible repository of system-level data is very valuable. With minimal knowledge of a site, a contractor can use time series plots and scatter plots to estimate system energy intensities, to identify operational anomalies, to assess schedules, and to identify important drivers of energy use. Each of these is a valuable tool for defining energy efficiency projects and use of the EIS Software would allow contractors to identify projects with less time on site. Once projects are identified and their energy savings estimated by an engineer or analyst, they can be consistently defined in the EIS project viewer to compare their expected financial performance.
The summary of financial performance that is represented in the project viewer is of considerable value to supermarket managers and to the utility. With this information, utility incentives can be paired to cost effective projects and supermarket managers armed with the information they need to make an investment.
In addition to benchmarking and project investigation, the ability to track facility and project performance in the EIS Software could provide considerable benefit if a user dedicates the
32
PG&E’s Emerging Technologies Program
time required. Minimal time would be necessary for some simple applications, such as verifying that a new schedule has been implemented. At the facility or portfolio level, ongoing tracking could also help supermarkets to achieve goals for energy and environmental performance.
33
PG&E’s Emerging Technologies Program
7.4.2 BARRIERS
Research Questions Responses
• What information does a supermarket need to act on a specific project opportunity?
The supermarket requires a thorough description of the project and the financial performance information that can be calculated in the project viewer. Though this detail can be conveyed to decision makers through the EIS Software, it is still a manual process to generate the information. For most measures, onsite investigation will still be required to provide the necessary level of detail.
What are the setup and system integration costs?
Total setup and integration costs were approximately $76,000 for the two stores in this assessment. Increased scale and experience would reduce these costs considerably, but we still estimate per store costs of nearly $20,000 where submetering is not already present.
What are the specific challenges that must be overcome for setup and integration?
The difficulty of accessing operational data limits the feasibility of remote measure investigation. Even where data is available, simply coordinating multiple parties involved in gathering, transmitting and processing data is challenging. Time is needed for commissioning the system following integration to ensure that it was set up properly.
What are the barriers to adoption of the EIS Software by a supermarket?
The key barriers to adoption by the supermarket are the upfront costs, the need to assign a relatively skilled analyst to make use of the system, and the limited reporting capabilities. The customer emphasized their need for simple, automatically generated reports with actionable information.
There are several barriers to realizing the benefits of the EIS Software in the grocery sector. The first is the combination of a large upfront cost and difficult to quantifying benefits. Installing submeters and the automated communications needed to support the system-level data stream is expensive. Because these improvements do not directly reduce energy use, but rather facilitate energy reducing programs and projects, it is difficult to demonstrate their cost effectiveness. However, as the test stores demonstrate, some forward-thinking grocery businesses have already begun to explore system-level submetering. Where such submetering exists, there is little barrier to integrating system-level energy data in the EIS Software.
Another barrier to widespread use of the combined integration of energy and operational data at the system-level is the difficulty of accessing the operational data in existing systems. This difficulty arises both from the weakness of physical connections to the systems and the variety of access protocols. Even once accessed, the data from those operational controls is available in such a wide variety of formats that formatting it for use in the EIS Software is a time consuming task. Fortunately, some modern control systems have introduced a web interface, which reduces this barrier.
One clear message from the supermarket participants in this project was that they need simple and actionable information from the EIS Software, preferably tied to profit and loss statements. As currently configured, the EIS Software does not include the reporting or alerts that would present this information. Few supermarkets have staff with the time and the technical expertise to use the software to produce the information. Thus, a supermarket would generally need to contract a consultant familiar with energy analysis principles to use the software and provide the actionable information. Those consulting services would add to the cost of using the system.
34
PG&E’s Emerging Technologies Program
8 RECOMMENDATIONS This technology assessment examined the use of EIS Software, as part of an EIS, to support energy efficiency and demand response in the grocery sector. It focused on a particular application of this technology, using submetered, system-level energy and operational data. Given the current barriers, such as high cost of submetering, and the difficult to quantify benefits, we do not recommend program adoption of this particular application of the EIS Software in the grocery sector. The potential for grocery sector adoption is discussed in more detail in section 8.1.
This assessment did reveal many ways by which this type of technology could support energy efficiency projects and programs. Thus, we recommend further assessment of this, and related technologies, in different applications for different market sectors. Our recommendations for these further technology assessments are provided in section 8.2.
8.1 POTENTIAL FOR GROCERY SECTOR ADOPTION Overall, this technology assessment has found that implementation of the EIS Software with system-level data in the grocery sector currently has limited potential. The grocery sector is a particularly challenging market, where narrow profit margins prompt managers to seek cost effective projects with quick paybacks. Given the high cost of installing system-level metering and the current challenges of demonstrating cost effectiveness, only small scale deployment of this particular EIS Software solution appears practical in the near term. The suggested features of a small scale program to deploy the EIS Software with system-level data are show in Table 13.
TABLE 13. SUGGESTED FEATURES OF A SMALL SCALE PROGRAM
Target Market Stores with existing web-connected submetering
Software configuration Whole building and submeter energy data is tied to the EIS Software. If operational data is available in web-enabled controls, it is also integrated into the Software. Whole building and system-level performance metrics are created.
Benefits of the Software A consultant uses the Software and limited site investigations to identify and analyze energy efficiency projects. The projects are compiled in the project viewer for supermarket managers to view and select.
Incentives The utility pays initial fees for implementation of the EIS Software and consulting fees for project identification. The supermarket is then obligated to undertake all projects that meet certain financial criteria. Ongoing software licensing and maintenance fees are paid by the supermarket if they choose to continue using the service.
In the long term, as system-level metering becomes more common and the regulatory environment shifts to recognize the full benefits of energy management software, large scale deployment may be possible. In the meantime, a lighter solution, using only the building level meter data, could be broadly deployed to achieve a subset of the benefits observed in this technology assessment. The suggested features of a large scale program to deploy the EIS Software with whole building level data are show in Table 14.
35
PG&E’s Emerging Technologies Program
TABLE 14. SUGGESTED FEATURES OF A LARGE SCALE PROGRAM
Target Market Grocery store chains
Software configuration Whole building interval meter data is tied to the EIS Software and metrics of whole building performance are created.
Benefits of the Software Supermarket managers are able to monitor and compare the performance of stores using the EIS Software dashboard.
Incentives The utility pays the software vendor to create a standard design for the grocery sector. This service is then available to supermarkets at the cost of the EIS Software licensing. The EIS Software is used to channel stores to existing programs and incentives.
8.2 ASSESSMENT OF OTHER SECTORS AND APPROACHES This assessment identified many potential benefits of using an EIS to support energy efficiency projects and programs. Two ways of using the EIS in energy efficiency programs that we find particularly promising are: 1) to aid building audits and commissioning investigations, and 2) to streamline measurement and verification. Given the expense of adding meters to acquiring system-level data, we recommend exploring an EIS configuration that leverages the existing building-level energy data. Use of building-level data will sacrifice some of the EIS capability that was present in this assessment, but considerable benefits may still be had.
In summary, for a follow-up technology assessment, we recommend:
1. Identifying a software package with similar data visualization capabilities that also includes the ability to model baseline performance
2. Using existing data gathering for a portfolio of buildings, such as whole building interval data, to reduce setup and integration costs
3. Using benchmarking and analysis of energy data to streamline audits and RCx investigations in the portfolio of buildings
4. Carrying energy saving projects from identification through implementation and using the software to automate measurement and verification at the whole building level.
36
PG&E’s Emerging Technologies Program
APPENDIX A – PROCEDURES FOR DATA
INTEGRATION The differences between the actual process of the project and what the project partners believe to be a more likely scenario for market implementation are shown as the “Actual Pilot” and “Ideal Market” scenarios below. Where necessary, we have specified different Ideal Market scenarios for the older and newer stores, based on the differing capabilities of the existing systems. For most of the operational data collection at an older store we have specified a manual approach as being the Ideal Market scenario. However, given the labor-intensiveness of this process, it may be better characterized as a necessary work around, rather than an ideal scenario. The alternative, automated solution would be to install a new BAS at an older store, but this would considerably increase the hardware costs of the EIS implementation.
TABLE A1. WHOLE BUILDING DATA COLLECTION AT OLDER AND NEWER STORES
Actual Pilot Scenario Ideal Market Scenario Operations Data
Store Revenue Estimated Store provides to software vendor
Energy Costs Software vendor obtained directly from the utility Energy Data Meter Type Interval (electric); Mechanical (gas)
Data Quality 15 minute (electric); monthly (gas)
Method Software vendor obtained directly from the utility
TABLE A2. PROCESSES FOR COLLECTING SYSTEM-LEVEL ENERGY DATA IN THE ACTUAL PILOT AND IDEAL MARKET SCENARIOS
Actual Pilot Scenario Ideal Market Scenario Energy Data
Submeter Type Existing submetering with a data manager CTs with data loggers
Data Quality 15 minute interval Process PECI accessed the existing
submeters remotely through the data manager, downloaded data, and transmitted to the software vendor
Store installs submetering equipment and either downloads data and sends to the software vendor or installs a data manager to automate data transfer
TABLE A3. HVAC DATA COLLECTION AT THE OLDER STORE
older Store Actual Pilot Scenario Ideal Market Scenario Operations Data
Submeter Type Existing building automation system (BAS) Data Quality Unknown Consistent with energy data
Process
PECI's attempts to retrieve data from the existing BAS were not successful
Store downloads data manually at site from existing BAS, formats data, and transmits to the software vendor
37
PG&E’s Emerging Technologies Program
TABLE A4. HVAC DATA COLLECTION AT THE NEWER STORE
newer Store Actual Pilot Scenario Ideal Market Scenario Operations Data
Submeter Type Existing combination building automation system (BAS) and refrigeration system controller (RSC)
Data Quality 1 minute interval Consistent with energy data
Process
Existing BAS/RSC vendor accessed BAS/RSC remotely, downloaded data, and transmitted to PECI; PECI then transmitted to the software vendor
The software vendor accesses BAS/RSC remotely, downloads data, and formats data
TABLE A5. REFRIGERATION DATA COLLECTION AT THE OLDER STORE
older Store Actual Pilot Scenario Ideal Market Scenario Operations Data
Submeter Type Existing refrigeration system controller (RSC)
Data Quality 3-min interval data for 2-day periods Consistent with energy data
Method
PECI accessed the system remotely on a daily basis and downloaded as much data as possible; PECI then transmitted to the software vendor
Store downloads data manually at site from existing RSC, formats data, and transmits to the software vendor
TABLE A6. REFRIGERATION DATA COLLECTION AT THE NEWER STORE
newer Store Actual Pilot Scenario Ideal Market Scenario Operations Data Submeter Type
Existing combination building automation system (BAS) and refrigeration system controller (RSC)
Data Quality 1 minute interval Consistent with energy data
Method
Existing BAS/RSC vendor accessed BAS/RSC remotely, downloaded data, and transmitted to PECI; PECI then transmitted to the software vendor
The software vendor accesses BAS/RSC remotely, downloads data, and formats data
38
PG&E’s Emerging Technologies Program
REFERENCES CCC (California Commissioning Collaborative (2011). The Building Performance Tracking
Ceniceros, Bruce (2009). Insights and Questions: Customer Response to the Home Electricity Reports, Results from SMUD’s Normative Messaging Pilot, presentation at the Behavior Energy and Climate Change conference. www.stanford.edu/group/peec/cgi-bin/docs/events/2009/becc/presentations/2D%20Ceniceros.pdf
Constanzo, Mark et al (1986). Energy Conservation Behavior – The difficult path from information to action. American Psychologist, Volume 41, Issue 5.
CPUC (California Public Utilities Commission) (2009), Decision on Pacific Gas and Electric Company’s Proposed Upgrade to the Smartmeter Program. State of California, http://docs.cpuc.ca.gov/PUBLISHED/FINAL_DECISION/98486.htm.
Decanio, Stephen J., William E. Watkins (1998). Investment in Energy Efficiency: Do the Characteristics of Firms Matter? The Review of Economics and Statistics, Volume 80, Issue 1.
Energy Design Resources (2008), Design Brief: Demand Response. www.energydesignresources.com/resources/publications/design-briefs.aspx.
EVO (Efficiency Valuation Organization (2010). Concepts and Options for Determining Energy and Water Savings - Volume I. www.evo-world.org/.
Granderson, J, Piette, MA, Rosenblum, B, Hu, L et al. (2011). Energy Information Handbook: Applications for Energy-Efficient Building Operations. Lawrence Berkeley National Laboratory, LBNL-5272E.
Granderson, Jessica, M.A. Piette, G. Ghatikar, and P. Price. (2009). Building Energy Information Systems: State of Technology and User Case Studies. Lawrence Berkeley National Laboratory. LBNL-2899E.
Itron (2006). California Commercial End-Use Survey Results. Prepared for the California Energy Commission. http://capabilities.itron.com/CeusWeb/Default.aspx.
Jaffe, Adam B. and Robert N. Stavins (1994), The energy-efficiency gap: What does it mean? Energy Policy, Volume 22, Issue 10.
McCalley, L.T. (2006). From motivation and cognition theories to everyday applications and back again: the case of product-integrated information and feedback. Energy Policy, Volume 34, Issue 2.
Sinai, R. (2011). Empowering Customers With a Green Button. White House, www.whitehouse.gov/blog/2011/11/21/empowering-customers-green-button.