U.S. Department of the Interior U.S. Geological Survey Scientific Investigations Report 2015–5007 Prepared in cooperation with the Fond du Lac Band of Lake Superior Chippewa Assessment of Aquifer Properties, Evapotranspiration, and the Effects of Ditching in the Stoney Brook Watershed, Fond du Lac Reservation, Minnesota, 2006–9
Transcript
U.S. Department of the InteriorU.S. Geological Survey
Scientific Investigations Report 2015–5007
Prepared in cooperation with the Fond du Lac Band of Lake Superior Chippewa
Assessment of Aquifer Properties, Evapotranspiration, and the Effects of Ditching in the Stoney Brook Watershed, Fond du Lac Reservation, Minnesota, 2006–9
Cover. Northeast end of Rice Portage Lake, which is located in the Stoney Brook watershed. Photograph by Perry M. Jones, U.S. Geological Survey, August 22, 2005.
Assessment of Aquifer Properties, Evapotranspiration, and the Effects of Ditching in the Stoney Brook Watershed, Fond du Lac Reservation, Minnesota, 2006–9
By Perry M. Jones and Abigail A. Tomasek
Prepared in cooperation with the Fond du Lac Band of Lake Superior Chippewa
Scientific Investigations Report 2015–5007
U.S. Department of the InteriorU.S. Geological Survey
U.S. Department of the InteriorSALLY JEWELL, Secretary
U.S. Geological SurveySuzette M. Kimball, Acting Director
U.S. Geological Survey, Reston, Virginia: 2015
For more information on the USGS—the Federal source for science about the Earth, its natural and living resources, natural hazards, and the environment—visit http://www.usgs.gov or call 1–888–ASK–USGS.
For an overview of USGS information products, including maps, imagery, and publications, visit http://www.usgs.gov/pubprod/.
Any use of trade, firm, or product names is for descriptive purposes only and does not imply endorsement by the U.S. Government.
Although this information product, for the most part, is in the public domain, it also may contain copyrighted materials as noted in the text. Permission to reproduce copyrighted items must be secured from the copyright owner.
Suggested citation:Jones, P.M., and Tomasek, A.A., 2015, Assessment of aquifer properties, evapotranspiration, and the effects of ditch-ing in the Stoney Brook watershed, Fond du Lac Reservation, Minnesota, 2006–9: U.S. Geological Survey Scientific Investigations Report 2015–5007, 33 p., http://dx.doi.org/10.3133/sir20155007.
Purpose and Scope ..............................................................................................................................3Description of Study Area, Physiography, Hydrology, and Hydrogeology ..................................3
Methods of Study ...........................................................................................................................................6Hydrologic Monitoring .........................................................................................................................6Hydrologic and Hydrogeologic Analysis ...........................................................................................9
Specific Yield and Hydraulic Conductivity ...............................................................................9Groundwater Levels and Flow Direction ...............................................................................10Groundwater Recharge ............................................................................................................10
Evapotranspiration ....................................................................................................................12Assessment of Aquifer Properties and Evapotranspiration .................................................................13
Specific Yield and Hydraulic Conductivity ......................................................................................13Groundwater Levels and Flow Direction ........................................................................................14Groundwater Recharge .....................................................................................................................17
Evapotranspiration..............................................................................................................................21Effects of Ditching on Groundwater Resources, Recharge Estimation, and
Figures 1. Map showing location of study wells, precipitation gages, and streamgages,
Stoney Brook watershed, Minnesota ........................................................................................5 2. Map showing surficial geology of the Stoney Brook watershed, Minnesota ....................7 3. Map showing topography of the Stoney Brook watershed, Minnesota .............................8 4. Graph showing example of evapotranspiration estimation using White (1932)
and water levels in well 1, Stoney Brook watershed, Minnesota, July 2007 ....................13 5. Graphs showing well hydrographs for wells in the Stoney Brook watershed,
Minnesota, 2006–9 ......................................................................................................................15 6. Map showing water-table surface of the shallow groundwater, Stoney Brook
watershed, Minnesota ...............................................................................................................16 7. Graphs showing monthly recharge estimated by the RORA computer program for
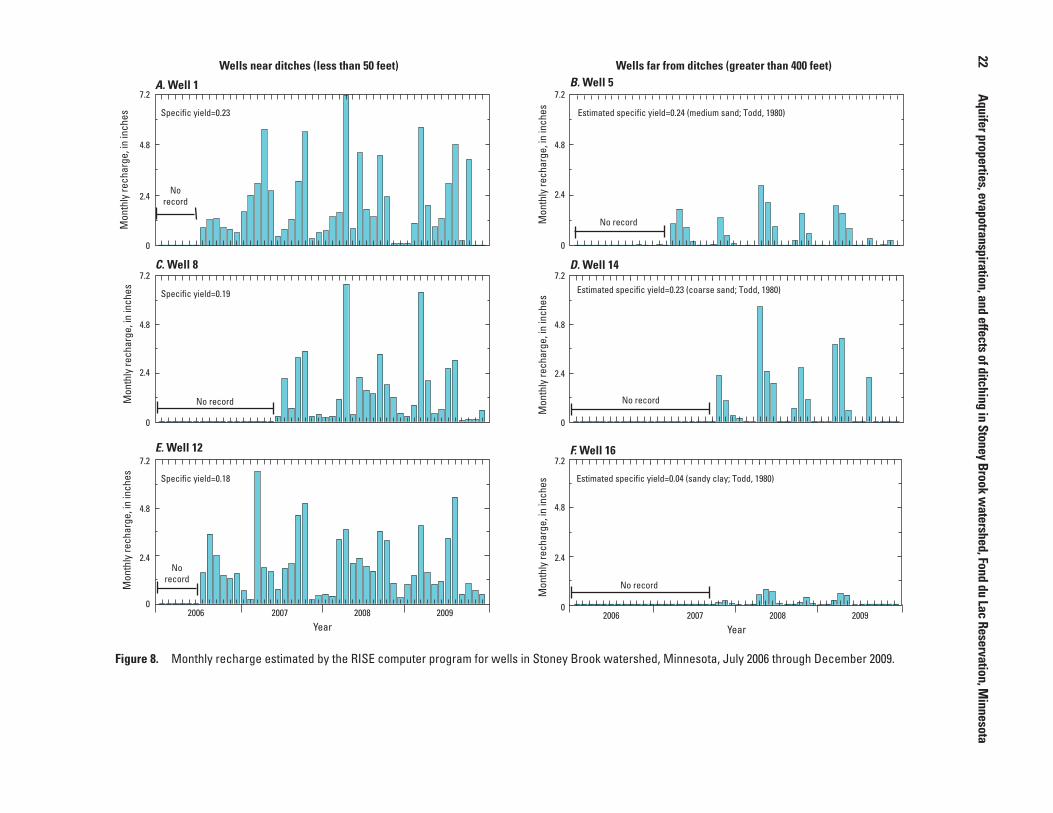
the Stoney Brook watershed, Minnesota, April 2006 through December 2009 ................19 8. Graphs showing monthly recharge estimated by the RISE computer program for
wells in Stoney Brook watershed, Minnesota, July 2006 through December 2009 .........22 9. Graphs showing daily evapotranspiration estimated from water levels in wells in
Stoney Brook watershed, Minnesota, with corresponding cloud cover ..........................24 10. Conceptual shallow groundwater flow to ditches under different hydrologic
Tables 1. U.S. Geological Survey wells, precipitation gages, test holes, and streamgage in
the Stoney Brook watershed, Minnesota .................................................................................4 2. Specific yield estimates for wells in Stoney Brook watershed, Minnesota .....................14 3. Hydraulic conductivities from slug tests done on wells in Stoney Brook
watershed, Minnesota ...............................................................................................................14 4. Seasonal and annual water-table recharge estimated by the RORA computer
program for the Stoney Brook watershed, Minnesota, April 2006 through December 2009 ............................................................................................................................18
5. Annual water-table recharge estimates from RISE computer program analysis, manual groundwater recession analysis, and master recession curve analysis of well hydrographs in Stoney Brook watershed, Minnesota, 2007–9 ...................................20
6. Daily evapotranspiration estimates and groundwater levels in wells in Stoney Brook watershed, Minnesota, for various days in 2006, 2007, 2008, and 2009 .................23
7. Monthly and annual potential evapotranspiration for Stoney Brook watershed, Minnesota, using the Thornthwaite-Mather method ..........................................................25
v
Conversion Factors[Inch/Pound to International System of Units]
Multiply By To obtainLength
inch (in.) 2.54 centimeter (cm)foot (ft) 0.3048 meter (m)mile (mi) 1.609 kilometer (km)
Areaacre 4,047 square meter (m2)square mile (mi2) 2.590 square kilometer (km2)
Flow ratefoot per day (ft/d) 0.3048 meter per day (m/d)cubic foot per second (ft3/s) 0.02832 cubic meter per second (m3/s)inch per day (in/d) 0.0254 meter per day (m/d)
Hydraulic conductivityfoot per day (ft/d) 0.3048 meter per day (m/d)
Temperature in degrees Celsius (°C) may be converted to degrees Fahrenheit (°F) as:
°F = (1.8 × °C) + 32.
DatumsVertical coordinate information is referenced to the North American Vertical Datum of 1988 (NAVD 88).
Horizontal coordinate information is referenced to the North American Datum of 1983 (NAD 83).
Altitude, as used in this report, refers to distance above the vertical datum.
Water year is the 12-month period of October 1 through September 30 designated by the calendar year in which it ends.
vi
Abbreviations® registered trademark
ET evapotranspiration
FDLGWSW Fond du Lac Groundwater Surface Water
FDL-RMD Fond du Lac Resource Management Division
MRC master recession curve
NOAA National Oceanic and Atmospheric Administration
NRCS U.S. Department of Agriculture’s Natural Resource Conservation Service
NWIS National Water Information System (U.S. Geological Survey database)
PET potential evapotranspiration
PVC polyvinyl chloride
USGS U.S. Geological Survey
Acknowledgments
The authors thank the Fond du Lac Band of Lake Superior Chippewa for their support and assis-tance with field aspects of the study. In particular, the authors thank Nancy Schuldt, Tom Howes, and Reggie De Foe, Fond du Lac Band Resources Management Program, for their assistance.
Mike Menheer, Wally Larson, John Greene, Matt Hammitt, Sheldon Misquadace, and Jeni-fer Bode of the U.S. Geological Survey are acknowledged for assistance with office and field aspects of the study. Tim Erickson, Jason Menard, and Chris Sanocki of the U.S. Geological Sur-vey are acknowledged for assistance with data analyses and graphics. The authors also thank Alan Knaeble, Minnesota Geological Survey, for his assistance in the geologic interpretation of the Stoney Brook watershed.
Assessment of Aquifer Properties, Evapotranspiration, and the Effects of Ditching in the Stoney Brook Watershed, Fond du Lac Reservation, Minnesota, 2006–9
By Perry M. Jones and Abigail A. Tomasek
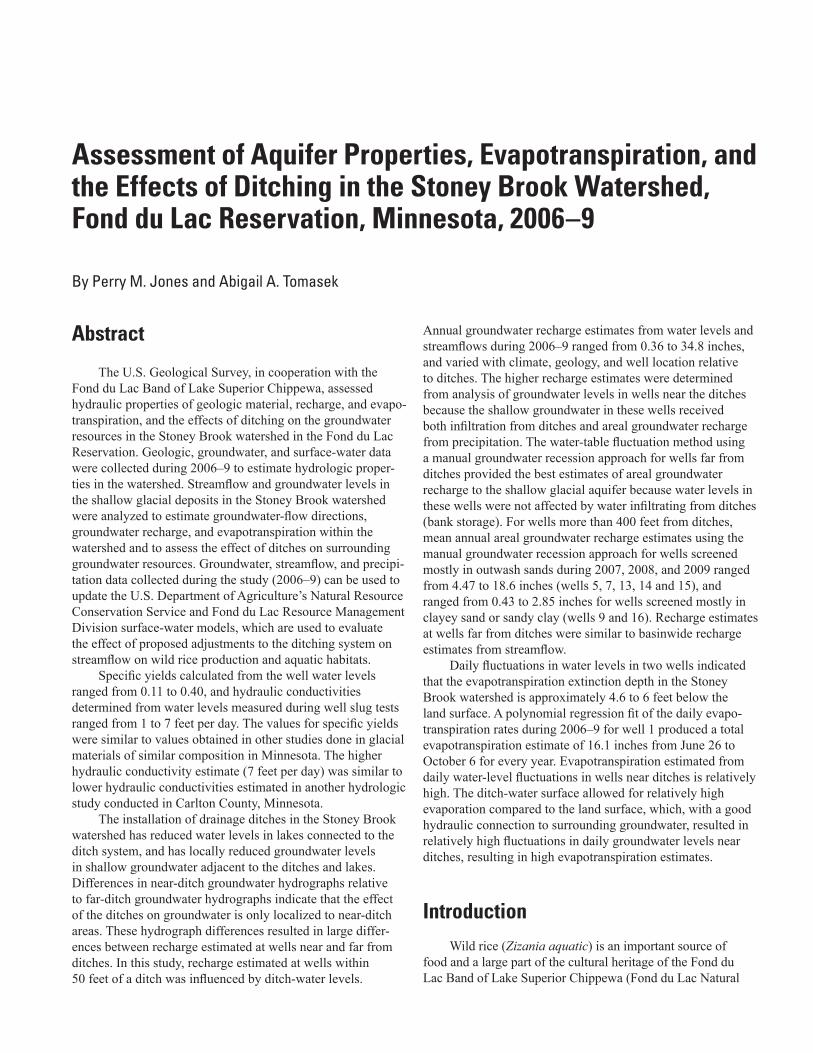
Abstract
The U.S. Geological Survey, in cooperation with the Fond du Lac Band of Lake Superior Chippewa, assessed hydraulic properties of geologic material, recharge, and evapotranspiration, and the effects of ditching on the groundwater resources in the Stoney Brook watershed in the Fond du Lac Reservation. Geologic, groundwater, and surface-water data were collected during 2006–9 to estimate hydrologic proper-ties in the watershed. Streamflow and groundwater levels in the shallow glacial deposits in the Stoney Brook watershed were analyzed to estimate groundwater-flow directions, groundwater recharge, and evapotranspiration within the watershed and to assess the effect of ditches on surrounding groundwater resources. Groundwater, streamflow, and precipi-tation data collected during the study (2006–9) can be used to update the U.S. Department of Agriculture’s Natural ResourceConservation Service and Fond du Lac Resource ManagementDivision surface-water models, which are used to evaluate the effect of proposed adjustments to the ditching system on streamflow on wild rice production and aquatic habitats.
Specific yields calculated from the well water levels ranged from 0.11 to 0.40, and hydraulic conductivities determined from water levels measured during well slug tests ranged from 1 to 7 feet per day. The values for specific yields were similar to values obtained in other studies done in glacialmaterials of similar composition in Minnesota. The higher hydraulic conductivity estimate (7 feet per day) was similar tolower hydraulic conductivities estimated in another hydrologistudy conducted in Carlton County, Minnesota.
The installation of drainage ditches in the Stoney Brook watershed has reduced water levels in lakes connected to the ditch system, and has locally reduced groundwater levels in shallow groundwater adjacent to the ditches and lakes. Differences in near-ditch groundwater hydrographs relative to far-ditch groundwater hydrographs indicate that the effect of the ditches on groundwater is only localized to near-ditch areas. These hydrograph differences resulted in large differ-ences between recharge estimated at wells near and far from ditches. In this study, recharge estimated at wells within 50 feet of a ditch was influenced by ditch-water levels.
-
c
Annual groundwater recharge estimates from water levels and streamflows during 2006–9 ranged from 0.36 to 34.8 inches, and varied with climate, geology, and well location relative to ditches. The higher recharge estimates were determined from analysis of groundwater levels in wells near the ditches because the shallow groundwater in these wells received both infiltration from ditches and areal groundwater recharge from precipitation. The water-table fluctuation method using a manual groundwater recession approach for wells far from ditches provided the best estimates of areal groundwater recharge to the shallow glacial aquifer because water levels in these wells were not affected by water infiltrating from ditches (bank storage). For wells more than 400 feet from ditches, mean annual areal groundwater recharge estimates using the manual groundwater recession approach for wells screened mostly in outwash sands during 2007, 2008, and 2009 ranged from 4.47 to 18.6 inches (wells 5, 7, 13, 14 and 15), and ranged from 0.43 to 2.85 inches for wells screened mostly in clayey sand or sandy clay (wells 9 and 16). Recharge estimates at wells far from ditches were similar to basinwide recharge estimates from streamflow.
Daily fluctuations in water levels in two wells indicated that the evapotranspiration extinction depth in the Stoney Brook watershed is approximately 4.6 to 6 feet below the land surface. A polynomial regression fit of the daily evapo-transpiration rates during 2006–9 for well 1 produced a total evapotranspiration estimate of 16.1 inches from June 26 to October 6 for every year. Evapotranspiration estimated from daily water-level fluctuations in wells near ditches is relatively high. The ditch-water surface allowed for relatively high evaporation compared to the land surface, which, with a good hydraulic connection to surrounding groundwater, resulted in relatively high fluctuations in daily groundwater levels near ditches, resulting in high evapotranspiration estimates.
IntroductionWild rice (Zizania aquatic) is an important source of
food and a large part of the cultural heritage of the Fond du Lac Band of Lake Superior Chippewa (Fond du Lac Natural
2 Aquifer properties, evapotranspiration, and effects of ditching in Stoney Brook watershed, Fond du Lac Reservation, Minnesota
Resources Program, 2013; Schwarzkopf and Defoe, 1999) and other members of the Minnesota Chippewa Tribe (Minne-sota Chippewa Tribe, 2013). The growth of wild rice often is affected by the water level of a lake or wetland, which can be effected by nearby ditching. The U.S. Geological Survey, in cooperation with the Fond du Lac Band of Lake Superior Chippewa, assessed hydraulic properties of geologic material, recharge, and evapotranspiration (ET) , and the effects of ditch-ing on the groundwater resources in the Stoney Brook water-shed in the Fond du Lac Reservation. Geologic, groundwater, and surface-water data were collected during the study (2006–9) can be used to update the U.S. Department of Agriculture’s Natural Resource Conservation Service (NRCS) and Fond du Lac Resource Management Division (FDL-RMD) surface-water models, which are used to evaluate the effect of proposed adjustments to the ditching system on streamflow, wild rice production, and aquatic habitats (Fond du Lac Environmental Department, 2010; U.S. Department of Agriculture, Natural Resources Conservation Service, 2013).
Wild rice is a native grass that forms dense stands and is harvested annually in wetlands and lakes across northern Minnesota (Oelke and others, 1982). Changes in water levels, including flooding, result in substantial changes in wild rice yields (Dukerschein and Langrehr, 2000; Stevenson and Lee, 1987), such as total crop loss (Vennum, 1988; Pip and Stepa-niuk, 1988). Wild rice grows best at shallow to moderate depths (1 to 3 feet [ft]) in areas containing soft, organic bottom sediments or clay to sandy loams, with steady water levels and clear water (1854 Treaty Authority, 2005). During the first 8 to 10 weeks of wild rice growth, stable water levels are needed to ensure vigorous plant growth (Zepp and others, 1996). Lakes and wetlands that receive a substantial amount of groundwater discharge tend to have higher and more stable water levels (Hunt and others, 1999), and, therefore, may produce more productive wild rice beds than lakes and wetlands that receive less groundwater discharge (Minnesota Department of Natural Resources, 2005; Thompson and Luthin, 2004).
The amount of groundwater discharge to wetlands can have a profound effect on wetland water-quality properties, such as pH, and constituents like major ions, metals, and nutrients (Carter, 1986; Nimmo and others, 2003; Hunt and others, 1997; Siegel, 1983), which can affect wild rice production (Painchaud and Archibold, 1990; Durkee Walker and others, 2010). Pills-bury and McGuire (2009) determined that wild rice growth in Wisconsin and Minnesota wetlands was optimal in waters with relatively low nitrogen (ammonia, nitrate) and phosphorus concentrations, and low pH at water depths generally less than 4 ft. Pastor and Durkee Walker (2006) demonstrated that the delay in the release of nutrients from decomposing litter and associated ecosystem processes can cause oscillations in wild rice populations. Preliminary results from wild rice studies conducted by the Minnesota Pollution Control Agency have indicated that sulfate and sulfide in sediment pore waters in wetlands can limit the ability of wild rice to grow, depending on their concentrations and the concentrations of iron present in waters (Minnesota Pollution Control Agency, 2014).
Water levels in closed-basin lakes and wetlands commonly are controlled by a balance between precipita-tion, the amount of groundwater discharge to the lake or wetland, and the ET from the watershed of the lake or wetland (LaBaugh and others, 1997; Winter, 1999; Winter and others, 2003). Wetlands with stable water levels depend on a relatively constant influx of groundwater throughout changing seasonal and annual climatic cycles (Alley and others, 1999). Groundwater discharge to lakes and wetlands varies with spatial and temporal changes in areal groundwa-ter recharge. Areal groundwater recharge is defined as the downward movement and entry of water into the saturated zone at the water table (Freeze and Cherry, 1979). Rates of groundwater recharge to shallow aquifers vary because of differences in hydrogeology, topographic setting, antecedent moisture conditions, and precipitation (Carter, 1996). The quantity and composition of peat in wetlands are important factors controlling the amount of groundwater discharge to northern Minnesota lakes, wetlands, and rivers (Winter, 1999; Siegel, 1992; Siegel and Glaser, 1987). Variations in ground-water recharge and ET rates can change groundwater levels, potentially changing groundwater-flow directions (Reeve and others, 2006) and groundwater discharge to lakes and wetlands (Rosenberry and LaBaugh, 2008). Rates of ground-water recharge to and ET from water-table aquifers have been estimated from daily fluctuations in water levels in wells during dry periods (Cowdery, 2004; Gerla, 1992; White, 1932; Rosenberry and Winter, 1997; Butler and others, 2007).
Drainage ditches, commonly installed in the early 1900s to dewater lands in wetland-dominated areas of northern Minnesota and the Great Lakes Basin for agriculture (Dahl, 1990), have decreased groundwater, lake, and wetland water levels (Wilcox and Whillans 1999; Bradof, 1992a), and resulted in losses of wild rice stands (Fond du Lac Natural Resources Program, 2013). In the United States, ditching in the Great Lakes Basin has resulted in an estimated 70-percent loss of wetland area (Detenbeck and others, 1999). Ditches established to reduce water levels in low-lying flat lands, lakes, and wetlands also can change groundwater-flow direc-tions (Boelter, 1972), resulting in decreases in groundwater discharge to lakes and wetlands. Ditching has altered runoff patterns, increased runoff, and increased beaver populations, which can greatly affect hydrology (Bradof, 1992b).
Ditches installed in the early 1900s on the Fond du Lac Reservation in northern Minnesota lowered lake water levels and caused greater lake-level fluctuations (Jacobsen, 2003; Schwarzkopf and Defoe, 1999). Rice Portage Lake on the reservation lost more than 80 percent of its original surface area, declining from 635 acres in the early 1900s to 114 acres in the late 1990s (Schwarzkopf and Defoe, 1999). These lower water levels with higher water-level fluctuations in lakes following precipitation after ditch installation resulted in lower wild rice production (Schwarzkopf and Defoe, 1999). In an effort to improve wild rice production, the Fond du Lac Band installed a system of water control structures and impoundments to restore the lakes to their original
elevations and hydrologic functions (Schwarzkopf and Defoe, 1999).
The effect of ditching on the groundwater hydrology of a watershed depends on properties of the ditching system, including ditch spacing, depth, orientation, and mainte-nance (Koivusalo and others, 2008), and on properties of the groundwater-flow system, such as hydraulic conductivity and storativity (specific yield) (Boelter, 1972). Boelter (1972) determined that the effect of ditching on local hydrology in northern Minnesota depended on the hydraulic properties of peat. Bradof (1992b) determined that the installation of ditches in the Red Lake peatlands of northern Minnesota resulted in water-table drawdown and reversals in groundwater-flow direction within 30 ft of the ditches.
An understanding of the effects of ditching on water levels in wild rice lakes and groundwater in the Fond du Lac Reservation is needed to assess the effectiveness of any water-level restoration plans for the lakes. The Fond du Lac Band is committed to restoring lake-water levels to those recorded before the construction of the judicial ditch system to improve wild rice production in lakes and attached wetlands. Judicial ditch systems are systems that were constructed under the State of Minnesota Judicial Ditch Law of 1909 (Minnesota Office of the Revisor of Statutes, 1910), which allowed indi-viduals to request district courts to order counties to construct ditches, at county expenses, to drain the individual’s land if the court was convinced that the land needed to be drained for agricultural or other purposes.
Purpose and Scope
This report describes the assessment of aquifer proper-ties and ET in the Stoney Brook watershed in the Fond du Lac Reservation and the effects of ditching on the shallow groundwater resources from 2006 to 2009. Groundwater recharge estimates, groundwater-flow directions, groundwa-ter specific yields, and ET estimates for the shallow glacial aquifer in the watershed were determined from analysis of groundwater levels, streamflow data, and precipita-tion data collected from 2006 to 2009. Sixteen wells and 12 precipitation gages (9 by USGS, table 1, fig. 1; 3 by FDL-RMD, fig. 1) were installed in 2006 and 2007 in the watershed to monitor groundwater levels and precipitation, and one streamgage was installed in 2005 in Stoney Brook to continuously monitor streamflow. Slug tests in 2 of the 16 wells were done to estimate the hydraulic conductiv-ity of the shallow glacial aquifer. The effects of ditching on the shallow glacial aquifer were assessed by comparing groundwater-level variability and recharge estimates between wells close to ditches and those far from ditches. Geologic variability within the study area also was considered in this analysis. Annual, seasonal, and daily ET were estimated from air temperature and daily groundwater-level fluctuations in wells, and compared to estimates determined in other hydro-logic studies in Minnesota.
Description of Study Area, Physiography, Hydrology, and Hydrogeology
The study area is located in the southern two-thirds of the Stoney Brook watershed in St. Louis and Carlton Counties, northeastern Minnesota (fig. 1). The eastern two-thirds of the Stoney Brook watershed is located on the Fond du Lac Band Reservation, whereas the southwestern part of the watershed is located within the Fond du Lac State Forest (fig. 1). The watershed area is 92.6 square miles (mi2) and contains five productive wild rice lakes (Perch, Jaskari, Rice Portage, Miller, and Dead Fish Lakes). In addition to wild rice production, the watershed is used for logging and hunting. The 30-year (1981–2010) normal annual precipitation from the National Oceanic and Atmospheric Administration (NOAA) weather station at Cloquet, Minnesota (NOAA station number MN211630, located approximately 8 miles [mi] east of the Stoney Brook watershed, fig. 1) was 31.83 inches (in.) (National Climatic Data Center, 2013). The mean annual ET for the Stoney Brook watershed between 1960 and 1970 was estimated to be approx-imately 18 in. (Baker and others, 1979; Lindhom and others, 1979; Sanford and Selnick, 2012). The watershed is part of the Laurentian Mixed Forest Province and occupies the western part of the Superior Upland (Vigil and others, 2000).
The surface-water hydrology of the Stoney Brook water-shed is complex, with 47 mi of ditches interacting with water from lakes, wetlands, streams, and groundwater (Fond du Lac Environmental Department, 2010). Approximately 54 percent of the watershed is covered by lakes and wetlands (fig. 1). Wetlands consist of forested (black spruce, tamarack, and black ash), scrub shrub (alder or willow dominant), and emer-gent wetlands (Fond du Lac Resource Management, 2008). Stoney Brook is the main stream in the watershed, flowing northeasterly and discharging to the St. Louis River. The natural course of Stoney Brook was altered by judicial ditch-ing (fig. 1) in the early 1900s (Fond du Lac Natural Resources Program, 2013). Forty-seven miles of judicial ditches were installed in an effort to reduce the amount of water present on the land surface for agricultural purposes (Jacobsen, 2003; Fond du Lac Environmental Department, 2010). Rice Portage Lake, Jaskari Lake, Miller Lake, Hardwood Lake, and Dead Fish Lake were connected to the judicial ditch system (fig. 1). After ditch installation, water levels in lakes and wetlands in the watershed fluctuated more following precipitation events, reducing wild rice production (Schwarzkopf and Defoe, 1999). This ditching had the largest effect on water levels in Rice Portage Lake, reducing its surface area from approximately 635 to 114 acres (Schwarzkopf and Defoe, 1999). Water-control structures (dams) have been installed at lake outlets where ditching intercepts the lakes to manage lake water-level fluctuations. In early spring and fall, water levels in northern lakes and wetlands are controlled by the amount of snowmelt, precipitation, and groundwater flow that occurs, whereas in late spring and summer, water levels are controlled by the amount of exchange with groundwater, surface-water evapora-tion, and ET from the adjacent land surface.
4 Aquifer properties, evapotranspiration, and effects of ditching in Stoney Brook watershed, Fond du Lac Reservation, Minnesota
Table 1. U.S. Geological Survey (USGS) wells, precipitation gages, test holes, and streamgage in the Stoney Brook watershed, Minnesota.
FDLGWSW12B State Forest - Precipitation 464412092452002 Precipitation gage 6 --
FDLGWSW17 Precip Gage at Berthiaume Rd. nr Brookston 464721092461701 Precipitation gage 1 --
FDLGWSW18 Precip Gage at Brandon Road nr Brookston, Minn. 464825092420301 Precipitation gage 2 --
Precip. Gage South of Spruce Lake near Sawyer, Minn. 464151092433301 Precipitation gage 3 --
FDLGWSW19 Precip gage W of Rice Portage nr Sawyer, Minn. 464221092425301 Precipitation gage 4 --
FDLGWSW20 049N18W06CCCC01 464506092404701 Test hole no. 1 --
FDLGWSW21 049N18W04CCCC01 464503092381801 Test hole no. 2 --
FDLGWSW22 049N19W02BDDA01 464542092424801 Test hole no. 3 --
FDLGWSW23 049N18W19BBAB01 464321092404001 Test hole no. 4 --
FDLGWSW24 049N18W06CAAB01 464536092402101 Test hole no. 5 --
Stoney Brook at Pine Drive near Brookston, Minn. 04021520 Open-channel flow streamgage --
Introduction 5
22
210
210
2
1
2
3, 46
7
8
9
10
11
12
13
1415
16
5
2
4
5
6
1
3
St. LouisRiver
Ston
ey
Broo
k
Martin Branch
Perch
LakeRice Portage Lake
Big Lake
MillerLake
Dead FishLake
Lost Lake
TwinLakes
TorchlightLake
HardwoodLake
JaskariLake
FON
D D
U L
AC
IND
IAN
RE
SER
VAT
ION
FOND DU LAC INDIAN RESERVATION
FOND DU LAC STATE FOREST
FON
D D
U L
AC
STA
TE
FO
RE
ST
BURLINGTON NORTHERN
RAILROAD
BURLINGTON NORTHERN RAILROAD
ST. LOUIS COUNTY
CARLTON COUNTY
MINNESOTAMINNESOTA
MapareaMaparea Cloquet
46˚40'
46˚45'
46˚50'
92˚50' 92˚45' 92˚40' 92˚35'T.51N.
T.50N.
T.49N.
T.48N.
R. 18 W.R. 19 W.R. 20 W.Base data from Minnesota Department of Natural Resources digital data, 1:24,000 and U.S. Geological Survey, 1:100,000Universal Transverse Mercator projection, Zone 15Horizontal coordinate information is referenced to the North American Datum of 1983 (NAD 83)
Continuous water-level well—Black number is site identifier, red number is number of wells 2
1
EXPLANATION
Minor roadsDitches
Wetlands—From U.S. Fish & Wildlife Service, 1994
Study area boundaryStoney Brook watershed
1Intermittant water-level well—Number
is site identifier
U.S. Geological Survey streamgage
Fond du Lac Reservation precipitation gage
1U.S. Geological Survey precipitation
gage—Number is site identifier
Fond du Lac Reservation streamgage
1.6 3.2 4.8 6.4 KILOMETERS0
41 2 3 MILES0
Figure 1. Location of study wells, precipitation gages, and streamgages, Stoney Brook watershed, Minnesota.
6 Aquifer properties, evapotranspiration, and effects of ditching in Stoney Brook watershed, Fond du Lac Reservation, Minnesota
The topography of the Stoney Brook watershed is formed by the surficial geology, with relatively flat peatlands in the central part of the watershed and bounded by higher suprag-lacial till, ice-contact, and outwash deposits to the northwest and east (Boerboom, 2009) (figs. 2 and 3). Holocene peat and other organic sediments cover approximately 40 percent of the watershed and 49 percent of the study area (fig. 2). Peat and Pleistocene glacial tills and outwash lie above the Thomson Formation of Early Proterozoic age, which is composed mostly of low permeability slate and greywacke (Boerboom, 2009). Pleistocene till and isolated outwash of the Indepen-dence Formation of the Rainy lobe underlie Pleistocene till, sand, and gravel complexes of the Cromwell Formation of the Superior lobe throughout most of the study area (Boerboom, 2009). Pleistocene till deposits cover approximately 47 percent of the watershed and 39 percent of the study area (fig. 2). Isolated Pleistocene outwash of the Cromwell and Barnum Formations deposited by the Superior lobe also are present throughout the watershed. Ice-contact deposits and kames of the Cromwell Formation are present southwest of Lost Lake (fig. 1). Outwash and ice-contact deposits cover 6 percent of the watershed and study area (fig. 2). Little is known about groundwater and groundwater/surface-water interactions among shallow aquifers, lakes, wetlands, and the ditch system in the Stoney Brook watershed. Shallow groundwater flow occurs in the Holocene peats and Pleistocene glacial outwash and tills (fig. 2), consisting of gravels, sands, and silts. These deposits form the shallow glacial aquifer in the study area. Residents in the watershed obtain their water from Quaternary buried glacial sand and gravel aquifers and from weathered parts of the Thomson Formation. Soils in the watershed consist of poorly drained organic material (peat, mucky peat, and muck), loamy sand, sandy loams, loamy till, and loams (U.S. Department of Agriculture, Soil Conservation Service, 1978). Maximum soil thicknesses are more than 6 ft.
Methods of StudyGroundwater levels, streamflow, and precipitation were
measured in the Stoney Brook watershed between 2006 and 2009 (fig. 1). These data were analyzed to estimate specific yield, hydraulic conductivity, groundwater-flow directions, groundwater recharge, and ET in shallow groundwater. Estimates of specific yield were determined by analyzing groundwater-level rises following precipitation events, and hydraulic conductivity was estimated from groundwater-level rises and recoveries from slug tests done in two wells. Shallow groundwater-flow directions were determined from a water-table surface interpolated from mean water levels in wells and lakes in the watershed. Annual and monthly groundwater recharges were estimated using streamflow recession and water-table fluctuation analyses. Groundwater-level responses to precipitation and groundwater recharge estimates were compared among the wells to assess the effect of the judicial
ditch system on surrounding groundwater. Daily ET from shallow groundwater was estimated for 70 periods of daily water-level fluctuations in four wells. A second-order poly-nomial trend line was fitted to daily ET estimates from one of the wells (well 1) to determine mean monthly and annual ET estimates for 2006–9. Well 1 was the only well that produced enough accurate daily ET estimates (31 days) throughout spring, summer, and fall to fit a trend line. These estimates were compared to annual and monthly potential ET estimated using the Thornthwaite-Mather method (Thornthwaite, 1948; Thornthwaite and Mather, 1957) with mean monthly air temperature.
Hydrologic Monitoring
Geologic, groundwater, and surface-water data were collected to estimate hydrologic properties in the watershed. These estimates were made using groundwater levels, stream-flow, and precipitation data collected during 2006–9. Stream-flow and precipitation data collected by USGS and FDL-RMD can be used by the Natural Resource Conservation Service and FDL-RMD to update a continuous hydrologic model for the Stoney Brook watershed. The model was used to better understand how to effectively restore water levels in the wild rice lakes and preserve the aquatic environment (U.S. Depart-ment of Agriculture, Natural Resources Conservation Service, 2013).
All groundwater-level, streamflow, precipitation, and geologic boring data collected by the USGS are stored in the USGS National Water Information System (NWIS) database (U.S. Geological Survey, 2015). Streamflow and precipitation data collected by FDL-RMD (fig. 1) were used in hydrologic models used to evaluate the effects of potential changes in surface-water discharge associated with ditch adjustments, but were not used in this study or stored in the USGS NWIS database.
Sixteen wells were installed by the USGS throughout the watershed between May 2006 and June 2007 in the study area to measure shallow groundwater levels (fig. 1; table 1). The wells were installed using auger drilling techniques outlined by Shuter and Teasdale (1989). Hollow-stem augers with an 8.25-in. inside diameter were used to drill the boreholes and collect 2-in.-diameter sediment cores during well installation. The sediment cores, supplemented with geologic descrip-tions made by the authors from cuttings during drilling, were used to log the geology of the boreholes. The wells were constructed of 2-in.-inside-diameter, schedule 40, flush-threaded polyvinyl chloride (PVC) casing and 0.01-in.-slotted PVC screens set to intersect the water table. Screens were set at the water table to access shallow groundwater potentially affected by ditching. The wells were protected by a 6-in.-diameter, schedule 40 steel pipe set 3 ft into concrete, covered by a locking well cap. The annulus of each well was allowed to collapse around the screen to a height of 9 ft above the bottom of the screen. If aquifer material did not collapse to
Methods of Study 7
T.51N.
T.50N.
T.49N.
T.48N.
R. 18 W.R. 19 W.R. 20 W.
Perch
LakeRice Portage Lake
MillerLake
Dead FishLake
Lost Lake
TwinLakes
TorchlightLake
HardwoodLake
22
210
210
BURLINGTONNORTHERN
RAILROAD
BURLINGTON NORTHERN RAILROAD46˚40'
46˚45'
46˚50'
92˚50' 92˚45' 92˚40' 92˚35'
St. LouisRiver
Big Lake
Ston
eyBroo
k
MartinBranch
Qct
Qcc
Qct
Qhp
QaoQco
Qct
Qct
Qao
Qci Qcc
Qhp
Qhp
Qhp Qhp
Qco
Qct
QctQhp
QctQhp
Qcc
Qct
Qcc
Qhp
Qct
Qhp
QccQctQhp
Qcc
Qco
Qct
Qct
QhpQhp
Qct QccQcc
QctQcoQct
Qcc
QcoQct
Qcc
Qct
Qhp
Qco
Qct
Qhp
Qhp
Qcc
Qlo
Qct
QctQcoQct
QccQco
Qct
Qcc
Qct
Qhp
Qhp
Qco
Qcc
QctQct
Qcc
Qlo
QccQct
Qct
Qct
Qct
Qha
Qha
1
2
3,46
7
8
910
11
12
13
14
15
16
5
12
3
4
5
Base data from Minnesota Department of Natural Resources digital data, 1:24,000 and U.S. Geological Survey, 1:100,000Universal Transverse Mercator projection, Zone 15Horizontal coordinate information is referenced to the North American Datum of 1983 (NAD 83)
ST. LOUIS COUNTY
CARLTON COUNTY
MINNESOTAMINNESOTA
areaMapareaMap
EXPLANATION
Minor roadsDitches
Study area boundary
Stoney Brook watershed
Qcc—Till, sand and gravel complex
Qao—Outwash depositsQco—Outwash deposits
Qct—Till depositsQha—Flood-plain alluvium
Qhp—Peat and other organic sediments
Qlo—Outwash deposits
Holocene Pleistocene—Continued U.S. Geological Survey monitoring well—Number is site identifier, table 1
U.S. Geological Survey geologic test hole—Number is site identifier, table 1
Pleistocene
Qci—Ice-contact deposits
1
1
1.6 3.2 4.8 6.4 KILOMETERS0
41 2 3 MILES0 1:24,000 surficial geology data modified from Boerboom, 2009, plate 3
Figure 2. Surficial geology of the Stoney Brook watershed, Minnesota.
8 Aquifer properties, evapotranspiration, and effects of ditching in Stoney Brook watershed, Fond du Lac Reservation, Minnesota
Lakes
Perch
LakeRice Portage Lake
Big Lake
MillerLake
Dead FishLake
Lost Lake
Twin
TorchlightLake
HardwoodLake
210
210
22
U.S. Geological Survey monitoring well—Black number represents well number, table 1
U.S. Geological Survey geologic test hole—Red number represents test hole number, table 1
1
1
St. Louis River
Ston
ey
Broo
k
Martin
Branch
BURLINGTONNORTHERN
RAILROAD
1
2
3,4
6
7
8
9
10
11
12
13
14
15
16
5
1 2
3
4
5
BURLINGTON NORTHERN
RAILROAD
ST. LOUIS COUNTY
CARLTON COUNTY
MINNESOTAMINNESOTA
MapareaMaparea
Base data from Minnesota Department of Natural Resources digital data, 1:24,000 and U.S. Geological Survey, 1:100,000Universal Transverse Mercator projection, Zone 15Horizontal coordinate information is referenced to the North American Datum of 1983 (NAD 83)
EXPLANATION
Minor roadsDitches
Study area boundaryStoney Brook watershed
1.6 3.2 4.8 6.4 KILOMETERS0
41 2 3 MILES0
Land-surface elevations—In feet above North American Vertical Datum of 1988 (NAVD 88)
1,184 to 1,200
1,200.01 to 1,250
1,250.01 to 1,300
1,300.01 to 1,350
1,350.01 to 1,400
1,400.01 to 1,450
1,450.01 to 1,500
1,500.01 to 1,550
T.51N.
T.50N.
T.49N.
T.48N.
46˚40'
46˚45'
46˚50'
92˚50' 92˚45' 92˚40' 92˚35'
R. 18 W.R. 19 W.R. 20 W.
Figure 3. Topography of the Stoney Brook watershed, Minnesota.
Methods of Study 9
this depth, sand was added to the annulus. Wells were then sealed to the surface with bentonite grout. Wells were devel-oped with a submersible pump using overpumping techniques (Shuter and Teasdale, 1989).
Well sites were selected to (1) assess the variety of shallow groundwater conditions present in the watershed, (2) be accessible, and (3) provide an even spatial distribu-tion throughout the watershed. Well depths ranged from 9.5 to 27.5 ft, with screen lengths ranging from 1.6 to 4.9 ft. The geologic material present in the screened intervals of the wells included peat and glacial gravel, sand, and silt. Pressure trans-ducers and data loggers were installed in 13 of the 16 wells (continuous water-level wells; fig. 1) to record groundwater levels every 30 minutes using methods described in Cunning-ham and Schalk (2011). Groundwater levels were periodically measured in the other three wells using an electrical tape to the nearest 0.01 ft (Cunningham and Schalk, 2011). The pressure transducers were periodically calibrated by measuring water levels in the wells to the nearest 0.01 ft using an electrical tape. The Minnesota Geologic Survey used geologic logs for the wells and other geologic information to construct a surfi-cial geology map for Carlton County and the southern part of St. Louis County, including most of the Stoney Brook water-shed (fig. 2) (Boerboom, 2009).
Geologic information was collected from five shallow test holes to determine the geology of shallow glacial deposits in areas where no wells were installed or existing geologic information existed (fig. 2, table 1). The test holes ranged in depth from 1.5 to 8.8 ft below the land surface. Peat, glacial till, and outwash sand were collected from the boreholes using a hand soil auger. Geologic logs for the wells and test holes are stored in the USGS NWIS database and are available upon request from the USGS Minnesota Water Science Center, Mounds View, Minn.
A streamgage (USGS site number 04021520) was installed on May 26, 2005, in Stoney Brook southeast of Lost Lake (fig. 1) to record continuous streamflow using methods described in Rantz and others (1982). As of January 2015, the streamgage continues to operate (U.S. Geological Survey, 2015). Stream stage heights are measured every 15 minutes. Streamflow is calculated from stream stage using a flow/stage rating curve, which was developed for the streamgage from stream-discharge measurements (Rantz and others, 1982). Estimates of streamflow were made during periods of backwa-ter resulting from winter ice or beaver activity using discharge measurements, plots of gage height, temperature data from nearby precipitation gages, and hydrologic comparison with nearby streamgages.
Twelve precipitation gages were installed throughout the watershed (fig. 1; table 1). Total precipitation at each gage was recorded every 30 minutes in the spring, summer, and fall. These gages were tipping-bucket gages operated at various times between 2005 and 2009 by USGS or FDL-RMD.
Hydrologic and Hydrogeologic Analysis
Groundwater levels and streamflow collected between March 2006 and December 2009 were used to estimate specific yield, hydraulic conductivity, groundwater-flow direc-tion, groundwater recharge, and ET for shallow groundwater in the Stoney Brook watershed. Groundwater recharge is an important hydrologic variable for any hydrologic model, and local and basinwide values can be estimated using a variety of approaches (Healy, 2010). In this study, three approaches were used and compared to estimate local recharge using ground-water levels, and one approach was used to estimate basinwide recharge using streamflow.
Specific Yield and Hydraulic ConductivitySpecific yield estimates were needed to determine
groundwater recharge using the water-table fluctuation method (Healy, 2010) and to estimate ET from groundwater levels. Specific yield is the volume of water that an unconfined aquifer releases from storage per unit surface area of aquifer per unit decline in the water table (Freeze and Cherry, 1979). Specific yield can vary with (1) soil properties, (2) anteced-ent soil moisture content, (3) the depth to the water table, (4) the time between groundwater-level rises, (5) duration and intensity of rainfall, (6) changes in atmospheric pressure, and (7) the presence of entrapped air (Gerla, 1992; Healy and Cook, 2002; Loheide and others, 2005; Scanlon and others, 2002). Specific yields used in equations following the White (1932) method tend to produce higher estimates of groundwa-ter recharge and ET compared to estimates made using other methods (Gillham, 1984; Gerla, 1992).
Meyboom (1967) recommended using a “readily avail-able” specific yield value instead of specific yield to deter-mine groundwater recharge and ET rates. “Readily available” specific yield is the amount of water that is released from the vadose zone during diurnal fluctuation (Loheide and others, 2005). “Readily available” specific yield (hereafter referred to as “specific yield”) was estimated by dividing the amount of infiltrated precipitation by the resulting groundwater rise as described by Gerla (1992). It was assumed that infiltrated precipitation equaled the amount of precipitation measured at the gages because the gages measured precipitation close to the ground surface and the water table was shallow in the watershed. Loheide and others (2005) stated that this is a reasonable method for calculating specific yield in wetlands because the moisture content in the vadose zone is high, the water table is shallow, and overland flow is negligible or quantifiable.
Specific yield was determined for precipitation events during the spring, summer, and fall periods during the study. Mean specific yield for each well was calculated for all precipitation events for a well. Mean specific yields were used
10 Aquifer properties, evapotranspiration, and effects of ditching in Stoney Brook watershed, Fond du Lac Reservation, Minnesota
with groundwater hydrographs to estimate monthly groundwa-ter recharge and daily ET at 6 wells where water levels were continuously measured (wells 1, 2, 3, 7, 8, and 12, figs. 1, 2). The groundwater levels in the other seven continuous water-level wells (wells 4, 5, 9, 13, 14, 15, and 16, figs. 1, 2) were not analyzed for specific yield because (1) groundwater levels responded too slowly to precipitation events, or (2) the record was too “noisy” to provide reliable estimates of specific yield. Specific yield at these wells was estimated from geology and soil characteristics at the well site based on information in Todd (1980).
Slug tests were conducted on two wells (numbers 14, and 15, figs. 1, 2) far from any ditches to estimate the hydraulic conductivity of the shallow, unconfined glacial aquifer. For each slug test, 1.3 and 0.5 gallons of water were added to the well for the slug tests conducted in wells 14 and 15, respec-tively. Following water addition, the subsequent water-level recovery to static conditions was recorded. Water levels were measured using an electrical tape at 0.16- to 5-minute intervals. The water-level declines were analyzed using the Springer and Gelhar method (Springer and Gelhar, 1991) to produce estimates of hydraulic conductivity.
Groundwater Levels and Flow Direction
Groundwater levels among the wells were compared to assess their response relative to precipitation, distance from ditches, and geology. Mean groundwater levels in 15 of the 16 wells (excluding well 3) along with mean lake levels were used to construct a water-table surface map of the watershed. Mean water levels were calculated for continuous water-level wells and three lakes from water levels collected between January 2007 and December 2008. The lake levels were collected periodically by FDL-RMD for Miller Lake, Rice Portage Lake, and Dead Fish Lake. Water levels of wetlands were not used to construct the water-table surface map because the hydraulic connection between the wetlands and shallow groundwater was unknown through most of the watershed.
Groundwater Recharge
Monthly groundwater recharge was estimated using two sets of data: (1) daily streamflow data from the Stoney Brook streamgage from April 2006 to December 2009 and (2) changes in groundwater levels in continuous water-level wells following recharge events (snowmelt and storms) from July 2006 to December 2009. Streamflow recession during base flow was analyzed using the RORA computer program, a program that produces annual and monthly estimates of groundwater recharge from a water-level hydrograph (Rutledge, 1998; Rutledge, 2000). The water-table fluctuation method was used to estimate recharge following precipitation using three different approaches described in the subsequent section “Water-Table Fluctuation Analysis.”
Streamflow-Recession AnalysisThe RORA program uses a recession-curve displace-
ment method to estimate groundwater recharge on a watershed scale using streamflow (Rorabaugh, 1964; Rutledge, 2007). The recession-curve displacement method estimates recharge for each peak in a streamflow record (Rutledge, 2007). The RORA program uses a median recession index of a streamflow record to estimate groundwater recharge after each precipita-tion event. The recession index for a recession period is the time required for groundwater discharge to recede by one log cycle after the recession becomes linear on a semilog hydrograph (Rutledge, 1998; Rutledge, 2007). The RECESS computer program (Rutledge, 1998), a program that deter-mines a median recession index from water-level hydrographs, was used to determine a median recession index from daily streamflow at the Stoney Brook streamgage. The RECESS and RORA programs require a continuous record of daily average flow for the duration of evaluation. To meet this requirement, streamflow was linearly interpolated to estimate three missing daily values for the entire 4-year record.
The RECESS program was run using daily streamflow data to determine recession indexes for recessions of at least 7 days in duration at the Stoney Brook streamgage. The 7-day minimum duration was chosen to ensure that the recession periods were long enough to represent periods of base flow but short enough to provide enough recession periods to calculate a representative median recession index. Each 7-day minimum recession was evaluated for log-normal linearity, trends in streamflow at nearby streamgages before and after the regres-sion, and precipitation to ensure that each recession was a true period of recession between precipitation events. Recession indexes were determined for each of the selected recessions and plotted in relation to log streamflow to determine extreme outliers. Outliers were eliminated from the analysis if there were explanations for their large variation, such as prolonged periods of slight precipitation. A median recession index was calculated from the resulting set of recession indexes.
The drainage area, mean daily streamflow, and median recession index at the Stoney Brook streamgage were entered into the RORA program to produce monthly estimates of groundwater recharge in the watershed. The RORA program was used to (1) identify the segments of the streamflow record that represent groundwater discharge, (2) identify recharge events, and (3) extrapolate procedures for determining recharge (Rutledge, 2007). The drainage area of the Stoney Brook watershed above the streamgage (101 mi2) was used to specify the part of the stream-discharge record that represents groundwater discharge using the following equation:
N = A0.2 (1)
where N is the number of days following peak flow at
which streamflow is assumed to represent groundwater discharge, and
A is the drainage area, in square miles.
Methods of Study 11
The RORA program identifies all of the streamflow peaks and calculates recharge following each peak (event) using the following equation:
R = 2 (Q2 – Q1) K / 2.3026 (2)
where R is the total volume of recharge, in cubic feet; Q1 is the groundwater discharge at the critical
time determined from the streamflow recession preceding the event, in cubic feet per day;
Q2 is the groundwater discharge at the critical time determined from the streamflow recession following the event, in cubic feet per day; and
K is the median recession index, in days per log cycle.
Errors in the recharge estimate for each event can occur because a linear recession may not be an appropriate represen-tation of groundwater discharge for that single event, or the end of the recession period may not contain all of the ground-water recharge from that event; therefore, monthly recharge estimates were determined by summing the recharge from all of the events during each month and comparing the basinwide estimates to monthly recharge estimates determined from the water-table fluctuation method.
Water-Table Fluctuation AnalysisThe water-table fluctuation method was used to estimate
annual and monthly groundwater recharge from July 2006 to December 2009 at 12 of the 13 continuously monitored wells in the Stoney Brook watershed. The water-table fluctuation method was applied using three approaches: (1) the RISE computer program (A. Rutledge, U.S. Geological Survey, oral and written commun., 2005; Delin and others, 2007), (2) manual extrapolations of groundwater recessions follow-ing each precipitation event (Healy and Cook, 2002), and (3) development of a master recession curve (MRC) for each well (Delin and others, 2007). The RISE program simply uses a total rise in groundwater level following a precipitation event to estimate recharge, whereas the other two approaches (manual and MRC approaches) determine differences between the peak groundwater level and the projected groundwater level had the precipitation event not occurred (Healy and Cook, 2002; Delin and others, 2007).
Using the water-table fluctuation method, groundwater recharge is calculated using the following equation:
(3)
where R(tj) is the recharge at time tj, in inches; Sy is the specific yield, dimensionless; and ΔH(tj) is the peak groundwater-level change for a
single event at time (tj), in inches.
This water-table fluctuation method assumes that (1) the groundwater hydrograph depicts only natural water-table fluctuations caused by recharge and discharge; (2) specific yield is constant during a water-table fluctuation; and (3) water-level recessions before recharge can be extrapolated to find the change in peak groundwater-level change, ΔH(tj). The water-table fluctuation method produces the best estimates of recharge when used during short time periods, in areas of shallow groundwater, and where the groundwater hydrograph displays sharp rises and declines for recharge events (Scanlon and others, 2002).
The RISE program (A. Rutledge, U.S. Geological Survey, oral and written commun., 2005) determines daily groundwa-ter recharge from changes in daily mean groundwater levels. The program identifies recharge events, calculating the amount of daily groundwater rise for days when the mean groundwater levels are higher than the previous daily mean. Each ground-water rise for a well is numbered starting from the period of first rise and ending the first day groundwater levels are lower than the previous day. Total weekly, monthly, quarterly, and annual recharge estimates are calculated by the RISE program by summing the daily groundwater rises during the desired period, and multiplying the summed groundwater rise by the specific yield. This method was used to calculate monthly recharge estimates for 12 of the 13 continuously monitored wells in the Stoney Brook watershed. The groundwater levels for wells 5, 9, 13, 14, 15, and 16 (fig. 1) were “noisy,” with many minor fluctuations occurring before and follow-ing precipitation events at consistent and inconsistent time intervals. These minor fluctuations could be caused by preci-sion errors in the pressure transducer, by clogging of the vent tubes or other reasons. The water levels in these records were smoothed before running the RISE program to prevent over-estimation of recharge. To smooth the water-level data, a fixed second-order polynomial smooth was applied in S-PLUS® (TIBCO Software, Inc., 2008) to the water levels on a 15-day interval to determine mean values (Wood and Hockens, 1970; Kessler and Lorenz, 2010). This smoothing reduced annual recharge estimates between 0.37 and 19 inches. The RISE approach likely underestimates the amount of recharge for each event because it does not take into account the projected groundwater recession during the period of groundwater rise, which the manual and MRC methods do take into account (Healy and Cook, 2002; Delin and others, 2007).
The manual approach used with the water-table fluctua-tion method involves determining the peak groundwater-level change, ΔH(tj), between the peak groundwater level and the groundwater recession curve at the time of the peak for each precipitation event (Delin and others, 2007). Recharge estimates from this method are somewhat subjective, varying with the chosen recession curves. This water-table fluctuation approach was applied to 12 of the 13 continuous water-level wells in the Stoney Brook watershed. As with the RISE approach, wells with “noisy” groundwater-level records (wells 5, 9, 13, 14, 15, and 16) were smoothed before applying the manual approach to improve the estimated groundwater rise caused by recharge.
R t Sy H tj j( ) = ( )*∆
12 Aquifer properties, evapotranspiration, and effects of ditching in Stoney Brook watershed, Fond du Lac Reservation, Minnesota
Similar to the RORA median recession index in the streamflow-recession analysis, the MRC approach involves determining an MRC for a well hydrograph and applying the MRC to all events in the hydrograph (Delin and others, 2007). For each precipitation event, the peak groundwater-level change, ΔH(tj), was determined by the difference between peak groundwater level and the MRC. The MRC approach requires a complete daily record of groundwater levels throughout a water year, so any missing groundwater levels were estimated using linear interpolation between measured groundwater levels. The USGS FALL program (A. Rutledge, U.S. Geological Survey, written commun., 2003) is a program that determines an MRC from a groundwater-level hydrograph using a user-specified recession duration. It was used to determine MRC for groundwater-level data from monitoring wells in the Stoney Brook watershed. Similar to the RORA streamflow-recession analyses, a 7-day minimum recession duration was chosen for all wells to ensure that the recession periods were long enough to represent periods of base flow and allow for enough recessions to accurately estimate an MRC. The program selects all groundwater reces-sion with a duration of at least 7 days. Each recession was manually inspected for linearity, groundwater-level trends in nearby wells, and precipitation events during the recession to ensure that selected recessions were acceptable for the MRC analysis. Acceptable recessions were used to determine an MRC for each of the well hydrographs. The statistical analy-sis software S-Plus® was used to find the MRC recession parameters of d and RR from the following nonlinear equation (Delin and others, 2007):
(4)
where Ht is the water level at the end of recession time
t, in feet; d is the water level at which no groundwater
discharge occurs, in feet; H0 is the water level at the start of the recession,
in feet; RR is the master recession rate (which is
negative), in feet per day; and t is the time at the end of the recession, in
days.For some wells, values for d and RR could not be
computed because the precision of the groundwater-level records were poor or the records were too “noisy.” In these cases, d was initially set as a value just lower than the minimum water level at the end of each recession, and a corre-sponding RR value was determined from equation 4 using that d value. For every groundwater-level rise from a precipitation or snowmelt event, the hydraulic head difference between the peak groundwater level and the projected pre-recharge water level (the MRC) at that date was determined and used in equation 3 as ΔH(tj) to estimate groundwater recharge. The MRC approach tends to overestimate the amount of recharge
because it accounts for all recharge indicated by water-table fluctuations, no matter how short in duration or magnitude (Delin and others, 2007).
EvapotranspirationEvapotranspiration from shallow groundwater can result
in daily water-level fluctuations in well hydrographs (White, 1932). In late spring, summer, and early fall, these daily water-level fluctuations often can be large enough to be measured in wells and used to estimate ET rates from shallow groundwater (Rosenberry and Winter, 1997; White, 1932).
The ET estimates were determined for the Stoney Brook watershed using two methods: (1) daily ET estimates from daily fluctuation in groundwater levels using the White method (White, 1932) and (2) monthly potential ET (PET) values using the Thornthwaite-Mather method (Thornth-waite, 1948; Thornthwaite and Mather, 1957). Daily ET was estimated from daily groundwater-level fluctuations during groundwater recession periods between precipitation events during spring, summer, and fall. The White method (White, 1932) uses groundwater levels to find daily ET values at indi-vidual sites using the following equation:
(5)
where ET is the evapotranspiration, in inches per day; Sy is the readily available specific yield,
dimensionless; r is the hourly rise in groundwater level
between midnight and 4 a.m., in inches; and
s is the daily change (rise or fall) in groundwater level, in inches.
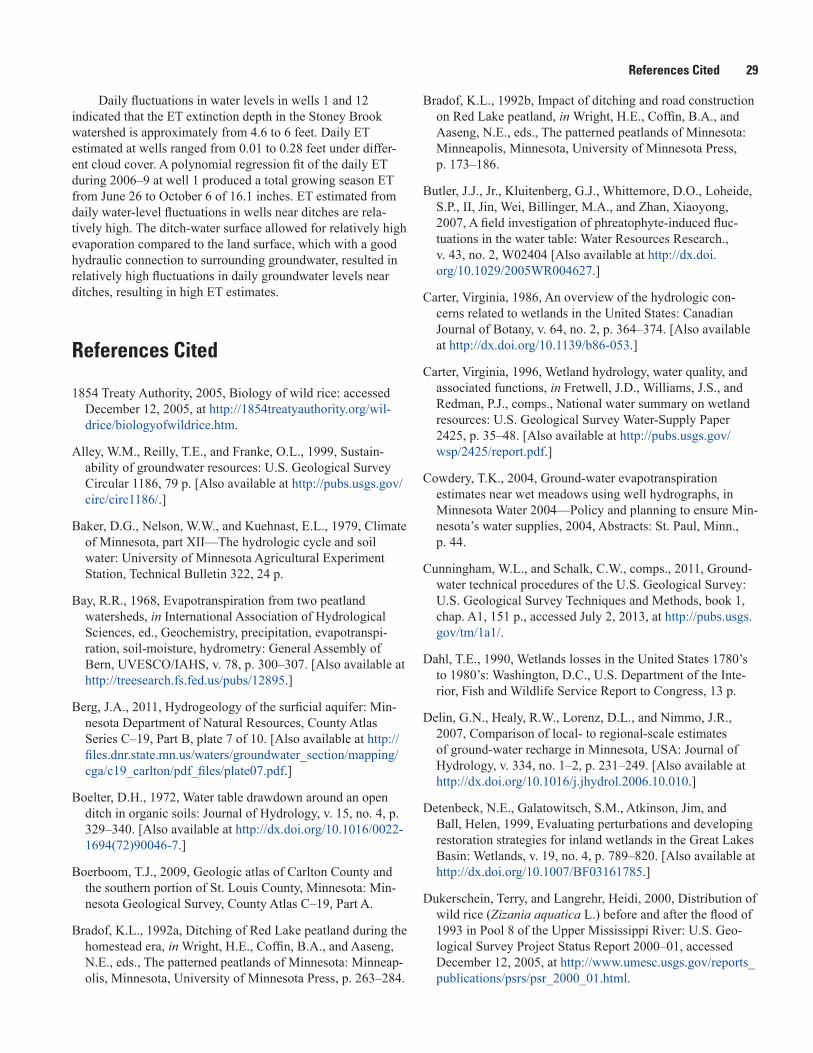
A graphical example of this hydrograph analysis for well 1 is shown in figure 4.
Daily groundwater-level change (s) was calculated using three different approaches: (1) groundwater-level changes from midnight one day to midnight of the next day; (2) the difference between groundwater-level peaks on consecutive days; and (3) the difference between minimum groundwater levels on consecutive days. A mean s determined from these three approaches was calculated for each day and used in equation 5 to calculate daily ET. Where consecutive daily ET values were calculated, daily r values for the period were averaged. Because r values are calculated during periods when plants are not transpiring, r values should be nearly identical for consecutive days if climatic conditions have not drastically changed (White, 1932).
Estimates of ET from groundwater-level changes will vary with the depth of the water table below the land surface and soil properties (Todd, 1980; Gerla, 1992). For the wells in the Stoney Brook watershed, daily groundwater-level fluc-tuations occurred when groundwater levels typically were less than 6 ft below the land surface. Of the 13 continuous
� ln H d ln H d RR tt−( ) = −( )+ ∗
0
ET Sy r s= ±( )� � �24
Assessment of Aquifer Properties and Evapotranspiration 13
water-level wells, daily groundwater-level fluctuations only were recorded in wells 1, 2, 4, and 12 because water levels in these wells were less than 6 ft below the land surface during groundwater recessions and precise enough to record daily variations caused by ET. Water levels in wells 2 and 4 often were too deep to indicate any daily fluctuations caused by ET; therefore, temporal trends in ET using the White method were determined for water levels at wells 1 and 12 only because ET estimates at wells 2 and 4 were too few to estimate temporal trends. Precision of the groundwater levels for wells 13, 14, and 15 was not high enough to determine accurate ET esti-mates. Daily groundwater-level fluctuations in well 8 were too small to estimate ET because the well is located in a large wetland, where the water table is at the land surface, and the well is screened in peat. Specific yield in peat typically is large and variable, and the volume of peat also changes with chang-ing water levels (Siegel, 1992). As a result, groundwater-level fluctuations in peat often are too complex to estimate ET.
An annual estimation of ET was calculated by summing daily ET estimates that were calculated using the White method at well 1. Daily ET values were plotted by date, and a second-order polynomial trend line (S-PLUS®, TIBCO Software, Inc., 2008) was fitted to the data. An annual ET value was determined by integration of the area under the trend line. This method also estimated the duration of ET from shallow ground-water in the area (where the trend line crossed the x-axis).
The Thornthwaite-Mather method estimates monthly PET for a site using monthly mean air temperatures (Thornthwaite, 1948). Monthly mean air temperatures for the NOAA weather station in Cloquet, Minn. (NOAA station number MN211630; Minnesota Climatology Working Group, 2013) were used to estimate the PET for the Stoney Brook watershed. The Thornthwaite-Mather method typically is used to find monthly values for ET (Thornthwaite and Mather, 1957); however, the method can be manipulated to calculate daily values using the following equation (Mather, 1978):
(6)
where PET is the potential evapotranspiration, in inches
per day; C is the correction factor for monthly sunshine
duration based on latitude; Ta is the air temperature, in degrees Celsius; I is the annual heat index
, in degrees Celsius; and
d is the number of days in the month.The calculated daily PET values from equation 6 were
summed for individual months and were similar to the monthly values calculated using the Thornthwaite-Mather equation. The sums of the daily PET values varied only from the monthly values when mean temperatures were below freezing and monthly PET is assumed to be zero.
Assessment of Aquifer Properties and Evapotranspiration
Groundwater hydrology of the Stoney Brook watershed is controlled by wetlands and surficial geology, and locally is controlled by constructed ditches in the watershed. This section provides results for specific yields, groundwater-recharge estimates, and ET estimates obtained from the well water-level analyses, and hydraulic conductivities obtained from slug-test analyses. Annual groundwater-recharge esti-mates varied with climate, geology, and proximity of wells to ditches. The mean annual ET estimate for 2006–9 from water-level analysis at well 1 amounts to 74 percent of the mean annual PET estimated from the Thornthwaite-Mather method for that period.
Specific Yield and Hydraulic Conductivity
Sixty-seven estimates of specific yield were determined from water levels in six wells (table 2). These estimates ranged from 0.10 to 0.40, with mean estimates at wells ranging from 0.18 to 0.23 (table 2). These mean values are similar to a range
Net daily change in water level
Hourly rate of groundwater and soil-waterinflux (water-level recovery) midnight to 4:00 a.m.
“Readily available” specific yield
Evapotransipiration = Sy (24r ± s)
EXPLANATION
4-Hour water-level recovery
Daily change in water level
ET
Syr
s
1,289.70
1,289.75
1,289.80
1,289.85
1,289.65
Wat
er le
vel,
in fe
et a
bove
Nor
th A
mer
ican
Ve
rtica
l Dat
um o
f 198
8 (N
AVD
88)
DatesJuly 15 July 16 July 17 July 18 July 19 July 20
rs
Figure 4. Example of evapotranspiration estimation using White (1932) and water levels in well 1, Stoney Brook watershed, Minnesota, July 2007.
PET CT
Ia
I I
=
∗ − ∗ + ∗− − −
1 610
6 75 10 7 71 10 1 79 107 3 5 2
.
. . . 22 0 492
1
2 54
I
d
+
.
.
( , ( / ) ).I i i Tai
= ==∑ 1
12 1 5145
14 Aquifer properties, evapotranspiration, and effects of ditching in Stoney Brook watershed, Fond du Lac Reservation, Minnesota
of values for the Stoney Brook watershed (0.16 to 0.25) esti-mated by Lorenz and Delin (2007) in a statewide assessment of recharge. Only one of these six wells (well 7) was located more than 50 ft from a ditch. The estimated specific yields for the sands in the screened interval of well 7 were similar to estimates at other wells (table 2).
Hydraulic conductivity estimates from slug tests conducted in wells 14 and 15 were 7 and 1 foot per day (ft/d) (table 3). The lowest hydraulic conductivity was estimated at well 15, which was screened in medium sand and sandy clay. The highest hydraulic conductivity was estimated at well 14, which was screened in coarse to very coarse sand (table 3). The highest estimate is similar to the lowest hydraulic conduc-tivities that Berg (2011) estimated based on six aquifer tests conducted in municipal and public supply wells screened in surficial sand aquifers in Carlton and southern St. Louis Coun-ties, which ranged from 8 to 50 ft/d. The hydraulic conductivi-ties estimated at well 14 likely represent the more permeable conditions in the watershed. Wells 14 and 15 were screened in outwash deposits (fig. 2; table 3), whereas tills and peat with low permeability are at land surface in most of the watershed (fig. 2).
Table 3. Hydraulic conductivities from slug tests done on wells in Stoney Brook watershed, Minnesota.
[ft/d, feet per day; m/d, meters per day]
Inaccuracies in these hydraulic conductivity estimates may have resulted from the use of a poured slug rather than a pneumatic or a solid slug during the tests. The use of a pneumatic or solid slug results a more instantaneous water-level rise in the well compared to a poured slug of water, which potentially results in a dampened response and greater error. An instantaneous water-level change is required for any slug test method, providing more accurate early water-level data following the maximum water-level rise during the test. Matching of both early and later water levels following the maximum water-level rise to slug test models is needed to accurately estimate hydraulic conductivity. Errors associ-ated with using a poured slug are reduced when using a small amount (less than 1 gallon) of water.
Small percent differences (less than 1 percent) between the measured and theoretical instantaneous water-level rises for the slug tests conducted in wells 14 and 15 suggest that the errors involved in using the poured slugs in these tests were small. Theoretical instantaneous water-level rises were calculated based on the volume of water added to the well, the well casing diameter, and the assumption that little water was leaving the well during the slug injection. The measured and theoretical instantaneous water-level rises in the slug test conducted in well 14 were 8.18 and 8.13 ft, respectively. The measured and theo-retical instantaneous water-level rises in the slug test conducted in well 15 were 2.20 and 2.19 ft, respectively.
Groundwater Levels and Flow Direction
The groundwater-level response to precipitation events varied across the watershed, primarily because of the proxim-ity of wells to ditches and varying geology. Water levels in the wells generally fluctuated within a range of 3–5 ft; water levels in most wells rose 1–2 ft during 2006–9 (fig. 5). The largest water-level range, approximately 5 ft, was in well 16, which was screened in brown sandy clay (fig. 5F). Water levels in wells located near the ditches (wells 1, 8, and 12) rose rapidly in response to precipitation and snowmelt (fig. 5A, C, and E). The rapid rise of these water levels was a response to water-level rises in nearby ditches and groundwater flow associated with areal groundwater recharge. Near ditches, large water-level rises followed snowmelt, whereas water-level rises in the summers were small (fig. 5A, C, and E). Water levels in wells far from the ditches (wells 5, 14, and 16) rose gradually following precipitation and snowmelt respond-ing to areal groundwater recharge (fig. 5B, D, and F).
Shallow groundwater flowed generally from the northwest to the east/southeast (fig. 6). The hydraulic gradient in shallow groundwater ranged from 0.0006 between wells 14 and 15 to 0.003 between wells 11 and 16 (figs. 1 and 6). Water-table contours for shallow groundwater are concave in the direction of flow in the main ditches northwest of Dead Fish Lake, indi-cating groundwater discharge to the ditches (fig. 6).
Table 2. Specific yield estimates for wells in Stoney Brook watershed, Minnesota.
Hydraulic conductivity Geology in well screen intervals(ft/d) (m/d)
14 05/30/2007 7 2 Coarse to very coarse sand.
15 06/08/2007 1 0.3 Medium sand and sandy clay.
Assessment of Aquifer Properties and Evapotranspiration
15
F. Well 16
Brown sandy clay
1,331
1,333
1,335
1,330
1,336
1,334
1,332
2006 2007 2008 2009
Year
E. Well 12
Fine to medium sand, some coarse
2006 2007 2008 2009
1,317
1,319
1,321
1,316
1,322
1,320
1,318
Year
D. Well 14
1,298
1,300
1,302
1,297
1,303
1,301
1,299
Coarse to very coarse sand
C. Well 8
1,288
1,290
1,294
1,287
1,293
1,291
1,289
Peat
A. Well 1
Fine to medium sand, some clayey intervals
1,289
1,291
1,293
1,288
1,294
1,292
1,290
B. Well 5
Medium to coarse sand
1,299
1,301
1,303
1,298
1,304
1,302
1,300
Wat
er le
vel,
in fe
et a
bove
Nor
th A
mer
ican
Ver
tical
Dat
um o
f 198
8 (N
AVD
88)
Wells near ditches Wells far from ditches
Figure 5. Well hydrographs for wells in the Stoney Brook watershed, Minnesota, 2006–9.
16 Aquifer properties, evapotranspiration, and effects of ditching in Stoney Brook watershed, Fond du Lac Reservation, Minnesota
Rice PortageLake
Big Lake
MillerLake
Dead FishLake
Lost Lake
HardwoodLake
1,300
1,305
1,310
1,295
1,31
51,
320
1,290
1,32
51,
330
1,299.7
1,306.3
1,292.5
1,332.7
1,309.2
1,318.9 1,311.1
1,289.3
1,288.2
1,291.1
1,290.7
1,292.6
1,296.2
1,288.7
1,301.1
10
11
6
4
16
9
8
13
2
14
15
5
12
1
7
1,292.1
1,288.2
ST. LOUIS COUNTYCARLTON COUNTY
EXPLANATION
Monitoring well—Red number is site identifier, black number is meanwater level between January 2007 and December 2008, in feet above North American Vertical Datum 1988
Minor roadsDitches
Study area boundaryStoney Brook watershed
21,291.1
Wetlands—From U.S. Fish & Wildlife Service, 1994
Base data from Minnesota Department of Natural Resources digital data, 1:24,000 and U.S. Geological Survey, 1:100,000Universal Transverse Mercator projection, Zone 15Horizontal coordinate information is referenced to the North American Datum of 1983 (NAD 83)
Potentiometric contours—Shows altitude at which water would have stood in tightly cased, nonpumping wells. Contour interval is 5 feet. Altitude is referenced to the North American Vertical Datum of 1988
Groundwater flow—Arrow indicates direction of groundwater flow
Lake—Green number is mean water level between January 2007 and December 2008, in feet above North American Vertical Datum of 1988
0 1.6 3.2 KILOMETERS
1 2 MILES0
1,315
1,292.1
46˚46'
46˚48'
46˚44'
46˚42'
46˚40'
92˚46' 92˚40'92˚44' 92˚42' 92˚38'
MINNESOTAMINNESOTA
areaMap
Figure 6. Water-table surface of the shallow groundwater, Stoney Brook watershed, Minnesota.
Assessment of Aquifer Properties and Evapotranspiration 17
Groundwater Recharge
Groundwater recharge determined from water levels in wells in the Stoney Brook watershed varied with precipita-tion, geologic materials, and proximity of wells to ditches. In this study, recharges estimated at wells within 50 feet of a ditch were influenced by ditch-water levels. The amount and percentage of total precipitation areally recharging shallow groundwater generally increased from 2006 to 2009, result-ing in groundwater-level rises. Below-normal precipitation in 2006, 2007, and 2008 (National Climatic Data Center, 2013) caused smaller-than-normal groundwater recharge and low groundwater levels that gradually rose. Recharge estimates from groundwater-level analysis for wells close to the ditches are large because water levels in those wells rose in response to water inflow from the ditches as well as areal groundwater recharge following precipitation. Recharge estimates at wells far from ditches were similar to basinwide recharge estimates from streamflow.
Streamflow-Recession AnalysisBasinwide annual recharge, determined by the stream-
flow-recession analysis using the RORA program, increased from 2.21 in. in 2006 to 8.47 in. in 2009 (table 4). The increase in recharge from 2006 to 2009 corresponded to a rise in total annual precipitation (table 4), and resulted in an overall rise in groundwater levels in wells (fig. 5). Estimates of annual areal recharge to shallow groundwater for 2006 and 2007 of 2.21 and 4.64 in., respectively, were lower than estimates for 2008 and 2009. Mean annual recharge for the Stoney Brook watershed from a statewide recharge map for Minnesota developed by Lorenz and Delin (2007) ranged from 7.9 to 11.8 in. The low recharge in 2006 and 2007 was likely because of below normal annual precipitation (table 4). The total annual 2006 and 2007 precipitation for the NOAA weather station at Cloquet, Minn. (NOAA station number MN211630) departed from normal by 10.17 and 4.87 in., respectively, being lower than the 30-year (1981–2010) annual normal precipitation of 31.83 in. for the station (table 4). Total annual precipitation for 2008 also was less than the 30-year (1981–2010) annual normal precipitation by 2.72 in.; however, annual recharge was large (8.18 in.) because spring (April–June) recharge (4.82 in.) was large, associated with a large amount of over-winter snowfall and spring rain (table 4). The percentage of annual total precipitation that recharged the shallow aquifer ranged from 11 percent in 2006 to 28 percent in 2008 (table 4).
Monthly basinwide, areal groundwater recharge ranged from 0.00 to 3.16 in. from April 2006 through December 2009 (fig. 7). This range is similar to monthly recharge estimates made by Nichols and Verry (2001) for forested watersheds in north-central Minnesota between 1987 and 1991. The monthly recharge was bimodally distributed, with high recharge in spring and fall in each year except 2006, when little fall precipitation occurred (fig. 7). This bimodal groundwater
recharge distribution commonly occurs in Minnesota (Baker and others, 1979). The highest monthly recharge in the Stoney Brook watershed was in the spring (April, May, and June) for each year, augmented by snowmelt, whereas the lowest monthly recharge was in the summers and winters, with the exception of winters 2007 and 2009 (fig. 7; table 4). The percentage of total precipitation that recharged the shallow groundwater was the highest in the spring of 2006, 2007, and 2008 (table 4), and lowest in the summers. The highest monthly recharge occurred in April 2008 following a large snowmelt and total spring precipitation (fig. 7).
Water-Table Fluctuation AnalysisAnnual local groundwater recharge estimates for 2007,
2008, and 2009 determined using well hydrographs varied depending on the analytical method, the proximity of wells to ditches, and the geologic materials at the wells. Annual local recharge estimated by the three approaches described earlier ranged from 0.36 to 34.8 in. (table 5). Recharge for wells 1 and 2 was largest using the MRC approach and smallest based on the RISE program (table 5). The RISE estimates should be smaller because this approach calculates the total groundwa-ter-level rise following precipitation to estimate recharge, not accounting for continued groundwater-level declines had the recharge not occurred.
Larger annual recharge was estimated for wells located near (less than 50 ft) ditches or screened in sandy mate-rial (wells 1, 2, 3, and 12) than for wells far (greater than 400 ft) from ditches or screened in peat (fig. 1; table 5). For example, the lowest recharges were estimated from wells 9 and 16, which are located more than 1,000 ft from a ditch and screened in clay-rich sediments (table 5). The highest recharge estimated was higher than estimates made by Lorenz and Delin (2007) (7.9 to 11.8 in.) for the Stoney Brook watershed as part of a statewide recharge assessment for Minnesota and higher than those estimated by Nichols and Verry (2001) (2.1 to 8.0 in.) for two forested wetlands in north central Minne-sota. The recharge estimated in well 8 was slightly lower than recharge estimated for other wells located near ditches (table 5) likely because well 8 was screened in low perme-ability peat. For wells located more than 400 ft from a ditch, the annual recharge estimates ranged from 0.36 to 2.85 in. for wells screened in clay-rich sediments (wells 9 and 16) and ranged from 3.55 to 18.6 in. for wells screened in sands and coarser sediments (wells 5, 7, 13, 14, and 15, table 5). Recharge estimates for wells screened in sands and coarser sediments far from ditches were more similar to recharge estimates from streamflow (table 4) than wells near ditches (table 5).
Similar to the basinwide, areal recharge estimated from streamflow (RORA program, table 4 and fig. 7), annual lo-cal recharge estimated from well hydrograph analysis using the RISE program generally increased from 2007 to 2009; however, the highest RISE estimates were in 2008 for 9 of the 12 wells (table 5). Similarly, annual local recharge estimated
18 Aquifer properties, evapotranspiration, and effects of ditching in Stoney Brook watershed, Fond du Lac Reservation, Minnesota
Table 4. Seasonal and annual water-table recharge estimated by the RORA computer program for the Stoney Brook watershed, Minnesota, April 2006 through December 2009.
[Streamflow data used in the RORA program were from streamgage 04021520 (U.S. Geological Survey, 2013), and precipitation records were from National Weather Service weather station 211630 at Cloquet, Minnesota (Minnesota Climatology Working Group, 2013). Recharge estimates and precipitation values are in inches per 3-month period; departure from normal is the difference, in inches, between measured annual snowfall or total annual precipitation and the 30-year (1981–10) normal annual snowfall or total annual precipitation; --, no data]
Year3-month period
and annual
Recharge (inches)
Percentage of seasonal or annual precipitation
that recharged groundwater
Precipitation (inches)
Snowfall (annual departure
from normal)
Total precipitation1 (annual departure
from normal)
2006 January–March -- -- 45.5 2.23
April–June 1.88 21 0.0 9.16
July–September 0.10 2 0.0 6.50
October–December 0.23 6 18.0 3.77
Annual2 2.21 11 63.5 (-2.7) 21.66 (-10.17)
2007 January–March 0.50 16 43.7 3.22
April–June 2.95 49 15.5 5.97
July–September 0.22 3 0.0 8.55
October–December 0.97 11 34.4 9.22
Annual 4.64 17 93.6 (27.4) 26.96 (-4.87)
2008 January–March 0.17 16 19.3 1.08
April–June 4.82 41 16.8 11.81
July–September 0.67 6 0.0 10.38
October–December 2.52 43 30.6 5.84
Annual 8.18 28 66.7 (0.5) 29.11 (-2.72)
2009 January–March 2.43 48 30.5 5.04
April–June 1.98 43 2.1 4.62
July–September 0.35 2 0.0 15.19
October–December 3.71 45 37.5 8.32
Annual 8.47 26 70.1 (3.9) 33.17 (1.34)1Total precipitation includes the water equivalent of snowfall.2Annual recharge and annual percentage of annual precipitation that recharged groundwater in 2006 represent values from April to
December 2006.
Assessment of Aquifer Properties and Evapotranspiration
19
0
3.0
0.5
1.5
2.5
2.0
1.0
3.5
Tota
l mon
thly
rech
arge
, in
inch
es
2009
2
4
6
0
8
0
10
20
30
40
200820072006
Month/Year
Tota
l mon
thly
pre
cipi
tatio
n (in
clud
es w
ater
-eq
uiva
lent
sno
wfa
ll), i
n in
ches
Tota
l mon
thly
sno
wfa
ll, in
inch
es
Jan. Jan. Jan. Jan.July JulyJuly July
Jan. Jan.Jan. Jan. JulyJulyJulyJuly
Total monthly snowfall Total monthly precipitation—Includes water-equivalent snowfall
EXPLANATION
Total monthly recharge
Recharge estimated using streamflow records for streamgage 04021520 (U.S. Geological Survey, 2013)
Precipitation and snowfall from National Oceanic and Atmospheric Administration weather station 211630 at Cloquet, Minnesota (Minnesota Climatology Working Group, 2013)
Figure 7. Monthly recharge estimated by the RORA computer program for the Stoney Brook watershed, Minnesota, April 2006 through December 2009.
20
Aquifer properties, evapotranspiration, and effects of ditching in Stoney Brook watershed, Fond du Lac Reservation, M
innesotaTable 5. Annual water-table recharge estimates from RISE computer program analysis, manual groundwater recession analysis, and master recession curve (MRC) analysis of well hydrographs in Stoney Brook watershed, Minnesota, 2007–9.
[MRC, master recession curve; --, no data]
Monitoring well number
(fig. 1)Geology at well screen
Approximate distance
from ditch (feet)
Recharge (inches/year)
2007 2008 2009
RISE estimate
Manual estimate
MRC estimate
RISE estimate
Manual estimate
MRC estimate
RISE estimate
Manual estimate
MRC estimate
Wells screened in mostly sands and near ditches (less than 50 feet)
1 Fine to medium sand, some clayey intervals 35 27.0 29.7 34.8 26.0 28.3 33.5 23.0 26.3 30.22 Medium sand, some clayey intervals 45 22.3 26.0 27.9 26.5 31.5 33.9 25.4 30.9 34.43 Medium to coarse sand 40 18.4 18.6 -- 22.7 24.8 -- 27.0 29.6 --12 Fine to medium sand, some coarse 25 25.5 26.2 -- 23.8 26.1 -- 21.2 22.9 --
Mean annual recharge 23.3 25.1 24.7 27.7 24.2 27.5Wells screened in mostly sand and far from ditches (greater than 400 feet)
5 Medium to coarse sand 3,600 6.16 8.73 -- 8.70 12.1 -- 5.20 8.76 --7 Medium to very coarse sand, pebbles, cobbles 3,900 15.2 15.4 -- 17.7 17.5 -- 16.8 18.6 --13 Medium sand, some gravel, pebbles 450 9.05 9.91 -- 14.4 14.8 -- 13.5 13.5 --14 Coarse to very coarse sand 2,000 3.55 4.47 -- 14.4 16.8 -- 10.5 12.9 --15 Medium sand, some sandy clay 2,300 6.61 7.58 -- 10.5 12.4 -- 7.14 8.66 --
Mean annual recharge 8.11 9.22 13.1 14.7 10.6 12.5Difference between mean annual recharge for wells screened in mostly sands
near ditches and mean annual recharge for wells screened in mostly sands far from ditches
15.2 15.9 11.6 13.0 13.6 15.0
Wells screened in peat and near ditches (less than 50 feet)
8 Peat 25 10.3 12.3 -- 20.6 22.0 -- 17.0 18.3 --Wells screened in clay-rich sediments and far from ditches (greater than 400 feet)
Assessment of Aquifer Properties and Evapotranspiration 21
using the manual groundwater recession approach generally increased from 2007 to 2009, with the highest recharge esti-mated in 2008 for 8 of the 12 wells (table 5).
Monthly local recharge estimated using the RISE program ranged from 0.00 to 7.20 in. from July 2006 to December 2009 (fig. 8). Similar to the annual recharge, the monthly recharge was higher at wells located less than 50 ft from a ditch (wells 1, 8, and 12) than it was at wells more than 400 ft from a ditch (wells 5, 14, and 16; fig. 8). The lowest monthly RISE recharges were at well 16, which was 1,300 ft from a ditch and screened in sandy clay (fig. 8; table 5).
Evapotranspiration
Daily ET from the water table was estimated for 70 daily water-level fluctuations at four wells (31 days in well 1, 6 days in well 2, 9 days in well 4, and 24 days in well 12) from 2006 to 2009 between June 26 and October 6 of each year (table 6). Daily ET at wells ranged from 0.01 to 0.28 in. under various cloud cover (table 6; fig. 9). This range is larger than the range of daily ET (0.03 to 0.13 in.) estimated by Bay (1968) during a season for select drying periods at a bog near Grand Rapids, Minn., which is approximately 50 miles northwest of the study area. The daily ET range is smaller than the range of daily ET (0.04 to 0.66 in.) esti-mated by Rosenberry and Winter (1997) at an upland area between two prairie-pothole wetlands in North Dakota; however, if the two largest values estimated in their study are eliminated, the range (0.04 to 0.36 in.) is quite similar to the ET range determined in this study. The ET at wells 2 and 4 generally was lower than ET at wells 1 and 12 for the same or similar dates of the year (table 6). Water levels in wells 2 and 4 were more than 6 ft below the land surface during each of the ET estimation periods (table 6), and may have been at or near a depth at which ET was close to zero (ET extinction depth) (Shah and others, 2007). The water levels in wells 1 and 12 generally were less than 6 ft below the land surface.
Daily water-level fluctuations caused by ET were not visible in water-level records for any wells before June 26 in any year; however, ET from shallow groundwater may have occurred in the spring before June 26. Before this date, daily water-level fluctuations likely were not visible because either large water-level changes from spring snowmelt and precipita-tion overwhelmed any groundwater-level changes from ET, or ET in the early spring was too low to be recorded.
Seasonal trends in the daily ET differed between wells 1 and 12. During 2006 and 2009, daily ET at well 1 generally increased from about 0.03 in. in late June to a peak value of 0.24 in. by the middle of August, after which values declined to 0.03 in. by early October (fig. 9A). At well 12, daily ET tended to be lower than daily ET determined for well 1. All but two values at well 12 were less than 0.18 in., and no seasonal trend existed, even when considering differences in cloud cover (fig. 9B).
The differences in daily ET between the two well loca-tions could be explained by (1) differences in groundwater depths, and (2) a better hydraulic connection between ditches and geologic material at well 1 than at well 12. Daily mean water levels in well 12 were at least 0.14 ft lower than water levels in well 1 from 2006 to 2009, with summer water-level differences as large as 0.88 ft. Water levels in well 12 ranged from 3.6 to 6.8 ft below the land surface, whereas water levels in well 1 ranged from 5 to 6 ft below the land surface. The ET was more variable with depth at well 12 than at well 1 because the water level at well 12 generally was deeper. A deeper water table may result in lower ET and a lack of a seasonal ET trend at well 12. If the hydraulic connection between the ditch and geologic material at well 1 is better than at well 12, then ET from the ditch-water surface would result in greater daily water-level fluctuations in well 1.
A polynomial regression fit (S-PLUS®, TIBCO Soft-ware, Inc., 2008) of daily ET values determined from daily groundwater-level fluctuations in well 1 (fig. 9A) produced a “growing season” ET (between June 26 and October 6) of 16.1 in. This estimate represents the mean amount of ET lost from shallow groundwater at well 1 between June 26 and October 6 during 2006–9. The ET likely occurred in the spring before June 26, but daily water-level fluctuations were not visible before June 26.
The mean growing season ET estimate (16.1 in.) at well 1 is similar to but slightly lower than other growing season ET estimates for northern Minnesota. Baker and others (1979) produced a statewide, mean annual ET map that showed approximately 18 in. for the Stoney Brook watershed. Mean annual ET estimates on Baker and others (1979) map were based on differences between annual precipitation and annual runoff. Bay (1968) determined growing season ET (May 1 to November 1) ranging from 18.31 to 20.19 in. during 1961–66 for two peatland watersheds near Grand Rapids, Minn. In their national assessment of ET, Sanford and Selnick (2012) estimated that mean annual ET for northeastern Minnesota ranges between 16.1 and 19.7 in. (41 and 50 centimeters). A lower mean annual ET estimate would be expected at well 1 from the polynomial regression fit because (1) the estimate did not account for ET before June 26 and after October 6, and (2) the ET estimate did not account for ET occurring in wetlands that may not have been hydraulically connected to shallow groundwater.
Annual PET estimated for 2006–9 using the Thornth-waite-Mather method ranged from 21.10 to 23.62 in. using the air temperature from the NOAA Station at Cloquet, Minn. (NOAA station number MN211630, Minnesota Climatol-ogy Working Group, 2013, table 7). During 2006–9, annual PET was 81 percent of the total precipitation at Cloquet. The growing season ET estimated from the polynomial regres-sion model at well 1 during 2006–9 (16.1 in.) was 74 percent of the mean annual PET. Most of the differences between the growing season ET and mean annual PET were before June 26, when daily water-level fluctuations caused by ET were not visible on the hydrograph (tables 6 and 7). Annual PET
22
Aquifer properties, evapotranspiration, and effects of ditching in Stoney Brook watershed, Fond du Lac Reservation, M
innesotaWells near ditches (less than 50 feet)
A. Well 1
Mon
thly
rech
arge
, in
inch
es Specific yield=0.23
0
2.4
4.8
7.2
Norecord
B. Well 5
Mon
thly
rech
arge
, in
inch
es
0
2.4
4.8
7.2
Wells far from ditches (greater than 400 feet)
Estimated specific yield=0.24 (medium sand; Todd, 1980)
No record
C. Well 8
0
2.4
4.8
7.2
Mon
thly
rech
arge
, in
inch
es
No record
Specific yield=0.19
D. Well 14
0
2.4
4.8
7.2
Mon
thly
rech
arge
, in
inch
es
Estimated specific yield=0.23 (coarse sand; Todd, 1980)
No record
E. Well 12
Mon
thly
rech
arge
, in
inch
es
0
2.4
4.8
7.2
Specific yield=0.18
Norecord
2006 2007 2008 2009
Year
F. Well 16
Mon
thly
rech
arge
, in
inch
es
0
2.4
4.8
7.2
Estimated specific yield=0.04 (sandy clay; Todd, 1980)
No record
2006 2007 2008 2009
Year
Figure 8. Monthly recharge estimated by the RISE computer program for wells in Stoney Brook watershed, Minnesota, July 2006 through December 2009.
Assessment of Aquifer Properties and Evapotranspiration 23
Table 6. Daily evapotranspiration estimates and groundwater levels in wells in Stoney Brook watershed, Minnesota, for various days in 2006, 2007, 2008, and 2009.
24 Aquifer properties, evapotranspiration, and effects of ditching in Stoney Brook watershed, Fond du Lac Reservation, Minnesota
B. Well 12
A. Well 1
Daily
eva
potra
nspi
ratio
n, in
inch
es
0
0.06
0.12
0.18
0.24
0.30
0
0.1
0.2
0.3
0.4
0.5
0.6
0.7
0.8
0
0.1
0.2
0.3
0.4
0.5
0.6
0.7
(Julian date)Daily evapotranspiration = -6.19 x 10 -5 2 + 2.8 x 10 -2 (Julian date) - 2.862 Coefficient of determination (R ) = 0.59
Daily
eva
potra
nspi
ratio
n, in
cen
timet
ers
June 1 July 1 August 1 September 1 October 1 November 1
Date (Julian date)
(152) (182) (213) (244) (274) (305)
June 1 July 1 August 1 September 1 October 1 November 1
Date (Julian date)
(152) (182) (213) (244) (274) (305)
0
0.06
0.12
0.18
0.24
0.30
Daily
eva
potra
nspi
ratio
n, in
inch
es
Daily
eva
potra
nspi
ratio
n, in
cen
timet
ers
EXPLANATION[Cloud cover data from National Oceanic and Atmospheric Administration weather station 211630
at Cloquet, Minnesota (Minnesota Climatology Working Group, 2013)]
Clear—Clouds cover 0 to 1/10 of sky
Scattered—Clouds cover 1/10 to 5/10 of skyClear to scattered
Scattered to brokenBroken—Clouds cover 6/10 to 9/10 of sky 2007
2006 20082009
Figure 9. Daily evapotranspiration estimated from water levels in wells in Stoney Brook watershed, Minnesota, with corresponding cloud cover.
Effects of Ditching on Groundwater Resources, Recharge Estimation, and Evapotranspiration Estimation 25
was highest in 2006 and 2007 (table 7), when groundwater levels were lowest but evaporation from wetlands was likely the highest with higher air temperatures. Annual PET for this study was slightly higher than the annual estimate of 20.5 in. determined by Baker and others (1979) for their statewide PET map using the Thornthwaite-Mather method and air temperatures during October 1960–September 1976. Monthly PET was highest in July of each year (table 7).
Table 7. Monthly and annual potential evapotranspiration for Stoney Brook watershed, Minnesota, using the Thornthwaite-Mather method (Thornthwaite and Mather, 1957).
[Air temperature records were from National Weather Service weather station 211630 at Cloquet, Minnesota (Minnesota Climatology Working Group, 2013)]
Month
Potential evapotranspiration (inches)
Year
2006 2007 2008 2009
January 0.00 0.00 0.00 0.00February 0.00 0.00 0.00 0.00
Effects of Ditching on Groundwater Resources, Recharge Estimation, and Evapotranspiration Estimation
Ditching in the Stoney Brook watershed has affected lakes connected to the ditches and groundwater near the ditches, but has had minimal effects on regional hydrology. The installation of ditches in the watershed has reduced water levels in lakes connected to the ditch system. Shallow ground-water levels likely have dropped locally around the ditches and near these lakes in response to lower lake levels and ditch installation; however, no known historical groundwater-level data exist before the installation of ditches to document that groundwater levels throughout the watershed were affected by the ditching. Some water-table contours determined in this study were affected by ditching (fig. 6), indicating that ditching was lowering local groundwater levels in some areas
during May 2006–June 2007. Lakes affected most by the ditching (Rice Portage, Jaskari, Dead Fish, and Miller) are connected directly to the ditch system, and are some of the more productive wild rice lakes on the Fond du Lac Reserva-tion (Schwarzkopf and Defoe, 1999). No known large water-level fluctuations or long-term lowering of water levels have been measured in lakes not connected to the ditch system. Boelter (1972) determined that ditching in peatlands in north-ern Minnesota had little effect on water-table aquifers beyond 16 to 160 ft (5 to 50 meters) from the ditches, depending on the depth of the water table and the composition of the organic material surrounding the ditches.
Although no known lake-level and groundwater-level data exist before ditch installation, the lack of large agricul-tural development in the watershed and the continued pres-ence of large wetland complexes in the watershed following the installation of the ditches suggest that the ditches are not removing substantial amounts of water from parts of the watershed far from the ditch system. The surficial geology in most of the watershed where ditches are present is low permeability peat and till deposits (fig. 2), indicating poor hydraulic connection between ditches and shallow ground-water; therefore, ditches likely only have a local hydrologic effect on groundwater. Also, in watersheds with many large wetlands and isolated, closed-basin lakes, like Stoney Brook, the rainfall-runoff response is buffered, resulting in a gradual water-level response to precipitation (Jones and Winterstein, 2000). Any changes made to the ditches or streams will likely have the largest effect on the lakes connected directly to these ditches and any effects on the groundwater will be localized near the ditches.
The differences between the recharge estimated at wells near ditches, at wells far from ditches, and basinwide from streamflow further indicate that the ditches have only affected groundwater near the ditches, and do not produce large changes to groundwater throughout the watershed. Annual basinwide recharge estimated from streamflow during 2007–9 was much lower than annual recharge at wells near ditches and more similar to annual recharge at wells screened in sands far from ditches (tables 4 and 5). These basinwide recharge estimates were more similar to recharge estimates that Lorenz and Delin (2007) produced using STATSGO soils data and the Rawls method (Rawls and others, 1982) without considering ditching. The basinwide recharge estimates were higher than estimates determined from water levels in wells screened in sandy clays and clayey sands far from ditches (tables 4 and 5).
The low topography and low permeable surficial mate-rial in the Stoney Brook watershed likely limit the ability of the ditches to move water from areas far from the ditches. The effectiveness of ditching to remove water from peatlands depends on the topography of a watershed (Lane and others, 2004; Holden and others, 2006). Most of the Stoney Brook watershed is relatively flat, with organic-rich peat wetlands often present in the lower areas (figs. 1, 2, and 3). Most of the ditches in the watershed are located in these low, flat areas (fig. 3).
26 Aquifer properties, evapotranspiration, and effects of ditching in Stoney Brook watershed, Fond du Lac Reservation, Minnesota
Large water-level changes in wells near ditches follow-ing precipitation and snowmelt indicate that a hydraulic connection exists between the ditch and the shallow ground-water system near the ditches. These large groundwater-level changes in wells near ditches resulted in larger groundwater recharge estimates than for wells located far from the ditches with smaller water-level changes following precipitation and snowmelt. The hydraulic connection between ditches and shallow groundwater causes recharge to adjacent geologic material, causing higher groundwater levels and total recharge at wells near ditches than at wells farther from ditches. The smaller water-level changes at wells farther from ditches mainly were caused by recharge to the water table from infil-trating precipitation.
Groundwater and surface-water exchanges near ditches are spatially and temporally complex, varying with ditch and groundwater levels. During periods of little precipitation, when water levels in the ditches and nearby groundwater are low, groundwater flows towards the ditches, discharging at low rates (fig. 10A). Immediately following major precipita-tion or snowmelt, water levels in ditches rise to elevations higher than adjacent shallow groundwater (fig. 10B). Much of the water entering the ditch immediately after precipitation or snowmelt is runoff from upgradient lakes, wetlands, and the land surface. Surface-water levels generally rise more quickly than shallow groundwater from precipitation or snowmelt. When ditch-water levels rise as ditch water flows downgradi-ent through the ditches following precipitation and snowmelt, ditch water flows into the adjacent groundwater system as bank storage, recharging local groundwater and raising water levels in nearby wells (fig. 10B). The amount of ditch water recharging shallow groundwater depends on the water-level difference between the ditch and shallow groundwater and the hydraulic conductivity and thickness of the geologic mate-rial of the aquifer near the ditch. Following precipitation and snowmelt, upgradient shallow groundwater also flows towards the ditches, resulting in a “backwatering” effect near ditches, raising local groundwater levels. As ditch-water levels decline with time, the amount of water entering groundwater from the ditches declines until the ditch-water level and groundwa-ter levels are the same. At that moment, groundwater levels will continue to rise from areal groundwater recharge and groundwater flow towards the ditches, while ditch-water levels continue to decline. As ditch-water levels decline, ground-water-flow directions will reverse, and groundwater will again discharge to the ditch (fig. 10C). Water levels in wells near ditches will continue to rise as infiltrating precipitation recharges shallow groundwater. The amount of groundwater discharging to the ditch will increase as groundwater levels rise and ditch-water levels are maintained or decrease. Without more precipitation or snowmelt, the amount of discharge to the ditch will decrease with time as groundwater levels decline.
The higher recharge estimated at wells near the ditches (wells 1, 2, 3, 8, and 12; table 5) in Stoney Brook watershed were a result of ditch-water recharge and areal groundwa-ter recharge. All wells near ditches are screened in outwash
sands or peat. The lower recharge estimated at wells far from ditches resulted from areal recharge alone, and were screened in outwash sands, pebbles, and gravels (wells 5, 7, 13, 14, and 15) and in sandy clay (wells 9 and 16) (table 5). Using recharge determined by the manual groundwater recession analysis, differences in mean annual recharge between wells screened in outwash sands near ditches and the mean annual recharge for wells screened in outwash sands far from ditches were 15.9, 13.0, and 15.0 in. for 2007, 2008, and 2009, respec-tively (table 5). These differences are 63, 47, and 55 percent of the annual mean recharge for wells screened in outwash sands near ditches for 2007, 2008, and 2009, respectively. These percent differences likely represent the effects of bank storage on recharge near ditches; however, some of these differences may be because of shallow groundwater levels near ditches if the capillary fringe extends close to the ground surface, result-ing in high groundwater level rises and recharge following precipitation (Gillham, 1984). Depth to groundwater generally is smaller in wells near ditches than in wells far from ditches.
Backwater conditions commonly occur in ditches in Minnesota and other parts of North America in the winter ice-covered period and from beaver dams (Naiman and others, 1988). Backwater in ditches can raise groundwater levels locally, sometimes resulting in long-term, high groundwater levels and reduced groundwater discharge to ditches (Koersel-man, 1989). Recharge estimated at wells near ditches with backwater conditions can be affected by these conditions, resulting in recharge estimates that do not represent actual areal groundwater recharge or localized recharge associated with bank storage.
The location of wells relative to ditches needs to be considered when using well hydrographs to estimate recharge. Areal groundwater recharge is defined as the downward move-ment and entry of water into the saturated zone at the water table (Freeze and Cherry, 1979). Recharge estimated at wells near ditches likely overestimates areal groundwater recharge because water-level rises in these wells are caused by (1) ditch water locally recharging the shallow groundwater and unsatu-rated zone when ditch-water levels are high immediately following precipitation or snowmelt, (2) areal groundwater recharge, and (3) groundwater flowing horizontally towards the well following areal groundwater recharge (Boelter, 1972). Recharge from these three sources would cause a rise in groundwater levels near ditches. Areas located farther from the ditches primarily receive areal groundwater recharge, resulting in smaller recharge estimates more indicative of groundwater recharge to the aquifer.
The water-table fluctuation method using the manual groundwater recession approach at wells far from the ditches seemed to provide the best estimates of areal groundwater recharge to the shallow glacial aquifer because water levels in these wells are not affected by bank storage and the ground-water hydrographs display sharp rises and declines during recharge. Mean annual recharge during 2007–9 using the manual approach for wells far from ditches and screened mostly in outwash sands (wells 5, 7, 13, 14, and 15) ranged
Effects of Ditching on Groundwater Resources, Recharge Estimation, and Evapotranspiration Estimation 27
A. Low ditch flow and water level
B. High ditch flow and water level
C. Moderate ditch flow and water level
Hydraulic gradients to ditch are low
Groundwater recharge rates are low
Near ditch, ditch water discharges to aquifer
Away from ditch, groundwater flows in direction of ditch
Groundwater levels and discharge to ditch are low
Groundwater discharges to ditch at relatively high rates
Hydraulic gradients to ditch are high
Groundwater recharge rates are high
Groundwater recharge rates are medium
Typically occurs in late summer
Characteristics
Occurs following precipitation or snowmelt
Characteristics
Characteristics
Occurs in middle to late spring
EXPLANATION
Groundwater-flow directionMonitoring well near ditch Ditch Water tableMonitoring well far from ditch
Groundwater levels are low to moderate, rising slower than ditch levels
Groundwater levels are high
Figure 10. Conceptual shallow groundwater flow to ditches under different hydrologic conditions.
28 Aquifer properties, evapotranspiration, and effects of ditching in Stoney Brook watershed, Fond du Lac Reservation, Minnesota
from 4.47 to 18.6 in. and from 0.43 to 2.85 in. for wells far from ditches and screened mostly in clayey sand or sandy clay (wells 9 and 16, table 5). No recharge was estimated in peat areas far from the ditches because no wells far from ditches were screened in peat; however, the range of annual basinwide recharge estimated from streamflow during 2007–9 (4.64 to 8.47 in.) is within the range of recharge determined at wells that are screened mostly in outwash sand. Even though the surficial geology of the watershed mainly consists of peat and till (fig. 2), the annual basinwide recharge estimate is similar to the areal groundwater recharge estimated for wells screened in outwash sands, which indicates that recharge rates in peatlands may be closer to the areal groundwater recharge rates in outwash sands, rather than recharge rates in sandy clay or till.
The effects of ET on shallow groundwater varies with land cover, vegetation, geology, and groundwater depth (Renger and others, 1986; Shah and others, 2007; Zhang and Schilling, 2006). The amount of ET from the water table will decrease with groundwater depth to zero at the extinc-tion depth. Daily hydrograph fluctuations in wells 1 and 12 indicated that the ET extinction depth (Shah and others, 2007) in the Stoney Brook watershed is approximately from 4.6 to 6 ft below the land surface. This range in extinction depths is similar to ranges presented in other research studies. Rosen-berry and Winter (1997) determined that the ET extinction depths from hydrographs in wells installed between two prairie-pothole wetlands in North Dakota was greater than 4 to 4.6 ft below the land surface. Zhang and Schilling (2006) determined an ET extinction depth of 4.6 ft for grass cover in central Iowa. Cowdery (2004) determined ET extinction depths ranging from 4.6 to 4.9 ft for land being restored to prairie grasslands and wetlands at Glacial Ridge National Wildlife Refuge in northwestern Minnesota. The large amount of wetlands and trees (aspen, cedar, and hardwoods) in the Stoney Brook watershed (Fond du Lac Forestry Department, 2015) make it likely that the ET extinction depth is deeper than in North Dakota prairie-pothole wetlands and grasslands (Winter and Carr, 1980; Stewart and Kantrud, 1972), Iowa grasslands (Zhang and Schilling, 2006), and northwestern Minnesota prairie grasslands and wetlands (Melesse and others, 2006).
Diurnal changes in ditch-water levels affected diurnal water-level changes in nearby monitoring wells, which could affect ET estimation from well hydrographs. Varia-tions in ditch-water levels can be caused by (1) evaporation directly from the ditch, (2) changes in amounts of ground-water discharge to upstream parts of the ditch, or (3) chang-ing amounts of evaporation from upstream lakes that are connected to the ditch. The ditch-water surface allowed for relatively high evaporation compared to the land surface, which, with a good hydraulic connection to surrounding groundwater, resulted in relatively high fluctuations in daily groundwater levels near ditches. Water-table fluctuations are larger than they would otherwise be because the water table also is influenced by changing water levels in nearby ditches.
SummaryWater levels of lakes in the Stoney Brook watershed in
the Fond du Lac Reservation were lowered because of ditch installation in the early 1900s. The Fond du Lac Band of Lake Superior Chippewa is committed to restoring lakes to levels recorded before the construction of the judicial ditch system to improve wild rice production on the lakes. The U.S. Geologi-cal Survey, in cooperation with the Fond du Lac Band of Lake Superior Chippewa, assessed hydraulic properties of geologic material, recharge, and ET, and the effects of ditching on the groundwater resources in the Stoney Brook watershed in the Fond du Lac Reservation. Geologic, groundwater, and surface-water data were collected to estimate hydrologic properties in the watershed. Streamflow and groundwater levels in the shallow glacial aquifer Stoney Brook watershed were analyzed to estimate groundwater-flow directions, groundwater recharge, and ET within the watershed and to assess the effect of the judicial ditch system on surrounding groundwater resources.
Specific yield from well water-level analyses ranged from 0.11 to 0.40, and hydraulic conductivities from slug-test analy-ses ranged from 1 to 7 feet per day. The values for specific yields were similar to values obtained in other studies done in glacial materials of similar composition in Minnesota. The higher hydraulic conductivity estimate (7 feet per day) was similar to lower hydraulic conductivities estimated in another hydrologic study conducted in Carlton County, Minnesota.
Ditching in the Stoney Brook watershed has reduced water levels in lakes connected to ditches, and have reduced groundwater levels in shallow groundwater locally around the ditches and near these lakes. Differences in near-ditch ground-water hydrographs relative to far-ditch groundwater hydro-graphs indicate that the effect of the ditches on groundwater is only localized to near-ditch areas. These hydrograph differ-ences resulted in large differences between recharge estimated at wells near and far from ditches. In this study, recharge estimated at wells within 50 feet of a ditch was influenced by ditch-water levels. Annual groundwater-recharge during 2006–9 ranged from 0.36 to 34.8 inches, and varied with climate, geology, and proximity of wells to ditches. Higher recharge occurred near ditches because shallow groundwa-ter near the ditches received both ditch-water flow and areal recharge. The water-table fluctuation method using the manual groundwater recession approach at wells far from the ditches seemed to provide the best areal recharge estimates to the shallow glacial aquifer because water levels in these wells are not affected by bank storage and the groundwater hydrographs display sharp rises and declines during recharge. Mean annual areal recharge during 2007–9 from wells more than 400 feet from ditches using the manual groundwater recession approach ranged from 4.47 to 18.6 inches for wells screened mostly in outwash sands (wells 5, 7, 13, 14, and 15), and from 0.43 to 2.85 inches for wells screened mostly in clayey sand or sandy clay (wells 9 and 16). Recharge estimates at wells far from ditches were similar to basinwide recharge estimates from streamflow.
References Cited 29
Daily fluctuations in water levels in wells 1 and 12 indicated that the ET extinction depth in the Stoney Brook watershed is approximately from 4.6 to 6 feet. Daily ET estimated at wells ranged from 0.01 to 0.28 feet under differ-ent cloud cover. A polynomial regression fit of the daily ET during 2006–9 at well 1 produced a total growing season ET from June 26 to October 6 of 16.1 inches. ET estimated from daily water-level fluctuations in wells near ditches are rela-tively high. The ditch-water surface allowed for relatively high evaporation compared to the land surface, which with a good hydraulic connection to surrounding groundwater, resulted in relatively high fluctuations in daily groundwater levels near ditches, resulting in high ET estimates.
References Cited
1854 Treaty Authority, 2005, Biology of wild rice: accessed December 12, 2005, at http://1854treatyauthority.org/wil-drice/biologyofwildrice.htm.
Alley, W.M., Reilly, T.E., and Franke, O.L., 1999, Sustain-ability of groundwater resources: U.S. Geological Survey Circular 1186, 79 p. [Also available at http://pubs.usgs.gov/circ/circ1186/.]
Baker, D.G., Nelson, W.W., and Kuehnast, E.L., 1979, Climate of Minnesota, part XII—The hydrologic cycle and soil water: University of Minnesota Agricultural Experiment Station, Technical Bulletin 322, 24 p.
Bay, R.R., 1968, Evapotranspiration from two peatland watersheds, in International Association of Hydrological Sciences, ed., Geochemistry, precipitation, evapotranspi-ration, soil-moisture, hydrometry: General Assembly of Bern, UVESCO/IAHS, v. 78, p. 300–307. [Also available at http://treesearch.fs.fed.us/pubs/12895.]
Berg, J.A., 2011, Hydrogeology of the surficial aquifer: Min-nesota Department of Natural Resources, County Atlas Series C–19, Part B, plate 7 of 10. [Also available at http://files.dnr.state.mn.us/waters/groundwater_section/mapping/cga/c19_carlton/pdf_files/plate07.pdf.]
Boelter, D.H., 1972, Water table drawdown around an open ditch in organic soils: Journal of Hydrology, v. 15, no. 4, p. 329–340. [Also available at http://dx.doi.org/10.1016/0022-1694(72)90046-7.]
Boerboom, T.J., 2009, Geologic atlas of Carlton County and the southern portion of St. Louis County, Minnesota: Min-nesota Geological Survey, County Atlas C–19, Part A.
Bradof, K.L., 1992a, Ditching of Red Lake peatland during the homestead era, in Wright, H.E., Coffin, B.A., and Aaseng, N.E., eds., The patterned peatlands of Minnesota: Minneap-olis, Minnesota, University of Minnesota Press, p. 263–284.
Bradof, K.L., 1992b, Impact of ditching and road construction on Red Lake peatland, in Wright, H.E., Coffin, B.A., and Aaseng, N.E., eds., The patterned peatlands of Minnesota: Minneapolis, Minnesota, University of Minnesota Press, p. 173–186.
Butler, J.J., Jr., Kluitenberg, G.J., Whittemore, D.O., Loheide, S.P., II, Jin, Wei, Billinger, M.A., and Zhan, Xiaoyong, 2007, A field investigation of phreatophyte-induced fluc-tuations in the water table: Water Resources Research., v. 43, no. 2, W02404 [Also available at http://dx.doi.org/10.1029/2005WR004627.]
Carter, Virginia, 1986, An overview of the hydrologic con-cerns related to wetlands in the United States: Canadian Journal of Botany, v. 64, no. 2, p. 364–374. [Also available at http://dx.doi.org/10.1139/b86-053.]
Carter, Virginia, 1996, Wetland hydrology, water quality, and associated functions, in Fretwell, J.D., Williams, J.S., and Redman, P.J., comps., National water summary on wetland resources: U.S. Geological Survey Water-Supply Paper 2425, p. 35–48. [Also available at http://pubs.usgs.gov/wsp/2425/report.pdf.]
Cowdery, T.K., 2004, Ground-water evapotranspiration estimates near wet meadows using well hydrographs, in Minnesota Water 2004—Policy and planning to ensure Min-nesota’s water supplies, 2004, Abstracts: St. Paul, Minn., p. 44.
Cunningham, W.L., and Schalk, C.W., comps., 2011, Ground-water technical procedures of the U.S. Geological Survey: U.S. Geological Survey Techniques and Methods, book 1, chap. A1, 151 p., accessed July 2, 2013, at http://pubs.usgs.gov/tm/1a1/.
Dahl, T.E., 1990, Wetlands losses in the United States 1780’s to 1980’s: Washington, D.C., U.S. Department of the Inte-rior, Fish and Wildlife Service Report to Congress, 13 p.
Delin, G.N., Healy, R.W., Lorenz, D.L., and Nimmo, J.R., 2007, Comparison of local- to regional-scale estimates of ground-water recharge in Minnesota, USA: Journal of Hydrology, v. 334, no. 1–2, p. 231–249. [Also available at http://dx.doi.org/10.1016/j.jhydrol.2006.10.010.]
Detenbeck, N.E., Galatowitsch, S.M., Atkinson, Jim, and Ball, Helen, 1999, Evaluating perturbations and developing restoration strategies for inland wetlands in the Great Lakes Basin: Wetlands, v. 19, no. 4, p. 789–820. [Also available at http://dx.doi.org/10.1007/BF03161785.]
Dukerschein, Terry, and Langrehr, Heidi, 2000, Distribution of wild rice (Zizania aquatica L.) before and after the flood of 1993 in Pool 8 of the Upper Mississippi River: U.S. Geo-logical Survey Project Status Report 2000–01, accessed December 12, 2005, at http://www.umesc.usgs.gov/reports_publications/psrs/psr_2000_01.html.
30 Aquifer properties, evapotranspiration, and effects of ditching in Stoney Brook watershed, Fond du Lac Reservation, Minnesota
Durkee Walker, R.E., Pastor, John, and Dewey, B.W., 2010, Litter quantity and nitrogen immobilization cause oscilla-tions in productivity of wild rice (Zizania palustris L.) in northern Minnesota: Ecosystems, v. 13, no. 4, p. 485–498. [Also available at http://dx.doi.org/10.1007/s10021-010-9333-6.]
Fond du Lac Environmental Department, 2010, Lakes and streams—Stoney Brook watershed: accessed August 19, 2010, at http://www.fdlrez.com/newnr/environ/water-lakestream.htm#stoneybrook.
Fond du Lac Forestry Department, 2015, Fond du Lac Forest Cover-type Map: accessed Janaury 7, 2015, at http://www.fdlrez.com/newnr/forestry/FDL_Covertypes_aug2012.pdf.
Fond du Lac Natural Resources Program, 2013, Wild rice: accessed April 12, 2013, at http://www.fdlrez.com/newnr/natres/wildrice.htm.
Fond du Lac Resource Management, 2008, Fond du Lac Band of Lake Superior Chippewa 2008 integrated resource man-agement plan: 91 p., accessed July 9, 2013, at http://www.fdlrez.com/newnr/IRMP.pdf.
Freeze, R.A., and Cherry, J.A., 1979, Groundwater: Engle-wood Cliffs, New Jersey, Prentice-Hall, 211, 604 p.
Gerla, P.J., 1992, The relationship of water-table changes to the capillary fringe, evapotranspiration, and precipitation in intermittent wetlands: Wetlands, v. 12, no. 2, p. 91–98. (Also available at http://dx.doi.org/10.1007/BF03160590.)
Gillham, R.W., 1984, The capillary fringe and its effects on water-table response: Journal of Hydrology, v. 67, p. 307–324. [Also available at http://dx.doi.org/10.1016/0022-1694(84)90248-8.]
Healy, R.W., and Cook, P.G., 2002, Using groundwater levels to estimate recharge: Hydrogeology Journal, v. 10, no. 1, p. 91–109. [Also available at http://dx.doi.org/10.1007/s10040-001-0178-0.]
Healy, R.W., 2010, Estimating groundwater recharge: Cam-bridge, Cambridge University Press, 264 p.
Holden, J., Evans, M.G., Burt, T.P., and Horton, M., 2006, Impact of land drainage on peatland hydrology: Journal of Environmental Quality, v. 35, p. 1764–1778. [Also available at http://dx.doi.org/10.2134/jeq2005.0477.]
Hunt, R.J., Krabbenhoft, D.P., and Anderson, M.P., 1997, Assessing hydrogeochemical heterogeneity in natural and constructed wetlands: Biochemistry, v. 34, no. 3, p. 271–293. [Also available at http://dx.doi.org/10.1023/A:1005889319205.]
Hunt, R.J., Walker, J.F., and Krabbenhoft, D.P., 1999, Char-acterizing hydrology and the importance of ground-water discharge in natural and constructed wetlands: Wetlands, v. 19, no. 2, p. 458–472. [Also available at http://dx.doi.org/10.1007/BF03161777.]
Jacobsen, S.M., 2003, Modeling wild rice lakes for optimum production, in the 2003 American Society of Agricultural Engineers Annual International Meeting, 2003, Proceed-ings: Las Vegas, Nev., paper no. 032101. [Also available at http://dx.doi.org/10.13031/2013.13781.]
Jones, P.M., and Winterstein, T.A., 2000, Characterization of rainfall-runoff response estimation of the effect of wetland restoration on runoff, Heron Lake Basin, southwestern Min-nesota, 1991–97: U.S. Geological Survey Water-Resources Investigations Report 00–4095, 48 p., 1 CD Rom.
Kessler, Erich, and Lorenz, D.L., 2010, Low-flow characteris-tics of the Mississippi River upstream from the Twin Cities Metropolitan Area, Minnesota, 1932–2007: U.S. Geological Survey Scientific Investigations Report 2010–5163, 14 p.
Koerselman, Willem, 1989, Groundwater and surface water hydrology of a small groundwater-fed fen: Wetlands Ecol-ogy and Management, v. 1, no. 1, p. 31–43. [Also available at http://dx.doi.org/10.1007/BF00177888.]
Koivusalo, H., Ahti, E., Laurén, A., Kokkonen, T., Karvonen, T., Nevalainen, R., and Finér, L., 2008, Impacts of ditch cleaning on hydrological processes in a drained peatland forest: Hydrology and Earth Systems Sciences, v. 12, no. 5, p. 147–182. [Also available at http://dx.doi.org/10.5194/hess-12-1211-2008.]
LaBaugh, J.W., Winter, T.C., Rosenberry, D.O., Schuster, P.F., Reddy, M.M., and Aiken, G.R., 1997, Hydrological and chemical estimates of the water balance of a closed-basin lake in north central Minnesota: Water Resources Research, v. 33, no. 12, p. 2799–2812. [Also available at http://dx.doi.org/10.1029/97WR02427.]
Lane, S.N., Brookes, C.J., Kirkby, M.J., and Holden, J., 2004, A network-index-based version of TOPMODEL for use with high-resolution digital topographic data: Hydrologi-cal Processes, v. 18, p. 191–201. [Also available at http://dx.doi.org/10.1002/hyp.5208.]
Lindholm, G.F., Ericson, D.W., Broussard, W.L., and Hult, M.F., 1979, Water resources of the St. Louis River water-shed, northeastern Minnesota: U.S. Geological Survey Hydrologic Atlas HA–586, 3 sheets.
Loheide, S.P., II, Bulter, J.J., Jr., and Gorelick, S.M., 2005, Estimation of groundwater consumption by phre-atophytes using diurnal water table fluctuations—A saturated-unsaturated flow assessment: Water Resources Research, v. 41, W07030. [Also available at http://dx.doi.org/10.1029/2005WR003942.]
Lorenz, D.L., and Delin, G.N., 2007, A regression model to estimate regional ground water recharge: Ground Water, v. 45, no. 2, p. 196–208. [Also available at http://dx.doi.org/10.1111/j.1745-6584.2006.00273.x.]
Mather, J.R., 1978, The climatic water budget in environmen-tal analysis: Lexington, Massachusetts, Lexington Books, D.C. Heath and Co., 239 p.
Melesse, A.M., Oberg, J., Nangia, V., Berri, O., and Baumgart-ner, D., 2006, Spatiotemporal dynamics of evapotranspira-tion at the Glacial Ridge prairie restoration in northwestern Minnesota: Hydrological Processes, v. 20, p. 1451–1464.
Meyboom, Peter, 1967, Groundwater studies in the Assini-boine River drainage basin, part II, Hydrologic characteris-tics of phreatophytic vegetation in south-central Saskatch-ewan: Geological Survey of Canada, Bulletin 139, 64 p.
Minnesota Chippewa Tribe, 2013, Minnesota Chippewa Tribe: accessed April 12, 2013, at http://www.mnchippewatribe.org/.
Minnesota Climatology Working Group, 2013, Historical cli-mate data retrieval: accessed July 10, 2013, at http://climate.umn.edu/doc/historical.htm.
Minnesota Department of Natural Resources, 2005, Wild rice management: accessed December 9, 2005, at http://www.dnr.state.mn.us/wildlife/shallowlakes/wildrice.html.
Minnesota Office of the Revisor of Statutes, 1910, Revised laws of Minnesota, Supplement 1909, the amendments to the revised laws, and other laws of a general and permanent nature, enacted by the legislature in 1905, 1907, and 1909: St. Paul, Minnesota, accessed July 11, 2014, at https://www.revisor.leg.state.mn.us/statutes/?id=44&year=1909.
Minnesota Pollution Control Agency, 2014, Wild Rice Sulfate Standard Study Preliminary Analysis, accessed October 30, 2014, at http://www.pca.state.mn.us/index.php/view-docu-ment.html?gid=20743.
Naiman, R.J., Johnston, C.A., and Kelley, J.C., 1988, Alter-nation of North American streams by beaver: Bioscience, v. 38, no. 11, p. 753–762. [Also available at http://dx.doi.org/10.2307/1310784.]
National Climatic Data Center, 2013, NOAA’s 1981–2010 cli-mate normals data: accessed March 8, 2013, at http://www.ncdc.noaa.gov/oa/climate/normals/usnormals.html.
Nichols, D.S., and Verry, E.S., 2001, Stream flow and ground-water recharge from small forested watersheds in north central Minnesota: Journal of Hydrology, v. 245, p. 89–103. [Also available at http://dx.doi.org/10.1016/S0022-1694(01)00337-7.]
Nimmo, D.W., Preul, M.A., Castle, C.J., Self, J.R., Pillsbury, R.W., and Bergey, E.A., 2003, Effects of excess copper on growth of wild rice (Zizania palustris) seedlings tested in reconstructed and natural waters: Environmental Manage-ment, v. 32, no. 4, p. 466–475. [Also available at http://dx.doi.org/10.1007/s00267-003-2899-4.]
Oelke, E., Grava, J., Noetzel, D., Barron, D., Percich, J., Schertz, C., Strait, J., and Stucker, R., 1982, Wild rice pro-duction in Minnesota: University of Minnesota Agricultural Extension Service Publication AG–BU–0546, 39 p.
Painchaud, D.L., and Archibold, O.W., 1990, The effect of sediment chemistry on the successful establishment of wild rice (Zizania palustris L.) in northern Saskatchewan water bodies: Plant and Soil, v. 129, p. 109–116.
Pastor, John, and Durkee Walker, Rachel, 2006, Delays in nutrient cycling and plant population oscillations: OIKOS, v. 112, no. 3, p. 698–705. [Also available at http://dx.doi.org/10.1111/j.0030-1299.2006.14478.x.]
Pillsbury, R.W., and McGuire, M.A., 2009, Factors affect-ing the distribution of wild rice (Zizania palustris) and the associated macrophyte community: Wetlands, v. 29, no. 2, p. 724–734. [Also available at http://dx.doi.org/10.1672/08-41.1.]
Pip, E., and Stepaniuk, J., 1988, The effect of flood-ing on wild rice, Zizania aquatica L.: Aquatic Botany, v. 32, no. 3, p. 283–290. [Also available at http://dx.doi.org/10.1016/0304-3770(88)90121-0.]
Rantz, S.E., and others, 1982, Measurement and computa-tion of streamflow: U.S. Geological Survey Water-Supply Paper 2175. [Also available at http://pubs.usgs.gov/wsp/wsp2175/.]
Rawls, W.J., Brakensiek, D.L., and Saxton, K.E., 1982, Esti-mation of soil water properties: Transactions of the Ameri-can Society of Agricultural Engineers, v. 25, p. 1316–1320.
Reeve, A.S., Evensen, R., Glaser, P.H., Siegel, D.I., and Rosenberry, D., 2006, Flow path oscillations in transient ground-water simulations of large peatland systems: Journal of Hydrology, v. 316, p. 313–324. [Also available at http://dx.doi.org/10.1016/j.jhydrol.2005.05.005.]
Renger, M., Strebel, O., Wessolek, G., and Duynisveld, W.H.M., 1986, Evapotranspiration and groundwater recharge—A case study for different climate, crop pat-terns, soil properties and groundwater depth conditions: Journal of Plant Nutrition and Soil Science, v. 149, no. 4, p. 371–381. [Also available at http://dx.doi.org/10.1002/jpln.19861490403.]
32 Aquifer properties, evapotranspiration, and effects of ditching in Stoney Brook watershed, Fond du Lac Reservation, Minnesota
Rorabaugh, M.I., 1964, Estimating changes in bank storage and ground-water contribution to streamflow: Interna-tional Association of Scientific Hydrology, Publication 63, p. 432–441.
Rosenberry, D.O., and LaBaugh, J.W., eds., 2008, Field tech-niques for estimating water fluxes between surface water and ground water: U.S. Geological Survey Techniques and Methods, book 4, chap. D2, 128 p. [Also available at http://pubs.usgs.gov/tm/04d02/.]
Rosenberry, D.O., and Winter, T.C., 1997, Dynamics of water-table fluctuations in an upland between two prairie-pothole wetlands in North Dakota: Journal of Hydrology, v. 191, p. 266–289. [Also available at http://dx.doi.org/10.1016/S0022-1694(96)03050-8.]
Rutledge, A.T., 1998, Computer programs for describing the recession of groundwater discharge and for estimating mean ground-water recharge and discharge from streamflow records—Update: U.S. Geological Survey Water-Resources Investigations Report 98–4148, 43 p. [Also available at http://pubs.usgs.gov/wri/wri984148/.]
Rutledge, A.T., 2000, Considerations for use of the RORA program to estimate ground-water recharge from streamflow records: U.S. Geological Survey Open-File Report 00–156, 44 p. [Also available at http://pubs.usgs.gov/of/2000/ofr00-156/.]
Rutledge, A.T., 2007, Update on the use of the RORA pro-gram for recharge estimation: Ground Water, v. 45, no. 3, p. 374–382. [Also available at http://dx.doi.org/10.1111/j.1745-6584.2006.00294.x.]
Sanford, W.E., and Selnick, D.L., 2012, Estimation of evapo-transpiration across the conterminous United States using a regression with climate and land-cover data: Journal of the American Water Resources Association, v. 49, no. 1, p. 217–230. [Also available at http://dx.doi.org/10.1111/jawr.12010.]
Scanlon, B.R., Healy, R.W., and Cook, P.G., 2002, Choos-ing appropriate techniques for quantifying groundwater recharge: Hydrogeology Journal, v. 10, no. 1, p. 18–39. [Also available at http://dx.doi.org/10.1007/s10040-001-0176-2.
Schwarzkopf, L., and Defoe, R., 1999, Rice Portage wild rice and wetland restoration project, Proceedings of the Wild Rice Research and Management Conference: Carlton, Min-nesota, Great Lakes Indian Fish and Wildlife Commission, p. 158–163.
Shah, N., Nachabe, M., and Ross, M., 2007, Extinction depth and evapotranspiration from groundwater under selected land covers: Ground Water, v. 45, no. 3, p. 329–338. [Also available at http://dx.doi.org/10.1111/j.1745-6584.2007.00302.x.]
Shuter, E., and Teasdale, W.E., 1989, Application of drilling, coring, and sampling techniques to test holes and wells: U.S. Geological Survey Techniques of Water-Resources Investigations, book 2, chap. F1, 97 p. [Also available at http://pubs.usgs.gov/twri/twri2-f1/pdf/TWRI_2-F1.pdf.]
Siegel, D.I., 1983, Ground water and the evolution of pat-terned mires, Glacial Lake Agassiz peatlands, northern Min-nesota: Journal of Ecology, v. 71, no. 3, p. 913–921. [Also available at http://www.jstor.org/stable/2259601.]
Siegel, D.I., 1992, Groundwater hydrology, in Wright, H.E., Coffin, B.A., and Aaseng, N.E., eds., The patterned peat-lands of Minnesota: Minneapolis, Minnesota, University of Minnesota Press, p. 163–172.
Siegel, D.I., and Glaser, P.H., 1987, Groundwater flow in a bog-fen complex, Lost River Peatland, northern Minnesota: Journal of Ecology, v. 75, no. 3, p. 743–754. [Also available at http://www.jstor.org/stable/2260203.]
Springer, R.K. and Gelhar, L.W., 1991, Characterization of large-scale aquifer heterogeneity in glacial outwash by analysis of slug tests with oscillatory response, Cape Cod, Massachusetts: U.S. Geological Survey Water-Resources Investigations Report 91-4034, pp. 36–40.
Stevenson, S.C., and Lee, P.F., 1987, Ecological relationships of wild rice, Zizania aquatica. 6. The effects of increases in water depth on vegetative and reproductive production: Canadian Journal of Botany, v. 65, no. 10, p. 2,128–2,132.
Stewart, R. E., and Kantrud, H. A., 1972, Vegetation of prairie potholes, North Dakota, in relation to quality of water and other environmental factors: U.S. Geological Survey Profes-sional Paper 585–D, 36 p.
Thompson, A.L., and Luthin, C.S., 2004, Wetland restora-tion handbook for Wisconsin landowners: Wisconsin Department of Natural Resources, publication no. SS–989, p. 177–122.
Thornthwaite, C.W., 1948, An approach toward a rational classification of climate: Geographical Review, v. 38, no. 1, p. 55–94. [Also available at http://www.jstor.org/stable/210739.]
Thornthwaite, C.W., and Mather, J.R., 1957, Instructions and tables for computing potential evapotranspiration and the water balance: Drexel Institute of Technology, Publications in Climatology, v. 10, no. 3, 311 p.
TIBCO Software, Inc., 2008, TIBCO Spotfire S+ 8.1 for Win-dows: Palo Alto, Calif., TIBCO Software, Inc., 572 p.
Todd, D.K., 1980, Groundwater hydrology: New York, John Wiley and Sons, p. 230–235.
U.S. Department of Agriculture, Natural Resources Conserva-tion Service, 2013, Fond du Lac water management proj-ect—Carlton County Minnesota: accessed July 10, 2013, at http://www.nrcs.usda.gov/wps/portal/nrcs/detail/mn/news-room/stories/?cid=nrcs142p2_023850.
U.S. Department of Agriculture, Soil Conservation Service, 1978, Soil survey of Carlton County, Minnesota: accessed July 28, 2014, at http://www.nrcs.usda.gov/wps/portal/nrcs/surveylist/soils/survey/state/?stateId=MN.
U.S. Fish & Wildlife Service, 1994, National wetlands inven-tory digital data, October 1991 to 1994: accessed July 17, 2013, at http://www.fws.gov/wetlands.
U.S. Geological Survey, 2015, U.S. Geological Survey National Water Information System (NWISWeb): U.S. Geo-logical Survey database, accessed January 5, 2015, at http://waterdata.usgs.gov/mn/nwis/nwis.
Vennum, T., 1988, Wild rice and the Ojibway People: St. Paul, Minnesota, Minnesota Historical Society Press, 368 p.
Vigil, J.F., Pike, R.J., and Howell, D.G., 2000, A tapestry of time and terrain: U.S. Geological Survey Geologic Investi-gations Series I–2720, 32 p. and 1 sheet. [Also available at http://pubs.usgs.gov/imap/i2720/.]
White, W.N., 1932, A method of estimating groundwater sup-plies based on discharge by plants and evaporation from soil: U.S. Geological Survey Water-Supply Paper 659–A, p. l–105.
Wilcox, D.A., and Whillans, T.H., 1999, Techniques for res-toration of disturbed coastal wetlands of the Great Lakes: Wetlands, v. 19, no. 4, p. 835–857. [Also available at http://dx.doi.org/10.1007/BF03161787.]
Wood, L.C., and Hockens, S.N., 1970, Least squares smooth-ing operators: Geophysics, v. 35, no. 6, p. 1,005–1,019.
Winter, T.C., 1999, Relation of streams, lakes, and wetlands to groundwater flow systems: Hydrogeology Journal, v. 7, no. 1, p. 28–45. [Also available at http://dx.doi.org/10.1007/s100400050178.]
Winter, T.C., and Carr, M.R., 1980, Hydrologic setting of wet-lands in the Cottonwood Lake area, Stutsman County, North Dakota: U.S. Geological Survey Water-Resources Investiga-tions Report 80–99, 42 p.
Winter, T.C., Rosenberry, D.O., and LaBaugh, J.W., 2003, Where does the ground water in small watersheds come from?: Ground Water, v. 41, no. 7, p. 989–1000. [Also available at http://dx.doi.org/10.1111/j.1745-6584.2003.tb02440.x.]
Zepp, G., Harwood, J., and Somwaru, A., 1996, Wild rice—An economic assessment of the feasibility of providing mul-tiple-peril crop insurance: U.S. Department of Agriculture, Economic Research Service, accessed December 8, 2005, at http://www.rma.usda.gov/pilots/feasible/PDF/wildrice.pdf.
Zhang, Y.-K., and Schilling, K.E., 2006, Effects of land cover on water table, soil moisture, evapotranspira-tion, and groundwater recharge—A field observation and analysis: Journal of Hydrology, v. 319, no. 1–4, p. 328–338. [Also available at http://dx.doi.org/10.1016/j.jhydrol.2005.06.044.]
Publishing support provided by: Rolla Publishing Service Center
For more information concerning this publication, contact: Director, USGS Minnesota Water Science Center 2280 Woodale Drive Mounds View, Minnesota 55112 (763) 783–3100
Or visit the Minnesota Water Science Center Web site at: http://mn.water.usgs.gov/