45
Assessment of data quality and Know-Why for a scalable QbD Approach Christoph Herwig 24th September 2013
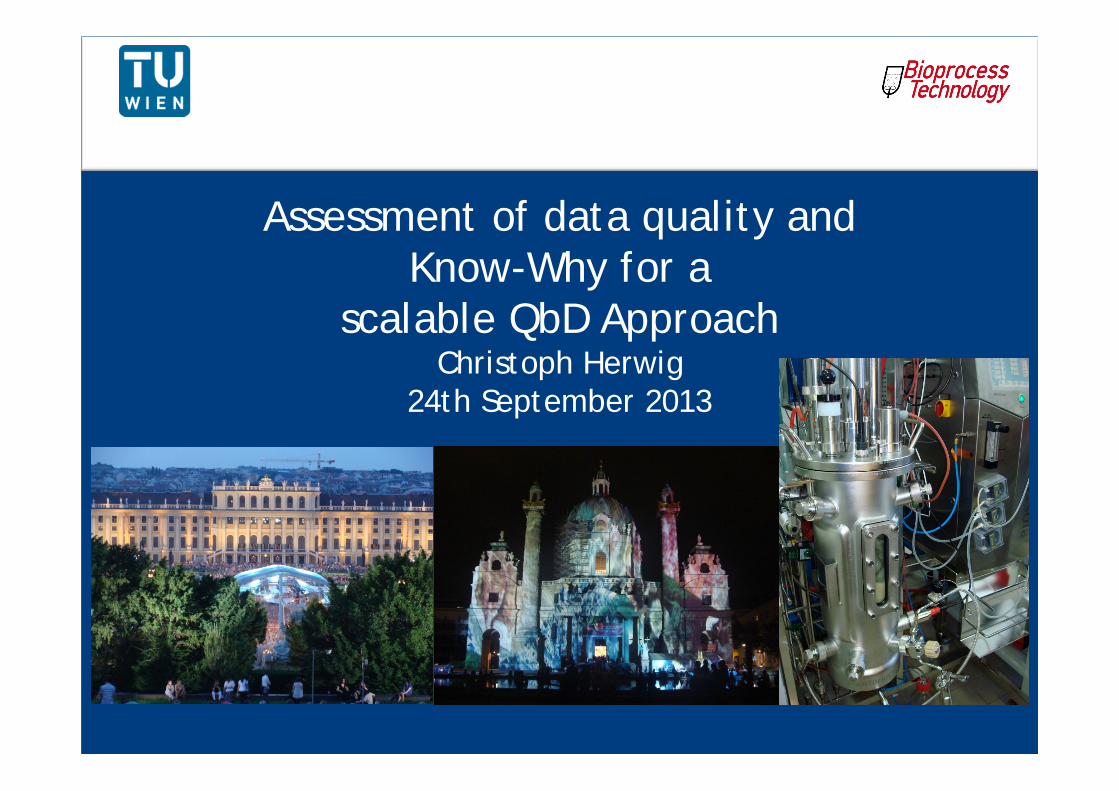
Assessment of data quality and Know-Why for a
scalable QbD ApproachChristoph Herwig
24th September 2013

09.10.2013 Ch. Herwig
Status Quo
Investigate! Redo! Hope!Stomach decision !
Process Development
Piloting ManufacturingScreening
Scale-up Scale-up Scale-up
Productivity
Waste
Process Development Time Revenue Period
2

09.10.2013 Ch. Herwig
Status Quo of Bioprocess Design
3

09.10.2013 Ch. Herwig
Status Quo of Bioprocess Design
Process regime (Feed rate, mode)
Product
Unwanted Sideproducts
Biomass
Media Composition(C, N, Trace Elements)
Agitation, pO2, pH, T, pCO2
4
09.10.2013 Ch. Herwig
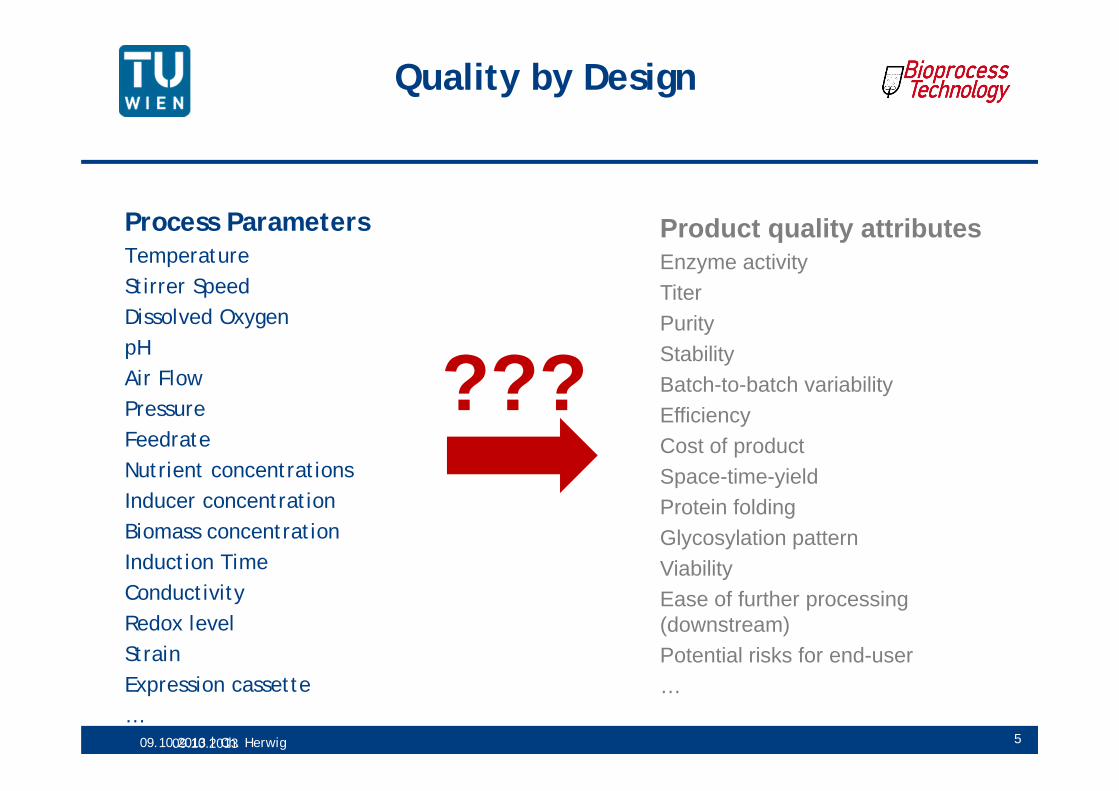
Quality by Design
Process ParametersTemperatureStirrer SpeedDissolved OxygenpHAir FlowPressureFeedrateNutrient concentrationsInducer concentrationBiomass concentrationInduction TimeConductivityRedox levelStrainExpression cassette…
Product quality attributesEnzyme activityTiterPurityStabilityBatch-to-batch variabilityEfficiencyCost of productSpace-time-yieldProtein foldingGlycosylation patternViabilityEase of further processing (downstream)Potential risks for end-user…
???
09.10.2013 5

09.10.2013 Ch. Herwig
Process ParametersTemperatureStirrer SpeedDissolved OxygenpHAir FlowPressureFeedrateNutrient concentrationsInducer concentrationBiomass concentrationInduction TimeConductivityRedox levelStrainExpression cassette…
Product quality attributesEnzyme activityTiterPurityStabilityBatch-to-batch variabilityEfficiencyCost of productSpace-time-yieldProtein foldingGlycosylation patternViabilityEase of further processing (downstream)Potential risks for end-user…
Quality by Design
6
???

09.10.2013 Ch. Herwig
Current Solution: „How“ but not „Why“
CPPs
Specific Activity
[kU/gbiomass]
Induction Phase Temperature
[°C]
Induction Phase Feeding
Exponent k
7
Knowledge
DataCPPs
CQA

09.10.2013 Ch. Herwig
“Paradigm Change” of Bioprocess Design
Design MethodologyDesign Methodology
Process Design Parameters:
…
Feed
T
pH
Quality!Performance!
Time to Market!Process Analytical TechnologyDesign of ExperimentsRisk AssessmentStatistics
Reduced Development TimeKnow‐How = Know‐WhyHardly Predictive
Reduced Development TimeKnow‐How = Know‐WhyHardly Predictive
8

09.10.2013 Ch. Herwig
Problem Statement and Goal
• QbD is perceived to
• be expensive and laborious due to high amount of experiments
• not hold the promise to provide more flexibility / scalability
• Goal: Show benefits to QbD by
• using high quality data
• providing not “How” but “Why” Process Understanding
9
High Quality Data “Why” Process Understanding
09.10.2013 Ch. Herwig
I) Importance of Data
Quality
10
09.10.2013 Ch. Herwig
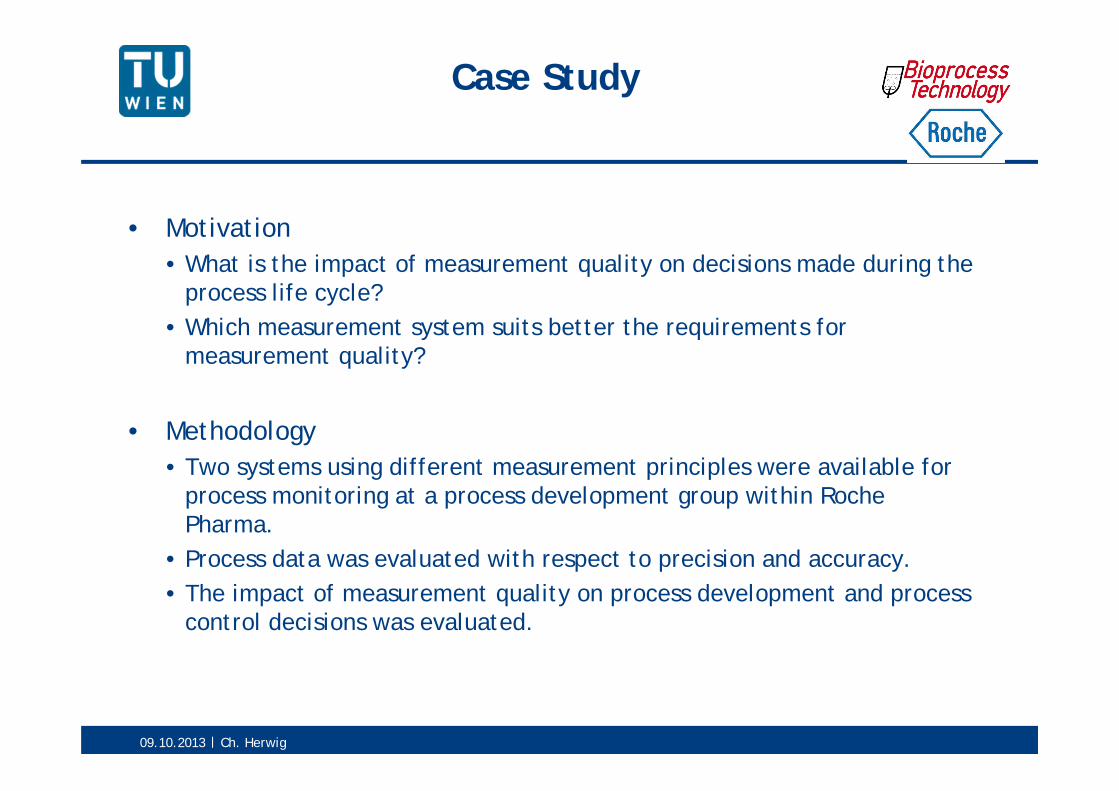
Case Study
• Motivation• What is the impact of measurement quality on decisions made during the
process life cycle?• Which measurement system suits better the requirements for
measurement quality?
• Methodology• Two systems using different measurement principles were available for
process monitoring at a process development group within Roche Pharma.
• Process data was evaluated with respect to precision and accuracy.• The impact of measurement quality on process development and process
control decisions was evaluated.
09.10.2013 Ch. Herwig
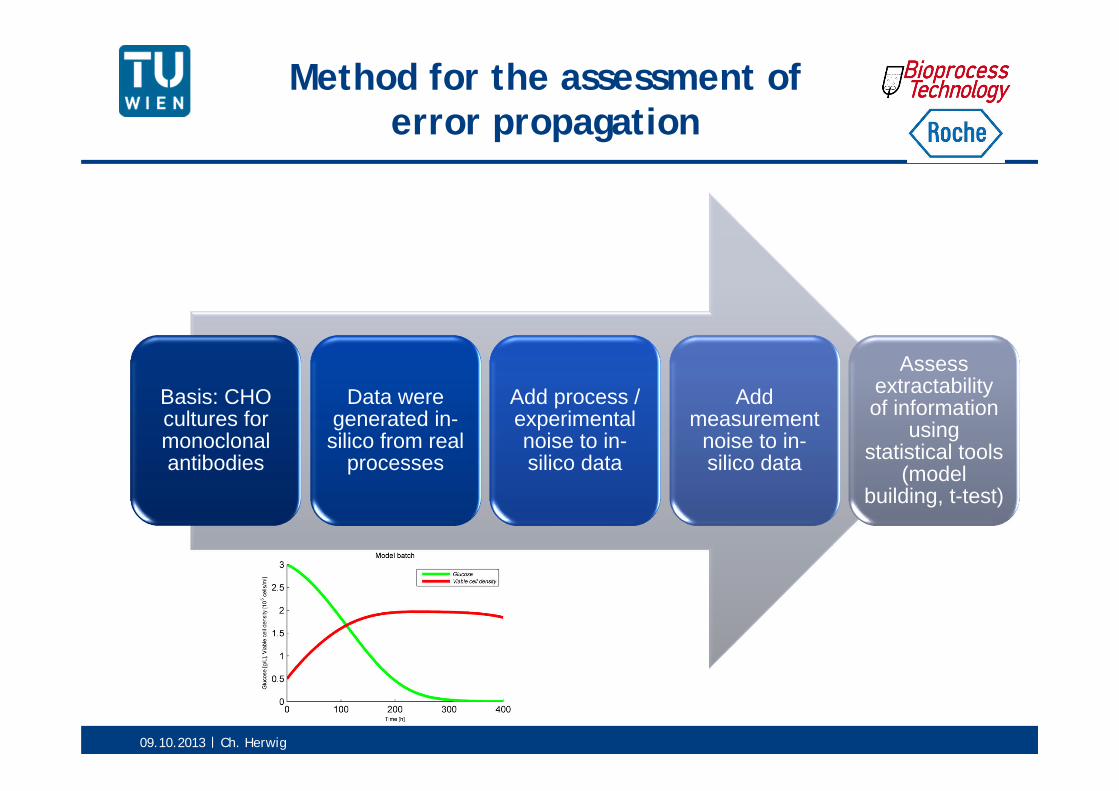
Method for the assessment of error propagation
Basis: CHO cultures for monoclonal antibodies
Data were generated in-silico from real
processes
Add process / experimental noise to in-silico data
Add measurement
noise to in-silico data
Assess extractability of information
using statistical tools
(model building, t-test)
09.10.2013 Ch. Herwig
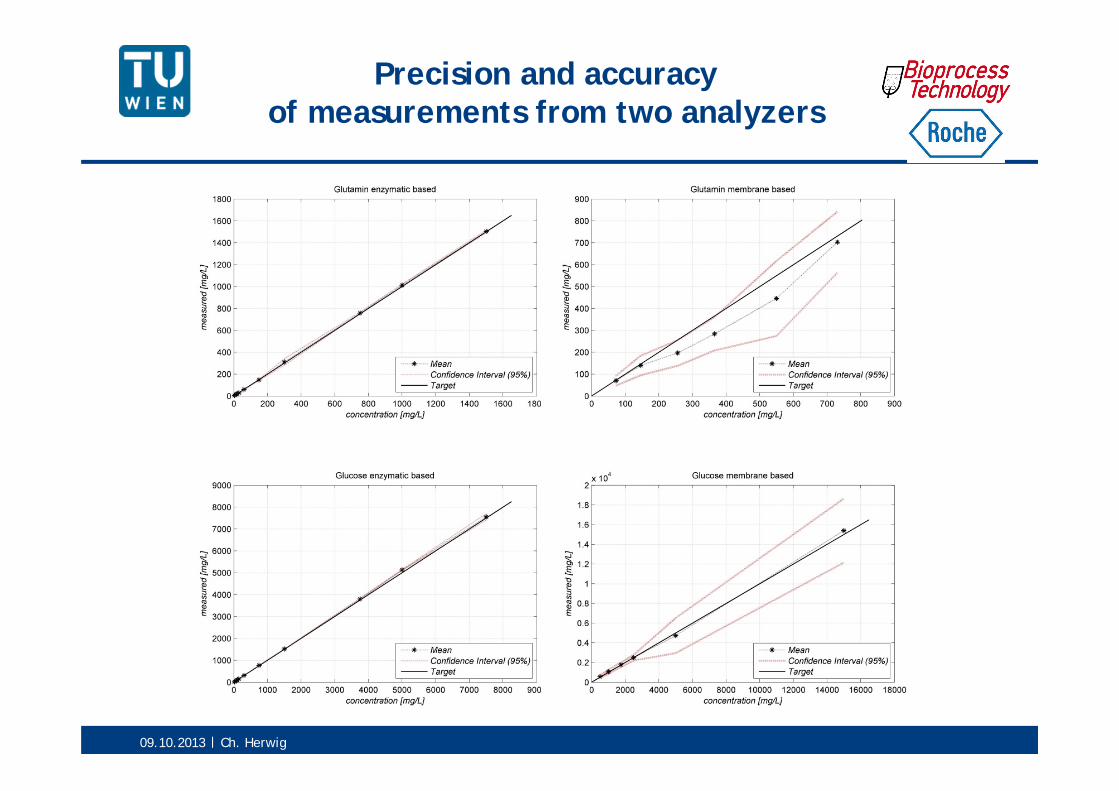
Precision and accuracy of measurements from two analyzers
09.10.2013 Ch. Herwig
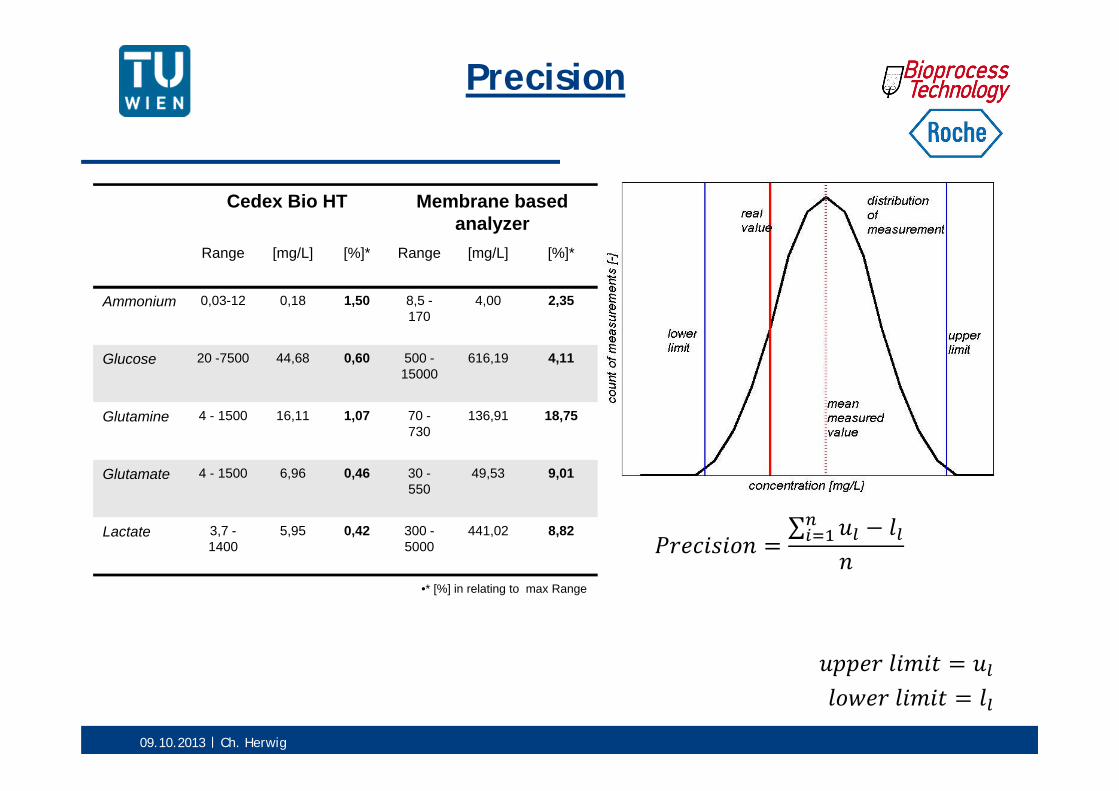
Precision
∑
Cedex Bio HT Membrane based analyzer
Range [mg/L] [%]* Range [mg/L] [%]*
Ammonium 0,03-12 0,18 1,50 8,5 -170
4,00 2,35
Glucose 20 -7500 44,68 0,60 500 -15000
616,19 4,11
Glutamine 4 - 1500 16,11 1,07 70 -730
136,91 18,75
Glutamate 4 - 1500 6,96 0,46 30 -550
49,53 9,01
Lactate 3,7 -1400
5,95 0,42 300 -5000
441,02 8,82
•* [%] in relating to max Range

09.10.2013 Ch. Herwig
Accuracy
∑ , ,
Cedex Bio HT Membrane based analyzer
Range [mg/L] [%]* Range [mg/L] [%]*
Ammonium 0,03-12 0,04 0,33 8,5 -170
3,60 2,12
Glucose 20 -7500 29,80 0,40 500 -15000
69,02 0,46
Glutamine 4 - 1500 4,53 0,30 70 -730
44,92 6,15
Glutamate 4 - 1500 26,27 1,75 30 -550
7,30 1,32
Lactate 3,7 -1400
22,94 1,64 300 -5000
113,05 2,26
•* [%] in relating to max Range

09.10.2013 Ch. Herwig
Effect of Quality of Measurement on Time Resolution of Processes
It does not make sense to measure in a higher sampling frequency than indicated
Impact for application to timely resolved analysis
Minimum Potential Measuring Interval
Cedex Bio HT[h]
Membrane based analyzer[h]
Ammonium 0,2 4,8Glucose 1,8 24,4Glutamine 3,0 25,6Glutamate 2,1 15,2Lactate 0,4 29,0
09.10.2013 Ch. Herwig
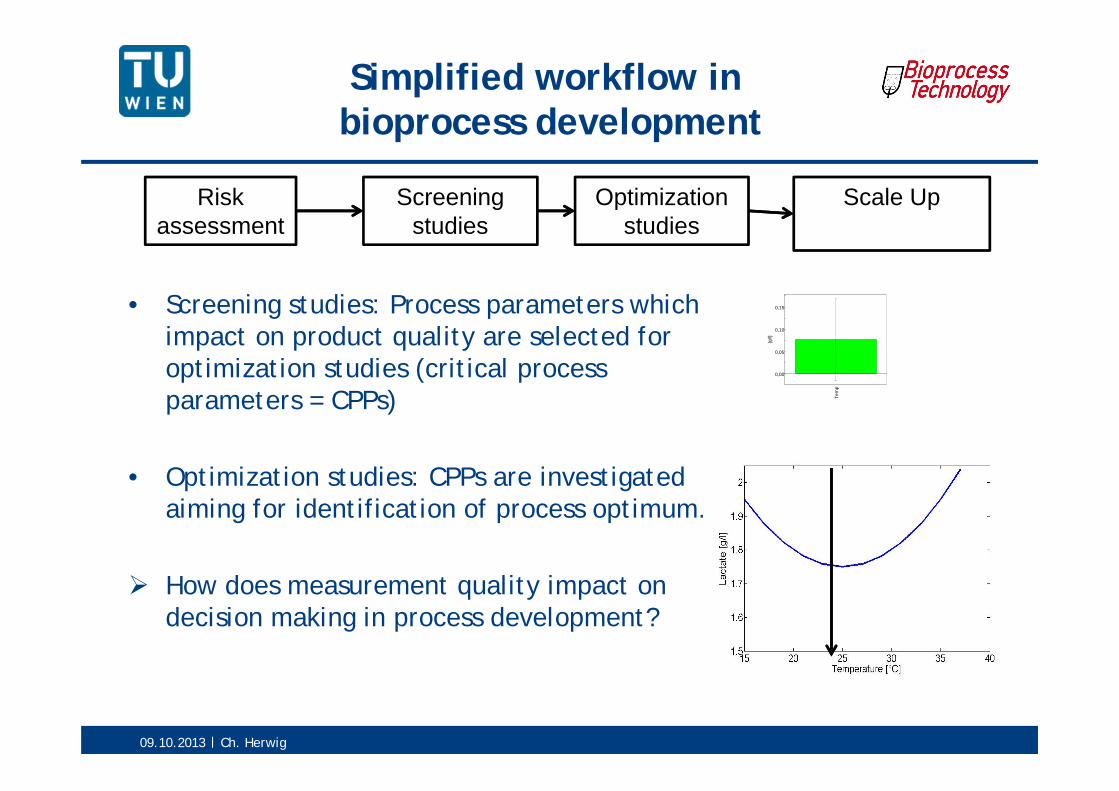
Simplified workflow inbioprocess development
• Screening studies: Process parameters which impact on product quality are selected for optimization studies (critical process parameters = CPPs)
• Optimization studies: CPPs are investigated aiming for identification of process optimum.
How does measurement quality impact on decision making in process development?
Risk assessment
Screening studies
Optimization studies
Scale Up
0,00
0,05
0,10
0,15
Tem
p
[g/l]
09.10.2013 Ch. Herwig
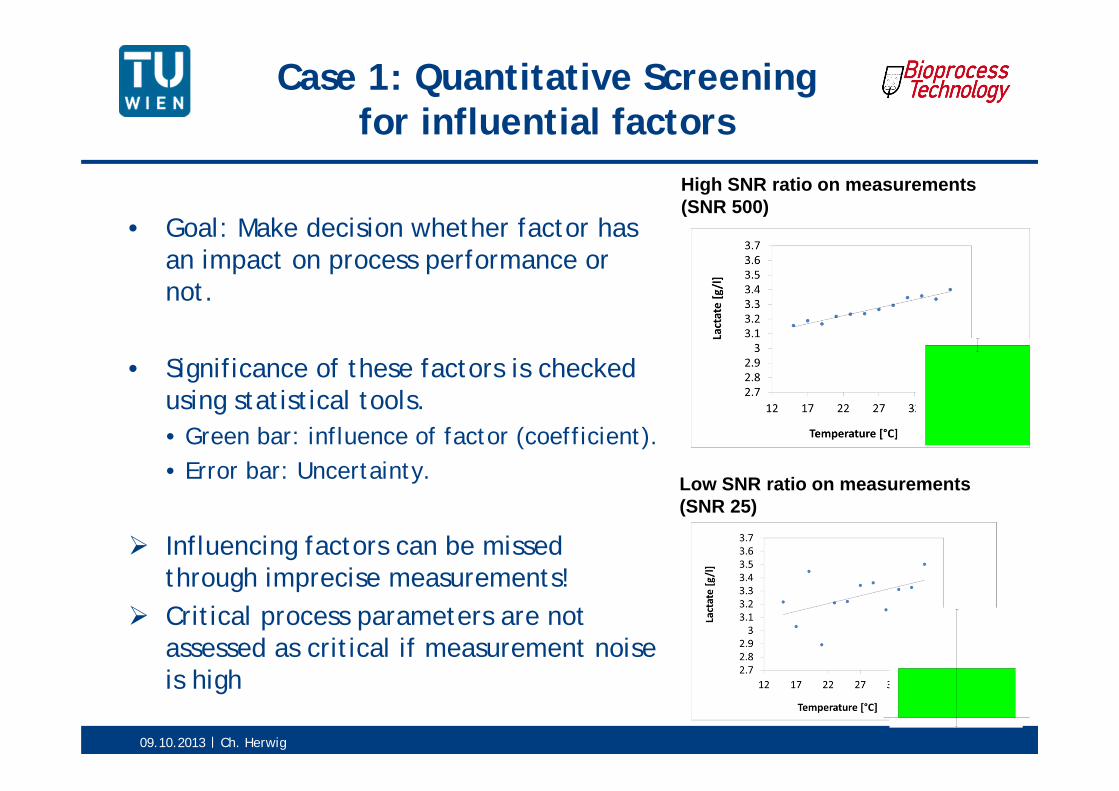
Case 1: Quantitative Screening for influential factors
• Goal: Make decision whether factor has an impact on process performance or not.
• Significance of these factors is checked using statistical tools. • Green bar: influence of factor (coefficient).• Error bar: Uncertainty.
Influencing factors can be missed through imprecise measurements!
Critical process parameters are not assessed as critical if measurement noise is high
High SNR ratio on measurements (SNR 500)
Low SNR ratio on measurements (SNR 25)
09.10.2013 Ch. Herwig
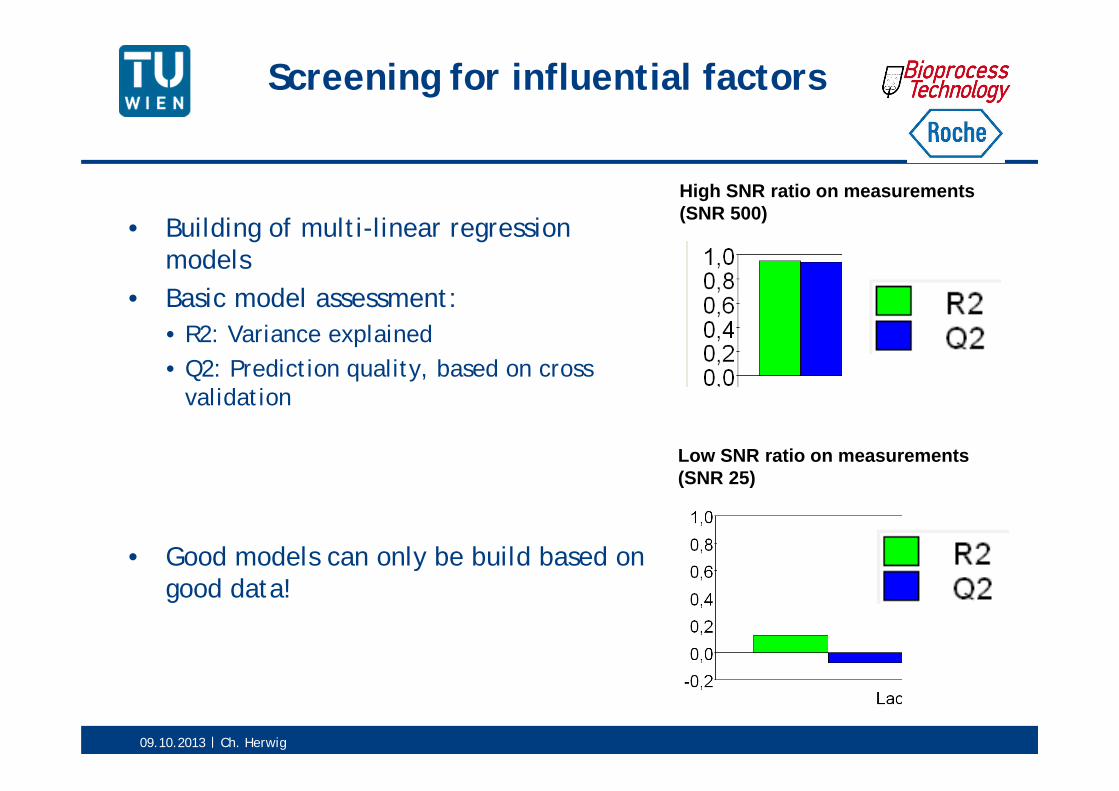
Screening for influential factors
• Building of multi-linear regression models
• Basic model assessment:• R2: Variance explained• Q2: Prediction quality, based on cross
validation
• Good models can only be build based on good data!
High SNR ratio on measurements (SNR 500)
Low SNR ratio on measurements (SNR 25)
09.10.2013 Ch. Herwig
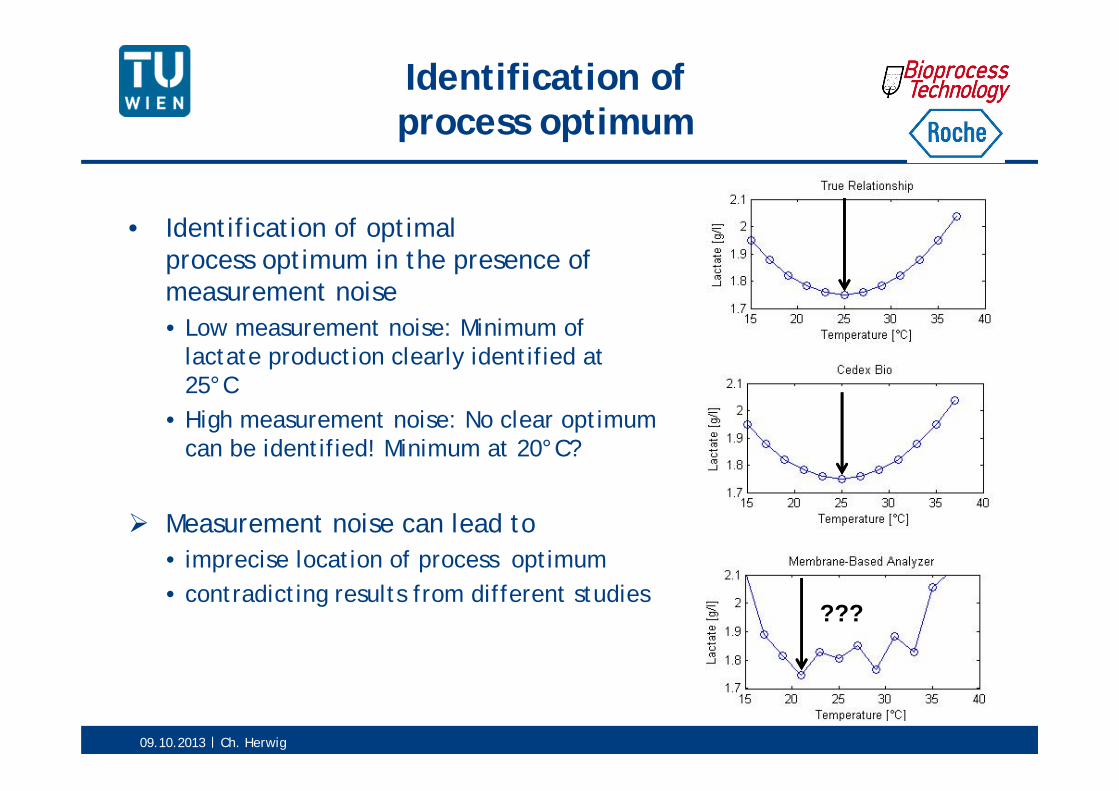
Identification ofprocess optimum
• Identification of optimalprocess optimum in the presence of measurement noise• Low measurement noise: Minimum of
lactate production clearly identified at 25°C
• High measurement noise: No clear optimum can be identified! Minimum at 20°C?
Measurement noise can lead to• imprecise location of process optimum• contradicting results from different studies
???

09.10.2013 Ch. Herwig
Process Control Strategy
• Discontinuous process intervention by bolus addition
• Goal: Control glucose concentration above 2 g/L
• Control by bolus shots• When and how much?
Impact of data quality on process control strategy?

09.10.2013 Ch. Herwig
Glucose control based on bolus shots: Measurement every 12 hours
• 4% error on glucose measurement
• Action only if the measurement (red) is below 3g/L
• Does not necessarily match reality (blue)
• Wrong trigger – Wrong action
• 0.6% error on glucose measurement
• Measurement is always below 3g/L (much more precision on measurements)
• True culture kinetics can be read from the plot (specific growth rate)

09.10.2013 Ch. Herwig
Glucose control based on bolus shots: Measurement every 1 hour
No impact of measurement frequency on quality of process control
Even worse for Glutamine…
Culture kinetics (specific growth rate) counteracted by measurement frequency
Quality of process control is better due to higher due to measurement frequency

09.10.2013 Ch. Herwig
Conclusions
• Process development:• Imprecise measurements and outliers can lead
• Lack of time resolution• Miss significant factors (CPPs)• Wrong identification of process optima process not run at optimal
conditions• Wrong conclusions!
• Data quality propagates into decision making!
• Process control:• Wrong trigger – wrong action: • Quality of process control by bolus addition can be improved with higher
measurement frequency if data quality is sufficient only
• A measurement system with high precision, accuracy and resolution is required for both.
09.10.2013 Ch. Herwig
II)Importance of a
Mechanistic Approach Beyond QbD!
“The Why Approach”25

09.10.2013 Ch. Herwig
Successful Approach for Aircraft Design
26

09.10.2013 Ch. Herwig
Our Approach for Scalable Process Design
Process regime (Feed rate, mode)
Product
Unwanted Sideproducts
Biomass
Media Composition(C, N, Trace Elements)
Agitation, pO2, pH, T, pCO2
CELL
27

09.10.2013 Ch. Herwig
Our Approach for Bioprocess Design
28

09.10.2013 Ch. Herwig
Concept ofphysiological and mechanistic
understanding
29
PhysiologicalAssessmentRates/Yields
Sagmeister et.al., PDA Journal, 2012
Process
ProcessParameters Product

09.10.2013 Ch. Herwig
Extended process understandingusing combination of data
• Combine raw data to scalable entities
• Use of specific entities for knowledge extraction
30
Feed‐Profiles Biomass [g/L]
/
=Specific rate of substrateuptake qs [g/g/h]

09.10.2013 Ch. Herwig
Physiological bioprocess evaluation? What for?
• Physiological parameters vary with scale due to inhomogeneities in large scale (overflow metabolism)
• Physiological parameters vary in induction phase
Acquire scalable physiological process information!
31

09.10.2013 Ch. Herwig
a) Traditional feed profile design b) Physiological feed profile design
Accelerate!
Careful selection of physiological factors for the DoE significantly reduces number of experiments Physiological factors enable mechanistic understanding and platform knowledge
Wechselberger et. al. 2012
Physiology-based DoE Speed up via Know-Why!
32
09.10.2013 Ch. Herwig
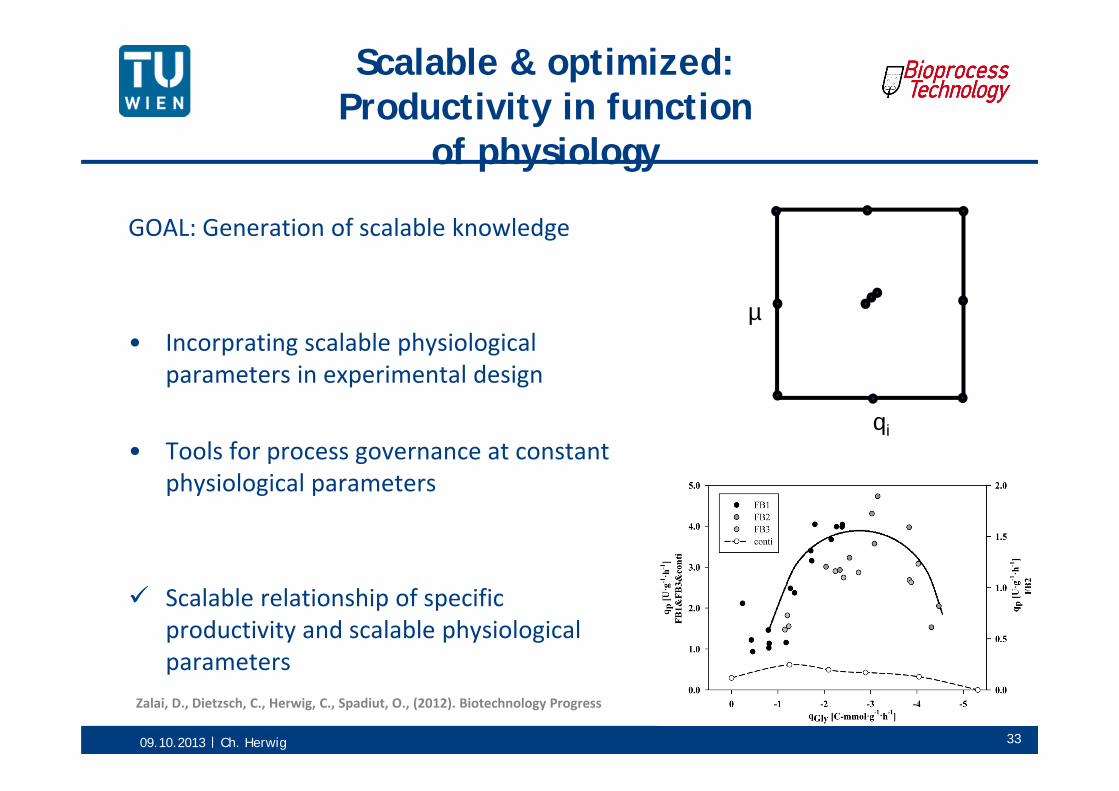
Scalable & optimized:Productivity in function
of physiology
GOAL: Generation of scalable knowledge
• Incorprating scalable physiological parameters in experimental design
• Tools for process governance at constantphysiological parameters
Scalable relationship of specificproductivity and scalable physiological parameters
µ
qi
Zalai, D., Dietzsch, C., Herwig, C., Spadiut, O., (2012). Biotechnology Progress
33
09.10.2013 Ch. Herwig
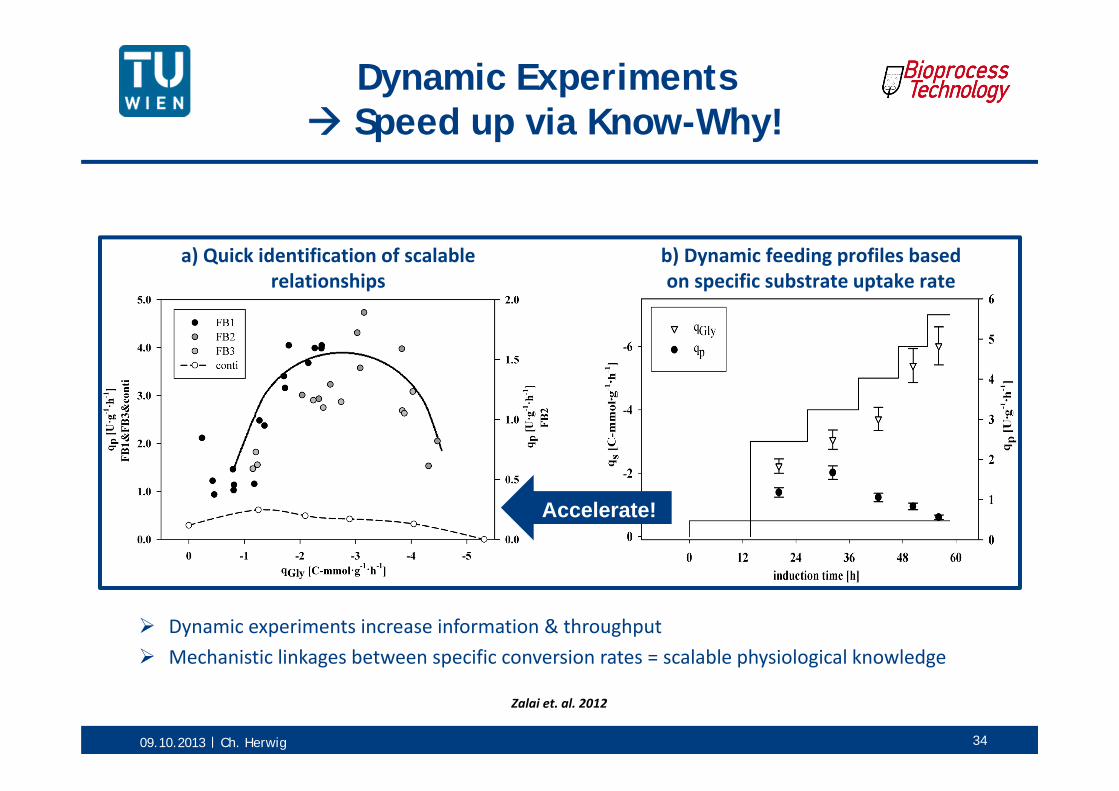
Accelerate!
a) Quick identification of scalablerelationships
b) Dynamic feeding profiles basedon specific substrate uptake rate
Zalai et. al. 2012
Dynamic Experiments Speed up via Know-Why!
Dynamic experiments increase information & throughput Mechanistic linkages between specific conversion rates = scalable physiological knowledge
34

09.10.2013 Ch. Herwig
Platform Knowledge:Soft-Sensors and dynamic
experiments
• GOAL: Efficient determination of DOE boundaries
• Link of physiology to processparameters
• Tools for real‐time extraction of physiological key parameters• Example: Determination of physiological parameters qs, µ in function of temperature
Very short experimental effort
35
0
5
10
15
20
25
30
35
40
00,10,20,30,40,50,60,70,80,9
1
0 5 10 15
Tem
p[°C
]
qs e
stim
ated
[g/
g/h]
µ
estim
ated
[h-1
]
Process Time [h]
qs estimated [g/l] µ estimated [h-1]
0
0,1
0,2
0,3
0,4
0,5
0,6
0,7
15 20 25 30 35 40
µ es
tuna
ted
K2S2
[h-1
] qs
es
timat
ed K
2S2
[g/g
/h]
Temperature [°C]µ f (t) qs f (T)µ f(T)
µ [1/h] ; qs [g/g/h] estimated
09.10.2013 Ch. Herwig
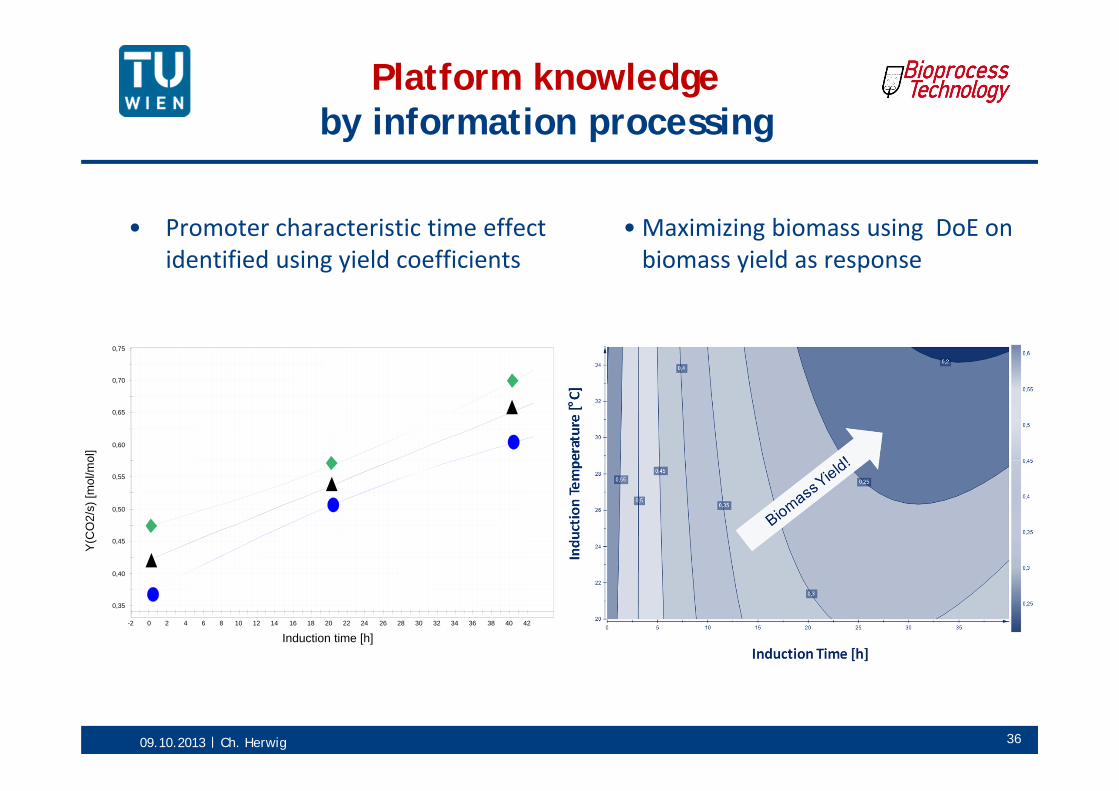
Platform knowledgeby information processing
• Promoter characteristic time effectidentified using yield coefficients
• Maximizing biomass using DoE on biomass yield as response
0,35
0,40
0,45
0,50
0,55
0,60
0,65
0,70
0,75
-2 0 2 4 6 8 10 12 14 16 18 20 22 24 26 28 30 32 34 36 38 40 42
Y(C
O2/
s) [m
ol/m
ol]
Induction time [h]
36
09.10.2013 Ch. Herwig
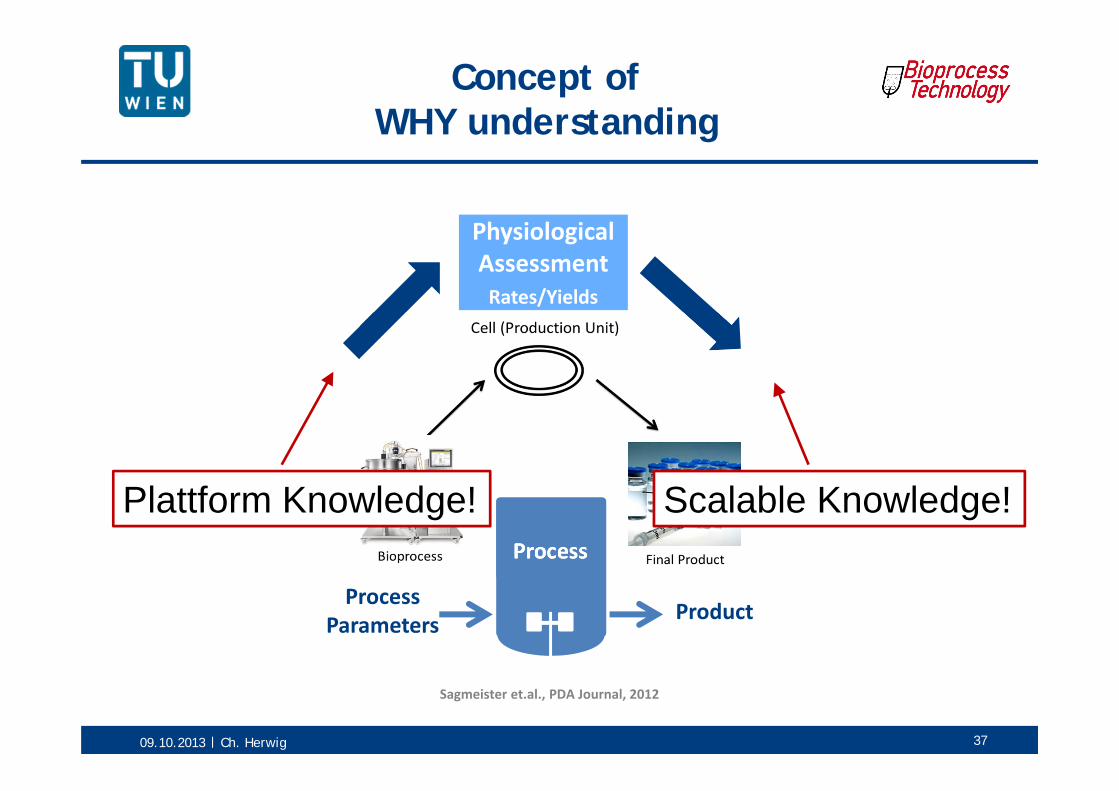
Concept ofWHY understanding
37
PhysiologicalAssessmentRates/Yields
Sagmeister et.al., PDA Journal, 2012
Process
ProcessParameters Product
Plattform Knowledge! Scalable Knowledge!

09.10.2013 Ch. Herwig
V)Conclusions
38

09.10.2013 Ch. Herwig
Benefits
Less Experiments Right Decisions
Process Transparency Through Time Resolution
Control on Optimized CPPs
Platform Knowledge Scalable & Controllable QbD Process
39
High Quality Data
Shorter Time to Market
Higher Productivity
“Why” Process Understanding
09.10.2013 Ch. Herwig
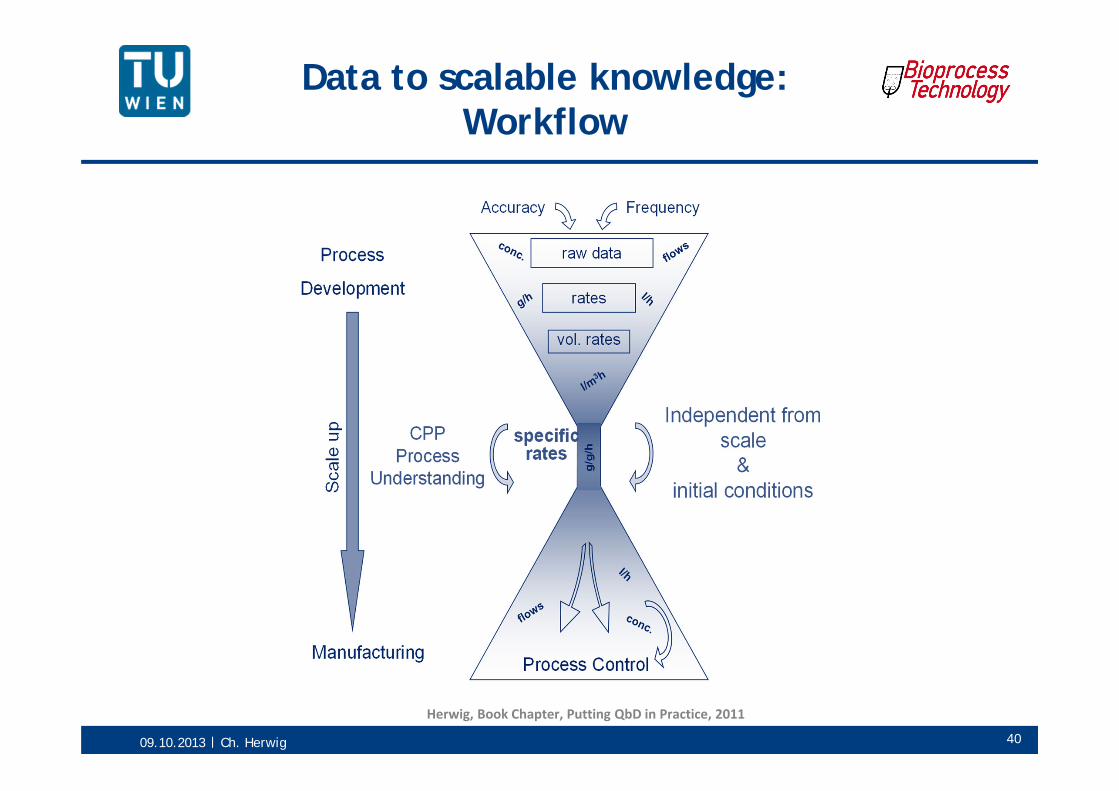
Data to scalable knowledge: Workflow
Herwig, Book Chapter, Putting QbD in Practice, 2011
40

09.10.2013 Ch. Herwig
Elemental Balancing• Posch et.al. 2012a• Wechselberger et.al. 2010, …
Process Parameters
Process Variables
VfeedcfeedVgasincgasinrpm…
.
.QAscproductcBDWcO2outcCO2out…
Yield and Rate Calculation•Wechselberger et.al. 2012•Dietzsch et.al. 2013, …
Physiological InformationDietzsch et.al 2011 a&b, Sagmeister et.al. 2012,…
Systematic Resolution (e.g DoE) Wechselberger et.al. 2012Jazini et.al. 2013, …
!Model Predictive Control
•Sagmeister et.al. 2013, …
Physiological ModelingWechselberger et.al. 2010Zalai et.al. 2012, …
Morphological ModelingPosch et.al. 2012bPosch et.al. 2013, …
Real‐time EvaluationWechselberger et.al. 2013
Herwig et.al. 2001, …Predictive Processing
InverseAnalysis
Pred
ictiv
eProcessing
Structured
Process Develop
men
t
From Understanding to Prediction
CELL
41

09.10.2013 Ch. Herwig
Benefits throughshown Approach
• Shorten process development times
• Ensure scalability
• Increase productivity
• Create synergies for product/process n+1
42
“Why” Processing
Dynamics
Real Time Approaches
Softsensors
09.10.2013 Ch. Herwig
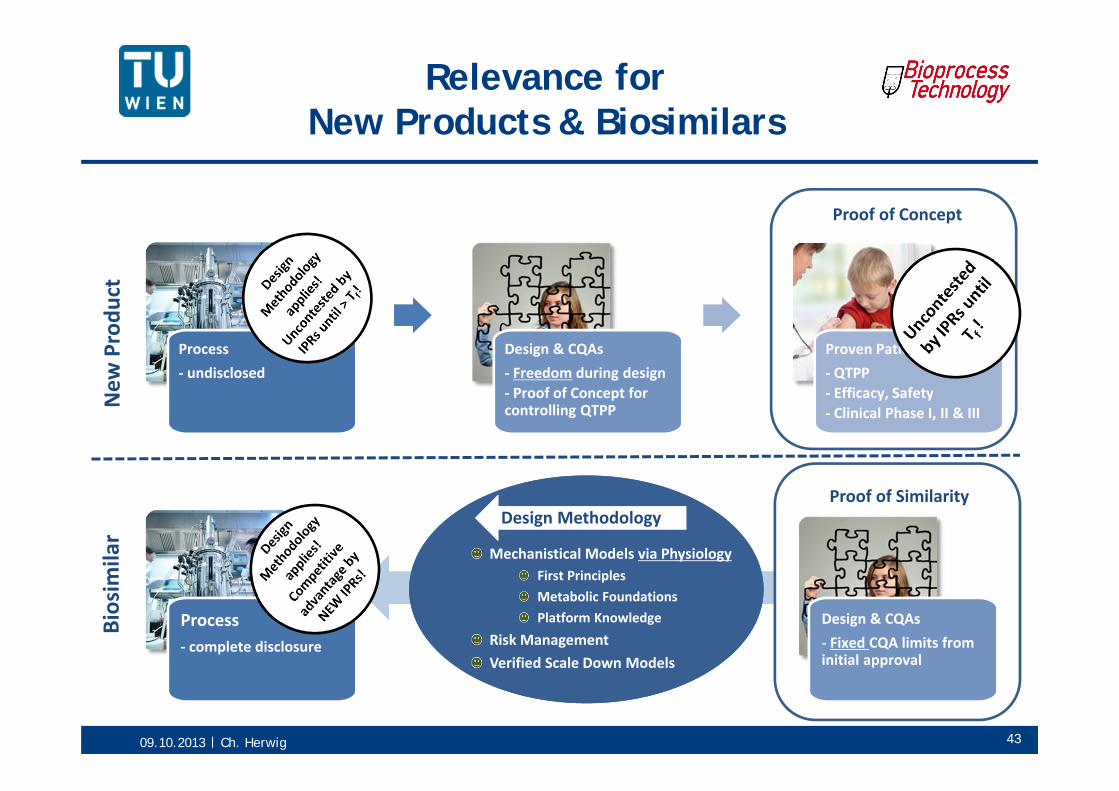
Process‐ undisclosed
Design & CQAs‐ Freedom during design‐ Proof of Concept for controlling QTPP
Proven Patient Benefit‐ QTPP‐ Efficacy, Safety‐ Clinical Phase I, II & III
Process‐ complete disclosure
New
Produ
ctBiosim
ilar
Proof of Concept
Mechanistical Models via PhysiologyFirst PrinciplesMetabolic FoundationsPlatform Knowledge
Risk ManagementVerified Scale Down Models
Design Methodology
Relevance for New Products & Biosimilars
Design & CQAs‐ Fixed CQA limits from initial approval
Proof of Similarity
43
09.10.2013 Ch. Herwig
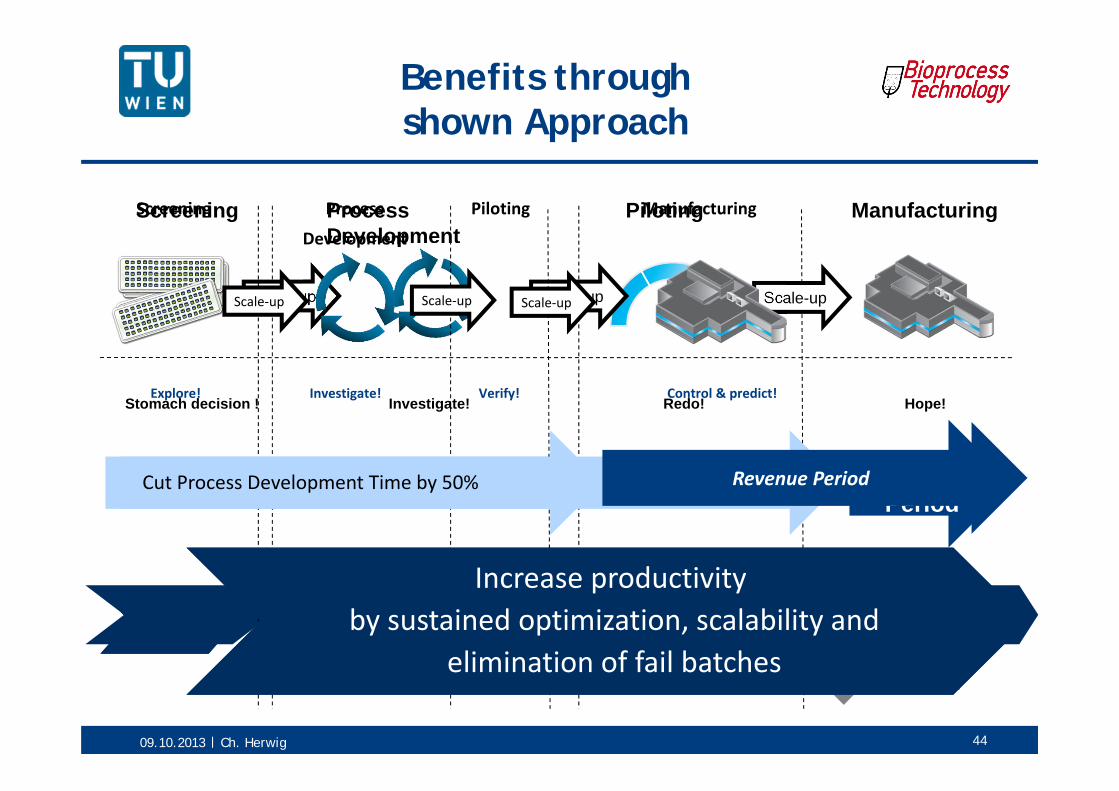
Investigate! Redo! Hope!Stomach decision !
Process Development
Piloting ManufacturingScreening
Scale-up Scale-up Scale-up
Productivity
Waste
Process Development Time Revenue Period
Benefits through shown Approach
44
Process
Development
Piloting ManufacturingScreening
Scale‐up
Increase productivity by sustained optimization, scalability and
elimination of fail batches
Increase productivity by sustained optimization, scalability and
elimination of fail batches
Cut Process Development Time by 50% Revenue Period
Investigate! Verify! Control & predict!Explore!
Scale‐up Scale‐up
09.10.2013 Ch. Herwig
Thank youfor your attention!
Univ.Prof. Dr. Christoph HerwigVienna University of TechnologyInstitute of Chemical EngineeringResearch Division Biochemical Engineering Gumpendorferstrasse 1a/ 166 - 4A-1060 WienAustria
emailto: [email protected] (Office): +43 1 58801 166400Tel (Mobile): +43 676 47 37 217Fax: +43 1 58801 166980URL : http://institute.tuwien.ac.at/chemical_engineering/bioprocess_engineering/EN/
45
https://www.facebook.com/BioVTatTUWien


