Report Code : 059_GBP_IIT_EQP_S&R_09_Ver 1_DEC 2014 Assessment of Domestic Pollution Load from Urban Agglomeration in Ganga Basin: Haryana GRBMP: Ganga River Basin Management Plan by IIT Bombay IIT Delhi IIT Guwahati IIT Kanpur IIT Kharagpur IIT Madras IIT Roorkee Indian Institutes of Technology
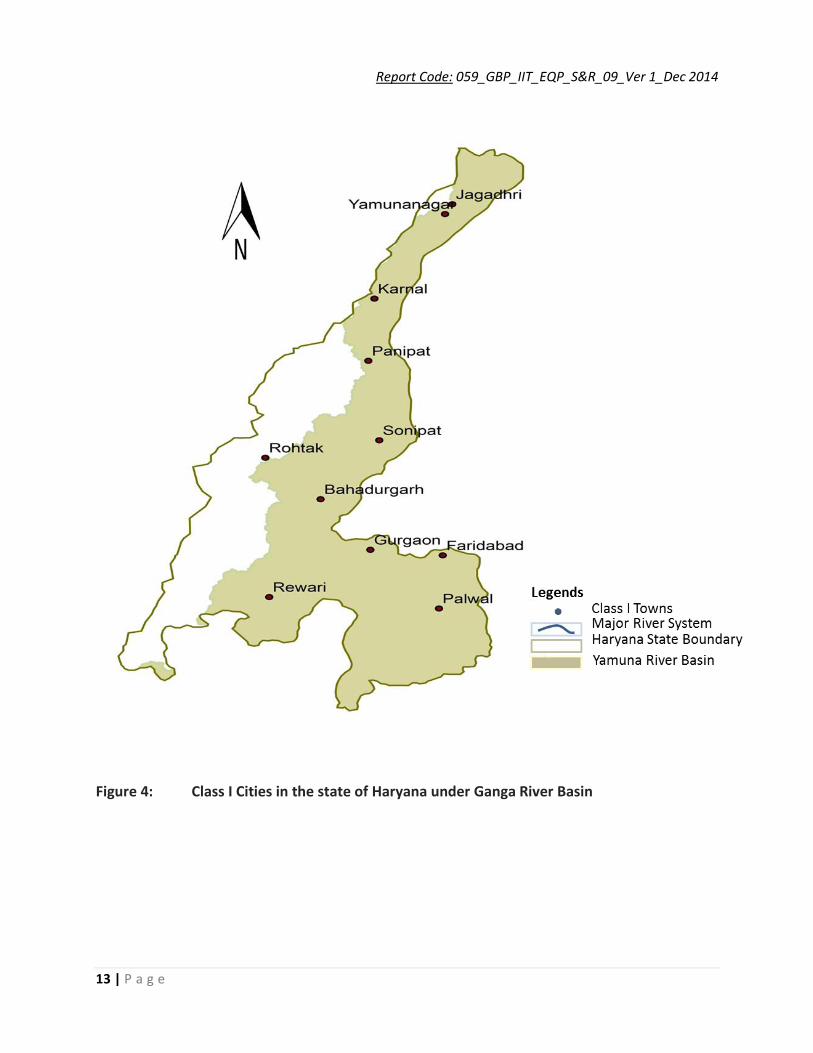
Haryana is among the most prosperous states in India, having one of the highest per-capita- income in the country, and its capital is Chandigarh. Haryana is home of epic battle of Mahabharata and recital of Bhagavad Gita by Lord Krishna. It shares border with Punjab and Himachal Pradesh in the North, and with Rajasthan in the West and South and East with Uttarakhand. Haryana has the total area of 44,212 sq. km, which is about 1.34 % of the total area of the country. Haryana has the total 19 districts and the 17th largest populated state. Haryana has a catchment area of 21265 km2 for river Yamuna and 79.5% cultivable land in Haryana under Ganga river basin. River Yamuna touches the Haryana near Kalesar (Yamuna Nager) and shares eastern boundary
with Uttar Pradesh and then finally enters to Delhi. The salient features of some major
tributaries contributing directly or indirectly to the Ganga basin in the state of Haryana are
presented in Table 1.
Table 1: The Salient Features of Tributaries of the Ganga River Basin Contributing to the
River Ganga in the State of Haryana
Characteristics Yamuna
Position Right bank
Region of origin Yamunotri glacier at Bandar Punch
Mouth Ganga
Total length (km) 1376
Total catchment area (sq km) 366,223
Catchment area in Haryana (sq km) 21,265
River bed/ Soil texture Alluvial about 42% of the basin area, followed by medium black soil 25.5% and mixed red and black soil 15%
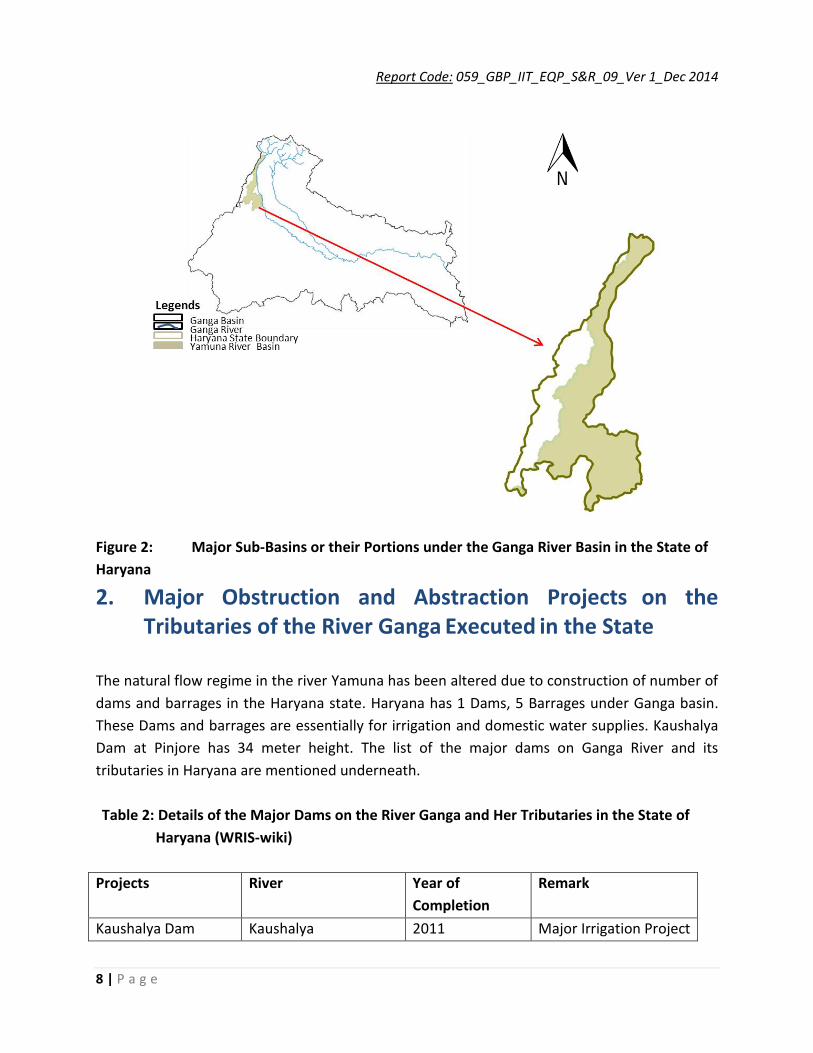
The total annual average rainfall in the state of Haryana is in the order of 619 mm and it
contributes approximately 1.6% of the total rainfall in the catchment of the Ganga basin. Ganga
basin and Haryana state boundaries are shown in Figure 1, and the Yamuna basin in Haryana
Water Balance & Pollution Load (Domestic) Fact Sheet City: Bahadur Garh State: Haryana S. No. Items Value
1 Total Area (sq km) : 29.50 2 Population as in 2011 : 170767 3 Population Growth Rate as in 2011 (%) : 29.44 4 Total Number of Wards : 31 5 Population per Ward (Thousands) : 5509 6 Total Number of Household as in 2011 : 34910 7 Number of Household per Ward : 1126 8 Surface Water Supply (MLD) : NA 9 Ground Water (GW) Supply (MLD) : NA
10 Number of Bore Wells : NA 11 Ground Water Extraction per Bore Well (MLD) : NA 12 Number of Hand Pumps/ Tube wells : NA 13 Ground Water Extraction per Hand Pump (lpd) : 500 14 Number of Pumping Stations for Water Supply : NIL 15 Total Pumping Capacity (MLD) : NA 17 Total Water Supply from ULB and Non-ULB Sources (MLD) : 23.1 18 Average Water Supply Rate from ULB & Non-ULB Sources (lpcd) : 135.0 19 Total Sewage Generation (MLD)* : 18.4 20 Per Capita Sewage Generation (lpcd) : 108.0 21 Sewage Collection (MLD) : NA 22 Percentage of Sewage Collection (%) : NA 23 Number of STPs : 3.0 24 Total Installed Capacity of STPs under GAP I & II (MLD) : 18.0 25 Current Utilized Capacity of STPs (MLD) : NA 26 Percentage Utilization of Installed Capacity (%) : NA 27 Capacity of STPs Sanctioned under JNNURM & Others (MLD) : 1.0
28 Pollution Load (Domestic) (Method 1: Actual Flow) (kg/d) BOD
5 : NA
COD : NA TKN : NA
29 Pollution Load (Domestic) (Method 2: Per Capita Contribution) (kg/d)
31 Name of River/Streams for Wastewater Disposal : Yamuna River 32 Number of Drains/Nallah for Wastewater Disposal : 2 33 Number of Water Bodies : NA 34 Gross Area of Water Bodies (Hectare) : NA 35 Area of Water Bodies as % of Total Area : <<< 1
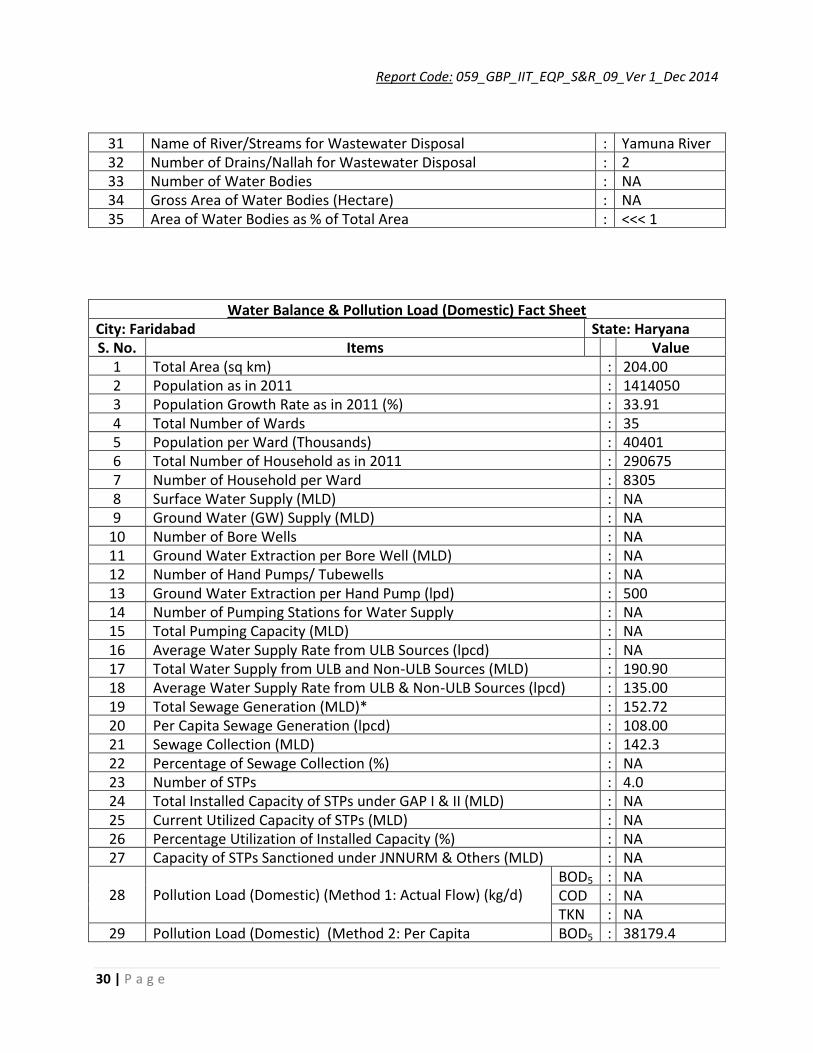
Water Balance & Pollution Load (Domestic) Fact Sheet City: Faridabad State: Haryana S. No. Items Value
1 Total Area (sq km) : 204.00 2 Population as in 2011 : 1414050 3 Population Growth Rate as in 2011 (%) : 33.91 4 Total Number of Wards : 35 5 Population per Ward (Thousands) : 40401 6 Total Number of Household as in 2011 : 290675 7 Number of Household per Ward : 8305 8 Surface Water Supply (MLD) : NA 9 Ground Water (GW) Supply (MLD) : NA
10 Number of Bore Wells : NA 11 Ground Water Extraction per Bore Well (MLD) : NA 12 Number of Hand Pumps/ Tubewells : NA 13 Ground Water Extraction per Hand Pump (lpd) : 500 14 Number of Pumping Stations for Water Supply : NA 15 Total Pumping Capacity (MLD) : NA 16 Average Water Supply Rate from ULB Sources (lpcd) : NA 17 Total Water Supply from ULB and Non-ULB Sources (MLD) : 190.90 18 Average Water Supply Rate from ULB & Non-ULB Sources (lpcd) : 135.00 19 Total Sewage Generation (MLD)* : 152.72 20 Per Capita Sewage Generation (lpcd) : 108.00 21 Sewage Collection (MLD) : 142.3 22 Percentage of Sewage Collection (%) : NA 23 Number of STPs : 4.0 24 Total Installed Capacity of STPs under GAP I & II (MLD) : NA 25 Current Utilized Capacity of STPs (MLD) : NA 26 Percentage Utilization of Installed Capacity (%) : NA 27 Capacity of STPs Sanctioned under JNNURM & Others (MLD) : NA
28 Pollution Load (Domestic) (Method 1: Actual Flow) (kg/d) BOD5 : NA COD : NA TKN : NA
30 Wastewater Disposal Means : River Disposal 31 Name of River/Streams for Wastewater Disposal : Yamuna River 32 Number of Drains/Nallah for Wastewater Disposal : 4 33 Number of Water Bodies : 4 34 Gross Area of Water Bodies (Hectare) : NA 35 Area of Water Bodies as % of Total Area : <<< 1
Water Balance & Pollution Load (Domestic) Fact Sheet City: Gurgaon State: Haryana S. No. Items Value
1 Total Area (sq km) : 184.59 2 Population as in 2011 : 886519 3 Population Growth Rate as in 2011 (%) : 340.30 4 Total Number of Wards : 74 5 Population per Ward (Thousands) : 11980 6 Total Number of Household as in 2011 : 208229 7 Number of Household per Ward : 2814 8 Surface Water Supply (MLD) : NA 9 Ground Water (GW) Supply (MLD) : NA
10 Number of Bore Wells : NA 11 Ground Water Extraction per Bore Well (MLD) : NA 12 Number of Hand Pumps/ Tubewells : NA 13 Ground Water Extraction per Hand Pump (lpd) : 500 14 Number of Pumping Stations for Water Supply : NA 15 Total Pumping Capacity (MLD) : NA 17 Total Water Supply from ULB and Non-ULB Sources (MLD) : 119.7 18 Average Water Supply Rate from ULB & Non-ULB Sources (lpcd) : 135.0 19 Total Sewage Generation (MLD)* : 95.7 20 Per Capita Sewage Generation (lpcd) : 108.0 21 Sewage Collection (MLD) : NA 22 Percentage of Sewage Collection (%) : NA 23 Number of STPs : 3.0 24 Total Installed Capacity of STPs under GAP I & II (MLD) : 148.0 25 Current Utilized Capacity of STPs (MLD) : NA 26 Percentage Utilization of Installed Capacity (%) : NA 27 Capacity of STPs Sanctioned under JNNURM & Others (MLD) : NA
28 Pollution Load (Domestic) (Method 1: Actual Flow) (kg/d) BOD5 : NA COD : NA
29 Pollution Load (Domestic) (Method 2: Per Capita Contribution) (kg/d)
BOD5 : 23936.0 COD : 40691.2 TKN : 4787.2
30 Wastewater Disposal Means : River Disposal 31 Name of River/Streams for Wastewater Disposal : Yamuna River
32 Number of Drains/Nallah for Wastewater Disposal : 4.0 33 Number of Water Bodies : 7.0 34 Gross Area of Water Bodies (Hectare) : NA 35 Area of Water Bodies as % of Total Area : <<< 1
Water Balance & Pollution Load (Domestic) Fact Sheet City: Jagadhari State: Haryana S. No. Items Value
1 Total Area (sq km) : 24.80 2 Population as in 2011 : 124894 3 Population Growth Rate as in 2011 (%) : 23.30 4 Total Number of Wards : 31 5 Population per Ward (Thousands) : 4029 6 Total Number of Household as in 2011 : 26716 7 Number of Household per Ward : 862 8 Surface Water Supply (MLD) : NA 9 Ground Water (GW) Supply (MLD) : NA
10 Number of Bore Wells : NA 11 Ground Water Extraction per Bore Well (MLD) : NA 12 Number of Hand Pumps/ Tubewells : NA 13 Ground Water Extraction per Hand Pump (lpd) : 500 14 Number of Pumping Stations for Water Supply : NA 15 Total Pumping Capacity (MLD) : NA 16 Average Water Supply Rate from ULB Sources (lpcd) : NA 17 Total Water Supply from ULB and Non-ULB Sources (MLD) : 16.9 18 Average Water Supply Rate from ULB & Non-ULB Sources (lpcd) : 135 19 Total Sewage Generation (MLD)* : 13.49 20 Per Capita Sewage Generation (lpcd) : 108 21 Sewage Collection (MLD) : NA 22 Percentage of Sewage Collection (%) : NA 23 Number of STPs : NA 24 Total Installed Capacity of STPs under GAP I & II (MLD) : NA 25 Current Utilized Capacity of STPs (MLD) : NA 26 Percentage Utilization of Installed Capacity (%) : NA
27 Capacity of STPs Sanctioned under JNNURM & Others (MLD) : NA
28 Pollution Load (Domestic) (Method 1: Actual Flow) (kg/d)
BOD5 : NA COD : NA TKN : NA
29 Pollution Load (Domestic) (Method 2: Per Capita Contribution) (kg/d)
BOD5 : 3372.1 COD : 5732.6 TKN : 674.4
30 Wastewater Disposal Means : River Disposal 31 Name of River/Streams for Wastewater Disposal : Yamuna River
32 Number of Drains/Nallah for Wastewater Disposal : 1 33 Number of Water Bodies : NA 34 Gross Area of Water Bodies (Hectare) : NA 35 Area of Water Bodies as % of Total Area : <<< 1
Water Balance & Pollution Load (Domestic) Fact Sheet City: Karnal State: Haryana S. No. Items Value
1 Total Area (sq km) : 29.46 2 Population as in 2011 : 302140 3 Population Growth Rate as in 2011 (%) : 36.57 4 Total Number of Wards : 20 5 Population per Ward (Thousands) : 15,107 6 Total Number of Household as in 2011 : 63280 7 Number of Household per Ward : 11062 8 Surface Water Supply (MLD) : NA 9 Ground Water (GW) Supply (MLD) : NA
10 Number of Bore Wells : NA 11 Ground Water Extraction per Bore Well (MLD) : NA 12 Number of Hand Pumps/ Tubewells : NA 13 Ground Water Extraction per Hand Pump (lpd) : 500 14 Number of Pumping Stations for Water Supply : NA 15 Total Pumping Capacity (MLD) : NA 16 Average Water Supply Rate from ULB Sources (lpcd) : NA 17 Total Water Supply from ULB and Non-ULB Sources (MLD) : 40.79 18 Average Water Supply Rate from ULB & Non-ULB Sources (lpcd) : 135.00 19 Total Sewage Generation (MLD)* : 32.63 20 Per Capita Sewage Generation (lpcd) : 108.00 21 Sewage Collection (MLD) : 30.84 22 Percentage of Sewage Collection (%) : NA 23 Number of STPs : 2.0
24 Total Installed Capacity of STPs under GAP I & II (MLD) : 48.0 25 Current Utilized Capacity of STPs (MLD) : NA 26 Percentage Utilization of Installed Capacity (%) : NA 27 Capacity of STPs Sanctioned under JNNURM & Others (MLD) : NA
28 Pollution Load (Domestic) (Method 1: Actual Flow) (kg/d)
BOD5 : NA COD : NA TKN : NA
29 Pollution Load (Domestic) (Method 2: Per Capita Contribution) (kg/d)
BOD5 : 8157.8 COD : 13868.2 TKN : 1631.6
30 Wastewater Disposal Means : River Disposal 31 Name of River/Streams for Wastewater Disposal : Yamuna River 32 Number of Drains/Nallah for Wastewater Disposal : 1 33 Number of Water Bodies : NA 34 Gross Area of Water Bodies (Hectare) : NA 35 Area of Water Bodies as % of Total Area : <<< 1
Water Balance & Pollution Load (Domestic) Fact Sheet City: Palwal State: Haryana S. No. Items Value
1 Total Area (sq km) : 8.42 2 Population as in 2011 : 131926 3 Population Growth Rate as in 2011 (%) : 30.98 4 Total Number of Wards : 32 5 Population per Ward (Thousands) : 4,123 6 Total Number of Household as in 2011 : 23742 7 Number of Household per Ward : 742 8 Surface Water Supply (MLD) : NA 9 Ground Water (GW) Supply (MLD) : NA
10 Number of Bore Wells : NA 11 Ground Water Extraction per Bore Well (MLD) : NA 12 Number of Hand Pumps/ Tube wells : NA 13 Ground Water Extraction per Hand Pump (lpd) : 500 14 Number of Pumping Stations for Water Supply : NA 15 Total Pumping Capacity (MLD) : NA 16 Average Water Supply Rate from ULB Sources (lpcd) : NA 17 Total Water Supply from ULB and Non-ULB Sources (MLD) : 17.81 18 Average Water Supply Rate from ULB & Non-ULB Sources (lpcd) : 135.00 19 Total Sewage Generation (MLD)* : 14.25 20 Per Capita Sewage Generation (lpcd) : 108.00
21 Sewage Collection (MLD) : NA 22 Percentage of Sewage Collection (%) : NA 23 Number of STPs : 1 24 Total Installed Capacity of STPs under GAP I & II (MLD) : 9 25 Current Utilized Capacity of STPs (MLD) : 9 26 Percentage Utilization of Installed Capacity (%) : NA 27 Capacity of STPs Sanctioned under JNNURM & Others (MLD) : NA
28 Pollution Load (Domestic) (Method 1: Actual Flow) (kg/d) BOD5 : NA COD : NA TKN : NA
29 Pollution Load (Domestic) (Method 2: Per Capita Contribution) (kg/d)
BOD5 : 3562.0 COD : 6055.4 TKN : 712.4
30 Wastewater Disposal Means : River Disposal 31 Name of River/Streams for Wastewater Disposal : Yamuna River 32 Number of Drains/Nallah for Wastewater Disposal : 2 33 Number of Water Bodies : NA 34 Gross Area of Water Bodies (Hectare) : NA 35 Area of Water Bodies as % of Total Area : <<< 1
Water Balance & Pollution Load (Domestic) Fact Sheet City: Panipat State: Haryana S. No. Items Value
1 Total Area (sq km) : 21.86 2 Population as in 2011 : 295970 3 Population Growth Rate as in 2011 (%) : 10.07 4 Total Number of Wards : 24 5 Population per Ward (Thousands) : 12,332 6 Total Number of Household as in 2011 : 60905 7 Number of Household per Ward : 2538 8 Surface Water Supply (MLD) : NA 9 Ground Water (GW) Supply (MLD) : NA
10 Number of Bore Wells : NA 11 Ground Water Extraction per Bore Well (MLD) : NA 12 Number of Hand Pumps/ Tube wells : NA 13 Ground Water Extraction per Hand Pump (lpd) : 500 14 Number of Pumping Stations for Water Supply : 2 15 Total Pumping Capacity (MLD) : NA 16 Average Water Supply Rate from ULB Sources (lpcd) : NA 17 Total Water Supply from ULB and Non-ULB Sources (MLD) : 40.0
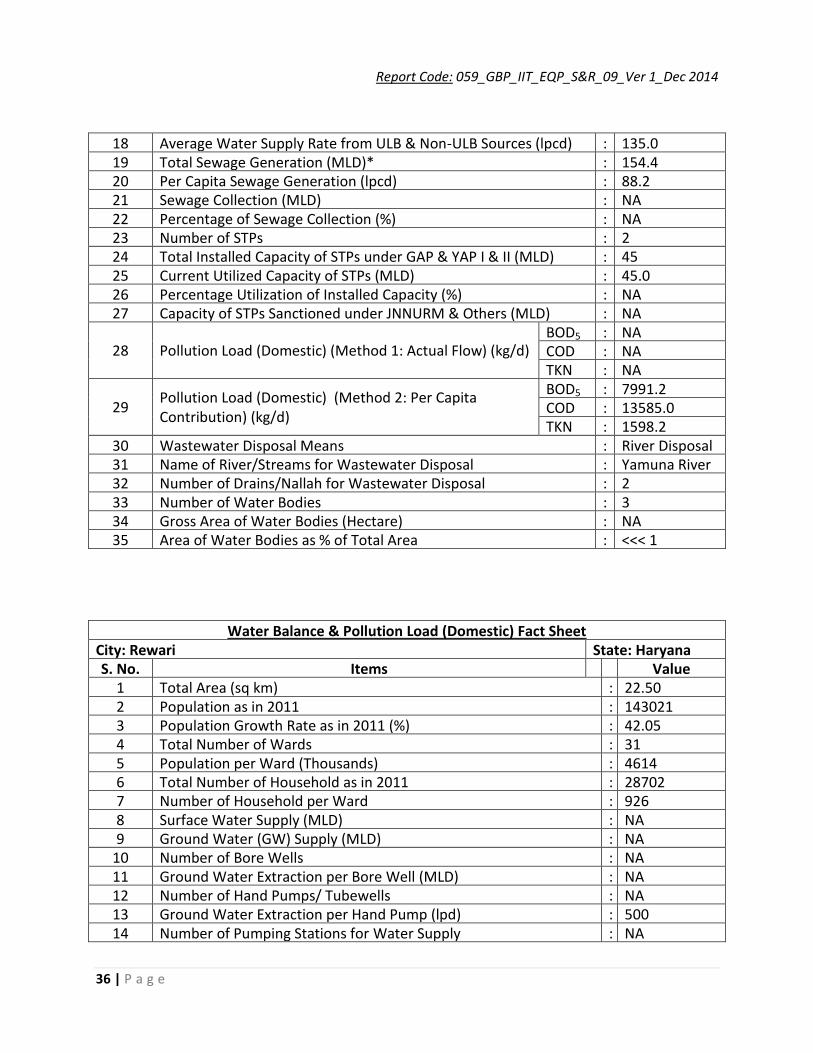
18 Average Water Supply Rate from ULB & Non-ULB Sources (lpcd) : 135.0 19 Total Sewage Generation (MLD)* : 154.4 20 Per Capita Sewage Generation (lpcd) : 88.2 21 Sewage Collection (MLD) : NA 22 Percentage of Sewage Collection (%) : NA 23 Number of STPs : 2 24 Total Installed Capacity of STPs under GAP & YAP I & II (MLD) : 45 25 Current Utilized Capacity of STPs (MLD) : 45.0 26 Percentage Utilization of Installed Capacity (%) : NA 27 Capacity of STPs Sanctioned under JNNURM & Others (MLD) : NA
28 Pollution Load (Domestic) (Method 1: Actual Flow) (kg/d) BOD5 : NA COD : NA TKN : NA
29 Pollution Load (Domestic) (Method 2: Per Capita Contribution) (kg/d)
BOD5 : 7991.2 COD : 13585.0 TKN : 1598.2
30 Wastewater Disposal Means : River Disposal 31 Name of River/Streams for Wastewater Disposal : Yamuna River 32 Number of Drains/Nallah for Wastewater Disposal : 2 33 Number of Water Bodies : 3 34 Gross Area of Water Bodies (Hectare) : NA 35 Area of Water Bodies as % of Total Area : <<< 1
Water Balance & Pollution Load (Domestic) Fact Sheet City: Rewari State: Haryana S. No. Items Value
1 Total Area (sq km) : 22.50 2 Population as in 2011 : 143021 3 Population Growth Rate as in 2011 (%) : 42.05 4 Total Number of Wards : 31 5 Population per Ward (Thousands) : 4614 6 Total Number of Household as in 2011 : 28702 7 Number of Household per Ward : 926 8 Surface Water Supply (MLD) : NA 9 Ground Water (GW) Supply (MLD) : NA
10 Number of Bore Wells : NA 11 Ground Water Extraction per Bore Well (MLD) : NA 12 Number of Hand Pumps/ Tubewells : NA 13 Ground Water Extraction per Hand Pump (lpd) : 500 14 Number of Pumping Stations for Water Supply : NA
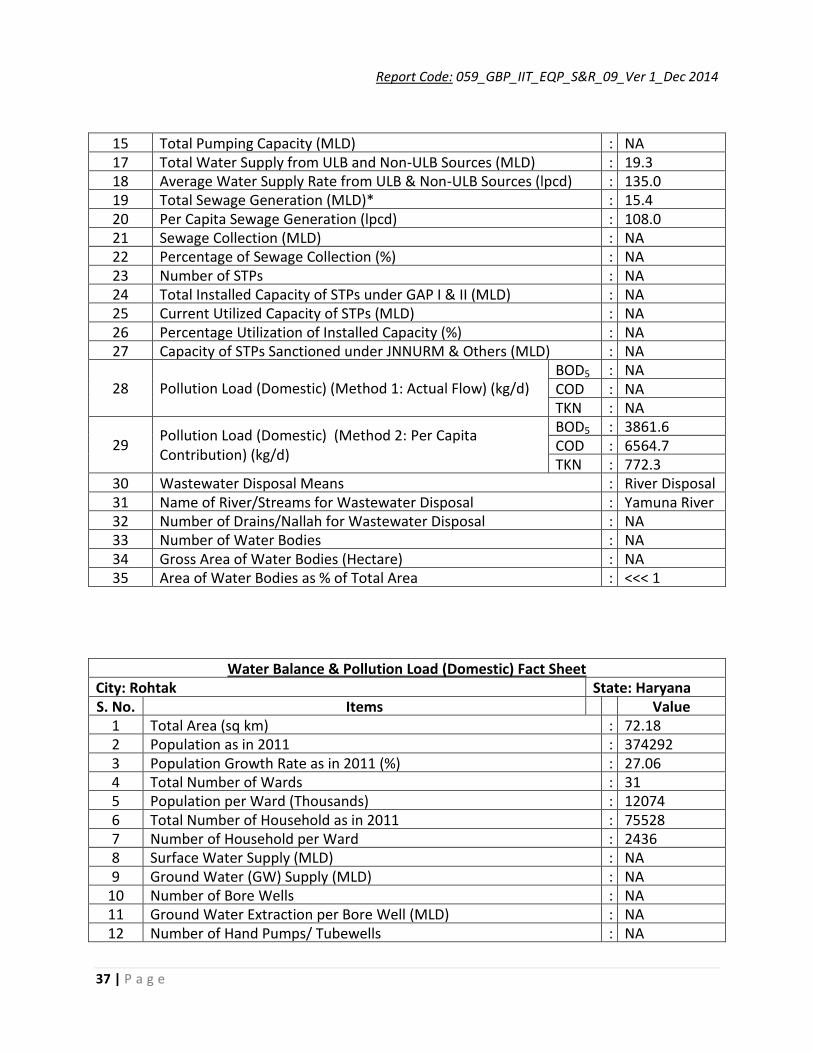
15 Total Pumping Capacity (MLD) : NA 17 Total Water Supply from ULB and Non-ULB Sources (MLD) : 19.3 18 Average Water Supply Rate from ULB & Non-ULB Sources (lpcd) : 135.0 19 Total Sewage Generation (MLD)* : 15.4 20 Per Capita Sewage Generation (lpcd) : 108.0 21 Sewage Collection (MLD) : NA 22 Percentage of Sewage Collection (%) : NA 23 Number of STPs : NA 24 Total Installed Capacity of STPs under GAP I & II (MLD) : NA 25 Current Utilized Capacity of STPs (MLD) : NA 26 Percentage Utilization of Installed Capacity (%) : NA 27 Capacity of STPs Sanctioned under JNNURM & Others (MLD) : NA
28 Pollution Load (Domestic) (Method 1: Actual Flow) (kg/d) BOD5 : NA COD : NA TKN : NA
29 Pollution Load (Domestic) (Method 2: Per Capita Contribution) (kg/d)
BOD5 : 3861.6 COD : 6564.7 TKN : 772.3
30 Wastewater Disposal Means : River Disposal 31 Name of River/Streams for Wastewater Disposal : Yamuna River 32 Number of Drains/Nallah for Wastewater Disposal : NA 33 Number of Water Bodies : NA 34 Gross Area of Water Bodies (Hectare) : NA 35 Area of Water Bodies as % of Total Area : <<< 1
Water Balance & Pollution Load (Domestic) Fact Sheet City: Rohtak State: Haryana S. No. Items Value
1 Total Area (sq km) : 72.18 2 Population as in 2011 : 374292 3 Population Growth Rate as in 2011 (%) : 27.06 4 Total Number of Wards : 31 5 Population per Ward (Thousands) : 12074 6 Total Number of Household as in 2011 : 75528 7 Number of Household per Ward : 2436 8 Surface Water Supply (MLD) : NA 9 Ground Water (GW) Supply (MLD) : NA
10 Number of Bore Wells : NA 11 Ground Water Extraction per Bore Well (MLD) : NA 12 Number of Hand Pumps/ Tubewells : NA
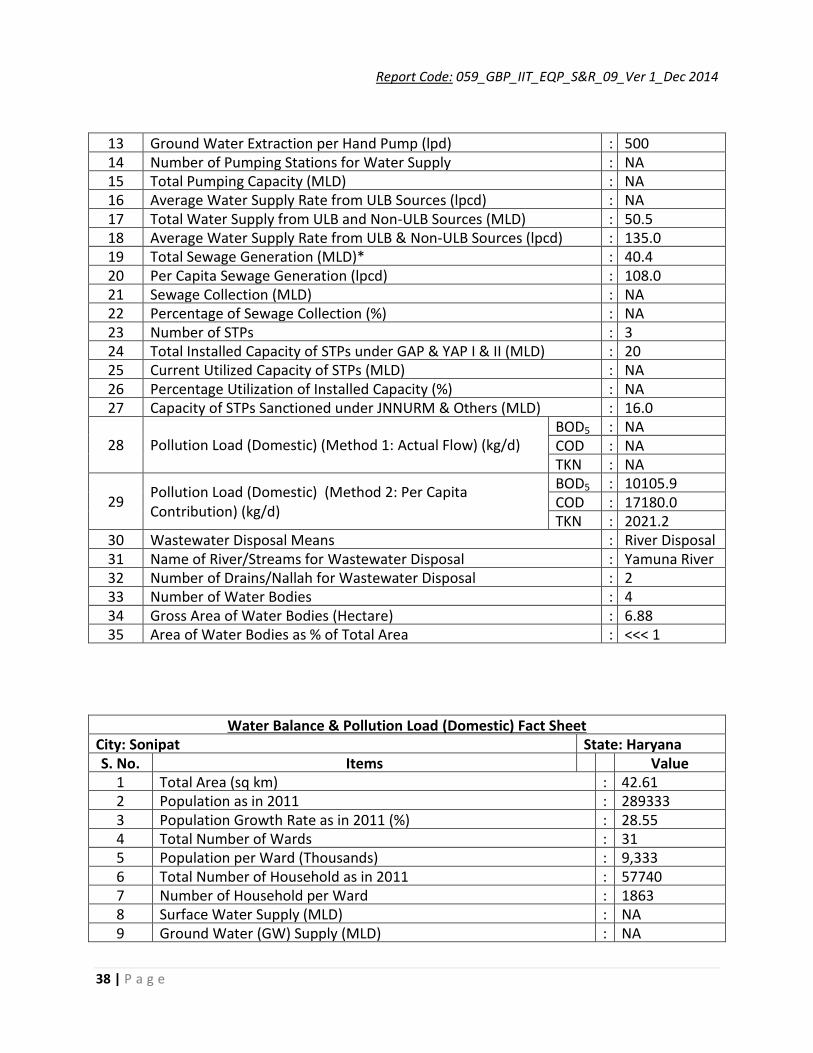
13 Ground Water Extraction per Hand Pump (lpd) : 500 14 Number of Pumping Stations for Water Supply : NA 15 Total Pumping Capacity (MLD) : NA 16 Average Water Supply Rate from ULB Sources (lpcd) : NA 17 Total Water Supply from ULB and Non-ULB Sources (MLD) : 50.5 18 Average Water Supply Rate from ULB & Non-ULB Sources (lpcd) : 135.0 19 Total Sewage Generation (MLD)* : 40.4 20 Per Capita Sewage Generation (lpcd) : 108.0 21 Sewage Collection (MLD) : NA 22 Percentage of Sewage Collection (%) : NA 23 Number of STPs : 3 24 Total Installed Capacity of STPs under GAP & YAP I & II (MLD) : 20 25 Current Utilized Capacity of STPs (MLD) : NA 26 Percentage Utilization of Installed Capacity (%) : NA 27 Capacity of STPs Sanctioned under JNNURM & Others (MLD) : 16.0
28 Pollution Load (Domestic) (Method 1: Actual Flow) (kg/d) BOD5 : NA COD : NA TKN : NA
29 Pollution Load (Domestic) (Method 2: Per Capita Contribution) (kg/d)
BOD5 : 10105.9 COD : 17180.0 TKN : 2021.2
30 Wastewater Disposal Means : River Disposal 31 Name of River/Streams for Wastewater Disposal : Yamuna River 32 Number of Drains/Nallah for Wastewater Disposal : 2 33 Number of Water Bodies : 4 34 Gross Area of Water Bodies (Hectare) : 6.88 35 Area of Water Bodies as % of Total Area : <<< 1
Water Balance & Pollution Load (Domestic) Fact Sheet City: Sonipat State: Haryana S. No. Items Value
1 Total Area (sq km) : 42.61 2 Population as in 2011 : 289333 3 Population Growth Rate as in 2011 (%) : 28.55 4 Total Number of Wards : 31 5 Population per Ward (Thousands) : 9,333 6 Total Number of Household as in 2011 : 57740 7 Number of Household per Ward : 1863 8 Surface Water Supply (MLD) : NA 9 Ground Water (GW) Supply (MLD) : NA
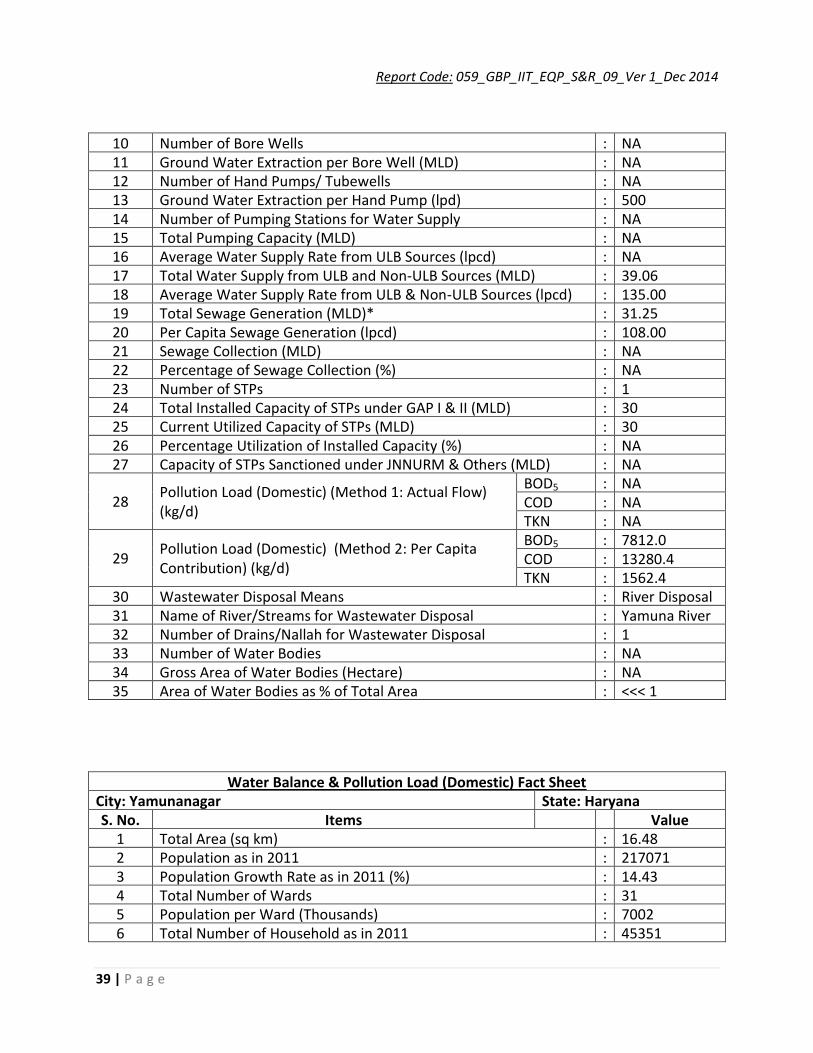
10 Number of Bore Wells : NA 11 Ground Water Extraction per Bore Well (MLD) : NA 12 Number of Hand Pumps/ Tubewells : NA 13 Ground Water Extraction per Hand Pump (lpd) : 500 14 Number of Pumping Stations for Water Supply : NA 15 Total Pumping Capacity (MLD) : NA 16 Average Water Supply Rate from ULB Sources (lpcd) : NA 17 Total Water Supply from ULB and Non-ULB Sources (MLD) : 39.06 18 Average Water Supply Rate from ULB & Non-ULB Sources (lpcd) : 135.00 19 Total Sewage Generation (MLD)* : 31.25 20 Per Capita Sewage Generation (lpcd) : 108.00 21 Sewage Collection (MLD) : NA 22 Percentage of Sewage Collection (%) : NA 23 Number of STPs : 1 24 Total Installed Capacity of STPs under GAP I & II (MLD) : 30 25 Current Utilized Capacity of STPs (MLD) : 30 26 Percentage Utilization of Installed Capacity (%) : NA 27 Capacity of STPs Sanctioned under JNNURM & Others (MLD) : NA
28 Pollution Load (Domestic) (Method 1: Actual Flow) (kg/d)
BOD5 : NA COD : NA TKN : NA
29 Pollution Load (Domestic) (Method 2: Per Capita Contribution) (kg/d)
BOD5 : 7812.0 COD : 13280.4 TKN : 1562.4
30 Wastewater Disposal Means : River Disposal 31 Name of River/Streams for Wastewater Disposal : Yamuna River 32 Number of Drains/Nallah for Wastewater Disposal : 1 33 Number of Water Bodies : NA 34 Gross Area of Water Bodies (Hectare) : NA 35 Area of Water Bodies as % of Total Area : <<< 1
Water Balance & Pollution Load (Domestic) Fact Sheet City: Yamunanagar State: Haryana S. No. Items Value
1 Total Area (sq km) : 16.48 2 Population as in 2011 : 217071 3 Population Growth Rate as in 2011 (%) : 14.43 4 Total Number of Wards : 31 5 Population per Ward (Thousands) : 7002 6 Total Number of Household as in 2011 : 45351
7 Number of Household per Ward : 1463 8 Surface Water Supply (MLD) : NA 9 Ground Water (GW) Supply (MLD) : NA
10 Number of Bore Wells : NA 11 Ground Water Extraction per Bore Well (MLD) : NA 12 Number of Hand Pumps/ Tubewells : NA 13 Ground Water Extraction per Hand Pump (lpd) : 500 14 Number of Pumping Stations for Water Supply : NA 15 Total Pumping Capacity (MLD) : NA 17 Total Water Supply from ULB and Non-ULB Sources (MLD) : 29.3 18 Average Water Supply Rate from ULB & Non-ULB Sources (lpcd) : 135.0 19 Total Sewage Generation (MLD)* : 23.4 20 Per Capita Sewage Generation (lpcd) : 108.0 21 Sewage Collection (MLD) : NA 22 Percentage of Sewage Collection (%) : NA 23 Number of STPs : 2 24 Total Installed Capacity of STPs under GAP I & II (MLD) : 35 25 Current Utilized Capacity of STPs (MLD) : 35.0 26 Percentage Utilization of Installed Capacity (%) : NA 27 Capacity of STPs Sanctioned under JNNURM & Others (MLD) : NA
28 Pollution Load (Domestic) (Method 1: Actual Flow) (kg/d)
BOD5 : NA COD : NA TKN : NA
29 Pollution Load (Domestic) (Method 2: Per Capita Contribution) (kg/d)
BOD5 : 5860.9 COD : 9963.6 TKN : 1172.2
30 Wastewater Disposal Means : River Disposal 31 Name of River/Streams for Wastewater Disposal : Yamuna River 32 Number of Drains/Nallah for Wastewater Disposal : 4 33 Number of Water Bodies : 2 34 Gross Area of Water Bodies (Hectare) : 3.70 35 Area of Water Bodies as % of Total Area : <<< 1
1 Total Area (sq km) : 5.42 2 Population as in 2011 : 56337 3 Population Growth Rate as in 2011 (%) : 25.49 4 Total Number of Wards : 19 5 Population per Ward (Thousands) : 2965 6 Total Number of Household as in 2011 : 11074 7 Number of Household per Ward : 583 8 Surface Water Supply (MLD) : NA 9 Ground Water (GW) Supply (MLD) : NA
10 Number of Bore Wells : NA 11 Ground Water Extraction per Bore Well (MLD) : NA 12 Number of Hand Pumps/ Tubewells : NA 13 Ground Water Extraction per Hand Pump (lpd) : 500 14 Number of Pumping Stations for Water Supply : NA 15 Total Pumping Capacity (MLD) : NA 16 Average Water Supply Rate from ULB Sources (lpcd) : NA 17 Total Water Supply from ULB and Non-ULB Sources (MLD) : 7.61 18 Average Water Supply Rate from ULB & Non-ULB Sources (lpcd) : 135 19 Total Sewage Generation (MLD)* : 6.08 20 Per Capita Sewage Generation (lpcd) : 108 21 Sewage Collection (MLD) : NA 22 Percentage of Sewage Collection (%) : NA 23 Number of STPs : 1 24 Total Installed Capacity of STPs under GAP I & II (MLD) : 9 25 Current Utilized Capacity of STPs (MLD) : 5.9 26 Percentage Utilization of Installed Capacity (%) : NA 27 Capacity of STPs Sanctioned under JNNURM & Others (MLD) : NA
28 Pollution Load (Domestic) (Method 1: Actual Flow) (kg/d) BOD5 : NA COD : NA TKN : NA
29 Pollution Load (Domestic) (Method 2: Per Capita Contribution) (kg/d)
BOD5 : 1521.1 COD : 2585.9 TKN : 304.2
30 Wastewater Disposal Means : River Disposal 31 Name of River/Streams for Wastewater Disposal : Yamuna River 32 Number of Drains/Nallah for Wastewater Disposal : 1 33 Number of Water Bodies : NA 34 Gross Area of Water Bodies (Hectare) : NA 35 Area of Water Bodies as % of Total Area : <<< 1
S. No. Items Value 1 Total Area (sq km) : 11.51 2 Population as in 2011 : 65708 3 Population Growth Rate as in 2011 (%) : 35.39 4 Total Number of Wards : 21 5 Population per Ward (Thousands) : 3,129 6 Total Number of Household as in 2011 : 12477 7 Number of Household per Ward : 594 8 Surface Water Supply (MLD) : NA 9 Ground Water (GW) Supply (MLD) : NA
10 Number of Bore Wells : NA 11 Ground Water Extraction per Bore Well (MLD) : NA 12 Number of Hand Pumps/ Tubewells : NA 13 Ground Water Extraction per Hand Pump (lpd) : 500 14 Number of Pumping Stations for Water Supply : NA 15 Total Pumping Capacity (MLD) : NA 16 Average Water Supply Rate from ULB Sources (lpcd) : NA 17 Total Water Supply from ULB and Non-ULB Sources (MLD) : 8.87 18 Average Water Supply Rate from ULB & Non-ULB Sources (lpcd) : 135.00 19 Total Sewage Generation (MLD)* : 7.10 20 Per Capita Sewage Generation (lpcd) : 108.00 21 Sewage Collection (MLD) : NA 22 Percentage of Sewage Collection (%) : NA 23 Number of STPs : NA 24 Total Installed Capacity of STPs under GAP I & II (MLD) : NA 25 Current Utilized Capacity of STPs (MLD) : NA 26 Percentage Utilization of Installed Capacity (%) : NA 27 Capacity of STPs Sanctioned under JNNURM & Others (MLD) : NA
28 Pollution Load (Domestic) (Method 1: Actual Flow) (kg/d)
BOD5 : NA COD : NA TKN : NA
29 Pollution Load (Domestic) (Method 2: Per Capita Contribution) (kg/d)
BOD5 : 1774.1 COD : 3016.0 TKN : 354.8
30 Wastewater Disposal Means : River Disposal 31 Name of River/Streams for Wastewater Disposal : Yamuna River 32 Number of Drains/Nallah for Wastewater Disposal : NA 33 Number of Water Bodies : NA 34 Gross Area of Water Bodies (Hectare) : NA 35 Area of Water Bodies as % of Total Area : <<< 1
Water Balance & Pollution Load (Domestic) Fact Sheet City: Hodal State: Haryana S. No. Items Value
1 Total Area (sq km) : 5.39 2 Population as in 2011 : 50143 3 Population Growth Rate as in 2011 (%) : 30.89 4 Total Number of Wards : 17 5 Population per Ward (Thousands) : 2,950 6 Total Number of Household as in 2011 : 8579 7 Number of Household per Ward : 505 8 Surface Water Supply (MLD) : NA 9 Ground Water (GW) Supply (MLD) : NA
10 Number of Bore Wells : NA 11 Ground Water Extraction per Bore Well (MLD) : NA 12 Number of Hand Pumps/ Tubewells : NA 13 Ground Water Extraction per Hand Pump (lpd) : 500 14 Number of Pumping Stations for Water Supply : NA 15 Total Pumping Capacity (MLD) : NA 16 Average Water Supply Rate from ULB Sources (lpcd) : NA 17 Total Water Supply from ULB and Non-ULB Sources (MLD) : 6.77 18 Average Water Supply Rate from ULB & Non-ULB Sources (lpcd) : 135 19 Total Sewage Generation (MLD)* : 5.42 20 Per Capita Sewage Generation (lpcd) : 108.00 21 Sewage Collection (MLD) : NA 22 Percentage of Sewage Collection (%) : NA 23 Number of STPs : NA 24 Total Installed Capacity of STPs under GAP I & II (MLD) : NA 25 Current Utilized Capacity of STPs (MLD) : NA 26 Percentage Utilization of Installed Capacity (%) : NA 27 Capacity of STPs Sanctioned under JNNURM & Others (MLD) : NA
28 Pollution Load (Domestic) (Method 1: Actual Flow) (kg/d) BOD5 : NA COD : NA TKN : NA
29 Pollution Load (Domestic) (Method 2: Per Capita Contribution) (kg/d)
BOD5 : 1353.9 COD : 2301.6 TKN : 270.8
30 Wastewater Disposal Means : River Disposal 31 Name of River/Streams for Wastewater Disposal : Yamuna River 32 Number of Drains/Nallah for Wastewater Disposal : NA 33 Number of Water Bodies : NA 34 Gross Area of Water Bodies (Hectare) : NA 35 Area of Water Bodies as % of Total Area : <<< 1
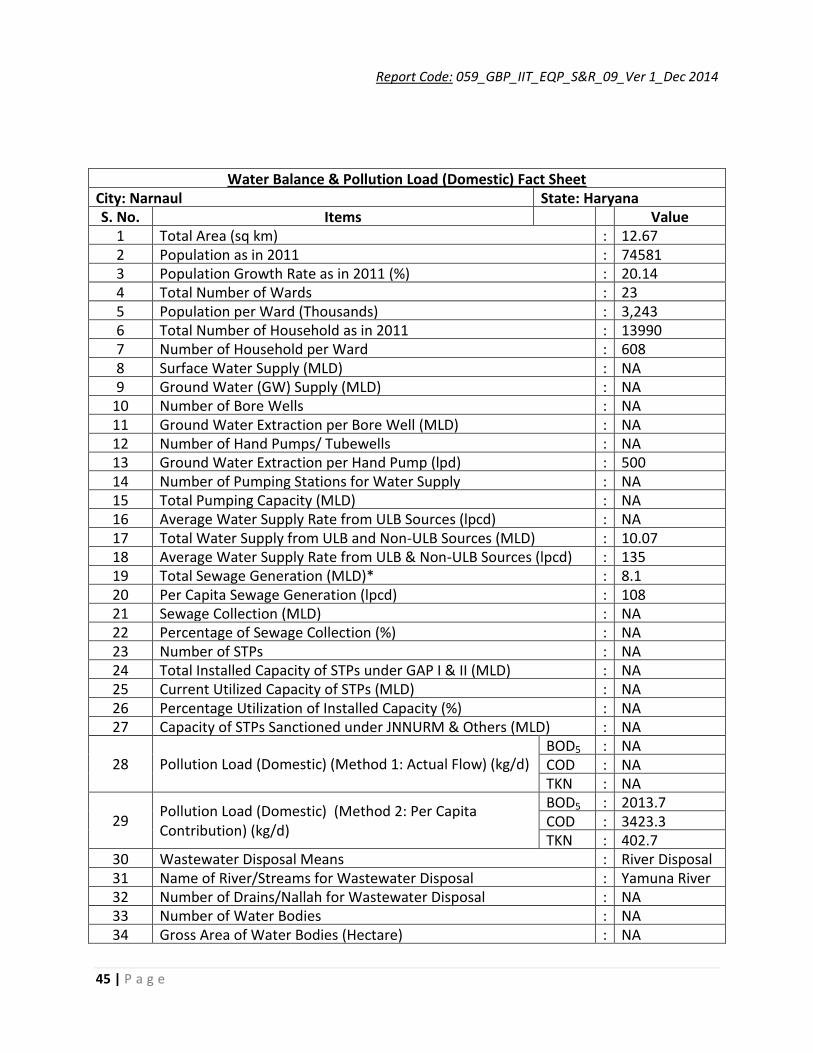
Water Balance & Pollution Load (Domestic) Fact Sheet City: Narnaul State: Haryana S. No. Items Value
1 Total Area (sq km) : 12.67 2 Population as in 2011 : 74581 3 Population Growth Rate as in 2011 (%) : 20.14 4 Total Number of Wards : 23 5 Population per Ward (Thousands) : 3,243 6 Total Number of Household as in 2011 : 13990 7 Number of Household per Ward : 608 8 Surface Water Supply (MLD) : NA 9 Ground Water (GW) Supply (MLD) : NA
10 Number of Bore Wells : NA 11 Ground Water Extraction per Bore Well (MLD) : NA 12 Number of Hand Pumps/ Tubewells : NA 13 Ground Water Extraction per Hand Pump (lpd) : 500 14 Number of Pumping Stations for Water Supply : NA 15 Total Pumping Capacity (MLD) : NA 16 Average Water Supply Rate from ULB Sources (lpcd) : NA 17 Total Water Supply from ULB and Non-ULB Sources (MLD) : 10.07 18 Average Water Supply Rate from ULB & Non-ULB Sources (lpcd) : 135 19 Total Sewage Generation (MLD)* : 8.1 20 Per Capita Sewage Generation (lpcd) : 108 21 Sewage Collection (MLD) : NA 22 Percentage of Sewage Collection (%) : NA 23 Number of STPs : NA 24 Total Installed Capacity of STPs under GAP I & II (MLD) : NA 25 Current Utilized Capacity of STPs (MLD) : NA 26 Percentage Utilization of Installed Capacity (%) : NA 27 Capacity of STPs Sanctioned under JNNURM & Others (MLD) : NA
28 Pollution Load (Domestic) (Method 1: Actual Flow) (kg/d) BOD5 : NA COD : NA TKN : NA
29 Pollution Load (Domestic) (Method 2: Per Capita Contribution) (kg/d)
BOD5 : 2013.7 COD : 3423.3 TKN : 402.7
30 Wastewater Disposal Means : River Disposal 31 Name of River/Streams for Wastewater Disposal : Yamuna River 32 Number of Drains/Nallah for Wastewater Disposal : NA 33 Number of Water Bodies : NA 34 Gross Area of Water Bodies (Hectare) : NA
35 Area of Water Bodies as % of Total Area : <<< 1
Water Balance & Pollution Load (Domestic) Fact Sheet City: Panipat Taraf Makhdum Zadgan State: Haryana S. No. Items Value
1 Total Area (sq km) : 6.54 2 Population as in 2011 : 67998 3 Population Growth Rate as in 2011 (%) : 93.42 4 Total Number of Wards : 1 5 Population per Ward (Thousands) : 67,998 6 Total Number of Household as in 2011 : 14066 7 Number of Household per Ward : 14066 8 Surface Water Supply (MLD) : NA 9 Ground Water (GW) Supply (MLD) : NA
10 Number of Bore Wells : NA 11 Ground Water Extraction per Bore Well (MLD) : NA 12 Number of Hand Pumps/ Tubewells : NA 13 Ground Water Extraction per Hand Pump (lpd) : 500 14 Number of Pumping Stations for Water Supply : NA 15 Total Pumping Capacity (MLD) : NA 16 Average Water Supply Rate from ULB Sources (lpcd) : NA 17 Total Water Supply from ULB and Non-ULB Sources (MLD) : 9.18 18 Average Water Supply Rate from ULB & Non-ULB Sources (lpcd) : 135.00 19 Total Sewage Generation (MLD)* : 7.34 20 Per Capita Sewage Generation (lpcd) : 108.00 21 Sewage Collection (MLD) : NA 22 Percentage of Sewage Collection (%) : NA 23 Number of STPs : NA 24 Total Installed Capacity of STPs under GAP I & II (MLD) : NA 25 Current Utilized Capacity of STPs (MLD) : NA 26 Percentage Utilization of Installed Capacity (%) : NA 27 Capacity of STPs Sanctioned under JNNURM & Others (MLD) : NA
28 Pollution Load (Domestic) (Method 1: Actual Flow) (kg/d) BOD5 : NA COD : NA TKN : NA
29 Pollution Load (Domestic) (Method 2: Per Capita Contribution) (kg/d)
BOD5 : 1835.9 COD : 3121.1 TKN : 367.2
30 Wastewater Disposal Means : River Disposal 31 Name of River/Streams for Wastewater Disposal : Yamuna River
32 Number of Drains/Nallah for Wastewater Disposal : NA 33 Number of Water Bodies : NA 34 Gross Area of Water Bodies (Hectare) : NA 35 Area of Water Bodies as % of Total Area : <<< 1