There are many challenges in accurately forecasting the
potential savings from energy codes activities, in part due to the high
degree of uncertainty in baseline compliance rates and future
construction levels, code adoption, energy demand, and prices. This
exercise should be considered a useful first step in understanding the
potential gains from investments in improved compliance with existing
building energy codes across the United States.
1. Noncompliance: Where Are We Now?
A key step in evaluating the potential savings from enhancing
compliance with energy codes is the assessment of baseline compliance
rates. Unfortunately, while anecdotal reports from the field and one-off
reports in select states provide some data, our understanding of the
true rates of compliance across the U.S. is limited.
Energy code compliance is typically measured by collecting field
data from a random sample of permitted projects in a particular
territory. The high cost of such state-wide, on-site evaluations—
upwards of $250,000 each2—limits the ability of jurisdictions to
undertake routine assessments. However, over the past ten years,
several statewide or regional studies have attempted to evaluate
current construction practices against various codes. Additionally, as a
condition for accepting funds under the American Recovery and
Reinvestment Act of 2009 (ARRA), each state committed to
documenting and achieving 90 percent compliance with a code that
meets or exceeds the 2009 IECC and ASHRAE-90.1-2007 by the year
2017. A number of states have already commissioned efforts to
measure and monitor code compliance rates. The sections below
provide an overview of this existing code compliance literature.
2 Northeast Energy Efficiency Partnerships. 2012. “State Building Energy Code
Compliance Studies – Lessons Learned.” Model Progressive Building Energy Codes Policy — 2012 Update.
Noncompliance: Where Are We Now? | IMT | 6
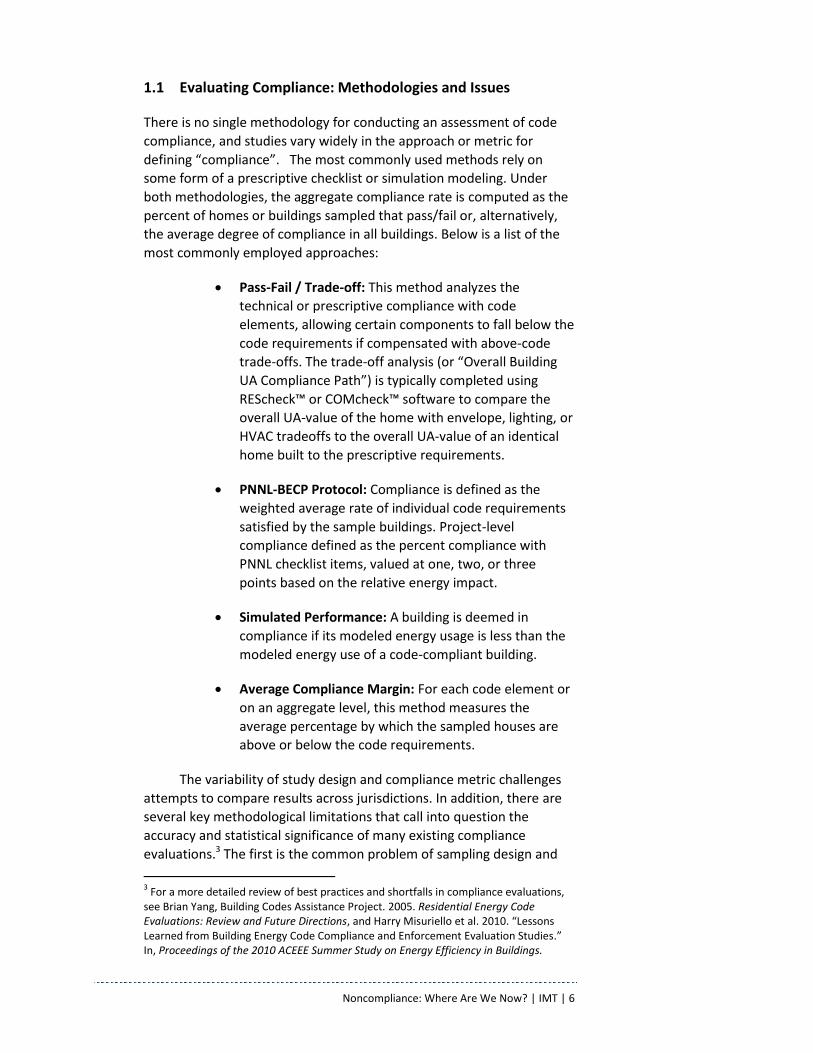
1.1 Evaluating Compliance: Methodologies and Issues
There is no single methodology for conducting an assessment of code
compliance, and studies vary widely in the approach or metric for
defining “compliance”. The most commonly used methods rely on
some form of a prescriptive checklist or simulation modeling. Under
both methodologies, the aggregate compliance rate is computed as the
percent of homes or buildings sampled that pass/fail or, alternatively,
the average degree of compliance in all buildings. Below is a list of the
most commonly employed approaches:
Pass-Fail / Trade-off: This method analyzes the
technical or prescriptive compliance with code
elements, allowing certain components to fall below the
code requirements if compensated with above-code
trade-offs. The trade-off analysis (or “Overall Building
UA Compliance Path”) is typically completed using
REScheck™ or COMcheck™ software to compare the
overall UA-value of the home with envelope, lighting, or
HVAC tradeoffs to the overall UA-value of an identical
home built to the prescriptive requirements.
PNNL-BECP Protocol: Compliance is defined as the
weighted average rate of individual code requirements
satisfied by the sample buildings. Project-level
compliance defined as the percent compliance with
PNNL checklist items, valued at one, two, or three
points based on the relative energy impact.
Simulated Performance: A building is deemed in
compliance if its modeled energy usage is less than the
modeled energy use of a code-compliant building.
Average Compliance Margin: For each code element or
on an aggregate level, this method measures the
average percentage by which the sampled houses are
above or below the code requirements.
The variability of study design and compliance metric challenges
attempts to compare results across jurisdictions. In addition, there are
several key methodological limitations that call into question the
accuracy and statistical significance of many existing compliance
evaluations.3 The first is the common problem of sampling design and
3 For a more detailed review of best practices and shortfalls in compliance evaluations,
see Brian Yang, Building Codes Assistance Project. 2005. Residential Energy Code Evaluations: Review and Future Directions, and Harry Misuriello et al. 2010. “Lessons Learned from Building Energy Code Compliance and Enforcement Evaluation Studies.” In, Proceedings of the 2010 ACEEE Summer Study on Energy Efficiency in Buildings.
Noncompliance: Where Are We Now? | IMT | 7
self-selection bias. Obtaining a random sample of buildings is unfeasible
in many circumstances, given cost and time restraints, geographic
distribution of permits, and resistance from select builders or building
departments to grant permission for access to building plans and
construction sites.
Second, and perhaps most important for the purposes of this
report, most compliance evaluations stop short of evaluating the energy
impact of non-compliance with specific measures. Additional analysis is
needed to translate the raw or aggregate compliance scores from a
checklist or pass-fail approach into the anticipated energy effects. This
calculation depends on an understanding of the degree of compliance
(i.e. marginally or substantially below or above code) and relative
energy impact of the code measure (i.e. wall insulation compared to a
perhaps less serious documentation infraction), which required detailed
building inspections and post-inspection modeling.
A handful of states have attempted to make the jump from a
prescriptive compliance score to an assessment of the energy impact of
noncompliance with the energy code. A 2012 New York study
conducted for NYSERDA estimates the lifetime “lost savings” from five
years of new residential and commercial construction in the state of
approximately $1.3 billion. A 2010 study of Massachusetts homes
evaluated the potential annual savings from enhanced code compliance
with select components: wall insulation, basement insulation, duct
sealing, and 50 percent high efficacy lamp requirement. They estimate a
lifetime savings potential for homes built between 2011 and 2013 of
between 867,058 MMBtu and 1,634,877 MMBtu depending on housing
growth and baseline compliance assumptions.4 Assuming a
conservative, average retail price of $12/MMBtu5, this equates to
lifetime savings of approximately $10—20 million for just three years of
new residential construction in Massachusetts.
1.2 PNNL-BECP Compliance Evaluation Protocol
To encourage consistency across compliance assessments, the U.S.
Department of Energy (DOE) and its Building Energy Codes Program
(BECP) recently developed a set of recommended code compliance
evaluation protocols, published in the 2011 report Measuring State
Energy Code Compliance by the Pacific Northwest National Laboratory
(PNNL).6 The PNNL-BECP protocols are comprised of a checklist that
quantifies component and equipment efficiencies, documentation,
4 See NMR and Cadmus, 2010.
5 Mix of fuels (electricity, natural gas, and fuel oil) and associated prices ignored for
simplification. 6 Pacific Northwest National Laboratory. 2010. Measuring State Energy Code
Compliance. PNNL-19281. Prepared for the U.S. Department of Energy.
Noncompliance: Where Are We Now? | IMT | 8
installation quality, and other requirements of the IECC and ASHRAE
90.1. Each code requirement is weighted on a scale of 1 to 3 based on
the direct energy impact. A compliance “score” of 0-100 percent is
calculated for each building based on the proportion of checklist points
that were met. A jurisdiction’s overall compliance rate is constructed by
averaging evaluated buildings’ scores, weighted by size and location.
The evaluation protocol was field tested in eight DOE-funded evaluation
pilots. However, these studies faced significant methodological and
sample design issues, questioning the accuracy of the reported results.7
1.3 Compliance Evaluation Studies
As a first step to this report, IMT conducted a review of residential and
commercial code compliance studies. In total, we reviewed 45 studies.
Tables 1 and 2 below present a summary of the methods and findings of
each study. The reported compliance rates must be interpreted and
compared with caution for the reasons identified in section 1.1 above.
Ultimately, it was determined that there is insufficient data to credibly
and uniformly assess a baseline compliance rate for each state. For the
purposes of the savings potential analysis, each state was modeled
under a standard range of compliance rates with bounds at 25 and 100
percent. See Section 2.2 for a more detailed discussion.
Nevertheless, this existing compliance literature is presented
here to provide a rough indication of measured compliance rates and
help the reader assess whether a particular state’s actual potential may
fall on the low/high end of the results presented in Chapter 3.
7 The DOE Compliance Pilots were intended to test the PNNL compliance measurement
protocol, not to obtain an accurate compliance rate in each state.
Noncompliance: Where Are We Now? | IMT | 9
Table 1: Statewide Energy Code Evaluation Studies
State Code Compliance Rate
Approach Source Residential Commercial
AR ‘92 MEC 55% -- Pass-Fail/Trade-off
(ARKcheckTM) Brown, E
(1999)
AR 2003 IECC NW Region: 57%
Outside NW: 95% -- Pass-Fail/Trade-off
Brown (2006)
CA 2001 Title
24 73% -- Pass-Fail/Trade-off
Itron (2004)
CA 2005 Title
24
Lighting: 28% Windows: 68%
Duct sealing: 73%
Controls: 44% Cool roofs: 50%
Duct test/seal.: 100%
Pass/Fail (partial credit given)
Quantec (2007)
CA 2005 Title
24
Lighting: 113% Duct sealing: 59%
Windows: 80%
Overall: 62% Skylights: 8%
Duct Sealing: 81% Cool Roof: 65%
Controls: 79%
Pass/Fail HMG
(2009)
CO ‘96 MEC
Insulation: 0% Duct leakage: 10%
Slab-on-grade Wall assembly: 50%
Basement insul.: 92% (partial results)
-- Pass/Fail
City of Fort
Collins (2002)
CT 2006 IECC Equipment sizing: 3%
Insulation: 4% -- Pass/Fail
NMR et. al.
(2012)
GA 2006 IECC --
HVAC controls: 21% Infiltration: 54%
Duct sealing: 64% Controls: 70%
Pipe sealing: 78%
Pass/Fail Towson (2011)
HI HI MEC
Lighting: 87% Controls: 38% Envelope: 80%
HVAC: 42%
Pass/Fail Eley
(1999)
ID 1996 IRES 51.9% -- N/A N/A
(Yang, 2005)
IL 2009 IECC 87.2%
(significant sampling bias)
Not statistically significant
PNNL-BECP Checklist APEC
(2011)
IN 2003 IECC -- Range by bldg types:
Lighting: -270%-82% Envelope: -3%-16%
Avg Compliance Margin (COMcheckTM)
ICC-BMG (2005)
IA ’92 MEC – 2000 IECC
Single Family 66 - 60%
4.6 - 2.8%%
Multifamily 66 - 60%
21.5 - 37.5%%
Pass/Fail
Avg Compliance Margin (% above/below)
BMG (2003)
IA 2009 IECC
Overall: 70.1% Lighting: 12%
Air sealing: 78% Duct sealing: 68%
Exterior wall insulation: 45% (partial results)
-- PNNL-BECP Checklist Bishop (2011)
Noncompliance: Where Are We Now? | IMT | 10
Table 1 (Continued): Statewide Energy Code Evaluation Studies
Table 1 (Continued): Statewide Energy Code Evaluation Studies
State Code Compliance Rate
Approach Source Residential Commercial
PA 2003 IECC 25% 42% 67%
-- Pass-Fail/Trade-off
Simulated Performance Overall UA
Turns (2008)
RI 2009 IECC N/A 73% PNNL-BECP DNV
KEMA et al. (2012)
RI 2009 IECC
0% 38%
4% (26% below code) 6% (48% below code)
--
Pass-Fail PNNL-BECP
Annual Energy Cost Overall Building UA
NMR et al. (2012)
UT 2006 IECC 86.5% -- PNNL-BECP Navigant (2011)
VT RBES 35-40% -- Overall UA West Hill
(1999)
VT 1997 VT-
RBES 59% -- Overall UA
West Hill (2003)
VT 2004 VT-
RBES
20% 61% 70% -9%
--
Pass-Fail Trade-off (VTCheck)
Any of the above Avg UA Compl Margin
NMR et. al.
(2009a)
WA WA ‘94 --
Overall: 47% Lighting: 72%
HVAC: 74% Envelope: 78%
Pass-Fail Baylon (1992)
WA WA ‘97 93.6% -- N/A Warwick
et al (1993)
WA WA ‘94 --
Overall: 59% Lighting: 83%
HVAC: 80% Envelope: 86%
Pass-Fail
Baylon and
Madison (1996)
WI 90.1-
‘04/’06 2004 IECC
N/A N/A N/A Swartz (2009)
WI 90.1-
‘07/2009 IECC
-- 95% PNNL-BECP Checklist Spalding (2011)
* Compliance is defined as the weighted average rate of individual code requirements satisfied by the
sample buildings. Project-level compliance defined as the percent compliance with 8 compliance items determined to be of the most importance to code compliance, weighted equally.
** Compliance is defined as the weighted average rate of individual code requirements satisfied by the sample buildings. Project-level compliance defined as the percent compliance with 63 compliance items, each weighted according to its contribution to a prototypical home's energy usage of the item they apply to.
Noncompliance: Where Are We Now? | IMT | 12
Table 2: Regional Energy Code Evaluation Studies
Region Code Compliance Rate
Approach Source Residential Commercial
Pacific Northwest (OR, WA)
OR ‘98 --
Multifamily 79.9% 97.7%
Overall UA (DBL CHECK)
Ecotope (2000) WA ‘97
Pacific Northwest
(ID, MT, OR, WA)
N/A ’95 MEC OR ‘93 WA ‘94
--
Multifamily 51.9% 86.8% 100%
93.6
Overall UA Ecotope (2001a)
Pacific Northwest
(ID, MT, OR, WA)
ASHRAE 90.1-‘89
OR ‘96 WA ‘94
-- Envelope: 42-86%
HVAC: 86-100% Lighting: 60-92%
Pass-Fail Ecotope (2001b)
ID 2003 IECC
Single Family Overall: 47%
Windows: 88% Wall: 39% Floor: 8%
Roof: 13%
Multifamily Overall: 26%
Windows: 74% Wall: 29%
Floor: 11% Roof: 50%
Pass-Fail / Tradeoff Ecotope (2008a) OR
OR ‘06 (>2000 IECC)
Single Family Overall: 77%
Windows: 85% Wall: 80%
Floor: 83% Roof: 96%
Multifamily Overall: 30%
Windows: 42% Wall: 76%
Floor: 78% Roof: 81%
WA WA ‘06
(>2000 IECC)
Single Family Overall: 73%
Windows: 85% Wall: 58%
Floor: 65% Roof: 95%
Multifamily Overall: 75%
Windows: 78% Wall: 74%
Floor: 87% Roof: 95%
Pacific Northwest
(ID, MT, OR, WA)
OR ‘98, WA ‘01 ASHRAE 90.1-‘89, 2000 IECC
-- Lighting: 79%
Envelope: 82% Pass-Fail
Ecotope (2008b)
Overview of Methodology | IMT | 13
2 Overview of Methodology
The following section outlines the methodology followed in modeling
the savings potential by state. Despite an effort to standardize the
approach across states, there remain significant differences in available
data, assumptions, and approach. Results across states should be
compared with discretion.
2.1 New construction
New residential construction forecasts by state were derived using U.S.
Census Bureau data on new single-family and multifamily housing
permits from 1990-2011. Single family permit levels are projected to
rise 20 percent and 30 percent in 2012 and 2013, respectively, and a
conservative 10 percent each year thereafter, reflecting a recovery of
new housing construction from current recessionary levels. Multifamily
permits are projected to rise 20 percent in 2012 and six percent each
year thereafter. This trend in construction activity levels out to a
conservative 1.5 million single-family starts and 480,000 multifamily
starts in 2022.
New commercial construction forecasts by state were derived from U.S.
EIA Annual Energy Outlook 2012-2035 forecasts for U.S. commercial
construction. The CoStar database was used to distribute square
footage by state based on historic construction levels. Forecasts for
years 2013-2015 were diminished to reflect near-term recessionary
conditions.
Residential and commercial construction forecasts exclude the
estimated state market share of ENERGY STAR, LEED, or other voluntary
beyond-code programs, as these buildings are assumed to meet or
exceed the minimum code requirements. In states without a mandatory
statewide code—AL, AK, AZ, CO, KS, ME, MS, ND, SD, and WY—we
estimate the share of new construction subject to the energy code
based on jurisdictional adoption status and 2011 U.S. Census Bureau
residential permit figures by county and/or city.
Although the potential savings from existing buildings are likely
significant, this analysis was restricted to code compliance in new
construction given the uncertainty of data for residential
retrofits/renovations.
2.2 Baseline Compliance
After a thorough literature review of compliance evaluation studies, we
determined that there is insufficient data to credibly evaluate the
Overview of Methodology | IMT | 14
baseline compliance rate for each state. Instead, we apply uniform
compliance assumptions for each state. The endpoints were set as
follows:
• High savings scenario: low (25 percent) baseline compliance.
• Low savings scenario: high (75 percent) baseline compliance.
Compliance is defined at the whole-building level– for example, a rate
of 75 percent signifies that ¾ of all buildings were in full compliance
with the code. The degree of non-compliance was captured using an
“energy loss factor”, which represents the average energy losses per
home due to non-compliance. We assume a default energy loss factor
of 15 percent for each state (i.e. a non-compliant building uses 15
percent more energy than an identical building constructed to code).
This loss factor is consistent with the average non-compliance impacts
found in baseline compliance evaluations.
We make the simplifying assumption that baseline compliance levels
remain stable over time, due to the difficulty in accurately forecasting
factors that may contribute positively or negatively to a state’s overall
compliance rate, such as new code changes, builder training, new
enforcement mechanisms, or market transformation.
2.3 Energy Consumption
Residential
Baseline energy use intensities for the residential sector were derived
primarily from the PNNL publication series, “Energy and Cost Savings for
New Single and Multifamily Homes: 2012 IECC as Compared to the 2009
IECC”. These reports provide an estimate of the consumption intensity
for space heating, water heating, cooling, and lighting under each
state’s current code, the 2009 IECC, and the 2012 IECC.
In states where a PNNL analysis was unavailable—CA, FL, IL, MD, NC,
OR, and WA—baseline consumption was constructed using data from
the 2009 Residential Energy Consumption Survey (RECS). For each
climate zone and fuel type, we derive an estimate of average space
heating, water heating, and space cooling consumption for new homes.
To capture the mix of space- and water-heating types—natural gas and
electric space—we assign weights to each consumption intensity based
on the distribution of homes by principal water or space heating fuel in
each Census Region or state, as reported in RECS. The RECS database
does not track a separate consumption estimate for lighting. For
simplifying purposes, we assume an average annual consumption of
2,000 Btu per household for lighting.
Overview of Methodology | IMT | 15
Average multifamily consumption was estimated by multiplying single-
family figures by the average ratio of multifamily to single-family energy
consumption for code-covered uses.
Commercial
Baseline energy use intensities for the commercial sector (Btu/ft2) were
derived primarily from the EIA’s 2003 Commercial Buildings Energy
Consumption Survey (CBECS). We derive an estimate of the average
annual consumption for each end use—heating, cooling, water heating,
lighting, and ventilation—by fuel type, vintage, and climate zone.
Natural gas and electric consumption for space and water heating
reflect the annual usage in an exclusively natural-gas heated building or
an exclusively electric-heated building, respectively. To capture the mix
of natural gas and electric space and water heated buildings, we assign
weights (Sharefuel,enduse) to each consumption intensity based on the
distribution of structures by principal water or space heating fuel in
each Census Region or state, according to EIA’s 2003 Commercial
Building Energy Consumption Survey. For example, ShareNG,WH
represents the percent of buildings in that state using natural gas as the
principal water heating fuel.
Given these inputs, we use the following equations to create a weighted
average energy profile for the “typical” home or commercial building in
Consumptionfuel,enduse = average annual consumption per household for the indicated fuel and end use
Sharefuel,enduse = share of households using principally the indicated
fuel for the indicated end use, and ConsumptionFuel,Total = weighted average annual consumption of the
indicated fuel for a code compliant home.
NG = Natural Gas SH = Space Heating E = Electricity WH = Water Heating L = Lighting V = Ventilation
Overview of Methodology | IMT | 16
2.4 Evaluation of Potential Savings
The total potential energy savings is calculated for each fuel type by multiplying the noncompliance energy impact by baseline energy consumption, and scaling by the number of new noncompliant single and multifamily units. The final calculation process used is shown in Figure 1 below.
Figure 1: Breakdown of Calculations
To estimate the net lifetime savings of the compliance effects in a particular year, we multiply the single year savings estimates by an expected 25 year savings lifetime. We assume constant real electricity and natural gas prices at 2011 levels, as published in the Energy Information Administration (EIA) State Energy Data (SEDS) database. We conservatively exclude the impact of rising fuel costs as a result of tightening environmental standards or other political, regulatory or market influences.
3. Key Findings
3.1 National Results
Table 3: National Savings Potential from Enhanced Code Compliance in New Construction
Total U.S. Savings
Low Case (75% baseline compliance)
High Case (25% baseline compliance)
Millions ($) Trillion
Btu
Millions ($) Trillion
Btu
Annual, 1st Year $62.94 2.83
$188.63 8.48
Annual, 10th Year $1,229.41 54.33
$3,685.51 162.87
Lifetime savings of 1 year of new construction
$12,364.89 653.81
$37,094.66 1,961.43
Non-compliance
Rate (%)
x x x
Non-compliance Energy Impact
(%) =
Non-Compliance
Energy Impact
Beyond code market share (units or ft2)
-
Code Compliant Energy
Consumption,
Natural Gas, Electricity
New Construction (units or ft
2)
Key Findings | IMT | 17
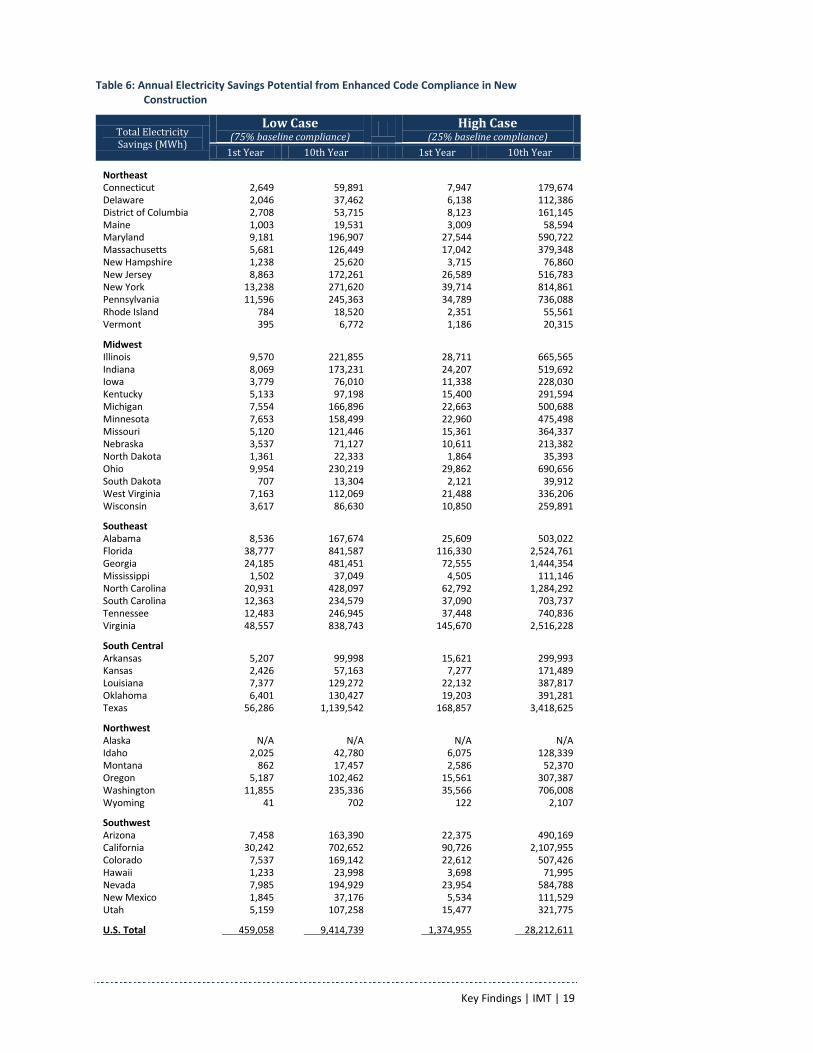
3.2 State-Level Results
Table 4: Annual Dollar Savings Potential from Enhanced Code Compliance in New Construction
Total Energy Savings ($)
Low Case (75% baseline compliance)
High Case (25% baseline compliance)
1st Year 10th Year 1st Year 10th Year
Northeast Connecticut $645,490 $13,241,884
$1,936,469 $39,725,653
Delaware $310,458 $5,603,293
$931,375 $16,809,879 District of Columbia $405,169 $7,415,499
CALIFORNIA Itron. 2004. Residential New Construction Baseline Study of Building Characteristics
Homes Built After 2001 Codes. Prepared for PG&E. www.calmac.org/startDownload.asp?Name=RNC_2003_Final_Report1ES.pdf
Quantec, LLC. 2007. Statewide Codes and Standards Market Adoption and Noncompliance Rates. Prepared for Southern California Edison. Study ID SCE0224.01; CPUC Program No. 1134-04. www.calmac.org/publications/Codes_and_Standards_Final_Report.pdf
COLORADO City of Fort Collins. 2002. Evaluation of New Home Energy Efficiency.
www.fcgov.com/utilities/img/site_specific/uploads/newhome-eval.pdf CONNECTICUT NMR, KEMA, Cadmus, and Dorothy Conant. 2012. Connecticut 2011 Baseline Study of
Single-Family Residential New Construction. Final Report. Prepared for the Connecticut Energy Efficiency Board. www.ctenergyinfo.com/ConnecticutNewResidentialConstructionBaseline-10-1-12.pdf
GEORGIA Towson, Bill. 2011. State Energy Code Compliance Evaluation Pilot Study for Commercial
New Buildings and Additions. Prepared for the Georgia Department of Community Affairs. http://www.sustainableatlanta.org/pdf/Benefits_from_Effective_Energy_Code_Implementation_Atlanta_WP.pdf
HAWAII Eley Associates. 1999. Energy Code Compliance Study. Honolulu and Hawaii Counties.
Prepared for the State of Hawaii Department of Business, Economic Development, and Tourism.
ILLINOIS APEC. 2011. Measuring the Baseline Compliance Rate for Residential and Non-
Residential Buildings in Illinois. www.ildceo.net/NR/rdonlyres/EFB19489-E69C-45CD-9299-89812EC1EB3A/0/FinalReport_BaselineComplianceStudy.pdf
References | IMT | 22
INDIANA ICC and Britt/Makela Group. 2005. Indiana Commercial Energy Code Baseline Study.
Report Prepared for Indiana Department of Commerce. www.energycodes.gov/sites/default/files/documents/bp_indiana_commercial_energy_code_baseline_study.pdf
IOWA Britt/Makela Group, Inc. 2003. Final Report – Iowa Residential Energy Code Plan Review
and Field Inspection Training. Prepared for Iowa Department of Natural Resources.
Bishop, Brian. 2011. Iowa Energy Code Evaluation Pilot Study: Final Report. Prepared for Iowa Department of Public Safety. June 2011. http://mn.gov/commerce/energy/images/Iowa_Final_Study.pdf
MAINE VEIC. 2008. Maine Residential New Construction Technical Baseline Study. Final Report.
www.efficiencymaine.com/docs/emainebaseline_study_051508_final.pdf. ERS and GDS. 2011. Commercial Baseline Study. Final Report. Prepared for Efficiency
Maine Trust. www.efficiencymaine.com/docs/reports/Baseline-Consumption-Study-Report.pdf
MASSACHUSETTS XENERGY, Inc. 2001. Impact Analysis of the MA 1998 Residential Code Revisions.
Prepared for Massachusetts Board of Building Regulation and Standards. www.mass.gov/eopss/docs/dps/inf/inf-bbrs-impact-analysis-final.pdf
NMR-KEMA. 2011. Massachusetts Energy Code Pilot Report. Prepared for MA Residential New Construction Program Administrators, MA DOER, NEEP, & PNNL. http://neep.org/uploads/NEEPResources/id771/Massachusetts_FinalReport_NMR_2011.pdf
DNV KEMA. 2012. Code Compliance Baseline Study. Massachusetts Energy Efficiency Programs’ Large Commercial & Industrial Evaluation. Final Report Project 11. Prepared for Massachusetts Energy Efficiency Program Administrators. www.ma-eeac.org/docs/2011%20to%202012%20EMV/Non-Residential/MA%20LCIEC%20Project%2011%20Final%20Report%20-%20August%2024%202012.pdf
MINNESOTA ShelterSource, Inc. 2002. Evaluating Minnesota Homes. Prepared for the Minnesota
Department of Commerce, State Energy Office. www.state.mn.us/mn/externalDocs/Commerce/New_Home_Performance_Study_111202034608_FinalMNhomes.pdf
MONTANA Cadmus. 2012. Montana Residential Energy Code Compliance. Prepared for the
Northwest Energy Efficiency Alliance. REPORT #E12-236. http://neea.org/docs/reports/montanaresidentialenergycodecompliance496f12788a93.pdf
NEVADA Britt/Makela Group. 2003. Final Report - Volume I In-Field Residential Energy Code
Compliance Assessment and Training Project. Prepared for the Nevada State Office of Energy.
References | IMT | 23
NEW YORK VEIC. 2004. Long Island Residential New Construction Technical Baseline Study. Prepared
for the Long Island Power Authority. www.energycodes.gov/sites/default/files/documents/bp_ny_compliance_2004.pdf
VEIC. 2012. New York Energy Code Compliance Study. Prepared for the New York State Energy Research and Development Authority (NYSERDA). Project Number 1720. www.cx-associates.com/images/stories/pdf/nyserda_code_compliance_final_report_with_appendices_sm.pdf.
NORTH DAKOTA Pedersen, Carl & Kenneth Hellevang, PhD, P.E. 2010. North Dakota Residential
Construction: Energy Efficiency-related Practices. North Dakota State University Extension Service. Prepared for North Dakota Department of Commerce. www.ag.ndsu.edu/energy/documents/pdf/ND%20Current%20Practices%20Survey%20Report%20Final.pdf
OREGON Frankel, Mark and D. Baylon. 1994. Oregon Residential Energy Code Compliance
Evaluation Pilot Study Report. For the Oregon State Department of Energy. PENNSYLVANIA Turns, Mike. 2008. Energy Code Enforcement and Compliance in Pennsylvania: Lessons
from the Field. The Pennsylvania Housing Research Center. PHRC Research Series Report No. 106. www.energycodes.gov/sites/default/files/documents/cs_Pennsylvania_106EnergyCodeEnforcementTurns.pdf
RHODE ISLAND NMR, KEMA, Cadmus Group, and Dorothy Conant. 2012. Rhode Island 2011 Baseline
Study of Single-Family Residential New Construction. Submitted to National Grid.
DNV KEMA, Energy & Resource Solutions and APPRISE. 2012. DRAFT Final Report Rhode Island Energy Code Compliance Baseline Study. Prepared for the State of Rhode Island Office of the Building Commissioner and National Grid. www.rieermc.ri.gov/documents/evaluationstudies/2012/RI%20Code%20Compliance%20Baseline%20Study%20%20Final%20Report%20-%20July%2023%202012.pdf
UTAH Navigant. 2011. 2006 IECC Residential Compliance Study. For the State of Utah.
VERMONT West Hill Energy & Computing, Inc. 1999. Report on the 1995 Vermont Residential New
Construction Baseline Data. Prepared for the Vermont Department of Public Service.
West Hill Energy & Computing, Inc. 2003. Vermont Residential New Construction 2002: Baseline Construction Practices, Code Compliance, and Energy Efficiency.
References | IMT | 24
Prepared for Vermont Department of Public Service. Results presented in: www.energycodesocean.org/sites/default/files/resources/420.pdf
NMR, KEMA, and Dorothy Conant. 2009. Residential Building Energy Standards Compliance Analysis. FINAL REPORT. Prepared for the Vermont Department of Public Service. www.energycodes.gov/sites/default/files/documents/cs_vt_rbes_analysis_061009.pdf
WASHINGTON Baylon, David (Ecotope). 1992. “Commercial Building Energy Code Compliance in
Washington and Oregon.” Proceedings of the 1992 ACEEE Summer Study on Energy Efficiency in Buildings.
Warwick, W. M., A. Lee, L. Sandahl, D. Durfee, and E. Richman. 1993. New Residential Construction Compliance: Evaluation of the Washington State Energy Code Program. For the Bonneville Power Administration, Richland, WA.
Baylon, David & Kevin Madison. 1996. “The 1994 Washington State Nonresidential Energy Code: Quality Assurance Program Results.” Proceedings of the 1996 ACEEE Summer Study on Energy Efficiency in Buildings.
Baylon, David and Kevin Madison. 1998. “Compliance with the 1994 Washington State Nonresidential Energy Code.” Proceedings of the 1998 ACEEE Summer Study on Energy Efficiency in Buildings.
WISCONSIN Keith Swartz, Energy Center of Wisconsin. 2009. 2008 New Construction Program
Baseline Study for Focus on Energy. Spaulding, John. 2011. MEEA/BECP Pilot Energy Study: 90% Compliance; Commercial
Building. Prepared for the State of Wisconsin Safety and Buildings Division. http://mn.gov/commerce/energy/images/Wisconsin_FinalStudy.pdf
PACIFIC NORTHWEST Ecotope. 2001a. Baseline Characteristics of the Residential Sector: Idaho, Montana,
Oregon and Washington. Prepared for the Northwest Energy Efficiency Alliance. Report #01-095. http://neea.org/docs/reports/baselinecharacteristicsofresidentialconstruction6dc655d26f23.pdf.
Ecotope. 2001b. Baseline Characteristics of the Non-Residential Sector: Idaho, Montana, Oregon and Washington. Prepared for the Northwest Energy Efficiency Alliance. Report #01-094. http://neea.org/docs/reports/baselinecharacteristicsofnon-residentialbuildinge8e96d4c1ade.pdf
Ecotope. 2008a. NEEA Codes and Standards Support Project: MPER #2. Prepared for the Northwest Energy Efficiency Alliance. http://neea.org/docs/reports/codes-and-standards-support-project-marketing-progress-evaluation-report-no-2-e08-184.pdf?sfvrsn=8
Ecotope. 2008b. Baseline Characteristics of 2002-2004 Nonresidential Sector: Idaho, Montana, Oregon, and Washington. Prepared for the Northwest Energy Efficiency Alliance. Report #08-196. www.energycodes.gov/sites/default/files/documents/bp_Baseline_Characteristics_of_the_2002-2004.pdf.
Baylon, David, Alison Roberts, Shelly Borrelli, Mike Kennedy. Baseline Characteristics of the Multi-Family Sector: Oregon and Washington. Prepared for the Northwest Energy Efficiency Alliance.
Acknowledgements | IMT | 25
Acknowledgements
This project was completed in conjunction with the February 2013 IMT/IEE/NEEP joint report entitled Attributing Building Energy Code Savings to Energy Efficiency Programs, prepared by The Cadmus Group, Inc. IMT would like to acknowledge the support and contributions received from the Cadmus Group team and the following individuals who served on the project Advisory Committee:
Julie Michals NEEP Jim O’Reilly NEEP Carolyn Sarno NEEP Elizabeth Titus NEEP Adam Cooper IEE Jeff Harris Alliance to Save Energy Cindy Jacobs Connecticut Dept. of Energy and Environmental Protection Jared Lawrence Duke Energy Isaac Elnecave Midwest Energy Efficiency Alliance Phyllis Reha Minnesota PUC Jessica Burdette Minnesota State Energy Office Mary Sue Lobenstein Minnesota State Energy Office Chris Wagner National Association of State Energy Offices Bill Blake National Grid Puja Vohra National Grid David Cohan Northwest Energy Efficiency Alliance Mark Frankel New Buildings Institute Priscilla Richards NYSERDA Cheryl Roberto Ohio PUC David Pirtle PHI / Delmarva / PEPCO Nathan Morey Salt River Project Jim Meyers Southwest Energy Efficiency Partnership Kym Carey US Department of Energy (DOE) TJ Poor Vermont Public Service Department Tami Gunderzik Xcel Energy
About IMT | IMT | 26
About the Institute for Market Transformation
(IMT)
The Institute for Market Transformation (IMT) is a Washington, DC-based
nonprofit organization promoting energy efficiency, green building, and
environmental protection in the United States and abroad. IMT’s work
addresses market failures that inhibit investment in energy efficiency and
sustainability in the building sector. For more information, visit imt.org.
Report prepared by the Institute for Market Transformation,
February, 2013.
Disclaimer
The views and opinions expressed in this report are the responsibility of IMT
and do not necessarily represent the views and opinions of any individual,
government agency, or organization mentioned in this report.