ASSESSMENT OF EUTROPHICATION IN THE BARNEGAT BAY- LITTLE EGG HARBOR SYSTEM: USE OF SAV BIOTIC INDICATORS OF ESTUARINE CONDITION Michael J. Kennish, 1* Scott M. Haag, 2 and Gregg P. Sakowicz 3 1 Institute of Marine and Coastal Sciences Rutgers University New Brunswick, New Jersey 08901 2 Center for Remote Sensing and Spatial Analysis Rutgers University New Brunswick, New Jersey 08901 3 Rutgers University Marine Field Station 800 Great Bay Boulevard Tuckerton, New Jersey 08087 *Corresponding author. E-mail: [email protected]EXECUTIVE SUMMARY Results of a comprehensive investigation of the seagrass demographics in the Barnegat Bay-Little Egg Harbor Estuary during 2008 indicate ongoing degradation of seagrass habitat associated with increasing eutrophic conditions. Surveys of seagrass beds in Barnegat Bay and Little Egg Harbor from spring to fall in 2008 show that the seagrass beds have not yet recovered from the marked reduction of plant biomass (g dry wt m -2 ), density (shoots m -2 ), blade length, and percent cover recorded in 2006. Quadrat, core, and hand sampling, as well as digital camera imaging at 120 transect sites in 4 disjunct seagrass beds of the estuary during the June-November period in 2008, as in 1
Transcript
ASSESSMENT OF EUTROPHICATION IN THE BARNEGAT BAY-LITTLE EGG HARBOR SYSTEM: USE OF SAV BIOTIC INDICATORS OF ESTUARINE CONDITION Michael J. Kennish, 1* Scott M. Haag, 2 and Gregg P. Sakowicz3 1Institute of Marine and Coastal Sciences Rutgers University New Brunswick, New Jersey 08901 2Center for Remote Sensing and Spatial Analysis Rutgers University New Brunswick, New Jersey 08901 3Rutgers University Marine Field Station 800 Great Bay Boulevard Tuckerton, New Jersey 08087 *Corresponding author. E-mail: [email protected]
EXECUTIVE SUMMARY
Results of a comprehensive investigation of the seagrass demographics in the
Barnegat Bay-Little Egg Harbor Estuary during 2008 indicate ongoing degradation of
seagrass habitat associated with increasing eutrophic conditions. Surveys of seagrass
beds in Barnegat Bay and Little Egg Harbor from spring to fall in 2008 show that the
seagrass beds have not yet recovered from the marked reduction of plant biomass (g dry
wt m-2), density (shoots m-2), blade length, and percent cover recorded in 2006. Quadrat,
core, and hand sampling, as well as digital camera imaging at 120 transect sites in 4
disjunct seagrass beds of the estuary during the June-November period in 2008, as in
1
2004, 2005, and 2006, reveal distinct changes in demographic patterns that can lead to
significant shifts in ecosystem services.
In 2008, seagrass was found at less than 50% of the survey sites (46.3%) during
the June-July sampling period when the median aboveground and belowground biomass
values were a maximum. The mean aboveground biomass in the estuary was highest in
August-September (30.93 g dry wt m-2), and the mean belowground biomass was highest
in June-July (81.31 g dry wt m-2). Over the entire June-November sampling period, the
mean aboveground biomass declined slightly from 25.01 g dry wt m-2 to 22.91 g dry wt
m-2, while the mean belowground biomass decreased markedly by 51% from 81.31 g dry
wt m-2 to 39.86 g dry wt m-2. The aboveground biomass values were low throughout the
2008 study period compared to those of the initial year of sampling in 2004 (see Kennish
et al., 2007b).
The density of Zostera marina ranged from 239-466 shoots m-2 during 2008. Peak
density of Z. marina occurred during the August-September period when the
aboveground biomass also peaked. The density range of the plants was similar to that in
2005 (163-479 m-2) but greater than that in 2006 (171-378 shoots m-2).
The blade length of Zostera marina was relatively consistent during 2008, with
mean values amounting to 15.35 cm in June-July, 14.57 cm in August-September, and
19.88 cm in October-November. By comparison with the previous years of sampling
from 2004-2006, blade lengths during 2008 were the shortest on record, even when
compared to the heavily impacted year of 2006 (see Kennish et al., 2007b). The nitrogen
content of Z. marina blades measured at field transplantation sites ranged from 2.97% to
2
4.33%. Nitrogen Pollution Index values calculated for Z. marina in the estuary ranged
from 0.58 to 2.55.
The percent cover of seagrass in 2008 was lowest in June-July (23%), highest in
August-September (36%), and intermediate in October-November (27%). Seagrass
biomass, density, and areal cover measurements in 2008 were higher at exterior transect
sampling sites (1, 2, 9, and 10) closest to the seagrass bed margins than at interior
transect sampling sites (3, 4, 5, 6, 7, and 8). These values are consistent with those
measured during 2004, 2005, and 2006. This pattern indicates that seagrass located near
the margins of its distribution (i.e., edge effects) is more likely to be exposed to less
optimal conditions for growth and survival. The percent cover of macroalgae in 2008
was significantly lower than that of seagrass, declining markedly from June to November.
The mean percent cover of macroalgae decreased from 20% during the June-July period
to 10% during the August-September period and 5% during the October-November
period.
Seagrass is an important indicator of estuary condition. Data collected on
seagrass abundance, biomass, distribution, areal cover, and blade length are vital for
assessing biotic responses in the estuary to nutrient enrichment. Therefore, annual
demographic surveys of seagrass are critical for determining the status and trends in the
ecological health of the system.
INTRODUCTION
Eutrophication poses the most serious threat to the long-term health of the Barnegat Bay-
Little Egg Harbor Estuary (Kennish et al., 2007a). Nutrient enrichment and associated organic
carbon loading in this shallow, coastal lagoon have been linked to an array of cascading
3
environmental problems such as increased micro- and macroalgal growth, harmful algal blooms
(HABs), altered benthic invertebrate communities, impacted harvestable fisheries, and loss of
essential habitat (e.g., seagrass and shellfish beds). The net insidious effect of progressive
eutrophication is the potential for the permanent alteration of biotic communities and greater
ecosystem-level impacts. For example, hard clam (Mercenaria mercenaria) stocks in Little Egg
Harbor declined by two-thirds between 1986 and 2001, and the hard clam harvest declined by
more than 95% between 1975 and 2005. Recurring brown tide (Aureococcus anophagefferans)
blooms occurred between 1995 and 2002, with monitoring for brown tide being discontinued
after 2004 (Olsen and Mahoney, 2001; Gastrich et al., 2004). The biomass of seagrass beds in the
Barnegat Bay-Little Egg Harbor Estuary decreased by 50-87.7% over the 2004-2006 period
(Kennish et al., 2007b).
Accelerated growth of drifting macroalgae (e.g., Ulva lactuca) has produced extensive
organic mats that pose a potential danger to essential habitat (e.g., seagrass beds). Rapid growth
of other macroalgal species in the estuary, such as the rhodophytes Agardhiella subulata,
Ceramium spp., and Gracilaria tikvahiae, can also be detrimental. In addition, the decomposition
of thick macroalgal mats can promote sulfide accumulation and the development of
hypoxic/anoxic conditions in bottom sediments that are devastating to benthic infaunal
communities. Blooms of the sea nettle (Chrysaora quinquecirrha) have likewise developed in the
estuary since 2000. These problems can then lead to the deterioration of sediment and water
quality, loss of biodiversity, and disruption of ecosystem health and function. Human uses of
estuarine resources can also be seriously impaired.
Because the Barnegat Bay-Little Egg Harbor Estuary is shallow, poorly flushed, and
bordered by highly developed watershed areas, it is particularly susceptible to nutrient loading.
Protracted water residence times in the estuary result in the retention of nutrient elements within
the estuarine basin. These conditions threaten the ecological integrity of the system.
4
Nutrient enrichment and organic carbon loading are particularly problematic in
coastal lagoons which are often moderately to highly eutrophic. These shallow enclosed
systems typically exhibit a range of ecological and biogeochemical responses that signal
a shift in the balance of selective forces shaping biotic communities and habitats. An
array of cascading biotic and environmental problems is coupled to progressive
eutrophication of coastal bays, and the net insidious effect of these problems is the
potential for permanent alteration of biotic communities, major shifts in food web
structure, marked decline in ecosystem services, and the decrease of human uses of the
affected waterbodies. Shifts in plant subsystems associated with eutrophy can have
serious long-term detrimental effects on higher trophic levels. Changes in phytoplankton
communities from diatom/dinoflagellate dominants to greater abundances of
microflagellates, raphidophytes, and bloom forming pelagophytes (e.g., Aureococcus
anophagefferens, the causative agent of brown tides) often lead to dramatic losses of
shellfish resources (e.g., hard clams, Mercenaria mercenaria and bay scallops,
Argopecten irradians). Effective management strategies must be formulated to reduce
nutrient loading and institute effective mitigation plans to remediate the biotic and habitat
impacts.
Seagrass subsystems, which are excellent indicators of estuarine sediment and
water quality conditions, have been on the decline not only in estuaries in the mid-
Atlantic region but also in many other regions worldwide due to nitrogen and phosphorus
loading associated with human activities (Nixon, 1995; Rabalais, 2002; Orth et al., 2006;
Valiela, 2006). Concurrently, nuisance and toxic algal blooms have been on the rise,
directly impacting seagrass beds and other habitats. Both macroalgal and phytoplankton
5
blooms are problematic because they cause severe shading and attenuation of light
transmission, thereby hindering benthic photosynthetic processes. According to Lamote
and Dunton (2006), more than 70% of the large-scale decline in seagrass habitats
reported in recent studies is ascribed to eutrophication. Over two-thirds of U.S. estuaries
are experiencing moderate to high eutrophic conditions as a result of nutrient over-
enrichment (Bricker et al., 1999, 2007).
Most of the seagrass beds in New Jersey (~75%) occur in the Barnegat Bay-Little
Egg Harbor Estuary. While more than 6,000 ha of seagrass habitat have been reported in
this system (McLain and McHale 1997), some studies indicate that significant losses of
seagrass have taken place during the past 30 years, possibly reducing the beds by 30-60%
(Bologna et al., 2000). A GIS spatial comparison analysis of SAV surveys by Lathrop et
al. (2001) suggests that a contraction of the seagrass beds to shallow subtidal areas (< 2
m) may have occurred during this period due to a decrease in available light in response
to phytoplankton and macroalgal blooms as well as epiphytic attenuation. Eutrophy has
progressively increased in the estuary. Designated as moderately eutrophic in the early
1990s, the estuary was later classified as highly eutrophic by application of NOAA’s
National Ecosystem Assessment Model and Nixons’s Trophic Classification (Nixon,
1995; Bricker et al. 2007; Kennish et al. 2007).
Increased nutrient loading to the Barnegat Bay-Little Egg Harbor Estuary has
raised concern over potential impacts on seagrass, as well as biotic communities and
other habitats in the system (Kennish, 2001). In this study, we examine the
demographics of Zostera marina in the estuary over the 2008 study period to determine
its status and trends. We also discuss the environmental factors responsible for changes
6
in the structure and function of the seagrass beds. Assessment of the distribution,
abundance, and biomass of seagrasses is important for tracking escalating eutrophic
problems. To this end, comprehensive in situ sampling of seagrass beds was conducted
in the estuary during the spring-fall period in 2008, similar to surveys of the same beds
conducted from 2004-2006.
STUDY AREA
Barnegat Bay-Little Egg Harbor is a lagoonal estuary located along the central
New Jersey coastline (Figure 1). It forms an irregular tidal basin ~70 km long, 2-6 km
wide, and 1.5 m deep. The surface area amounts to 280 km2, and the volume, 3.54 x 10⁸
m3 (Kennish, 2001a). The location of the barrier island complex (Island Beach and Long
Beach Island) restricts exchange of water with the coastal ocean; therefore, flushing times
of the estuary are protracted, ~74 days in summer. Exchange of bay and ocean water
occurs through Barnegat Inlet, Little Egg Inlet, and the Pt. Pleasant Canal.
The adjoining Barnegat Bay watershed covers an area of 1730 km2, and the
watershed:estuary areal ratio is 6.5:1. A total of 562,493 people live in the surrounding
watershed year round, but the population exceeds 1,000,000 people during the summer
tourist season. A north-to-south gradient of decreasing population density occurs in the
watershed. As a result, nutrient loading is highest in the northern segment of the estuary
(Seitzinger et al. 2001).
The principal objectives of this investigation are to determine: (1) the
demographic characteristics and spatial habitat changes of seagrass in the estuary over
annual growing periods; (2) development of seagrass indicators of condition; (3) the
7
relative abundance, spatial distribution, and potential impacts of macroalgae on the
seagrass beds; (4) the determination of nitrogen concentrations in seagrass blades and the
calculation of a Nitrogen Pollution Index; and (5) the effectiveness of seagrass
transplantation experiments (i.e., plant survival) in the estuary. Although two species of
seagrass occur in the estuary, eelgrass (Zostera marina) and widgeon grass (Ruppia
maritima), eelgrass is overwhelmingly more abundant. Ground surveys yielded few
widgeon grass samples.
MATERIALS AND METHODS
Sampling Design
Quadrat-and-transect sampling was conducted over the June to November period
in 2008, targeting the same seagrass beds and sampling stations in Barnegat Bay (~1550
ha) and Little Egg Harbor (~1700 ha) that were sampled during the 2004-2006 period
(Kennish et al., 2007b, 2009). The purpose of this work was to determine if the status
(i.e., characteristics) of seagrass habitat has changed since the detailed SAV surveys
conducted during the 2004-2006 period. A total of 120 sampling sites along 12 transects
(see Transects 1-12; Figure 2) in four disjunct seagrass beds (1-4) in Barnegat Bay and
Little Egg Harbor were sampled during a 6-month sampling period (June-November) in
2008. During each sampling period (June-July, August-September, and October-
November), 80 of the 120 field sites (total n = 240 for all sampling periods) were
randomly selected and sampled to determine seagrass density, biomass, and blade length.
Areal cover measurements of seagrass and macroalgae were also made at all 120
sampling sites during each sampling period. In addition, diver observations were made at
8
these sampling sites to determine the occurrence of epiphytic infestation and bay
scallops. The following demographic data were recorded on all sampling dates:
presence/absence of seagrass and macroalgae, aboveground and belowground biomass of
seagrass, density of seagrass, percent cover of seagrass and macroalgae, seagrass blade
length, and occurrence of bay scallops (Argopecten irradians).
In addition to data collected on the biotic parameters (presence/absence of
seagrass and macroalgae, aboveground and belowground biomass of seagrass, shoot
density of seagrass, percent cover of seagrass and macroalgae, and seagrass blade length),
physicochemical data (temperature, salinity, pH, dissolved oxygen, turbidity, and depth)
were also measured using either a handheld YSI 600 XL data sonde coupled with a
handheld YSI 650 MDS display unit, an automated YSI 6600 unit (equipped with a
turbidity probe), or a YSI 600 XLM automated datalogger. Secchi disk measurements
were likewise collected in the survey area together with measurements of several nutrient
parameters (i.e., nitrate plus nitrite, ammonium, total dissolved nitrogen, phosphate, and
silica). More than 1000 biotic and abiotic measurements were obtained during the study
period.
Three seagrass transplantation sites were also established during this study
(Figure 3). The purpose of these sites was to conduct a seagrass cross-transplant
experiment within the study area to assess growth response. In addition, it provided an
opportunity to calculate a Nitrogen Pollution Index on the seagrass blades using the
approach of Lee et al. (2004).
Sampling stations along each transect and at the transplantation sites were
permanently located with a Differential Global Positioning System (Trimble®GeoXT™
9
handheld unit). Sampling periods (N = 3) commenced in June, August, and October and
continued until all targeted stations were sampled. No samples were collected after
November. The in situ sampling methods used in this study followed the standard
protocols of Short et al. (2002).
Quadrat Sampling
Following the field methods of Short et al. (2002), a 0.25-m2 metal quadrat was
haphazardly tossed at the sampling sites to obtain measurements of seagrass and
macroalgae areal coverage. The percent cover of seagrass and macroalgae was estimated
in the quadrat by a diver using a scale of 0 to 100 in increments of 5. Subsequently, the
length of a subset of seagrass blades was measured, and the mean values were recorded.
The diver then visually inspected the seagrass bed within the quadrat for evidence of
grazing, boat scarring, macroalgae, epiphytic loading, and wasting disease.
Core Sampling
Coring methods also followed those of Short et al. (2002), with a 10-cm (.00785
m2) diameter PVC coring device used to collect the seagrass samples with care taken not
to cut or damage the aboveground plant tissues. The diver-deployed corer extended deep
enough in the sediments to extract all belowground fractions (roots and rhizomes). Each
core was placed in a 3 x 5 mm mesh bag and rinsed to separate plant material from the
sediment. After removing the seagrass sample from the mesh bag, the sample was placed
in a labeled bag and stored on ice in a closed container prior to transport back to RUMFS.
In the laboratory, the samples were carefully sorted and separated into aboveground
10
(shoots) and belowground (roots and rhizomes) components. The aboveground and
belowground fractions were then oven dried at 50-60 ºC for a minimum of 48 hours. The
dry weight biomass (g dry wt m-2) of each fraction was then measured to the third
decimal place.
Water Quality Sampling
Water quality parameters (temperature, salinity, dissolved oxygen, pH, and
turbidity) were measured at all sampling stations using a handheld YSI 600 XL data
sonde coupled with a handheld YSI 650 MDS display unit, an automated YSI 6600 unit
(equipped with a turbidity probe), or a YSI 600 XLM automated datalogger as noted
above. The data were obtained prior to biotic sampling at each sampling site. Water
quality data will be collected at a uniform depth (~10 cm) above the sediment-water
interface.
Water samples were also collected and analyzed for nutrient concentrations
during each sampling period. Nitrate plus nitrite, ammonium, total dissolved nitrogen,
phosphate, and silica concentrations were measured at sampling sites within the seagrass
beds. Laboratory analysis of the nutrients followed standard methods. Nutrient samples
(N = 72) were collected at all 12 transects in the estuary over the study period.
Results
Physicochemical Conditions
Table 1 provides the mean water temperatures recorded at the sampling sites in
the estuary during the three sampling periods in 2008. The mean water temperature for
11
the June-July sampling period (23.37 ºC) was slightly lower than that for the August-
September sampling period (23.99 ºC). However, it decreased markedly (19.08 ºC) for
the October-November sampling period.
Salinities were in the polyhaline range, with mean values of 26.39‰ and 28.22‰
registered at the sampling sites during the June-July and August-September sampling
periods, respectively (Table 2). Mean salinity decreased slightly to 26.17‰ for the
October-November sampling period. Salinity variation was greatest during this last
sampling period.
Mean dissolved oxygen (DO) values amounted to 7.33 mg/l during the June-July
sampling period and 6.55 mg/l during the August-September sampling period (Table 3).
Intermediate DO levels (mean = 7.27 mg/l) were recorded for the October-November
period.
The pH values were consistent across the survey area in 2008. Mean pH
measurements amounted to 8.09 for the June-July sampling period and 7.95 for the
August-September sampling period (Table 4). A slightly higher mean pH value of 8.00
was registered for the October-November sampling period.
Secchi measurements were consistent across sampling periods (Table 5). In June-
July, the mean Secchi readings amounted to 1.21 m. Slightly lower Secchi values (mean
= 1.09 m) were recorded for the August-September sampling period. Highest Secchi
recordings (mean = 1.28 m) were compiled during the October-November sampling
period.
There was no significant difference in mean temperature, salinity, dissolved
oxygen, pH and Secchi disk depth over the course of the study period. However, mean
12
salinity was higher, and dissolved oxygen, pH, and Secchi disk depth lower, during the
August-September sampling period compared to the June-July and October-November
sampling periods. These trends were not consistent for all previous years of water quality
sampling (Kennish et al., 2007b).
Nutrient concentrations in the water column were similar to those recorded in
previous years, with low concentrations recorded for dissolved inorganic nitrogen and
phosphorus components (nitrate, nitrite, ammonium, and phosphate) (Kennish et al.,
2007). Table 6 lists the nutrient concentrations registered in this study. Nitrate plus
nitrite levels were low, ranging from a mean of 0.04-0.32 µM, with highest values
observed in the October-November period when plant growth was on the decline. These
low concentrations reflect the effect of autotrophic uptake during the late spring to
summer period. A wider range of ammonium values was recorded, with mean values
ranging from 0.30-1.48 µM. Once again, the highest values were observed in the
October-November period. These values were consistent with those documented by
Seitzinger et al. (2001). The mean total dissolved nitrogen concentrations ranged from
12.73-16.50 µM. Similar to nitrate plus nitrite and ammonium measurements, the mean
phosphate values were low, ranging from 0.73-0.78 µM; the highest values were again
recorded in the October-November period. Silica ranged from a mean of 8.51-22.0 µM,
with the peak levels once again observed in the October-November period.
Seagrass Demographics
Random seagrass samples were collected three times over the June-November
period at 80 of the 120 sampling sites to determine seagrass density, biomass, and blade
length. In addition, areal cover of seagrass was documented at all 120 sampling sites
13
during all three sampling periods. Diver observations were also made on epiphytic
overgrowth on seagrass, as well as macroalgae abundance and areal cover in the seagrass
habitat at all sampling sites. Observations were likewise made on occurrence of bay
scallops and other epifauna.
Seagrass Distribution
Eelgrass (Zostera marina) was far more abundant than widgeon grass in the
Barnegat Bay-Little Egg Harbor Estuary, especially in higher salinity areas. Widgeon
grass (Ruppia maritima) was most abundant in lower salinity areas north of Toms River.
Abundance, biomass and areal coverage of Z. marina varied considerably both in space
and time during the entire study period.
Density
Counts were made of Zostera marina density (shoots m-2) over the June-
November period. The highest density measurements in 2008 were recorded during the
August-September sampling period (mean = 466 shoots m-2). Significantly lower
densities of Z. marina were registered during the June-July and October-November
sampling periods. The lowest mean density value was 239 shoots m-2 during the study
period.
Aboveground Biomass
Aboveground biomass of Zostera marina in the Barnegat Bay-Little Egg Harbor
Estuary peaked during the August-September sampling period (mean = 30.83 g dry wt m-
14
2), with lowest values (mean = 22.91 g dry wt m-2) recorded during the October-
November sampling period. Intermediate aboveground biomass values (mean = 25.01 g
dry wt m-2) were documented during the June-July period (Table 7). An Analysis of
Variance (ANOVA) test used to compare the aboveground biomass values of Z. marina
among the three sampling periods showed no statistically significant differences (F =
0.48; P = 0.6189) in biomass values among sampling periods (Table 8). These results
agreed with a separate non-parametric Kruskal-Wallis test (Table 8.) (Chi square = 4.32,
pr > chi = 0.12).
Median biomass values during the three sampling periods were much lower than
the mean values because few samples were collected relative to the total number of
stations examined for seagrass occurrence. Figure 4 shows box plots of aboveground
seagrass biomass values for the three sampling periods. Highest biomass values were
observed during the August-September sampling period. Of the 240 stations surveyed
for from June to November, only 125 aboveground biomass measurements were
recorded. The high percentage of sites with no biomass measurements for all three
sampling periods might cause a type II error (fail to reject null hypothesis that there is no
difference between aboveground biomass between sampling periods). This is likely due
to a systematic decline in seagrass habitat for the entire 2008 sampling period.
The median values of the aboveground and belowground biomass during the
June-July sampling period were 0 (Table 9). Very few seagrass samples were collected
in Little Egg Harbor during June sampling. The highest median values were found
during the August-September sampling period when the median aboveground biomass
amounted to 12.49 g dry wt m-2 and the median belowground biomass amounted to 27.21
15
g dry wt m-2. Median aboveground and belowground values during the October-
November sampling period amounted to 2.67 g dry wt m-2 and 2.26 g dry wt m-2,
respectively (Table 9).
During the 2008 study period, the mean aboveground biomass of Zostera marina
was highest for transect 3 (65.1 g dry wt m-2), transect 7 (54.2 g dry wt m-2), and transect
9 (51.2 g dry wt m-2). The lowest mean aboveground biomass value (1.4 g dry wt m-2)
was recorded for transect 12 (Table 10). Figure 5 shows the mean aboveground biomass
values for all transects during the six-month survey period.
The biomass data were also assessed on the basis of values recorded at interior
transect sites (3, 4, 5, 6, 7, and 8) versus exterior transect sites (1, 2, 9, and 10). The
mean aboveground biomass values for the interior transect sampling sites were
substantially greater than those recorded at the exterior transect sampling sites (Figure 6).
This pattern was consistent with that observed for previous survey years (2004-2006)
(Kennish et al., 2007b).
Belowground Biomass
Sampling for belowground biomass was likewise conducted during the three
sampling periods between June and November 2008. Belowground biomass decreased
sharply during the October-November sampling period, after a period of relatively
consistent levels during the June-July and August-September sampling periods. The
highest mean belowground biomass of Z. marina samples was observed during the June-
July sampling period (81.31 g dry wt m-2), and the lowest mean belowground biomass
was found during the October-November sampling period (39.86 dry wt m-2). An
16
intermediate mean belowground biomass value was obtained during the August-
September sampling period (76.12 g dry wt m-2) (Table 7).
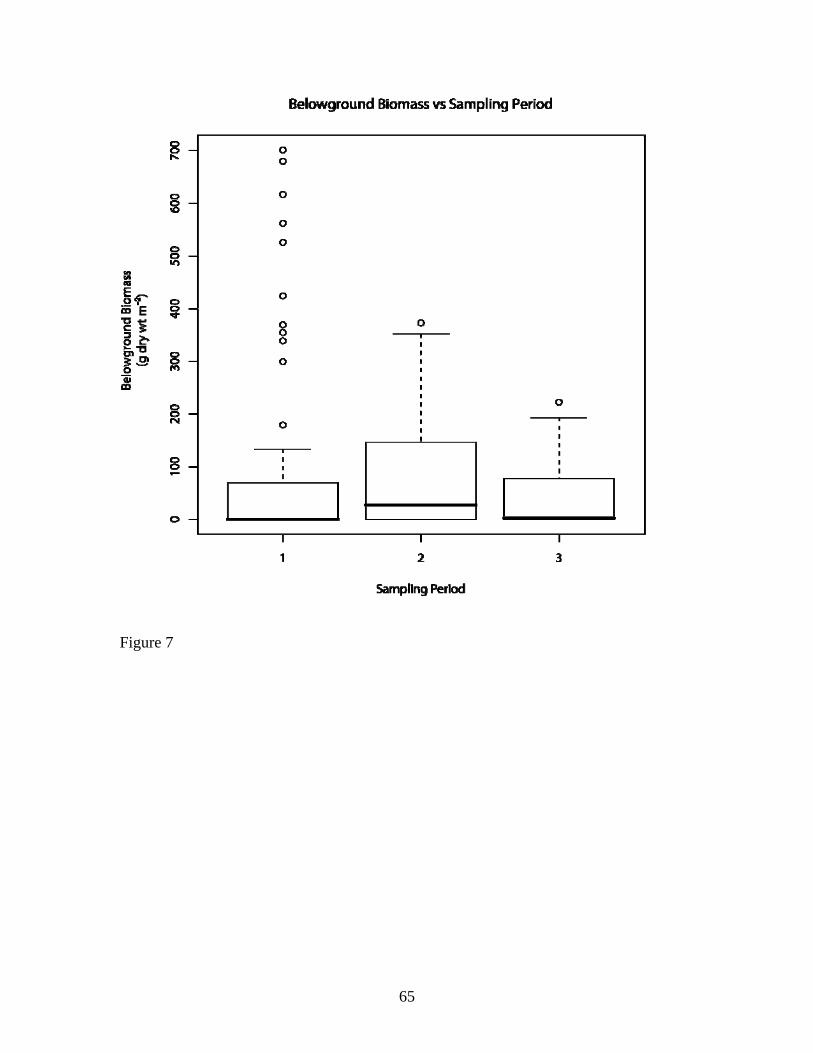
Figure 7 shows box plots of belowground Z. marina biomass values for the three
sampling periods. Similar to the aboveground biomass values, the highest belowground
biomass values were observed during the August-September sampling period. The
belowground biomass measurements of Z. marina were markedly higher than the
aboveground biomass measurements during all three sampling periods in 2008, being
two-fold higher during sampling periods 1 and 2 and nearly 50% higher during sampling
period 3. An ANOVA test was used to compare belowground biomass values of Z.
marina between the three sampling periods, and the test showed a statistically significant
difference (F = 3.18; P = 0.0434) (Table 11). This result disagreed with a separate non-
parametric kruskal wallis test (Table 11) (Chi square = 4.36, pr > chi = 0.11). The high
percentage of sites with no biomass for all three sampling periods might cause a type II
error (fail to reject null hypothesis that there is no difference between belowground
biomass between sampling periods). This is likely due to a systematic decline in seagrass
habitat for the entire 2008 sampling period.
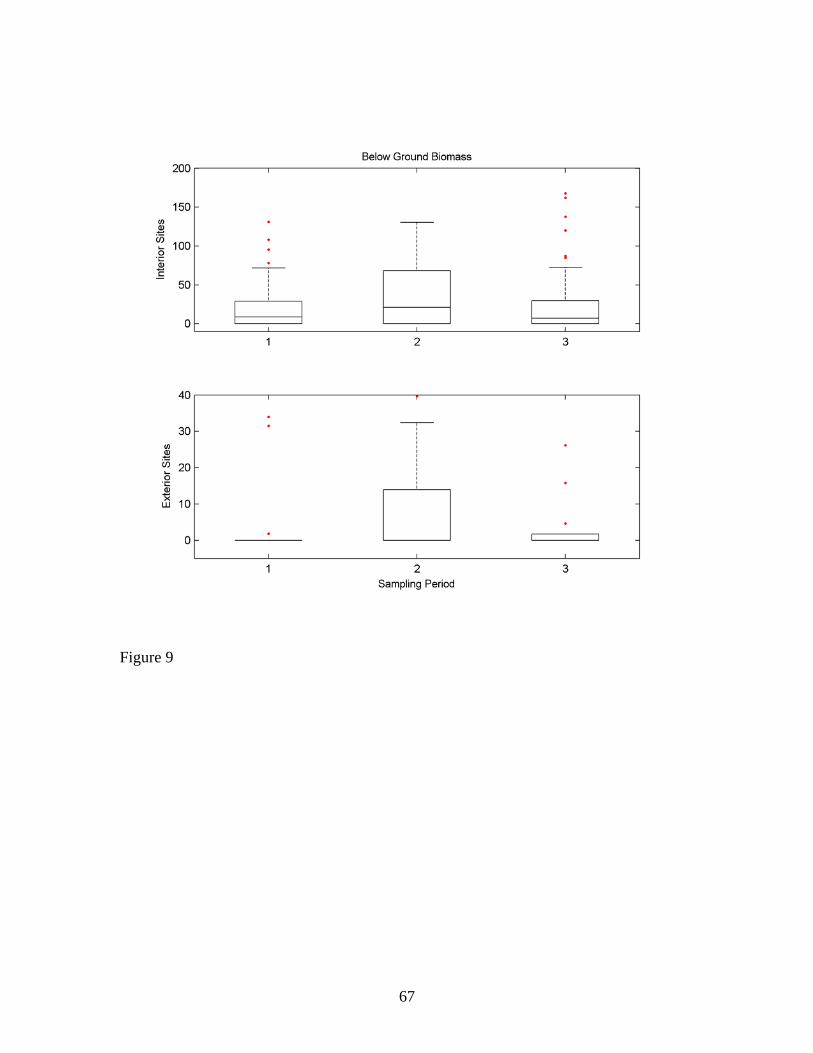
Belowground biomass of Zostera marina was also investigated in respect to
spatial distribution, with mean values determined for the 12 transects in the study area
(Table 10, Figure 8). The highest mean belowground biomass (115.5 g dry wt m-2) was
recorded for transect 11, with lower but similar levels for transects 3, 4, 5, and 9. The
lowest mean belowground biomass values were registered for transects 12 (1.4 g dry wt
m-2) and 1 (4.2 g dry wt m-2). As in the case of aboveground biomass values,
17
belowground biomass values were much greater at interior than exterior trasnsect
sampling sites, especially during the first two sampling periods (Figure 9).
The aboveground to belowground biomass ratio for Z. marina was less than 1.0
for all transects except transects 1 and 12. The ratios ranged from 0.13 (transect 10) to
1.5 (transect 1). These values indicate that the aboveground biomass was consistently
less than the belowground biomass along all but two of the transects (Table 10).
Seagrass Blade Length
Table 12 lists the mean length of Zostera marina blades recorded during the study
period. The highest mean length (19.88 cm) was observed during the October-November
sampling period. The mean length of the blades was lowest (14.57 cm) during the
August-September sampling period, and slightly higher (15.35 cm) during the June-July
sampling period. Blade length values were not significantly different during the
sampling periods.
Percent Cover: Seagrass and Macroalgae
The mean percent cover of seagrass during period 1 (June-July), period 2
(August-September), and period 3 (October-November) in 2008 was 23%, 36%, and
27%, respectively (Table 13). Figure 10 shows a box plot of seagrass percent cover for
the three sampling periods, with the highest percent cover recorded during the August-
September period. Figure 11 shows the percent cover of seagrass by transect. The
percent cover was considerably higher at interior transect sampling sites than exterior
transect sampling sites for all sampling periods (Figure 12). By comparison, the mean
18
percent cover by macroalgae during these periods was substantially less, averaging 20%
(June-July), 10% (August-September), and 5% (October-November) for the study period
(Table 13). Figure 13 shows a box plot of macroalgae percent cover for the three
sampling periods. The highest percent cover was observed during the June-July sampling
period. Considerable variation of macroalgal cover was evident among the transects,
particularly between the interior and exterior transect sites. Macroalgal cover was greater
at interior than exterior transect sites for the June-July and August-September sampling
periods (Figure 14).
Seagrass Experimental Transplantation Plots
Reciprocal transplanting of Zostera marina plants was performed between three
sites located in the northern, central, and southern segments of the estuary on May 29,
2008 (Figure 3). Two of the sites (northern and central segments) were located in
Barnegat Bay, and one site (southern segment), was located in Little Egg Harbor. These
sites were selected based on similar physicochemical characteristics (i.e., depth, light
penetration, sediment composition, etc.). At each site, nine seagrass samples were
extracted from the estuarine bottom sediment using the aforementioned coring device,
yielding a total of 27 plugs. Intact plugs were extracted at each site containing complete
leaf, root, rhizome, and sediment components with minimal disturbance. All of these
samples were inserted into peat pots measuring 8 cm on a side and then placed in coolers.
The three sites were subsequently visited the same day in reverse order from north to
south (sites 3 – 2 – 1), and the pots were transplanted within hours of collection. At each
site, a denuded area was chosen within the seagrass beds and marked with a Garmin
19
GPSmap 530s. Three plants from each site were then planted in a rigid 1 x 1 m PVC
frame designed to demarcate the samples.
The transplantation sites were revisited on September 16, 2008. However, no
peat pots were found at sites 1 and 2, having been lost to weather events, high currents, or
anthropogenic factors. The peat pots were found only at site 3 on this date, and a subset
of the blades were sampled from the peat pots at this location. This site was later visited
again on November 12, 2008, and plant blades in five of the peat pots were sampled and
measured in the laboratory for length, leaf mass, and nitrogen content. A Nitrogen
Pollution Index (NPI) was calculated based on these later measurements (Table 14).
Nitrogen Pollution Index
Seagrass samples were collected at transplantation site 3 to develop a Nitrogen
Pollution Index (NPI). The following expression was applied to develop the index:
NPI = Leaf N Normalized Leaf Mass (mg dry wt cm-1)
The ratio of leaf nitrogen to leaf mass has been shown to provide an accurate integrated
measure of environmental nitrogen exposure by eelgrass in other estuarine systems (Lee
et al., 2004).
After removing the subset of seagrass blades from the peat pots, they were placed
in a labeled bag, stored on ice in a closed container, and transported back to the Rutgers
University Marine Field Station in Tuckerton. In the laboratory, the samples were
carefully sorted and separated. Morphometric measurements were made in the laboratory
20
on the plants. Epiphytes were removed from the eelgrass blades, which were then dried.
The dried leaf material was subsequently ground and passed through a 40-mesh screen.
The tissue from the samples was used to determine leaf N content employing an
elemental analyzer. A matrix of values was developed for the eelgrass leaf nitrogen
content and assessed for environmental nitrogen exposure which the plants experienced.
The NPI values for site 3 are listed in Table 14.
DISCUSSION
The Barnegat Bay-Little Egg Harbor Estuary has been classified as a highly
eutrophic system (Bricker et al., 2007; Kennish et al., 2007). Eutrophy of the estuary has
been linked to an array of adverse biotic responses, including declining seagrass habitat.
Altered biotic community composition and habitat conditions of the estuary associated
with progressive eutrophication signal increasing ecosystem disturbance and impairment
that must be tracked in order to implement effective remedial measures and circumvent
the decline in human use of estuarine resources and amenities. To this end, a seagrass
demographic survey was conducted during 2008 to collect data on the following
parameters: presence/absence of seagrass and macroalgae, aboveground and
belowground biomass of seagrass, density of seagrass, percent cover of seagrass and
macroalgae, and seagrass blade length. The same parameters were measured at the same
field sites in comprehensive seagrass surveys conducted in the estuary from 2004-2006,
enabling comparisons to be made.
A major goal of this long-term work is to examine seagrass responses to nutrient
enrichment of the system. In order to achieve this goal, it is important to determine the
21
demographic characteristics as well as the spatial and temporal habitat change of seagrass
in the estuary over an annual growing period. Data collected on seagrass demographics
in the system are vital for devising remedial plans to restore seagrass habitat in the
estuary.
Aboveground and belowground biomass of seagrass beds in the estuary decreased
by 50-87.7% over the 2004-2006 period (Kennish et al., 2007b, 2008). Areal coverage,
density, and blade length of seagrass also declined markedly over this period. Blooms of
drifting macroalgae (e.g., Ulva lactuca) periodically produced extensive benthic canopies
during this period that posed a serious danger to the seagrass beds by blocking sunlight
transmission to the estuarine floor. Rapid growth of other macroalgal species in the
estuary, such as the rhodophytes Ceramium spp., Champia parvula, Gracilaria tikvahiae,
and Spyridia filamentosa, also formed mats of vegetation that appeared to be detrimental.
The decomposition of thick macroalgal mats is problematic because it can promote
sulfide accumulation and the development of hypoxic/anoxic conditions in bottom
sediments that are hazardous to benthic faunal communities.
The decrease in seagrass areal coverage in recent years has eliminated habitat for
bay scallops (Argopecten irradians), hard clams (Mercenaria mercenaria), and other
benthic organisms. Blooms of the sea nettle (Chrysaora quinquecirrha) have likewise
occurred in the estuary since 2000, seriously impairing some areas for human use. In
addition, this invasive species has been shown to disrupt estuarine food webs by grazing
heavily on zooplankton, thereby truncating energy flow to upper trophic level organisms.
It is a species that also thrives in eutrophic estuaries, such as tributary systems of
Chesapeake Bay and the Barnegat Bay-Little Egg Harbor Estuary (especially north of
22
Toms River). Nitrogen over-enrichment, when unchecked, causes significant
deterioration of sediment and water quality, loss of biodiversity, and disruption of
ecosystem health and function (Nixon, 1995; Nixon et al., 2001; Kennish et al., 2007a).
There is growing concern that escalating eutrophication can lead to severe, long-term
degradation of the structure and function of the Barnegat Bay-Little Egg Harbor system.
Hence, seagrass surveys were continued in 2008 because seagrass beds are an important
indicator of overall water and sediment quality conditions.
Results of the 2008 seagrass survey in the estuary yielded a number of important
findings. Data collected on seagrass demographics indicate that the beds in 2008 have
yet to recover from the marked decline of seagrass abundance and biomass observed in
2006. Seagrass in the estuary has decreased significantly since 2004 when seagrass beds
exhibited much greater abundance and biomass. In 2008, seagrass was found at less than
50% of the survey sites (46.3%) during the June-July sampling period when the median
aboveground and belowground biomass values were 0. The fewest number of seagrass
samples were recovered in Little Egg Harbor.
The biomass of Zostera marina in the estuary typically peaks during the June-
September period as evidenced by data collected during the 2004-2006 and 2008 years of
sampling. In 2008, the mean aboveground biomass was highest in August-September
(30.93 g dry wt m-2), and the mean belowground biomass was highest in June-July (81.31
g dry wt m-2). Over the entire June-November sampling period, the mean aboveground
biomass declined slightly from 25.01 g dry wt m-2 to 22.91 g dry wt m-2, while the mean
belowground biomass decreased markedly (by 51%) from 81.31 g dry wt m-2 to 39.86 g
dry wt m-2. The aboveground biomass values were low throughout the 2008 study
23
period, and this explains in part only a modest decline in aboveground biomass (9.2%)
recorded at this time.
A progressive reduction of seagrass biomass was evident over the 2004-2006
sampling periods, with the losses being most acute during 2006 (Kennish et al., 2007b).
Thus, conditions of diminished seagrass abundance appear to have continued through
2008, although the levels of decline were greatest in 2006. Between 2004 and 2006, the
mean aboveground biomass of Zostera marina along six transects (1-6) in Little Egg
Harbor decreased 87.7% from 59.62 g dry wt m-2 to 7.31 g dry wt m-2, and the mean
belowground biomass declined 59.4% from 75.60 g dry wt m-2 to 30.69 g dry wt m-2.
Similarly, along six transects (7-12) in Barnegat Bay between 2005 and 2006, the mean
aboveground biomass of Z. marina declined 50% from 32.04 g dry wt m-2 to 16.03 g dry
wt m-2, and the mean belowground biomass decreased 52.4% from 84.59 g dry wt m-2 to
40.25 g dry wt m-2. The decline in seagrass biomass was estuary-wide in 2006. The
mean biomass values of Z. marina in 2006 rank among the lowest mean annual biomass
values ever recorded for this species in the estuary. They appear to be linked to
increasing eutrophic impacts in the system associated with nuisance algal blooms,
shading, and bottom disturbances.
The biomass of Zostera marina generally peaked during the June-July sampling
period. For example, the maximum mean aboveground and belowground biomass of Z.
marina in Little Egg Harbor in 2004 (the sampling year exhibiting best seagrass
conditions) occurred during the June-July period, amounting to 106.05 g dry wt m-2 and
107.64 g dry wt m-2, respectively. The biomass values subsequently declined during the
ensuing August-September period (mean aboveground biomass = 54.61 g dry wt m-2;
24
mean belowground biomass = 68.69 g dry wt m-2) and October-November period (mean
aboveground biomass = 18.22 g dry wt m-2; mean belowground biomass = 50.48 g dry wt
m-2).
In 2005, the maximum mean aboveground biomass (51.69 g dry wt m-2) and
belowground biomass (141.95 g dry wt m-2) of Zostera marina in Barnegat Bay were also
recorded during the June-July period. Lower mean aboveground and belowground
biomass measurements were found during the August-September period, amounting to
28.79 g dry wt m-2 and 69.03 g dry wt m-2, respectively. Even lower mean aboveground
and belowground biomass measurements were recorded during the October-November
period, equaling 15.66 g dry wt m-2 and 42.78 g dry wt m-2, respectively. Over the 2005
study period, both the aboveground and belowground biomass values of Z. marina
decreased by more than 69%.
The mean aboveground biomass of Zostera marina in Barnegat Bay-Little Egg
Harbor in 2006 peaked during the August-September period (mean = 13.77 g dry wt m-2).
In contrast, the mean belowground biomass was a maximum during the June-July period
(51.54 g dry wt m-2). A consistent seasonal decline in belowground biomass was evident
in 2006 from a mean of 51.54 g dry wt m-2 in June-July, 36.08 g dry wt m-2 in August-
September, and 24.23 g dry wt m-2 in October-November. The aboveground biomass did
not exhibit a similar seasonal decline in 2006.
An Analysis of Variance (ANOVA) and a separate non-parametric Kruskal-
Wallis test was used to compare aboveground biomass values of Zostera marina in Little
Egg Harbor for sampling years 2004, 2006, and 2008. This test showed statistically
significant differences (F = 35.44; P < 0.0001) among years. Results of the Kruskal
25
Kruskal-Wallis non-parametric test corroborate the ANOVA results (Chi-Square = 77.30
and pr > ch = 0.00001). A Tukey HSD test applied to the data revealed that all mean
aboveground biomass values per sampling year were significantly different (Table 15).
Application of a Wilcoxon Rank Sum Test revealed significant differences (P < 0.95) in
aboveground biomasses between sampling years 2004 and 2006, 2006 and 2008, and
2004 and 2008 (Table 15).
An Analysis of Variance (ANOVA) test was used to compare belowground
biomass values of Zostera marina in Little Egg Harbor for sampling years 2004, 2006,
and 2008. This test showed statistically significant differences (F = 5.93; P < 0.0029)
among years. Results of the Kruskal-Wallis non-parametric test concur with the
ANOVA results (Chi-Square = 30.30 and pr > ch = 0.0001). Application of a Wilcoxon
Rank Sum Test revealed significant differences (P < 0.95) in belowground biomasses
between sampling years 2004 and 2006, 2006 and 2008, and 2004 and 2008 (Table 16).
An Analysis of Variance (ANOVA) test was used to compare aboveground
biomass values of Zostera marina in Barnegat Bay for sampling years 2004, 2006, and
2008. This test showed statistically significant differences (F = 4.63; P < 0.0104) among
years using the ANOVA test. A separate non-parametric Kruskal-Wallis test failed to
reject the null hypothesis (Chi-Square = 3.74 and pr > ch = <.154). The non-parametric
test weighs all sites equally, including sites which have no seagrass across the entire
sampling period. We believe the result is too conservative, causing a type II error failure
to reject the null hypothesis. Application of a Wilcoxon Rank Sum Test revealed
significant differences (P < 0.95) in aboveground biomasses between sampling years
26
2005 and 2006, and 2006 and 2008. No statistically significant differences were found
between aboveground biomass values for 2005 and 2008 (Table 17).
An Analysis of Variance (ANOVA) test was used to compare belowground
biomass values of Zostera marina in Barnegat Bay for sampling years 2005, 2006, and
2008. This test showed statistically significant differences (F = 5.52; P < 0.0044) among
years. A separate non-parametric Kruskal-Wallis test failed to reject the null hypothesis
(Chi-Square = 4.58 and pr > ch = <.10). The non-parametric test weighs all sites equally
including sites which have no seagrass across the entire sampling period. We believe the
result is too conservative, resulting in a type II error failure to reject the null hypothesis.
Application of a Wilcoxon Rank Sum Test revealed significant differences (P < 0.95) in
belowground biomasses between sampling years 2005 and 2006, but no significant
differences between sampling years 2005 and 2008, and sampling years 2006 and 2008
(Table 18).
The density of Zostera marina ranged from 239-466 shoots m-2 during 2008. Peak
density of Z. marina occurred during the August-September period when the
aboveground biomass also peaked. The density range of the plants was similar to that in
2005 (163-479 m-2) but greater than that in 2006 (171-378 shoots m-2).
The blade length of Zostera marina was relatively consistent during 2008, with
mean values amounting to 15.35 cm in June-July, 14.57 cm in August-September, and
19.88 cm in October-November. By comparison with the previous years of sampling
from 2004-2006, the blade lengths during 2008 were the shortest on record, even when
compared to the heavily impacted year of 2006. For example, the mean blade length of
Z. marina in Little Egg Harbor during 2004 was 34.02 cm in June-July, 32.21 cm in
27
August-September, and 31.83 cm in October-November. The mean blade length of Z.
marina in Barnegat Bay during 2005 amounted to 32.71 cm in June-July, 25.89 cm in
August-September, and 28.47 cm in October-November. In 2006, the mean blade length
of Z. marina in the estuary was 19.37 cm in June-July, 18.65 cm in August-September,
and 18.61 cm in October-November. The reduced growth during 2006 correlated with
lower shoot density and biomass measurements at this time as well.
The nitrogen content of Zostera marina blades measured at field transplantation
sites ranged from 2.97% to 4.33%. These values are similar to those measured by Lee et
al. (2004) in seagrasses of Waquoit Bay and two other estuaries systems. Nitrogen
Pollution Index values calculated for the Z. marina in the Barnegat Bay-Little Egg
Harbor Estuary based in part on the leaf nitrogen content ranged from 0.58 to 2.55.
The percent cover of seagrass was similar to that observed in previous years of
sampling. For example, the percent cover of seagrass in the study area progressively
declined over the June-November period for all years of sampling except 2008, dropping
from 45% to 21% in 2004, 43% to 16% in 2005, and 32% and 19% in 2006. In 2008,
however, the percent cover of seagrass was lowest in June-July (23%), highest in August-
September (36%), and intermediate in October-November (27%).
Seagrass biomass, density, and areal cover in 2008 were higher at exterior transect
sampling sites (1, 2, 9, and 10) than at interior transect sampling sites (3, 4, 5, 6, 7, and
8). These values are consistent with those recorded during 2004, 2005, and 2006. This
pattern indicates that seagrasses located near the margin of their distribution are more
likely to be exposed to less optimal conditions for growth and survival.
28
The percent cover of macroalgae in 2008 was significantly lower than that of
seagrass, declining markedly from June to November. The mean percent cover of
macroalgae declined from 20% during the June-July period to 10% during the August-
September period and 5% during the October-November period. By comparison, the
percent cover of macroalgae in Little Egg Harbor in 2004 increased from 13% to 21%
from June to September and then decreased to 14% in November. In Barnegat Bay
during 2005, macroalgal areal coverage dropped from 14% in June-July to 2% in
October-November. In 2006, the percent cover of macroalgae in the estuary increased
from 2% during the June-July period to 7% during the October-November period.
Macroalgae completely covered extensive areas of the bay bottom during blooms,
particularly when comprised of sheet-like forms such as Ulva lactuca, as was the case in
Little Egg Harbor in 2004. These blooms appear to cause significant dieback of seagrass
in some areas of the estuary. Although macroalgae coverage of bay bottom is less than
seagrass coverage over an entire season, blooms of macroalgae can form spikes in the
database completely blanketing seagrass beds over extensive areas during specific times
of the year.
SUMMARY AND CONCLUSIONS
Barnegat Bay-Little Egg Harbor Estuary is a highly eutrophic lagoonal estuary.
Symptom expressions of eutrophication include low dissolved oxygen, particularly in the
blooms, and markedly reduced fisheries (i.e., hard clams). Seagrass beds in this coastal
lagoon have exhibited degraded conditions for years (Bricker et al., 1999, 2001; Kennish,
29
2001, 2007a), and based on surveys conducted in 2004-2006 and 2008, declining
conditions appear to be worsening. Extensive areas of the northern estuary have recently
(2008) experienced low dissolved oxygen levels. The aboveground and belowground
biomass of seagrass in the estuary decreased by 50-87.7% over the 2004-2006 period,
underscoring the ongoing degradation. Seagrass density, blade length, and areal cover
also showed statistically significant reductions over this three-year period (Kennish et al.,
2007b). Accelerated growth of drifting macroalgae (e.g., Ulva lactuca) has periodically
caused extensive benthic mats that have attenuated light, leading to detrimental
conditions for seagrass growth and survival. Acute events were observed in 2004 as well
as in other years. Aside from sea lettuce impacts, rapid growth of other macroalgal
species in the estuary, such as the rhodophytes Ceramium spp., Champia parvula,
Gracilaria tikvahiae, and Spyridia filamentosa also appear to be detrimental. The
decrease in seagrass areal coverage has eliminated essential habitat for bay scallops, hard
clams (Mercenaria mercenaria), and many other benthic organisms. Blooms of the sea
nettle (Chrysaora quinquecirrha), possibly coupled to increasing eutrophic conditions,
have likewise occurred in the estuary since 2000. The aforementioned changes signal
ongoing disruption of ecosystem structure and function.
The biomass of seagrass beds in the Barnegat Bay-Little Egg Harbor during 2008
sampling exhibited important temporal and spatial patterns similar to those reported for
the 2004-2006 period. The density as well as the aboveground and belowground biomass
of seagrass varied considerably during the spring to fall period, but were generally
highest during the June-September period as in previous seagrass demographic surveys.
30
In 2008, the mean aboveground biomass was highest in August-September (30.93
g dry wt m-2), and the mean belowground biomass was highest in June-July (81.31 g dry
wt m-2). Over the entire June-November sampling period, the mean aboveground
biomass declined slightly from 25.01 g dry wt m-2 to 22.91 g dry wt m-2, while the mean
belowground biomass decreased markedly (by 51%) from 81.31 g dry wt m-2 to 39.86 g
dry wt m-2. The aboveground biomass values were low throughout the 2008 study
period. Seagrass was found at less than 50% of the survey sites (46.3%) sampled during
the June-July sampling period in 2008 when the median aboveground and belowground
biomass values were 0. The fewest number of seagrass samples were recovered at the
Little Egg Harbor sampling sites. These data indicate that seagrass habitat conditions
have not recovered from the devastating losses in 2006.
The density of Zostera marina ranged from 239-466 shoots m-2 during 2008. Peak
density of Z. marina occurred during the August-September period when the
aboveground biomass also peaked. The density range of the plants was similar to that in
2005 (163-479 m-2) but greater than that in 2006 (171-378 shoots m-2).
The blade length of Zostera marina was relatively consistent during 2008, with
mean values amounting to 15.35 cm in June-July, 14.57 cm in August-September, and
19.88 cm in October-November. By comparison with the previous years of sampling
from 2004-2006, the blade lengths during 2008 were the shortest on record, even when
compared to the heavily impacted year of 2006. For example, the mean blade length of
Z. marina in Little Egg Harbor during 2004 was 34.02 cm in June-July, 32.21 cm in
August-September, and 31.83 cm in October-November. The mean blade length of Z.
marina in Barnegat Bay during 2005 amounted to 32.71 cm in June-July, 25.89 cm in
31
August-September, and 28.47 cm in October-November. In 2006, the mean blade length
of Z. marina in the estuary was 19.37 cm in June-July, 18.65 cm in August-September,
and 18.61 cm in October-November. The nitrogen content of eelgrass blades measured
during the surveys in 2008 ranged from 2.97% to 4.33%.
The percent cover of seagrass in the study area gradually declined over the June-
November period for all years of sampling except 2008, dropping from 45% to 21% in
2004, 43% to 16% in 2005, and 32% and 19% in 2006. In 2008, the percent cover of
seagrass was lowest in June-July (23%), highest in August-September (36%), and
intermediate in October-November (27%). The June-July period in 2008 was much
different than previous years of sampling (2004-2006) with much less aboveground
seagrass being present.
Seagrass grow best away from the bed border areas. For example, seagrass
biomass, density, and areal cover in 2008 were higher at exterior transect sampling sites
(1, 2, 9, and 10) than at interior transect sampling sites (3, 4, 5, 6, 7, and 8). These values
are consistent with those measured during 2004, 2005, and 2006. This pattern indicates
that seagrasses located near the margin of their distribution are more likely to be exposed
to less optimal conditions for growth and survival.
Macroalgae percent cover decreased significantly from June to November in
2008. For example, the mean percent cover of macroalgae declined from 20% during the
June-July period to 10% during the August-September period and 5% during the
October-November period. During bloom conditions, macroalgae completely cover
extensive areas of the estuarine floor, which can impact seagrass abundance and
distribution due to the attenuation of sunlight.
32
REFERENCES
Bologna, P. A. X., R. Lathrop, P. D. Bowers, and K. W. Able. 2000. Assessment of the
Health and Distribution of Submerged Aquatic Vegetation from Little Egg
Harbor, New Jersey. Technical Report, Contribution #2000-11, Institute of
Marine and Coastal Sciences, Rutgers University, New Brunswick, New Jersey.
30 pp.
Bricker S. B., C. G. Clement, D. E. Pirhalla, S. P., Orlando, and D. R. G. Farrow, D.
1999. National Estuarine Eutrophication Assessment: Effects of Nutrient
Enrichment in the Nation’s Estuaries. NOAA, National Ocean Service, Special
Projects Office and National Centers for Coastal Ocean Science, Silver Spring,
Maryland, USA.
Bricker, S. B., B. Longstaff, W. Dennison, A. Jones, K Boicourt, C. Wicks, and J.
Woerner. 2007. Effects of Nutrient Enrichment in the Nation’s Estuaries: A
Decade of Change. NOAA, National Ocean Service, Special Projects Office and
National Centers for Coastal Ocean Science, Silver Spring, Maryland, USA.
Gastrich, M. D., R. Lathrop, S. Haag, M. P. Weinstein, M. Danko, D. A. Caron, and R.
Schaffner. 2004. Assessment of brown tide blooms, caused by Aureococcus
anophagefferans, and contributing factors in New Jersey coastal bays: 2000-
2002. Harmful Algae 3: 305-320.
Kennish, M. J. (ed.). 2001. Barnegat Bay-Little Egg Harbor, New Jersey: Estuary and
Watershed Assessment. Journal of Coastal Research, Special Issue 32, 280 pp.
33
Kennish, M. J., S. B. Bricker, W. C. Dennison, P. M. Glibert, R. J. Livingston, K. A.
Moore, R. T. Noble, H. W. Paerl, J. M. Ramstack, S. Seitzinger, D. A. Tomasko,
and I. Valiela. 2007a. Barnegat Bay-Little Egg Harbor Estuary: case study of a
highly eutrophic coastal bay system. Ecological Applications 17(5) Supplement:
S3-S16.
Kennish, M. J., S. M. Haag, and G. P. Sakowicz. 2007b. Demographic Investigation of
SAV in the Barnegat Bay-Little Egg Harbor Estuary with Assessment of Potential
Impacts of Benthic Macroalgae and Brown Tides. Technical Report 107-15,
Institute of Marine and Coastal Sciences, Rutgers University, New Brunswick,
New Jersey. 366 pp.
Kennish, M. J. 2009. Assessment of Eutrophication in the Barnegat Bay-Little Egg
Harbor System: Use of SAV Biotic Indicators of Estuarine Condition. Quality
Assurance Project Plan (QAPP) – Version 1.0. New Jersey Department of
Environmental Protection, Trenton, New Jersey. 32 pp.
Lamote, M. and K. H. Dunton. 2006. Effects of drift macroalgae and light attenuation in
chlorophyll fluorescence and sediment sulfides in the seagrass Thalassia
testudinum. Journal of Experimental Marine Biology and Ecology 334: 174-186.
Lathrop, R. G., R. Styles, S. Seitzinger, and J. Bognar. 2001. Use of GIS mapping and
modeling approaches to examine the spatial distribution of seagrasses in Barnegat
Bay, New Jersey. Estuaries 24: 904-916.
Lathrop, R. G., P. Montesano, and S. Haag. 2006. A multi-scale segmentation approach
to mapping seagrass habitats using airborne digital camera imagery.
Photogrammetric Engineering and Remote Sensing 72: 665-675.
34
Lee, D-S., F. T. Short, D. M. Burdick. 2004. Development of a nutrient pollution
indicator using the seagrass, Zostera marina, along nutrient gradients in three
New England estuaries. Aquatic Botany 78: 197-216.
McClain, P. and M. McHale. 1997. Barnegat Bay eelgrass investigation 1995-96. In:
Flimlin, G. E. and Kennish, M. J. (eds.), Proceedings of the Barnegat Bay
Ecosystem Workshop. Rutgers Cooperative Extension of Ocean County, Toms
River, New Jersey, pp. 165-171.
Nixon, S. W. 1995. Coastal eutrophication: a definition, social causes, and future
concerns. Ophelia 41: 199-220.
Olsen, P. S. and J. B. Mahoney. 2001. Phytoplankton in the Barnegat Bay-Little Egg
Harbor estuarine system: species composition and picoplankton bloom
development. Journal of Coastal Research, Special Issue 32, pp. 115-143.
Orth, R. J., T. J. B. Carruthers, W. C. Dennison, C. M. Duarte, J. W. Fourqurean, K. L.
Heck, Jr., A. R. Hughes, G. A. Kendrick, W. J. Kenworthy, S. Olyarnik, F. T.
Short, M. Waycott, and S. L. Williams. 2006. A global crisis for seagrass
ecosystems. BioScience 56: 987-996.
Rabalais, N. N. 2002. Nitrogen in aquatic ecosystems. Ambio 21: 102-112.
Seitzinger, S. P., R. M. Styles, and I. E. Pilling. 2001. Benthic microalgal and
phytoplankton production in Barnegat Bay, New Jersey (USA): microcosm
experiments and data synthesis. Journal of Coastal Research, Special Issue 32,
pp. 144-162.
Short, F. T., L. J. McKenzie, R. G. Coles, and K. P. Vidler. 2002. SeagrassNet Manual
for Scientific Monitoring of Seagrass Habitat. (QDPI, QFS, Cairns). 56 pp.
35
Valiela, I. 2006. Global Climate Change. Blackwell Publishing, Oxford, England.
36
Table 1. Mean water temperatures recorded at the seagrass survey sites in the Barnegat
Bay-Little Egg Harbor Estuary during three sampling periods in 2008.
Sample Period Mean Temperature (ºC) Standard Deviation 1 23.37 3.63 2 23.99 1.06 3 19.08 2.21
Sample Period 1 = June-July Sample Period 2 = August-September Sample Period 3 = October-November
37
Table 2. Mean salinity values recorded at the seagrass survey sites in the Barnegat Bay-
Little Egg Harbor Estuary during three sampling periods in 2008.
Sample Period Mean Salinity (ppt) Standard Deviation 1 26.39 3.38 2 28.22 2.74 3 26.17 5.56
Sample Period 1 = June-July Sample Period 2 = August-September Sample Period 3 = October-November
38
Table 3. Mean dissolved oxygen levels recorded at the seagrass survey sites in the
Barnegat Bay-Little Egg Harbor Estuary during three sampling periods in 2008.
Sample Period Mean Dissolved Oxygen (mg L¯¹) Standard Deviation
1 7.33 1.07 2 6.55 0.98 3 7.27 1.06
Sample Period 1 = June-July Sample Period 2 = August-September Sample Period 3 = October-November
39
Table 4. Mean pH values recorded at the seagrass survey sites in the Barnegat Bay-Little
Egg Harbor Estuary during three sampling periods in 2008.
Sample Period pH Standard Deviation 1 8.09 0.20 2 7.95 0.27 3 8.00 0.15
Sample Period 1 = June-July Sample Period 2 = August-September Sample Period 3 = October-November
40
Table 5. Mean Secchi depth (m) recorded at the seagrass survey sites in the Barnegat
Bay-Little Egg Harbor Estuary during three sampling periods in 2008 when the Secchi
was not unlimited.
Sample Period Secchi
(meters) Number of Samples
Standard Deviation
1 1.21 20 0.26
2 1.09 29 0.21
3 1.28 41 0.41
Sample Period 1 = June-July Sample Period 2 = August-September Sample Period 3 = October-November
41
Table 6. Nutrient values recorded in the seagrass survey areas of the Barnegat Bay-Little
Egg Harbor Estuary during the June to November study period in 2008.1
Sample Period NO3- plus NO2
- Number of Samples Standard Deviation
1 0.20 48 1.42
2 0.04 48 0.10
3 0.32 48 0.44
Sample Period NH4+ Number of Samples Standard Deviation
1 0.30 48 0.46
2 0.72 48 0.78
3 1.48 48 1.23
Sample Period TDN Number of Samples Standard Deviation
1 12.73 48 2.10
2 15.72 48 3.99
3 16.50 48 2.83
Sample Period PO4 Number of Samples Standard Deviation
1 0.73 48 0.41
2 0.77 48 0.36
3 0.78 48 0.20
Sample Period Si Number of Samples Standard Deviation
1 8.51 48 6.86
2 13.06 48 11.50
3 22.00 48 18.08
1Nutrient values in µM
42
Table 7. Mean aboveground and belowground biomass of Zostera marina in the Barnegat
Bay-Little Egg Harbor Estuary during the June-November 2008 period. 1
Species Sample Period Aboveground Belowground Number of
Shoots
Biomass Biomass
Z. marina 1 25.01 (67.32) 81.31 (166.87) 239(436)
Z. marina 2 30.83 (41.92) 76.12 (93.88) 466(585)
Z. marina 3 22.91 (44.56) 39.86 (55.36) 297(483)
Sample Period 1 = June-July Sample Period 2 = August-September Sample Period 3 = October-November 1Nutrient values in g dry wt m-2 Standard deviation values in parentheses
43
Table 8. Analysis of Variance (ANOVA) and Tukey test for aboveground biomass of
Zostera marina during three sampling periods in 2008.
ANOVA F-Value ANOVA P-Value
0.48 0.6189
Kruskal-Wallis Chi-Square Pr > Chi
4.32 0.12
Tukey Grouping N Sample Period A 80 1 A 80 2 A 80 3
Sample Period 1 = June-July Sample Period 2 = August-September Sample Period 3 = October-November
44
Table 9. Median aboveground and belowground biomass of Zostera marina in the
Barnegat Bay-Little Egg Harbor Estuary during the June-November 2008 period. 1
Species Sample Period Aboveground Belowground
Biomass Biomass
Z. marina 1 0 0 Z. marina 2 12.49 27.21 Z. marina 3 2.67 2.26
Sample Period 1 = June-July Sample Period 2 = August-September Sample Period 3 = October-November 1Values in g dry wt m-2
45
46
Table 10. Mean aboveground and belowground biomass of Zostera marina
along 12 sampling transects in the Barnegat Bay-Little Egg Harbor Estuary