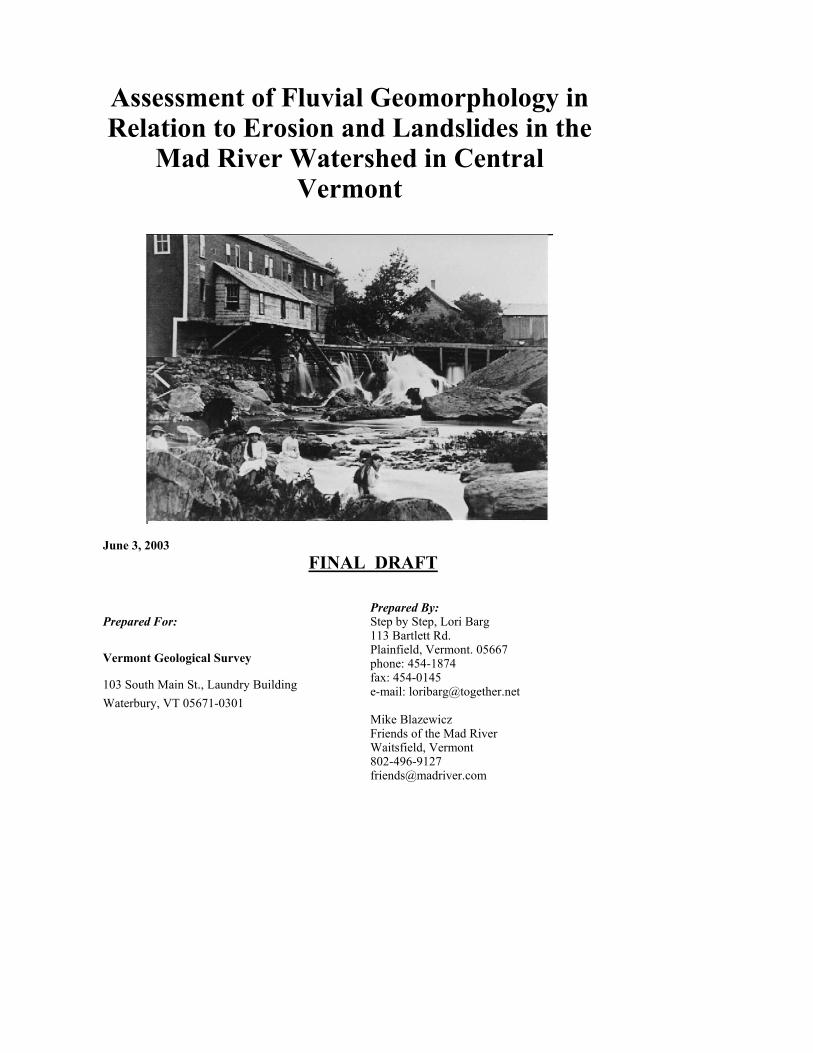
Assessment of Fluvial Geomorphology in Relation to Erosion and Landslides in the Mad River Watershed in Central Vermont June 3, 2003 FINAL DRAFT Prepared For: Vermont Geological Survey 103 South Main St., Laundry Building Waterbury, VT 05671-0301 Prepared By: Step by Step, Lori Barg 113 Bartlett Rd. Plainfield, Vermont. 05667 phone: 454-1874 fax: 454-0145 e-mail: [email protected]Mike Blazewicz Friends of the Mad River Waitsfield, Vermont 802-496-9127 [email protected]
Transcript
Assessment of Fluvial Geomorphology in Relation to Erosion and Landslides in the
Mad River Watershed in Central Vermont
June 3, 2003 FINAL DRAFT Prepared For:
Vermont Geological Survey
103 South Main St., Laundry Building Waterbury, VT 05671-0301
Prepared By: Step by Step, Lori Barg 113 Bartlett Rd. Plainfield, Vermont. 05667 phone: 454-1874 fax: 454-0145 e-mail: [email protected] Mike Blazewicz Friends of the Mad River Waitsfield, Vermont 802-496-9127 [email protected]
FINAL DRAFT JUNE 3, 2003
2
Research supported by the Vermont Geological Survey, Dept. of Environmental Conservation and the U.S. Geological Survey, National Cooperative Mapping Program, under assistance Award No. 02HQAGOO49. The views and conclusions contained in this document are those of the author and should not be interpreted as necessarily representing the official policies, either expressed or implied, of the U.S. Government or the State of Vermont.
FINAL DRAFT JUNE 3, 2003
3
Acknowledgments We’d like to thank the volunteers with the Friends of the Mad River who walked miles of stream, endured training in the rain, wet feet and did a terrific job assessing the physical characteristics of their streams. The knowledge that the volunteers brought was invaluable to this study - living along a stream for a long period of time gives one a great perspective on how rivers change. Volunteers included Mike Hoffman Kari Dolan, Ned Kelley, Ken Felderman, Elizabeth Walker ,Bridget Butler, Jim Siriano, Susan Ensalada, Wendy Cox, Shannon Hill, Steve Putlik, Patti Greene-Swift, Richard and Ginger Hiscock, Clark Amadon, Phil Huffman, Kathy Krier, Deb Kirchwey, Ryland and Jill Swenderman, Liz Tabor, John Summers, Dorothy Tod, and Ann Day. Town personnel from Moretown, Waitsfield and Warren especially Wayne Kathan, Mike Ricker and Craig Elwell who took Lori on a watershed tour to see areas where flood damage have occurred, and offered their perspective on reasons for damage, and types of damage. Earline Marsh and John Malter provided invaluable aid in acquiring historical information and photos. Kathy Donna and Dan MacKinley of the Green Mountain National Forest. Mary Nealon of Pioneer Environmental, Jason Lisai of Sugarbush, Mike Mayo of Mountain Water System, and Ellen Sivret of the Natural Resource Conservation Service provided background data. Lyle Steffen of the Natural Resource Conservation Service performed the flood frequency analysis. Fred Spencer, weather observer for Waitsfield graciously provided 48 hour precipitation totals during significant floods. Staff of the Vermont Agency of Natural Resources River Management Division including Shannon Hill, Mike Kline and Shayne Jaquith who worked on the Phase !, II and III protocols. This job couldn’t have been done without them. Sandy Reider Bill Warnock and Marcus Pante who paddled the lower part of the river and helped look for mass failures, bedrock control and other stream features that made the paddling interesting. Thanks to George Springston who overlaid the orthophotos over time, Rick Dunn, and Fiona Johnstone of Norwich University and Nathan Donahue for mapping bedrock and stream features while they were mapping surficial geology. And last, but not least, special thanks to Larry Becker of the Vermont Geological Survey for the support of this project. “Water is H20, hydrogen two parts, oxygen one part, but there is a third thing that makes it water and nobody knows what that is” –D.H. Lawrence Thanks to Earline Marsh, historian, writer, poet, for the following:
"One wonders where Mad River got its name. William Strong, the surveyor of the town, called it by its present name in his field notes of 1788, and one guesses that his party gave the name because of some unhappy experience with its uncertain habits."
Matt Bushnell Jones, 1909, History of Waitsfield, 1782-1908
"Mad River received its name doubtless from the fact that -- the mountains being so near and steep -- the surplus water is almost immediately thrown off into the brooks, and by them poured out into the river, which of course rises like sudden anger overflowing its banks and
FINAL DRAFT JUNE 3, 2003
4
devouring them at will." Vermont Gazetteer, Abby Maria Hemenway, 1882
FINAL DRAFT JUNE 3, 2003
5
TABLE OF CONTENTS Abstract ............................................................................................................................................1 Introduction .....................................................................................................................................2 Section 1.0 Background Data .............................................................................................................3
1.1 Description Of the Mad River Watershed ...........................................................................3 1.2 Bedrock..................................................................................................................................... 5 1.3 Surficial Geology...................................................................................................................... 5 1.4 Soils .......................................................................................................................................... 6 1.5 Geomorphology ........................................................................................................................ 6 1.6 Hydrology ................................................................................................................................. 7 1.7 Small Stream Hydrology......................................................................................................... 11 1.8 Orographic Influence and Storm Tracks.................................................................................. 11 1.9 Human Influence...................................................................................................................... 12 1.10 Road Impacts ......................................................................................................................... 13 1.11 Landslide History................................................................................................................... 13 1.12 Flood Damage History........................................................................................................... 13 1.13 Cost of Flood Damage ........................................................................................................... 15
Section 2.0 Methodology ........................................................................................................................... 18 2.1 Data Review............................................................................................................................. 18
Section 3.0 Summary of Previous Studies .................................................................................................. 19 3.1 ANR Cross-Sectional Study .................................................................................................... 19 3.2 Stream Sedimentation ............................................................................................................. 19
3.2.1 Brook Trout Study ................................................................................................... 20 3.2.2 Effects of Logging Practices.................................................................................... 20
3.3 Salamander Study .................................................................................................................... 20 3.4 Summary of Existing Data: Bridges ........................................................................................ 21 Section 4.0 Volunteer Involvement ............................................................................................................ 25 Section 5.0 Methodology: Field Assessment............................................................................................. 26
5.1 Data Presentation ..................................................................................................................... 27 5.2 Pebble Counts .......................................................................................................................... 28
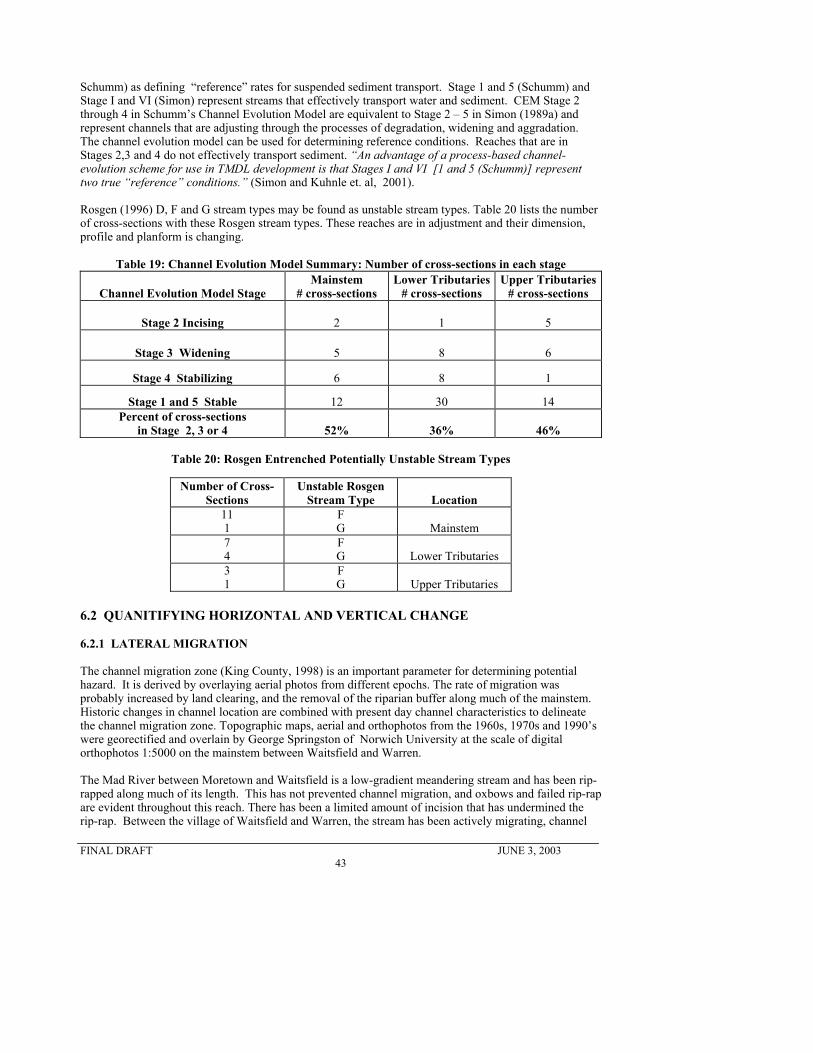
Section 6.0 Summary Of Results: .............................................................................................................. 29 6.1 Results of Quantitative Geomorphic Assessments ................................................................. 29 6.1.1 Hydraulic Geometry.............................................................................................................. 29 6.1.2 Channel Evolution Model / Stream Type ............................................................................. 34
Section 6.2 Results of Quantitative Geomorphic Assessments................................................................... 35 6.2 Quantifying Horizontal And Vertical Change ......................................................................... 35
6.2.1 Lateral Migration - Channel Migration Zone ....................................................................... 35 6.2.2 Vertical Degradation and Grade Control ............................................................................. 36 6.3 Pebble Counts .......................................................................................................................... 39 6.4 Channel Constriction with Infrastructure................................................................................. 39
Section 8.0 Discussion of Results.............................................................................................................. 43 Section 9.0 Results: Volunteer Data ........................................................................................................... 47
9.1. Results: Volunteer Data vs. Professional Data ....................................................................... 47 Section 10.0. Discussion ............................................................................................................................. 49
10.1.1 Discussion of Methodology ................................................................................................ 49 10.2 Discussion of Results............................................................................................................ 50 10.2.1. Quantitative Studies ........................................................................................................... 50
10.3 Physical Features .................................................................................................................. 55 10.3.1 Number, Length and Height of Mass Failures....................................................... 55 10.3.2 Channel Migration Zone/ Alluvial Fans ............................................................... 56 10.3.3 Channel Avulsions................................................................................................. 57 10.3.4 Headcuts................................................................................................................ 57
10.3.5 Flood History ...................................................................................................................... 58 10.4 Human Impact....................................................................................................................... 58
10.4.4 Qualitative Assessments .................................................................................................... 59 Section 11.0: Geologic/Geomorphic Sensitivity......................................................................................... 61 Section 12.0 Future Studies ........................................................................................................................ 62 Section 13.0 Conclusions............................................................................................................................ 63 References................................................................................................................................................... 65 List Of Tables Table 1: Tributary Drainage Area, East and West Side................................................................................ 7 Table 2: Percent Channel Slopes of Tributaries............................................................................................ 7 Table 3: Exceedance Flows and Mean Annual Flows in CFSM .................................................................. 8 Table 4: Historic and Recent Flood Frequency Information, Mad River watershed.Station 4288000......... 9 Table 5: Natural Stream Flow and Diversion Flows in CFS from Sugarbush.............................................. 9 Table 6: Percentage Change in Flow Compared to pre-1940?? Record ....................................................... 9 Table 7: Historical Floods........................................................................................................................... 10 Table 8: Mainstem Reaches With Historical Gravel Mining...................................................................... 12 Table 9: Flood Costs By Town ................................................................................................................... 16 Table 10: Surveyed Cross Sections 1987 – 1998, Reach M10 ................................................................... 19 Table 11: Change in Thalweg Elevation..................................................................................................... 19 Table 12: Exceedance of Turbidity Standards from Logging in Mad River Watershed............................. 20 Table 13: Salamander Summary, Paired Watershed Analysis .................................................................... 21 Table 14: AOT Bridge Scour Database ...................................................................................................... 21 Key to Table 14: ........................................................................................................................... 23 Table 15: Summary USGS Bridge Scour Studies Shepard Brook, Vermont.............................................. 24 Table 16: Field Indicators of Stability Used by Geomorphologists............................................................ 27 Table 17: Summary Of Width/Depth Ratios............................................................................................... 30 Table 18: Mad River Channel Dimensions: USGS/ANR ........................................................................... 33 Table 19: Channel Evolution Model Summary: Number of cross-sections in each stage .......................... 35 Table 20: Rosgen Entrenched Potentially Unstable Stream Types............................................................. 35 Table 21: AOT Survey Of Degradation in the Mad River Valley .............................................................. 35 Table 22: Results of Rapid Geomorphic Assessment; Number of Reaches by Category........................... 41 Table 23: Results of RGA, Methods of Adjustment for reaches with scores <0.64 (fair/poor) ................. 42 Table 24: Summary Of Physical Features................................................................................................... 44 Table 25: Flood Plain Encroachment with development within the flood plain......................................... 45 Table 26: Tributary reaches with >3 bridge or culvert crossings................................................................ 45 Table 27: Headcuts or Steep Riffles ........................................................................................................... 46 Table 28: Summary of Volunteer data, Number of Reaches and Ranking ................................................. 47 Table 29: Parameters Selected for Determining Erosion Potential............................................................. 50
FINAL DRAFT JUNE 3, 2003
7
Table 30: Road Density of Small Watersheds .......................................................................................... 56 List Of Figures Figure 1: Watershed Map.............................................................................................................................. 4 Figure 2: Paired Watershed Comparison, Stowe ........................................................................................ 11 Figure 3: 1897 Fayston Landslide............................................................................................................... 14 Figure 4: Mainstem Width/Depth Ratio...................................................................................................... 30 Figure 5: Tributary Width/Depth Ratio ...................................................................................................... 30 Figure 6: Over-widened Tributaries............................................................................................................ 31 Figure 7: Over-widened Mainstem Reaches ............................................................................................... 31 Figure 8: Entrenchment Ratio: Mainstem................................................................................................... 32 Figure 9: Entrenchment Ratio: Tributaries ................................................................................................. 32 Figure 10: Mad River Basin Hydraulic Geometry...................................................................................... 34 Figure 11: Third Branch of the White River: Hydraulic Geometry............................................................ 34 Figure 12: Survey and Photos of bridge ..................................................................................................... 37 Figure 13: Pebble Count: Three watersheds ............................................................................................... 39 Figure 14: Comparison of Bridge/Culvert and Bankfull Width.................................................................. 40 Figure 15: Comparison of Length of Maximum Span and Bankfull Width (AOT database)..................... 40 Figure 16: Mainstem Rapid Geomorphic Assessment and Rapid Habitat Assessment Summary.............. 41 Figure 17: Tributaries Rapid Geomorphic Assessment and Rapid Habitat Assessment Summary ............ 42 Figure 18: Comparison of Volunteer and Professional RGA ..................................................................... 48 Figure 19: Pond upstream of Lovers Lane Dam, pre-1927 flood ............................................................... 52 Figure 20: Sediment Plume from breached pond, 2001.............................................................................. 59 List Of Appendices Appendix A-Flood Damage History FEMA, NRCS Appendix B: Landslide and Flood History Appendix C: Dam sites Appendix D-Summary of Stream Geometry Appendix E-Volunteer Field Forms Appendix F-Field Forms Appendix G-Feature Photos Appendix H-Cross-Section Photos Appendix I-GIS Point Data Appendix J -Phase II Results Appendix K-Phase I Results Appendix L-Volunteer Assessment Results Appendix M – Discussion on Methodology
FINAL DRAFT JUNE 3, 2003
8
Assessment of Fluvial Geomorphology in Relation to Erosion and Landslides in the
Mad River Watershed in Central Vermont Final Report Lori Barg, Mike Blazewicz
June 3, 2003
FINAL DRAFT JUNE 3, 2003
9
ABSTRACT From Granville to Moretown, the 144 sq. mi. watershed of the north flowing Mad River was assessed for geologic, geomorphic and geo-fluvial characteristics that contribute to stream stability and instability. The results can be used to prepare maps delineating risk from fluvial erosion and slope instability in part of the Towns of Warren, Waitsfield, Duxbury, Fayston and Moretown. The Mad River basin is flanked by the Green Mountains to the west and the Northfield Mountains to the east. The Mad River parallels these north-south trending ranges. Bedrock outcrops provide grade control along the length of the mainstem including bedrock gorges downstream of and in the Village of Moretown, the village of Warren and upstream of Warren to the Granville Gulf. In the lower 16 miles of mainstem, there are 14 locations with channel-spanning bedrock control. This has limited, but not prevented incision of between 3 – 6 feet along several reaches of the mainstem. South-flowing Glacial Lake Granville (elev. 1410’) and Glacial Lake Winooski (elev. 920’) and north-flowing glacial Lake Mansfield (750’) occupied the Mad River Basin. Glacio-lacustrine deposits are found in the tributaries in the northern part of the basin to an elevation of 950 ft. The highly erodible glacio-lacustrine deposits have made the tributaries more sensitive to disturbance from land use change (Clay Brook) or clear cutting (Dowsville Brook). The highest concentrations of mass failures are on Clay Brook and Stetson Brook in the upper watershed. Increased sediment loading from mass failures is contributing sediment to the lower basin. Changes in hydrology are associated with upland development and a dense road network. Road density in the watershed is 2.1 miles of road per square mile, while the stream density is 0.97 miles per square mile. Watersheds less than 10 sq. mi. in diameter are adjusting their dimension, plan and profile. The highest concentration of over-widened or degrading streams is found in the upper tributaries. Three-quarters of the cross-sections surveyed on the mainstem in the lower watershed (drainage areas greater than 55 sq. mi.) have an entrenchment ratio less than 2.2 indicating lack of access to the floodplain during bankfull flows. Lowering of the elevation of 3 – 6 feet on the mainstem has been documented since 1938 in one location. Much of the length of the mainstem between Waitsfield and Moretown has been hard armored. 99 Rapid geomorphic assessments were completed during the 2002 field season. Volunteers completed an additional 39 assessments on 44 miles of 14 tributaries. Information collected by volunteers was used to support professional assessment of the watershed, and to test a river assessment protocol under development by the Vermont Agency of Natural Resources (ANR). The mainstem was divided into “Like Reaches” according to the Phase I ANR protocols based on geology, channel slope, valley confinement and stream type. Aerial photos from different epochs were used to map channel migration zones. Historical data from the 1927, 1973 and 1998 floods were used to locate areas of previous flood damage. Data is presented as point data that can be incorporated into a geographic information system (GIS). There were 94 mass failures in the watershed, 87 of these were located on the tributaries and 7 on the mainstem. 51-52 of the 99 sites surveyed showed changes in planform with channel avulsions or cut-off chutes within the reach. Approximately 30% (5.4 miles out of 17.7 miles) of the streambanks that were surveyed in detail were eroding. The majority of the mainstem, between Waitsfield and Moretown has been hard-armored after the 1973 and 1976 floods, and 12 tributaries were either straightened or dredged. In-stream ponds have breached during the 1998 flood on Clay and Lincoln Brooks, and the snow-making pond adjacent to the mainstem breached in 1995, 1998 and 2001. Large mainstem dams were breached during the flood of 1927 and not re-constructed at Lovers Lane, an upper and lower dam in Moretown Village and in Waitsfield. Selected parameters from the study can be used to define riverine erosion hazard areas. Data gathered includes quantitative changes in channel dimension, geomorphic features such as channel avulsions, mass
FINAL DRAFT JUNE 3, 2003
10
failures, rapid lateral migration, vertical incision, and areas impacted by human development including undersized bridges and culverts, and flood plain encroachment. INTRODUCTION Quantitative cross-sectional and slope measurements and qualitative assessments of fluvial geomorphic adjustment processes were used to assess the mainstem and tributaries of the Mad River which flows north from Warren, Vermont, to join the Winooski River in Moretown, Vermont. Lori Barg of Step by Step and Mike Blazewicz of the Friends of the Mad River, a local watershed association, George Springston and Rick Dunn of Norwich University and Nathan Donahue who completed the field work. Thirty volunteers with the Friends of the Mad River were trained in river assessment as part of a pilot project of the Vermont Agency of Natural Resources to test protocols for the collection of fluvial geomorphic data. The study consisted of:
• Collecting and reviewing existing data including cross-sectional and profile data. • Training volunteers with the Friends of the Mad River in a pilot project using a modified version
of the Phase II Vermont Agency of Natural Resources (ANR) draft protocols on collection of Fluvial Geomorphic Data (ANR and Barg 2001b), identifying and plotting selected stream features on topographic maps and documenting them with photos, and conducting a bridge and culvert assessment developed for this study. Volunteers walked 44 miles of stream and completed 39 assessments on 14 tributaries.
• Assessing most reaches using an expanded version of the ANR Phase II and III protocols (ANR, 2002) a bridge and culvert assessment developed for this study, and dividing some Reaches into segments on the basis of field investigation.
• Walking or surveying 40+ miles of the tributaries and walking or paddling 27 miles of the mainstem from Waitsfield to the confluence with the Winooski.
• Detailed cross-sectional assessments were completed on 99 reaches totaling 17.7 miles of tributary and mainstem. Reaches surveyed were 12-20 bankfull widths in length.
• Windshield surveys of the watershed were undertaken with Wayne Kathan, Mike Ricker and Craig Elwell, road commissioners from Warren, Waitsfield and Moretown.
Most of the field work was completed between May and September of 2002. This was a drought year, and conditions in the later part of the summer were at low water levels.
FINAL DRAFT JUNE 3, 2003
11
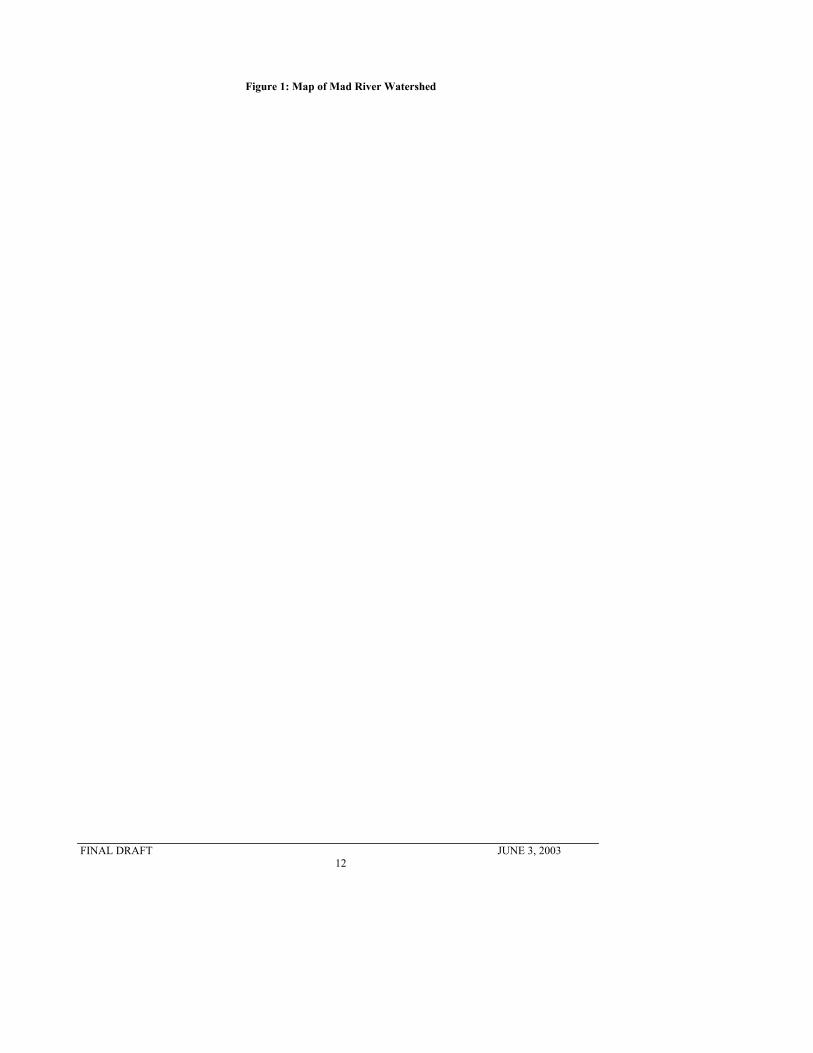
SECTION 1.0 BACKGROUND DATA 1.1 DESCRIPTION OF THE MAD RIVER WATERSHED The Mad River watershed is located in Addison and Washington Counties in central Vermont (Figure 1). It encompasses parts of the towns of Duxbury, Fayston, Granville, Moretown, Roxbury, Waitsfield, Warren, and very small portions of Buels Gore and Huntington and is shown on the Huntington, Lincoln, Middlesex, Mount Ellen, Northfield, Warren, Waitsfield, and Waterbury 7.5 minute quadrangles. The Mad River drains an area of 144 square miles and has a channel length of approximately 26 miles with an average gradient of 0.5%. At Moretown the Mad River empties into the Winooski River, which flows northwest to Lake Champlain. The Mad River watershed contains the named tributaries of Welder (4.2 sq. mi.), Dowsville (9.5 sq. mi.), Shepard (17.3 sq. mi.), Pine (4. sq. mi.), High Bridge (4 sq. mi.), Mill (19.3 sq. mi.), Slide (6.3 sq. mi.), Chase, (2.1 sq. mi), Folsom (7 sq. mi.), Clay (5.9 sq. mi.), Rice (1 sq. mi.), Bradley (2.5 sq. mi.), Freeman (6.5 sq. mi.), Lincoln (7.7 sq. mi.), Stetson (4.9 sq. mi.), Austin (4.9 sq. mi.) and other un-named tributaries. The total stream length in the watershed is 140 linear miles as measured using Geographic Information Systems (GIS) with a drainage density of 0.97 miles per square mile. The total road length is 297 miles with a road density of 2.1 miles per square mile. The watershed is located in the Green Mountains physiographic province of Jacobs (1950) and is within the Hudson-Green-Notre Dame highlands physiographic province of Denny (1982). The highest point in the watershed is the summit of Mount Ellen at 4083 feet in the Green Mountains to the west, and Adams Mountain, elevation 3214 feet, to the east in the Northfield Mountains. The watershed is approximately 83% forested and 8% agricultural. Roads, paved areas and commercial operations make up the remaining 2% of the watershed (Vermont Center for Geographic Information Land Cover/Land Use figures derived from 1991 to 1993 Landsat imagery) Residential, paved, and “urban’” land, is found throughout the watershed, with upland resort development in the vicinities of the Sugarbush and Mad River Glen ski areas on the western side of the watershed.
FINAL DRAFT JUNE 3, 2003
12
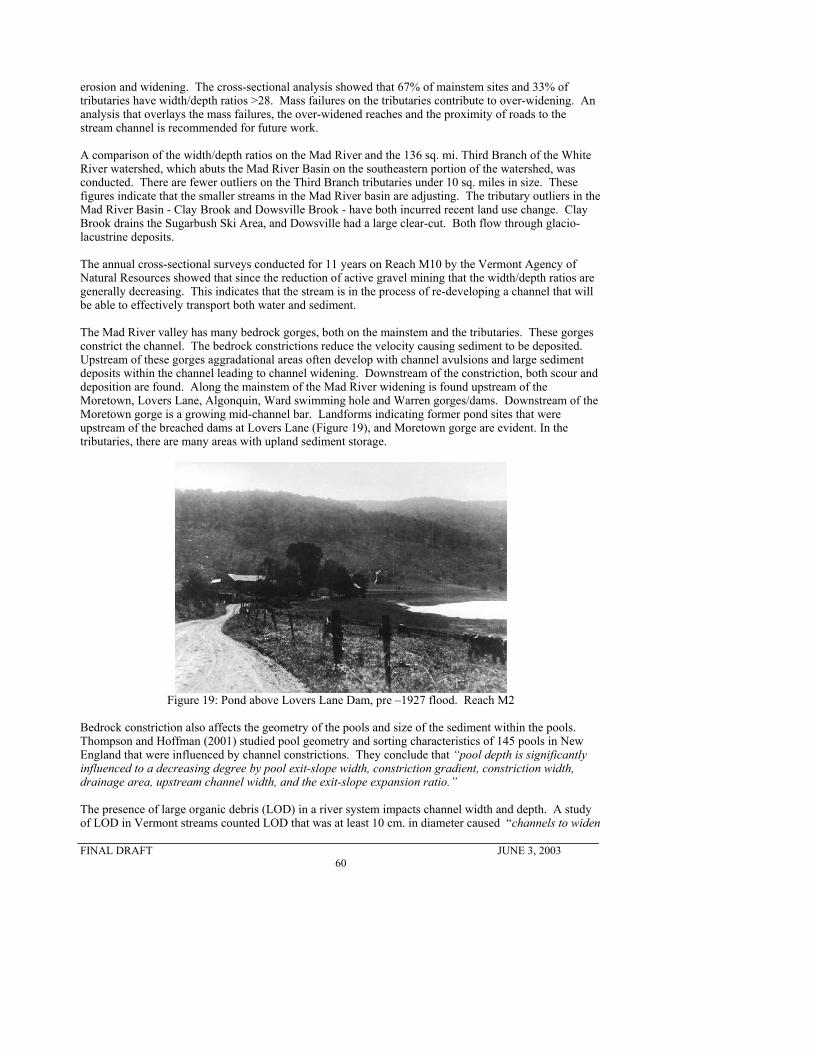
Figure 1: Map of Mad River Watershed
FINAL DRAFT JUNE 3, 2003
13
1.2 BEDROCK The bedrock has been mapped in detail by Walsh (1992), Walsh and others (1995), and Stanley and others (1995). The bedrock in the watershed consists mainly of multiply deformed, metamorphosed clastic sedimentary rocks of the Hazens Notch, Fayston, Mount Abraham, Pinney Hollow, Ottauqueechee and Stowe Formations, with the units trending generally north-south following the strike of the Green Mountains. The rocks are Late Proterozoic to Cambrian in age. Most of the southeastern half of the watershed is underlain by the chlorite schists and greenstones of the Stowe Formation (Doll and others, 1961). In the northern half of the watershed, the Eastern Magnesia Talc Co. operated from 1913 to 1960 (Marsh). Numerous faults trend approximately north-south to northeast-southwest throughout the watershed. Bedrock provides grade control along most of the tributaries and the mainstem. In the 16 miles of mainstem upstream of the mouth, there are 14 sites with bedrock control (bedrock on both banks and bed of river), one active dam site (Algonquin) and three former dam sites in gorges are located at Lovers Lane and in Moretown Village. These dams were breached during the 1927 flood, a more complete list of dams is in Appendix C. Long gorges are located at Lovers Lane, Moretown, Warren Village, Warren falls and along the tributaries. 1.3 SURFICIAL GEOLOGY During the 2002 field season, surficial geology of the Mad River watershed was mapped by researchers from Norwich University. The uplands throughout the study area are mostly underlain by lodgement till deposited by the last ice sheet. According to the Surficial Geologic Map of Vermont (Doll, 1970), glaciofluvial kame terrace deposits are common in the upper reaches of the watershed while coarse and fine glaciolacustrine deposits are common in the lower reaches. Holocene alluvial deposits of gravel, sand, and silt are common along the streams. Based on striation and indicator fan data, the ice movement directions during the last glaciation was predominantly toward the south-southeast although striations on the crest of the Green Mountains and locally within the Mad River Valley indicate a later phase of southwestward movement off of the spine of the Green Mountains into the Champlain Valley (Larsen, 1987a and Ackerly and Larsen, 1987). The closest indicator fan to the Mad River Valley is that of the Braintree Pluton, which clearly shows a south-southeast trend (Larsen, 1987a). Several glacial lakes occupied the watershed, the high level south-flowing Glacial Lake Granville (elev. 1410’), and Lake Winooski (elev. 920’) and the north-flowing glacial Lake Mansfield (elev. 750’). Using the deglaciation chronology of Ridge and others (1999), the southern margin of the Laurentide Ice Sheet retreated into the study area by about 12,000 Carbon 14 years before present. As the ice retreated, the Mad River Valley was filled with the waters of a proglacial lake, named Lake Granville by Larsen (1972). The discussion of lake levels which follows is based on Larsen (1972) and Larsen (1987b). This lake drained southward through Granville Gulf into the White River and to the Connecticut. The present-day elevation of the spillway is approximately 1410 feet. Exposures of lake-bottom clays are found in the southern part of the watershed on Stetson Brook, Bradley Brook, Clay Brook and others. As ice retreat continued, this lake joined with other proglacial lakes in the valleys to the north and east to form glacial Lake Winooski. This new lake drained southward into the valley of the Third Branch of the White River through Williamstown Gulf at a present elevation of about 920 feet elevation. The Williamstown Gulf spillway is located about 15 miles east of the Mad River Valley. Thus, waters flowing into the Mad River had to flow northward to the Winooski Valley, then eastward along that valley, then south ward through the valley of the current Stevens Branch. Further retreat of the ice margin toward the Champlain Valley led to the formation of Lake Mansfield, formed by the coalescence of proglacial lakes filling the tributary valleys of the Winooski. This lake drained into glacial Lake Vermont through a spillway at Gillett Pond in Huntington (present elevation 750 feet). A later stage of
FINAL DRAFT JUNE 3, 2003
14
Lake Mansfield at an even lower elevation led to the final draining of the arm of the lake which had filled part of the Mad River Valley. In the time since the retreat of lake waters from the valley, the Mad River and its tributaries have reworked the glacial, glaciofluvial, and glaciolacustrine deposits, resulting in alluvial fans at tributary mouths and numerous abandoned stream terraces. Meanwhile, isostatic rebound has led to a tilting of the old lake shorelines so that they rise approximately 4.74 ft/mile to the N 21.5 degree W (Larsen 1987b). Ice contact deposits are found on Mill, Shephard, Dowsville, Clay, Welder, Rice, Doctors, Folsom, Freeman, and Pine Brooks (Doll, 1970). Laminated clays are found at elevation ~1400 ft elevation in Stetson, Bradley and Freeman Brooks, and ~1010 ft. at Dowsville Brook. The Dowsville brook deposit is from a high-level glacial lake. Near the mainstem, laminated clays are found near Shephard Brook. 1.4 SOILS The Mad River basin is primarily comprised of four soil complexes. The Hogback-Rawsonville-Houghtonville series are found in the mountains above elevations of 1700 feet. These soils form on steep to very steep slopes in loamy glacial till along mountain ridges. The hill-slopes primarily have the Colonel-Tunbridge-Lyman Series. These soils form in friable to compact loamy glacial till. In the valley bottoms in the headwaters are the Colton-Buxton-Salmon series that form on sandy glaciofluvial and loamy glaciolacustrine deposits. And in the lower basin is the Elliotsville-Monson-Abram series that forms in loamy glacial till. Soil formation is dependent on both the bedrock and the surficial geology. Tributaries with high elevation (upstream of the first reach) hydrologic group A soils include Clay, Rice, Mill, Freeman, Doctors and Welder Brooks. Most of the mainstem flows through Hydrologic Group B soils. Hydrologic Group A soils have high permeability with high infiltration and low runoff grading through to Hydrologic Group B soils which have high runoff and low infiltration (SCS, 1978). 1.5 GEOMORPHOLOGY The Mad River valley is flanked by the Green Mountains on the west and the Northfield Mountains to the east and parallels the dominant north-south trend of these mountain ranges. The tributaries trend east-west, roughly perpendicular to the mountains and cross-cutting numerous geologic formations. The drainage pattern is a combination of both subdendritic and directional trellis, with the first order streams showing a directional trellis pattern of roughly parallel first order streams that join the next stream at a relatively perpendicular angle. The trellis pattern is found in “dipping and folded metamorphic rocks, areas of parallel fractures and exposed lake or sea floors” (Bloom, 1978). The drainage density throughout the watershed is 0.97 stream miles per square mile of drainage area. Drainage density was calculated using a GIS surface water layer developed from 1:5000 series orthophotos. 73.4% of the basin is above 1,200 foot elevation and 0.047% of the basin is pond storage (Olson, 2002). The largest tributaries flow off the Green Mountain range. The watersheds draining the Green Mountains on the western side of the watershed are almost three times as large as the tributaries draining the Northfield range (Table 1). Median channel slopes draining the Green Mountains are steeper with an average channel slope of 7.5% as compared to 5.4% draining the Northfield range (Table 2). Precipitation increases with elevation, on average about eight inches per one thousand feet on an annual basis (Dingman, 1981). In the mountains, more precipitation falls as snow which delays and increases
FINAL DRAFT JUNE 3, 2003
15
spring runoff. Mountain streams have steep slopes and relatively thin soils. This leads to rapid delivery of water to the stream channels. The streams are generally ‘flashy’ and respond quickly to precipitation. The deeper soils in the watersheds with coarse lacustrine deposits likely provide more base flow than the watersheds that have shallow soils and shallow till. Alluvial fans form when the stream loses its capacity to transport sediment at a break to shallower slopes. This can occur near the mouth of the tributaries, as well as other locations higher in the tributary. Multiple channels typically occur on top of alluvial fans.
Table 1: Tributary Drainage Area, East and West Side Western
Tributaries Drainage Area
(sq. mi) Eastern
Tributaries Drainage Area
(sq. mi) 17 tributaries on west side. Total DA 95.4
13 tributaries on east side. Total DA 35.1
Drainage Area Of 3 Largest Tributaries Green Mountains
(n=22) Median 7.5 5.4 Mean 7.6 5.7 Low 1.5 1.7 High 13.7 13.9
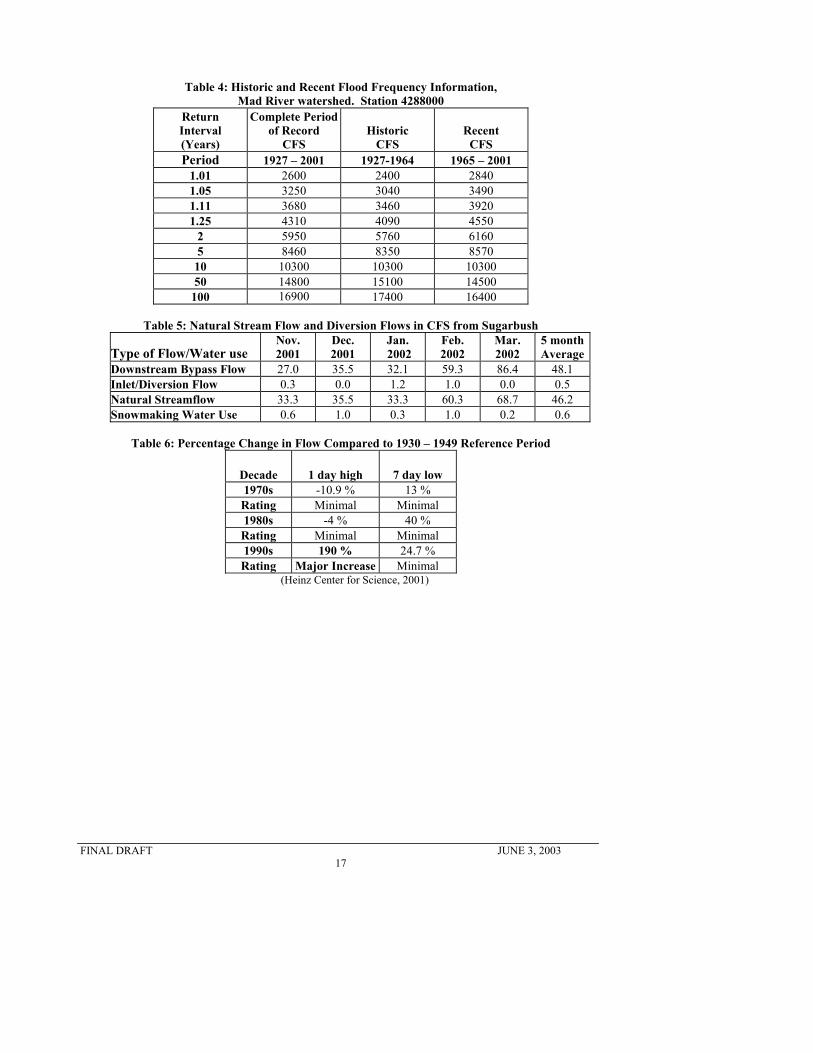
1.6 HYDROLOGY The United States Geological Survey (USGS) has maintained a gage on the mainstem since 1928. Exceedance flows and mean annual flows for the Mad River gage are summarized in Table 3. Flood frequency from the USGS is summarized in Table 4. The bankfull, or channel forming flows, are the flows that move the most sediment (Leopold, 1973). These flows typically recur on an interval of 1.25 – 2 year frequency return period, but in urbanized watersheds can be more frequent. An analysis of the return frequency flow was done by dividing the period of record in two to analyze the historic (1927 – 1964) and recent periods (1965 – 2001) (Steffen, 2002). Each half contains over 30 years of hydrologic record, which provides a reliable data set. The record was divided to see if there has been a change in bankfull flows as land use within the watershed changed. Ski areas and upland housing development have increased in the watershed since the 1960s. Table 4 shows that more frequent flows (<2 year return period) have increased approximately 7 % during the second half of the gage record. Since 1998, the Sugarbush Ski area has gaged the mainstem of the Mad River from November through March at a weir by their snow-making withdrawal pond. The snow-making pond is adjacent to the mainstem downstream of the confluence with Clay Brook. The pond diverts water from the mainstem into the pond, which is then pumped up the mountain to be used for snow-making. The drainage area of the Mad River at the weir adjacent to the snow-making pond is 46 sq. miles. The snow-making constitutes
FINAL DRAFT JUNE 3, 2003
16
an out-of-basin transfer to the small tributaries including Clay, Chase, Slide, Lockwood and Rice Brook which drain Sugarbush. An out-of-basin transfer is an augmentation of the flow when water is taken from one watershed and moved to another watershed. In 2001, snow-making used an average of 0.6 cfs from November through March (Table 5). This site was not gaged prior to the construction of the weir and snow-making pond. A recent statistical analysis of USGS records nationwide shows an increase in flow of the 1 day peak flow (Table 6) on the Mad River gage during the decade of the 1990s (Heinz Center for Science, 2002). The peak flows recorded by the USGS from 1927 to 2001 show that of the 10 largest floods there were three in the 1970’s, two in the 1980’s and two in the 1990’s (Table 7). The increase found by the Heinz Center analysis could be due to land use change, as large floods occurred in both the 1970’s and 1980’s. A study by the USGS of 400 gages from 1941 – 1999 found an increase in precipitation, due to a change in climate occurred around 1970, this has led to an abrupt increase, mostly in the eastern U.S., in low to moderate streamflow and a less significant increase in high streamflow (McCabe, 2002). There have been no systematic studies of groundwater in the Mad River basin. There are 5 community water supplies in Waitsfield, 10 in Warren, 4 in Fayston and 1 in Moretown. One of these systems, Mountain Water Co. uses both surface water and groundwater. Mountain Water serves the Sugarbush resort and Sugarbush Village. The surface water is pumped with 2 pumps from Clay Brook. The first pump delivers 150 gallons per minute (gpm) and on rare occasions the 2nd pump kicks in & delivers 200 gpm. The wastewater system can treat ~60,000 gpd which provides a limit that surface water withdrawal does not exceed (Mayo, 2003). Bedrock fractures have not been studied, but fracture systems typically provide sources of groundwater that contribute to baseflow in the mountain streams, or may flow downslope to contribute groundwater to the lower basin.
Table 3: Exceedance Flows and Mean Annual Flows in CFSM
Mean Annual Flow
10% Exceedance
50% Exceedance
90% Exceedance
Drainage Area Sq.Mi.
1.9 4.2 0.99 0.28 139
Instantaneous peak Year of Peak 7q10
Average Annual Precipitation
(inches) Annual Runoff
(inches)
132.4 1938 0.11 48.6*
46.8** 25.6 USGS cubic feet per second per square mile = CFSM *(Waitsfield) ” 1970 – 2000 normal at elevation 1028 ** USGS 2002 Olson
FINAL DRAFT JUNE 3, 2003
17
Table 4: Historic and Recent Flood Frequency Information, Mad River watershed. Station 4288000
August, 28 - 29 1971 3.92 (5) 9270 67 June 30, July 1 1973 3.35 (5) 9300 67 August 10-11, 1976 2.88 (5) 13400 96 April 18, 1982 snowmelt 11100 80 March 30- 31, 1987 1.58 (5) 10800 78 January 19-20, 1996 1.51 (5) 10500 76 June 26-27, 1998 3.61 (5) 14500 98 Precipitation Data: (1)The Vermont Weather Book Ludlum 1996 (3) NOAA National Weather Service records for Northfield Station. (4) USDA Weather Bureau Monthly Weather Review. Vol. 55 #11. November 1927. p 496 - 497 Flow Data from USGS records (5) Waitsfield daily precipitation records. Fred Spencer, Weather Observer, Mountain View Inn
FINAL DRAFT JUNE 3, 2003
19
1.7 SMALL STREAM HYDROLOGY There are no small stream gages currently or historically monitored by the USGS in the Mad River watershed. Sugarbush ski area has measured water withdrawals for snow-making on Chase, Slide and Clay Brooks. Hydrologic comparisons should be limited to drainage areas that are between ½ - 2x the size of the drainage area being gaged (Dingman, personal communication). A paired watershed analysis is currently being conducted by the USGS (Shanley, 2002) on the east side of Mount Mansfield (~29 miles to the north of the Clay Brook watershed). Results are summarized in Figure 2 and show a significant increase in runoff from the West Branch of the Little River watershed which drains the ski trails on the Spruce Peak area of the Stowe Ski Area as compared to the forested Ranch Brook basin. Mean annual flows were 3.5 CFSM (cubic feet per second per square mile) from the West Branch, and 2.5 CFSM from the Ranch Brook basin. During most of the year, the mean monthly flows on the West Branch exceed the flows from the forested Ranch Brook. In the winter months compaction of the snowpack probably due to grooming lowered runoff in the West Branch watershed. The difference in runoff may be due to changes in precipitation due to micro-climatology as influenced by topography. A short-term study by a UVM student from August 10th to October 30th 2002 showed that in 1 rainstorm in September, 2002 a West Branch rain-gage received more precipitation than a Ranch Brook gage (Musselman, 2003).
PAIRED WATERSHED COMPARISON, USGS, STOWEOctober, 2000 - May 2002
050
100150200250300350400
OC
T
DE
C
FEB
APR
JUN
E
AU
G
ME
AN
MO
NTH
LY
MEA
N M
ON
THLY
FLO
W C
FSM
WEST BRANCH LITTLE RIVER, 4.57 SQ. MI.. 1400 FT. ELEV.
RANCH BROOK, 3.8 SQ. MI., 1240 FT. ELEV.
Figure 2: Paired Watershed Comparison, Stowe. Normalized flows in CFSM show higher runoff from West
Branch of the Little River, than forested Ranch Brook watershed. 1.8 OROGRAPHIC INFLUENCE AND STORM TRACKS Heavy flood damage occurred in the southwestern part of the watershed, particularly Granville Gulf, the town of Warren and Lincoln, Stetson and Clay Brooks during the summer 1998 flood. The mountains can influence this. Thunderstorms can form over mountains by convection off of a sunny slope. As the air rises, it is shifted by the winds and moved downwind, increasing the precipitation ‘downwind’ onto the opposite (east) slope (Hill, personal communication, 2002). The prevailing winds in the Green Mountains are from the west. Extreme rainfall events occur when
FINAL DRAFT JUNE 3, 2003
20
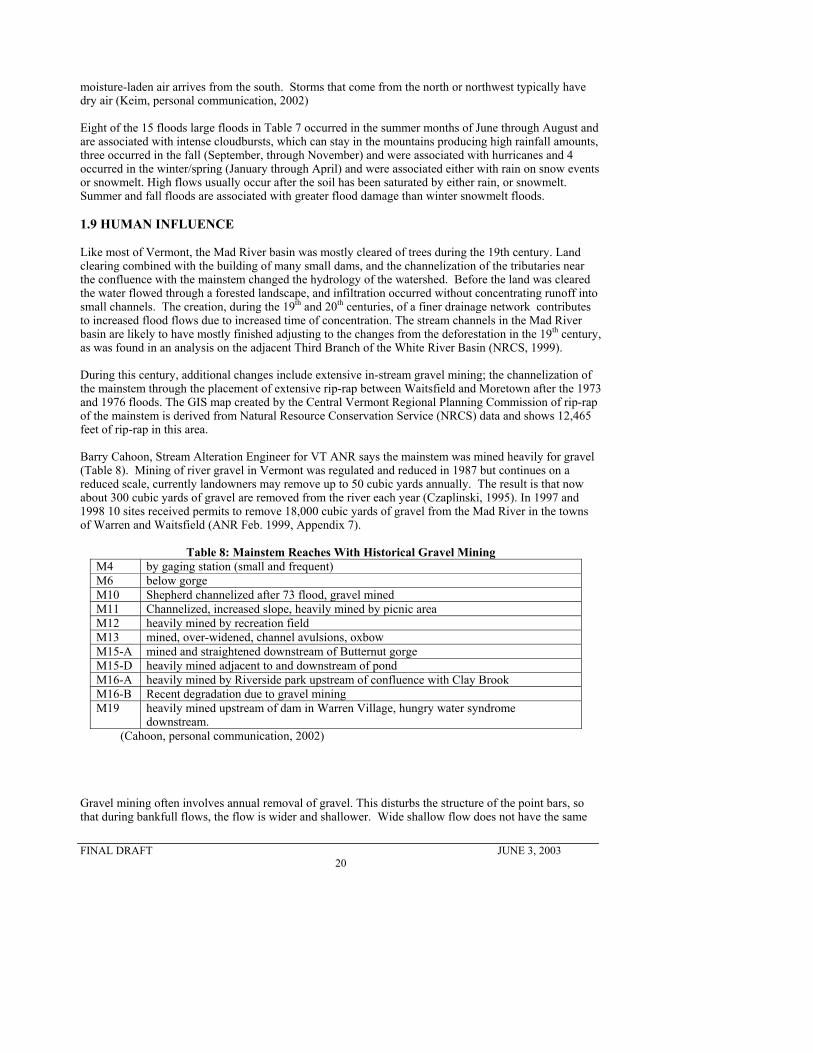
moisture-laden air arrives from the south. Storms that come from the north or northwest typically have dry air (Keim, personal communication, 2002) Eight of the 15 floods large floods in Table 7 occurred in the summer months of June through August and are associated with intense cloudbursts, which can stay in the mountains producing high rainfall amounts, three occurred in the fall (September, through November) and were associated with hurricanes and 4 occurred in the winter/spring (January through April) and were associated either with rain on snow events or snowmelt. High flows usually occur after the soil has been saturated by either rain, or snowmelt. Summer and fall floods are associated with greater flood damage than winter snowmelt floods. 1.9 HUMAN INFLUENCE Like most of Vermont, the Mad River basin was mostly cleared of trees during the 19th century. Land clearing combined with the building of many small dams, and the channelization of the tributaries near the confluence with the mainstem changed the hydrology of the watershed. Before the land was cleared the water flowed through a forested landscape, and infiltration occurred without concentrating runoff into small channels. The creation, during the 19th and 20th centuries, of a finer drainage network contributes to increased flood flows due to increased time of concentration. The stream channels in the Mad River basin are likely to have mostly finished adjusting to the changes from the deforestation in the 19th century, as was found in an analysis on the adjacent Third Branch of the White River Basin (NRCS, 1999). During this century, additional changes include extensive in-stream gravel mining; the channelization of the mainstem through the placement of extensive rip-rap between Waitsfield and Moretown after the 1973 and 1976 floods. The GIS map created by the Central Vermont Regional Planning Commission of rip-rap of the mainstem is derived from Natural Resource Conservation Service (NRCS) data and shows 12,465 feet of rip-rap in this area. Barry Cahoon, Stream Alteration Engineer for VT ANR says the mainstem was mined heavily for gravel (Table 8). Mining of river gravel in Vermont was regulated and reduced in 1987 but continues on a reduced scale, currently landowners may remove up to 50 cubic yards annually. The result is that now about 300 cubic yards of gravel are removed from the river each year (Czaplinski, 1995). In 1997 and 1998 10 sites received permits to remove 18,000 cubic yards of gravel from the Mad River in the towns of Warren and Waitsfield (ANR Feb. 1999, Appendix 7).
Table 8: Mainstem Reaches With Historical Gravel Mining M4 by gaging station (small and frequent) M6 below gorge M10 Shepherd channelized after 73 flood, gravel mined M11 Channelized, increased slope, heavily mined by picnic area M12 heavily mined by recreation field M13 mined, over-widened, channel avulsions, oxbow M15-A mined and straightened downstream of Butternut gorge M15-D heavily mined adjacent to and downstream of pond M16-A heavily mined by Riverside park upstream of confluence with Clay Brook M16-B Recent degradation due to gravel mining M19 heavily mined upstream of dam in Warren Village, hungry water syndrome
downstream. (Cahoon, personal communication, 2002) Gravel mining often involves annual removal of gravel. This disturbs the structure of the point bars, so that during bankfull flows, the flow is wider and shallower. Wide shallow flow does not have the same
FINAL DRAFT JUNE 3, 2003
21
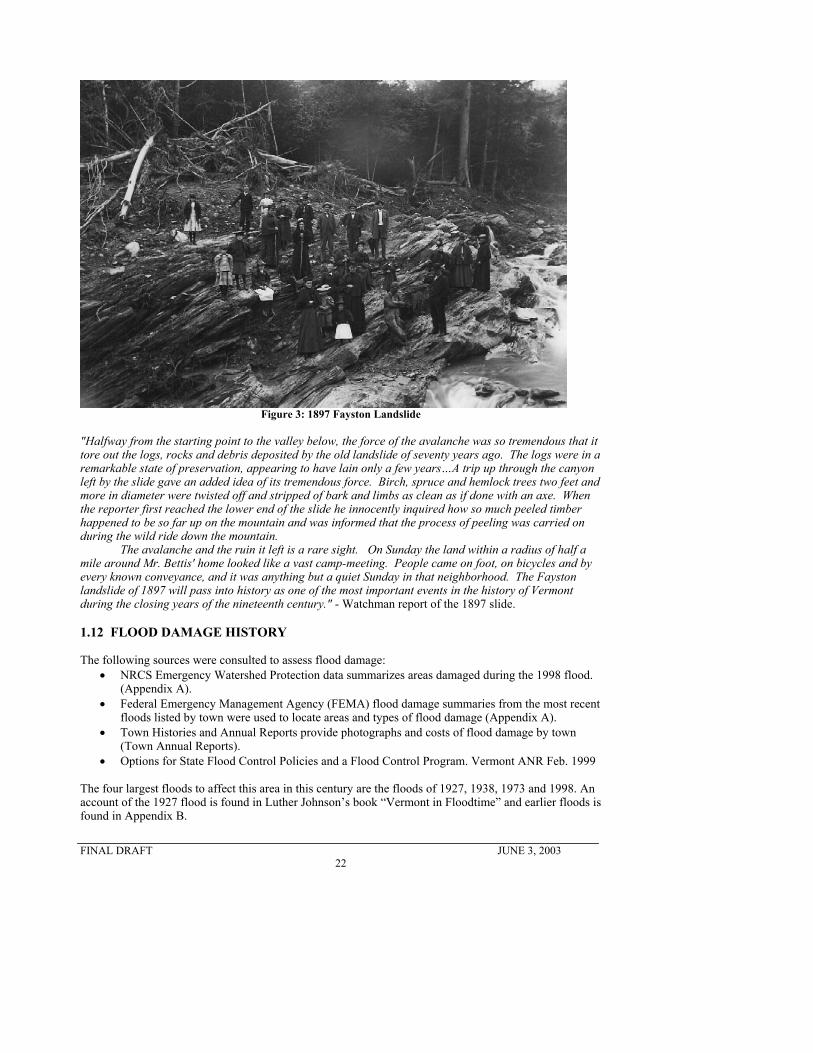
capacity to transport sediment and sediment is deposited across the mined point bars. These random deposits of sediment can deflect the flow of the river causing increased bank erosion. A study of gravel mining for the Vermont Geological Survey documents changes in dimension, slope and profile as a result of gravel mining. The studies reviewed are not specific to Vermont (CWP, 1999). The lack of forested riparian buffer along the mainstem has decreased the amount of large woody debris that can enter the channel. Migration of the mainstem and frequent flooding has influenced land use in the valley by limiting construction near the river. Other human influences include channel relocation for roads, flood remediation projects, and other channel management practices. These practices can disturb bed armor, reduce roughness and cause the channels to adjust their dimensions in response. 1.10 ROAD IMPACTS: The Mad River basin has a drainage density of 2.1 miles per square mile. Forman and Alexander (1998) summarize road impacts on stream morphology and hydrology. They write that in hilly and mountainous terrain, runoff from impervious surfaces is: “insignificant compared with the conversion of slow-moving groundwater to fast-moving surface water at cutbanks by roads. Surface water is then carried by roadside ditches, some of which connect directly to streams while others drain to culverts with gullies incised below their outlets. Increased runoff associated with roads may increase the rates and extent of erosion, reduce percolation and aquifer recharge rates, alter channel morphology, and increase stream discharge rates…. Peak discharges or floods then restructure riparian areas by rearranging channels, logs, branches, boulders, fine-sediment deposits, and pools. In forests, the combination of logging and roads increases peak discharges and downstream flooding ... Forest removal results in lower evapotranspiration and water-storage capabilities, but roads alone may increase peak discharge rates ... Also, flood frequency apparently correlates with the percentage of road cover in a basin…Streams may be altered for considerable distances both upstream and down-stream of bridges…. The fixed stream (or river) location at a bridge or culvert reduces both the amount and variability of stream migration across a floodplain. Therefore, stream ecosystems have altered flowrates, pool-riffle sequences, and scour, which typically reduce habitat-forming debris and aquatic organisms.” 1.11 LANDSLIDE HISTORY Landslides can be triggered by both natural changes in the environment and human activities. Inherent weaknesses in the rock or soil often combine with one or more triggering events, such as heavy rain, snowmelt, and changes in groundwater level. Erosion may remove the toe and lateral slope support of potential landslides. Human activities triggering landslides are usually associated with construction and changes in slope and surface water and groundwater levels (USGS, 2000). Four large landslides have been recorded in the valley. They occurred in 1812, 1827, 1840 and 1897 (Figure 3). The 1897 slide occurred in generally the same path as the 1827 slide. The historical accounts give conflicting information on the location, one places it in Clay Brook, and another on a tributary of the Mill Brook (probably Slide Brook). A Waitsfield resident can look west from his house to see the slide scar, so that indicates that the location of the 1827 and 1897 slides was probably on Slide Brook (Marsh, personal communication, 2002). The following information on landslides is from historical records researched by Earline Marsh (1998-2000), a historian in Moretown. Further historical accounts on landslides are in Appendix B.
FINAL DRAFT JUNE 3, 2003
22
Figure 3: 1897 Fayston Landslide
"Halfway from the starting point to the valley below, the force of the avalanche was so tremendous that it tore out the logs, rocks and debris deposited by the old landslide of seventy years ago. The logs were in a remarkable state of preservation, appearing to have lain only a few years…A trip up through the canyon left by the slide gave an added idea of its tremendous force. Birch, spruce and hemlock trees two feet and more in diameter were twisted off and stripped of bark and limbs as clean as if done with an axe. When the reporter first reached the lower end of the slide he innocently inquired how so much peeled timber happened to be so far up on the mountain and was informed that the process of peeling was carried on during the wild ride down the mountain. The avalanche and the ruin it left is a rare sight. On Sunday the land within a radius of half a mile around Mr. Bettis' home looked like a vast camp-meeting. People came on foot, on bicycles and by every known conveyance, and it was anything but a quiet Sunday in that neighborhood. The Fayston landslide of 1897 will pass into history as one of the most important events in the history of Vermont during the closing years of the nineteenth century." - Watchman report of the 1897 slide. 1.12 FLOOD DAMAGE HISTORY The following sources were consulted to assess flood damage:
• NRCS Emergency Watershed Protection data summarizes areas damaged during the 1998 flood. (Appendix A).
• Federal Emergency Management Agency (FEMA) flood damage summaries from the most recent floods listed by town were used to locate areas and types of flood damage (Appendix A).
• Town Histories and Annual Reports provide photographs and costs of flood damage by town (Town Annual Reports).
• Options for State Flood Control Policies and a Flood Control Program. Vermont ANR Feb. 1999 The four largest floods to affect this area in this century are the floods of 1927, 1938, 1973 and 1998. An account of the 1927 flood is found in Luther Johnson’s book “Vermont in Floodtime” and earlier floods is found in Appendix B.
FINAL DRAFT JUNE 3, 2003
23
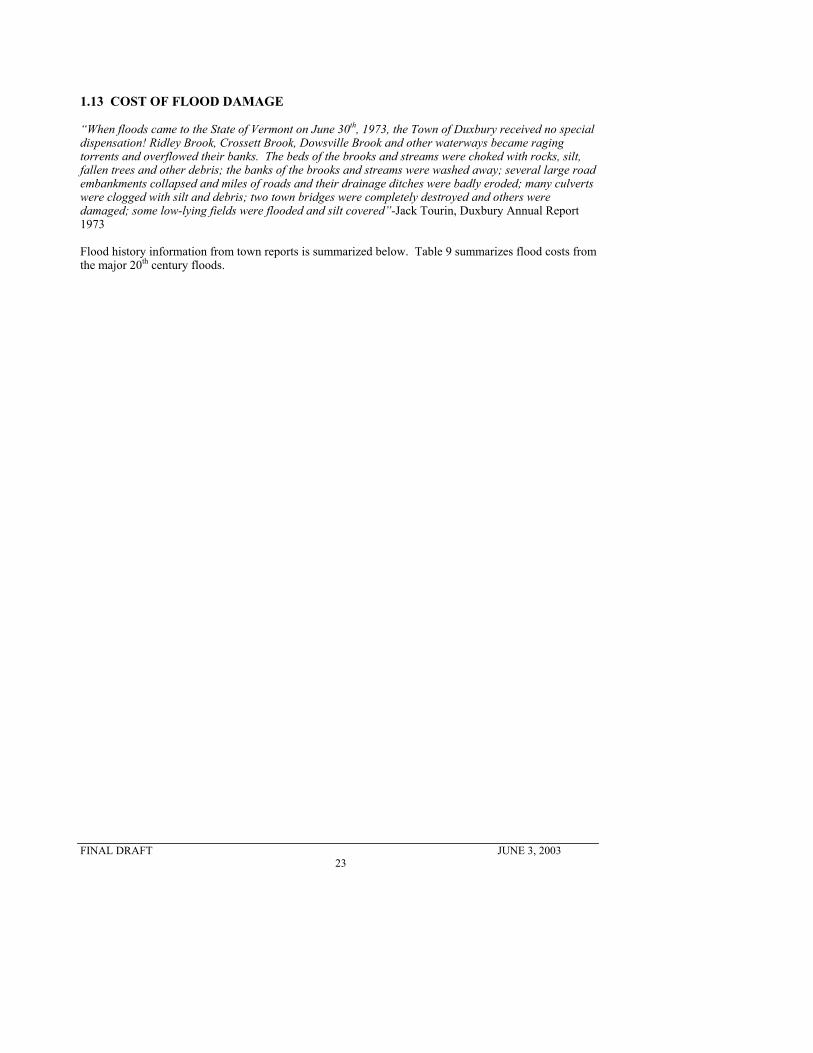
1.13 COST OF FLOOD DAMAGE “When floods came to the State of Vermont on June 30th, 1973, the Town of Duxbury received no special dispensation! Ridley Brook, Crossett Brook, Dowsville Brook and other waterways became raging torrents and overflowed their banks. The beds of the brooks and streams were choked with rocks, silt, fallen trees and other debris; the banks of the brooks and streams were washed away; several large road embankments collapsed and miles of roads and their drainage ditches were badly eroded; many culverts were clogged with silt and debris; two town bridges were completely destroyed and others were damaged; some low-lying fields were flooded and silt covered”-Jack Tourin, Duxbury Annual Report 1973 Flood history information from town reports is summarized below. Table 9 summarizes flood costs from the major 20th century floods.
FINAL DRAFT JUNE 3, 2003
24
Table 9: FLOOD COSTS BY TOWN Sources: FEMA, Town Annual Reports and Vermont Flood Loss and Damage Survey 1928
**Dollar conversion from http://www.economagic.com/em-cgi/data.exe/var/cpiu-long. Note, replacement cost of building and infrastructure losses probably not accurately reflected in this conversion.
FINAL DRAFT JUNE 3, 2003
26
SECTION 2.0 METHODOLOGY 2.1 METHODOLOGY: DATA REVIEW A comprehensive review of existing information included:
• Flood damage data for the 1998 flood from the Federal Emergency Management Agency (FEMA).
• Bridge scour assessments from the USGS and Vermont Agency of Transportation (AOT). • Bridge assessment data from the bridge database from the Vermont Agency of Transportation. • Assessment of landslides and woody debris jams on Stetson Brook from Green Mountain
National Forest (GMNF). • FEMA floodplain studies (1977, 1981, 1984). • AOT bridge engineering drawings. • Historical information from town clerks, town histories, articles on the history of the Mad River
Valley by Earline Marsh, newspaper articles from the 1927 flood (thanks to John Malter) and oral history from road commissioners for details on flood damage and costs..
• Gravel removal maps using data provided by the Vermont ANR to the Central Vermont Regional Planning Commission.
• Natural Resource Conservation Service (NRCS) maps of rip-rap installed after the 1973 flood. • Vermont Agency of Natural Resources (ANR) cross-sectional studies on the mainstem and
tributaries including 6 cross-sections on the mainstem that were repeatedly surveyed from the mid 1980s to the mid 1990s.
• Vermont Agency of Natural Resource studies on Dowsville Brook and brooks draining Sugarbush Ski area
• Studies on fluvial geomorphology of Stetson and Clay Brooks (Jaquith, 1999), and salamanders on brooks draining Sugarbush ski area (Strong et. al. 2002)
• Fluvial geomorphic data provided by consultants for Sugarbush Ski Area on stream restoration projects along the mainstem and Clay Brook.
• Overlays of orthophotos and aerial photos along the mainstem. • Existing data was used to quantify lateral migration and vertical incision
FINAL DRAFT JUNE 3, 2003
27
SECTION 3.0 SUMMARY OF PREVIOUS STUDIES 3.1 ANR CROSS-SECTIONAL STUDY The Vermont ANR conducted annual cross-sectional and profile surveys along Reach M10 near the townline of Moretown and Waitsfield. Six cross-sections were surveyed almost annually from 1987 to 1998 to determine changes in width/depth, profile and elevation in an area that had experienced channel straightening and continuous heavy gravel mining prior to reduction of gravel mining after 1987. ANR cross-sections from the beginning, middle and end of the study period were entered in the database, results are in Appendix D. The cross-sectional studies show that since gravel-mining has been reduced that the width/depth ratio has generally decreased (Table 10), and the thalweg elevation over the 10 – 11 years shows that some areas are aggrading and some degrading (Table 11).
Table 10: Surveyed Cross Sections 1987 – 1998, Reach M10 Cross section ID and year
Bankfull Width (ft)
Mean Depth
(ft)
Width/ Depth Ratio
A 1987 126.8 2.7 47.0 A 1998 121.4 3.1 39.8 B 1989 127.4 5.2 24.4 B 1998 128.0 5.4 23.9 C 1989 140.3 2.0 71.9 C 1998 162.7 1.9 86.4 E 1988 319.4 2.3 137.2 E 1998 207.1 3.3 63.5
(VT ANR, 1987 - 1998) Table 11: Change in Thalweg Elevation
Cross-section
Change in Thalweg
Elev.
1998 Thalweg Elev. (ft)
A 0.5 ft.
degradation 614
B 1.3 ft.
degradation 613.3
C 1.5 ft
aggradation 617.5
E 1 ft
aggradation 609.3 3.2 STREAM SEDIMENTATION Two studies by the Vermont Agency of Natural Resources on wild trout populations in watersheds draining Sugarbush Ski Area and logging on Dowsville Brook document chronic or acute sedimentation in streams. The results are summarized below. All studies used a paired watershed analysis with reference streams. 3.2.1 BROOK TROUT STUDY The Vermont Department of Fish and Wildlife conducted a 10 year study on Chase, Clay, Rice and Slide Brooks from 1987 – 1996. Slide Brook was used as the reference stream. In summary, “During the 10-yr study period from 1987 – 1996, development activities in the Sugarbush Ski Area
FINAL DRAFT JUNE 3, 2003
28
directly impacted wild brook trout populations in several streams. Chronic and often extreme sedimentation from parking lots, roadways and construction activities was a common problem throughout much of the study period in Chase Brook, Clay Brook and Rice Brook and tended to confound the results of the primary impacts of sewage plant discharges and winter water withdrawals being studies. Despite these influences, definitive impacts to brook trout populations were attributed to sewage treatment plant discharges into Rice Brook. Impacts to brook trout populations from winter water withdrawals from Clay and Chase Brooks, however, were not as clear. Although brook trout young-of-year densities and/or fluctuation patterns were atypical below the two withdrawal sites, yearling and older brook trout and total brook trout population levels and variations were similar to unimpacted stream stations.” (Vermont Department of Fish and Wildlife, June 1997). 3.2.2 EFFECTS OF LOGGING PRACTICES The Vermont Agency of Natural Resources Bio-monitoring Unit monitored both reference (control) sites and sites impacted by heavy logging. The study found that “small headwater streams are much more sensitive to sediment discharge than are larger high order streams and rivers.” In the Mad River watershed, 7 sites exceeded Vermont Water Quality Standards for turbidity, while 8 sites did not (Table 12). The type of soil in the watershed effected both stream sedimentation and turbidity. Sandy soils increased stream sedimentation, while soils with clay caused increased turbidity levels, but less stream sedimentation. ANR recommends “Adequately sized strips are the best means to protect water quality. Buffer strips are particularly important for small headwater streams and ephemeral stream channels.” (VT ANR Biomonitoring and Aquatic Studies Sections,)
Table 12: Exceedance of Turbidity Standards from Logging in Mad River Watershed Exceeded Turbidity Standards: Did Not Exceed Turbidity Standards:
4. Dowsville Trib 1, 5. Dowsville Brook #1 and 2, 6. Mill Brook Trib, 7. Finn Basin Brook, 8. French Brook, 9. Mill Brook trib, 10. Mill Brook #2
3.3 SALAMANDER STUDY This study was a paired watershed analysis comparing 14 watersheds. Seven of these watersheds drained ski areas, and seven drained more ‘pristine’ streams located nearby. The study compared populations of three species of aquatic salamanders. Table 13 summarizes the total number of salamanders in impacted and reference streams. The study recommended further investigation, but found that some “as yet uncertain aspect of ski area development may negatively impact populations of Northern Dusky and Spring salamanders in Vermont”. The study found that streams below ski lodges and parking lots were “visibly and vividly altered from sections above the lodge, and even more so from the control streams. Rocks and gravel in the stream substrate were coated with a bright orange iron oxide precipitate…”. The study found that the separating the stream into sections above and below the ski lodge correlated with salamander numbers, i.e., there were more salamanders in the sections above the ski lodges that were less impacted (Strong et. al, 2002).
Slide Brook Control for Clay Brook 16 5 0 21 Clay Brook Ski- Sugarbush South 7 8 0 15 Lockwood Brook Control for Chase Brook 17 5 8 30 Chase Brook Ski- Sugarbush North 13 3 0 16
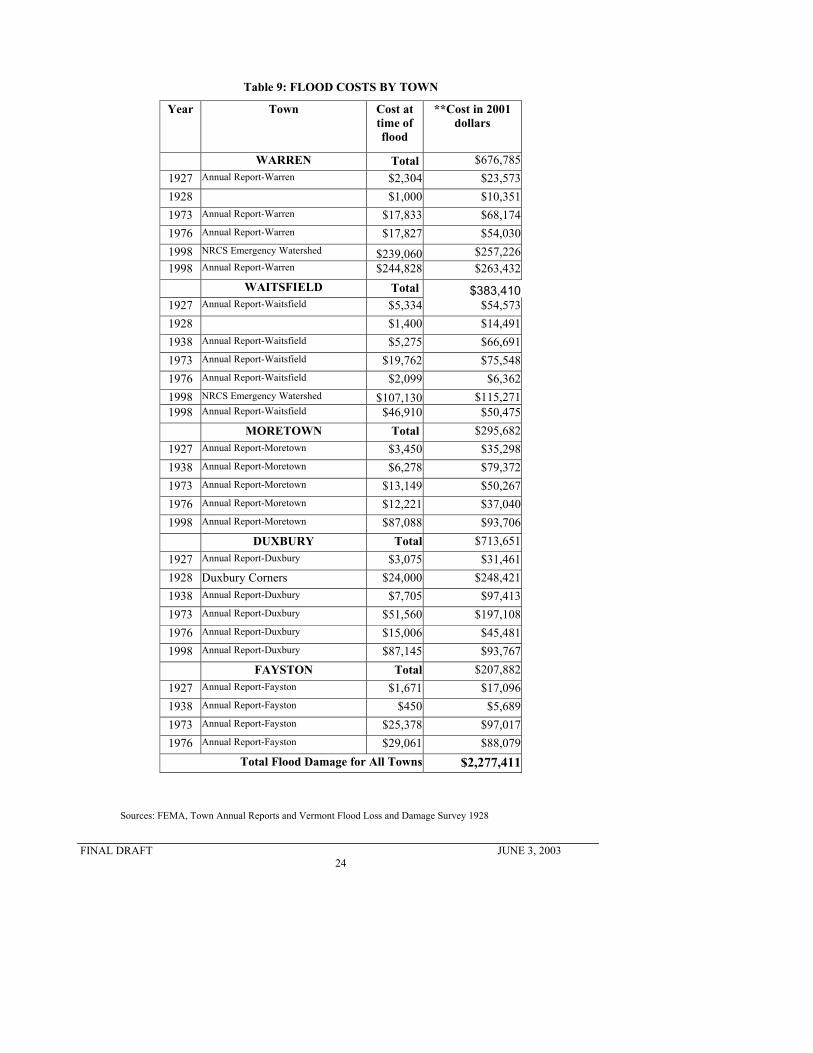
3.4 SUMMARY OF EXISTING DATA: BRIDGES The Vermont Agency of Transportation maintains a bridge inspection database that assesses the condition of the channel, the banks and the bridge. Table 14 shows results of the AOT database. 39 bridges are listed in the AOT database; 2 were found to be unstable for calculating scour, 4 were not evaluated for scour. Six bridges had a 5 rating for Channel protection indicating that the “River control devices and/or embankment have major damage”, while 10 rated a 6 indicating “erosion, widespread minor damage and minor streambed movement.” The USGS conducted scour analysis on two bridges in the Shephard Brook watershed, a summary of these reports is in Table 15.
Table 14: AOT Bridge Scour Database
Town Name
Route Name
Bridge Number
Feature Intersected Location
Year Built
Channel And Channel
Protection Rating
Scour Critical
Fayston C3011 00020 Shepard Brook 0.15 MI TO JCT W CL2 TH1 1966 5 U
Fayston C2001 00006 Shepard Brook 1.0 MI TO JCT W CL3 TH9 1928 5 3
Fayston C3010 00019 Shepard Brook 0.25 MI TO JCT W CL2 TH1 1900 5 3
Waitsfield VT100 00181 Brook 2.5 MI N JCT. VT.17 1940 5 6 Waitsfield VT100 00178 Mill Brook 0.3 MI S JCT. VT.17 1938 5 8 Warren VT100 00169 Mad River 5.7 MI S JCT. VT.17 1954 5 8
Waitsfield C2003 00020 Pine Brook 0.15 MI TO JCT W C3 TH15 1872 6 U
Warren FAS 0188 00006 Mad River 0.5 MI E JCT. VT.100 S 1879 6 U
Fayston VT17 00032 Mill Brook 3.9 MI W JCT. VT.100 1948 6 6
Fayston VT17 00034 Mill Brook 2.6 MI W JCT. VT.100 1939 6 6
Moretown VT100B 00001 Dowsville Brook 0.2 MI N JCT. VT.100 1927 6 6
Warren FAS 0188 00005 Freeman Brook 0.3 MI E JCT. VT.100 N 1963 6 6
Warren VT100 00166 Mad River 8.3 MI S JCT. VT.17 1939 6 6
FINAL DRAFT JUNE 3, 2003
30
TABLE 14 CONT.
Town Name
Route Name
Bridge Number
Feature Intersected Location
Year Built
Channel And Channel
Protection Rating
Scour Critical
Duxbury VT100 00187 Downsville Brook
0.9 MI N JCT. VT.100B 1937 6 8
Waitsfield VT100 00177 Mad River 0.8 MI S JCT. VT.17 1938 6 8 Warren VT100 00172 Clay Brook 3.5 MI S JCT. VT.17 1954 6 8
Moretown C3024 00041 Mad River 0.1 MI TO JCT W VT100B 1928 7 U
Fayston VT17 00035 Mill Brook 1.4 MI W JCT. VT.100 1939 7 6
Fayston VT17 00036 Mill Brook 1.1 MI W JCT. VT.100 1939 7 6
Fayston C3004 00018 Shepard Brook 0.25 MI TO JCT W CL2 TH1 1986 7 6
Warren FAS 0188 00007 Freeman Brook 0.4 MI E JCT. VT.100 N 1947 7 7
Fayston VT17 00037 Mill Brook 0.9 MI W JCT. VT.100 1965 7 8
Moretown VT100B 00007 Mad River 2.3 MI S JCT. U.S.2 1967 7 8
Waitsfield C2001 00004 Mad River 0.08 MI TO JCT W VT100 1833 7 8
Waitsfield C3015 00025 Mad River 0.1 MI TO JCT W VT100 1983 7 8
Waitsfield VT17 00038 Mill Brook 0.1 MI W JCT. VT.100 1939 7 8
Waitsfield VT100 00186 Shepard Brook 0.9 MI S JCT. VT.100B 1938 7 8
Warren VT100 00167 Mad River 7.4 MI S JCT. VT.17 1957 7 8 Warren VT100 00173 Mad River 3.1 MI S JCT. VT.17 1929 7 8
Fayston VT17 00033 Mill Brook 3.5 MI W JCT. VT.100 1977 8 8
Moretown VT100B 00002 Mad River 0.6 MI N JCT. VT.100 1928 8 8 Moretown VT100B 00004 Mad River 1.6 MI N JCT. VT.100 1994 8 8
Moretown C3011 00040 Mad River 0.1 MI TO JCT W VT100B 1928 8 8
Moretown C3039 00042 Mad River 0.05 MI TO JCT W VT100B 1920 8 8
Waitsfield C3029 00022 Mad River 0.1 MI TO JCT W VT100 1999 8 8
Waitsfield C3008 00024 Mad River 0.1 MI TO JCT W VT100 1955 8 8
Warren FAS 0188 00032 Freeman Brook 0.8 MI E JCT. VT.100 S 1936 8 8
Warren C2004 00030 Mad River 0.08 MI TO JCT W VT100 1929 8 8
Bridge foundations determined to be stable for calculated scour conditions; calculated scour is above top of footing. If bridge was screened or studied by experts and found to be low risk, it should fall into this category according to FHWA.
7 Countermeasures have been installed to correct a previously existing problem with scour. Bridge is no longer scour critical.
6 Scour calculation/evaluation has not been made. (Use only to describe case where bridge has not yet been evaluated for scour potential.)
3 Bridge is scour critical; bridge foundations determined to be unstable for calculating scour conditions. Scour within limits of footing or piles.
U Unknown Item 61 - Channel and Channel Protection Code Description
8 Banks are protected or well vegetated. River control devices such as spur dikes and embankment protection are not required or are in a stable condition.
7 Bank protection is in need of minor repairs. River control devices and embankment protection have a little minor damage. Banks and/or channel have minor amount of drift.
6
Bank protection is being eroded. River control devices and embankment protection have widespread minor damage. There is minor streambed movement evident. Debris is restricting the waterway slightly.
5 Bank is beginning to slump. River control devices and/or embankment have major damage. Trees and brush restrict the channel.
97-755 scour evident along 10 ft downstream end of abutment NOTES: 98-272 channel shows slight indications of lateral instability, however, the size of the bank material prevents any significant movement. Therefore, the reach is considered stable.
*-D84 estimated from graph
FINAL DRAFT JUNE 3, 2003
33
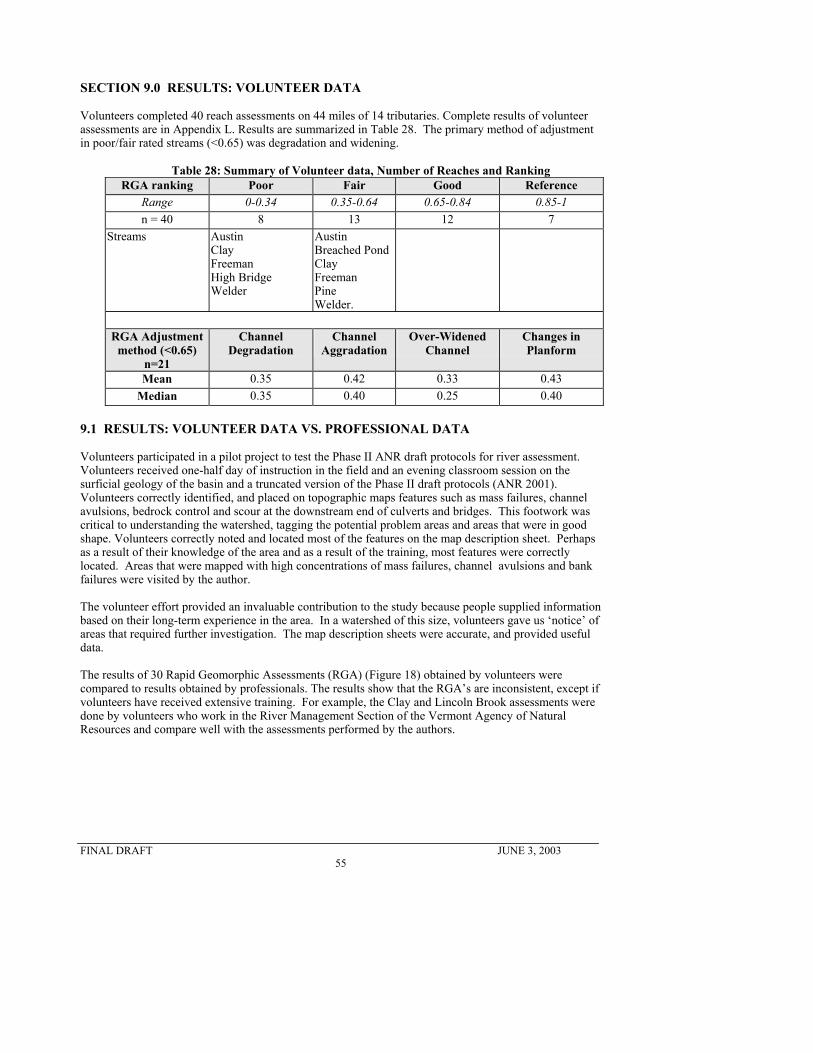
SECTION 4.0 VOLUNTEER INVOLVEMENT Two one-day trainings were conducted by Mike Blazewicz of Friends of Mad River (FMR), George Springston of Norwich University and Lori Barg for 30 volunteers with FMR who were trained in aspects of the Phase II draft protocol of the Vermont Agency of Natural Resources (ANR, 2002). FMR found the volunteers through their members, newspaper articles and other media. Volunteers were trained to conduct 1) Part of the Rapid Habitat Assessment (RHA) based on EPA’s Rapid Bioassessment Protocols (RBP) (EPA 1999), 2) A Rapid Geomorphic Assessment (RGA) which assesses four geomorphic adjustment processes of widening, incision, aggradation and changes in planform (ANR, 2002), and 3) Conduct a survey on culverts and bridges. Volunteers were also provided with information on reading topographic maps, field sheets and information on recognizing and recording a number of stream features that are indicators of instability such as mass and bank failures, mid-channel bars, scour and degradation by bridges and culverts, channel avulsions, and cut-off chutes. Volunteers recorded bedrock outcrops and channel-spanning bedrock which contributes to the stability of the watershed. Volunteers were provided with cameras, a handbook, and field forms to record. Appendix E contains training information and field sheets that were provided for volunteers that are not part of the ANR Phase II draft protocols. Volunteers completed 40 reach assessments on 44 miles of 14 tributaries. The results of volunteer assessments in similar reaches were compared to results of professional assessments in order to determine the replicability of the draft ANR protocols. Observations made by volunteers of mass failures, channel avulsions and other indicators of instability were checked by investigators, including the geologists mapping surficial geology, either in the field, or through the volunteer’s photographs to ensure accurate descriptions of field observations. Tributaries with many indicators of instability were walked by the investigators. Volunteer data supported the professional assessment of the watershed, but did not substitute for it.
FINAL DRAFT JUNE 3, 2003
34
SECTION 5.0 METHODOLOGY: FIELD ASSESSMENT Field data was collected according to protocol developed by the Vermont Agency of Natural Resources (2002). Field forms are in Appendix F. The Phase I Protocol was completed concurrently while the Phase II ANR assessment was in progress. The ANR Phase II rapid assessment and the ANR Phase III form for cross-sectional data (ANR, 2002) were supplemented with a bridge and culvert form and additional information more specific to the geology, bank material, type of erosion process, and other parameters that aid in hazard identification. Instability was defined according to Sear (1996) (Table 16) and includes channel, bank and floodplain features. The location of features of special interest such as bedrock control, channel avulsions and mass failures were noted on 7.5 minute topographic maps. Photographs of every cross-section and select features are in Appendix G and H. This study supplemented the ANR Phase II Protocols in the following areas:
• Cross-sections were surveyed at the elevation of the top of bank (not bankfull). Cross-sectional data included the floodplain beyond the top of bank to 2x maximum depth.
• Slopes were measured using a Suunto clinometer, or hand level and staff gage. Slopes were measured from similar features, for example from top of riffle to top of riffle and 10 –20 bankfull widths apart along the longitudinal profile.
• Bridges and culverts were surveyed for amount of scour, width, height, length, presence/absence of grade control and other features.
• A separate sheet for collecting additional data was used, this includes, height, length, location and texture of mass failures, slope of channel, pool depth, root binding capacity of grass and trees/shrubs, and other data including a visual assessment of Manning’s “n”(Barnes, 1967)
• Large woody debris that was 0.1 m. diameter breast height and were whole trees were counted as LWD.
All assessments determined left bank/right bank by facing downstream. Fluvial and basin characteristics included bedrock controls, slope, width/depth ratio, sinuosity, bank materials, artificial materials (flood plain encroachment including berms that are “recent” surficial deposits), surface bed material (armor). The study of the surficial geology will map underlying material (below armor). Bedrock gorges were assessed in an abbreviated fashion. Long gorges (> 1/4 mile) were described as a separate reach. Reaches less than ¼ mile in length were noted on the maps as gorges or waterfalls or bedrock control. Bedrock gorges did not have detailed assessments, only Steps 1.4, 1.5,1.6,2.12,and 2.14. of the ANR Field Note form were used. Ephemeral streams did not receive full assessments.
FINAL DRAFT JUNE 3, 2003
35
Table 16: Field Indicators of Stability Used by Geomorphologists Channel Features Bank Features Floodplain Features
Braiding-multiple channels separated by unvegetated, uncompacted bars of exposed riverine sediments Actively meandering-large frequent point bars with mid-channel bars all composed of unvegetated, uncompacted exposed riverine sediments. Cut-offs imminent and recent Meandering-point bars of unvegetated, uncompacted exposed riverine sediments Meandering-point bars and berms of fine sediments with seasonal vegetation growth Large, unvegetated, unstained, uncompacted bars immediately downstream of tributary input Loose, uncompacted unvegetated sediments showing evidence of fluvial sorting (e.g. dunes, ripples in fine sediment structures, alignment, sheets in coarse sediments) Shallow pools filled with loose, unvegetated mixed-size sediments Dissected riffles of loose, unstained mixed-size sediments
US US US/S US/S US US/S US US
Large or frequent eroding cliffs of unconsolidated sediments delivering sediment directly to the channel Erosion of both river banks for over 50% of reach. Slabs, blocks, overhangs indicate scour by fluvial processes. Slumping, slips and presence of small terraces halfway up bank face indicates geotechnical failure of banks Erosion of outer banks at meanders (type of bank erosion significant) State of fence lines, embankments and arboreal vegetation-collapse indicative of lateral instability Generally unvegetated banks with old slump scars Age of bankside trees and structures Presence/state of bank protection and structures Bank materials of cohesive clays tend to be stable or fail through slumping. Gravels and sands are unstable and may scour or slump. Boulders tend to self-heal when fallen to the foot of a bank
US US US/S US/ S US US/S US/S US/S
Cut-off channels-recent or old depending on state of preservation and type/degree of infilling and vegetation. Size of cut-offs compared to present channel (smaller, larger) Old boulder dumps or bar forms on floodplain (note sediment type and degree of cover by moss/lichen/vegetation) Old bank lines/cliffs on floodplain terraces or valley sides Presence of terraces – number, proximity to channel, relief, clarity of feature and composition if evident. Age of vegetation/structures Age/location of structures, field systems, boundaries with respect to present channel Land use of floodplain and vegetation type of riparian zone Presence, type and extent of recent overbank deposits Vertical structure of sediments exposed in river banks or terraces/ditches on the floodplain
US US US/ S US/ S US/ S US/ S US/ S US/ S
(Sear, 1996 Table 6.3) US=unstable, S=stable 5.1 DATA PRESENTATION Locations of features and cross-sections are provided as point data in Arcview 3.3, a geographic information system (GIS) program (Appendix I). Point location data is provided for:
• Rapid Assessment Sites on tributaries and mainstem. • Reach breaks from ANR Phase I assessment. • Mass Failure and Channel Avulsion sites. • Locations of bedrock control, or artificial grade control (dams). Not all bedrock outcrops are
shown, but the furthest downstream control on the tributaries is indicated. GIS data obtained from the Central Vermont Regional Planning Commission includes:
• Gravel mining areas in the watershed based on information from Barry Cahoon, ANR stream alteration engineer.
• Areas that were rip-rapped by the Natural Resource Conservation Service after the 1973 and 1976 floods.
The Vermont ANR maintains an Access database with complete results of this study. Selected results are
FINAL DRAFT JUNE 3, 2003
36
in Appendix J. 5.2 PEBBLE COUNTS Pebble counts of 100 pebbles in a riffle section(Wolman, 1954) were conducted at 3 sites on tributaries at locations where the drainage area was ~5 square miles. Other pebble count data is available from consultants for Sugarbush, the Vermont Agency of Natural Resources, the United States Geological Survey and the Vermont Agency of Transportation which conducted sieve analysis on bedload in Warren Village.
FINAL DRAFT JUNE 3, 2003
37
SECTION 6.0 SUMMARY OF RESULTS: The results are generally organized in two sections, the mainstem and the tributary streams. Selected results of the field work including the ANR draft protocol parameters, additional geomorphic assessments and stream geometry including channel dimensions, slope, cross-sectional area are in Appendix J, while complete results are maintained by the Vermont Agency of Natural Resources. The data collected through an examination of USGS topographic maps, aerial photos, and published information for the Phase I ANR protocols is in Appendix K. Photos illustrating specific features: flood-plain encroachment, mass failures etc. are found in Appendix G. Photographs of each cross-section are found in Appendix H. 6.1 RESULTS OF QUANTITATIVE GEOMORPHIC ASSESSMENTS 6.1.1 HYDRAULIC GEOMETRY The width-depth ratio is a dimensionless number derived by dividing the bankfull width by the mean bankfull depth. The results from the mainstem and the tributaries are shown in Figures 4 - 7 and Table 17. The width/depth ratios can be used to determine the departure from normal for similar stream types. Along the mainstem approximately two-thirds of the cross-sections have width/depth ratios >28. This indicates over-widening and a reduced ability to adequately transport sediment. Tributary width-depth ratios are shown in Figure 5. Steeper streams generally have smaller width/depth ratios than shallow sloped valley bottom streams. The figure shows that one-third of the tributaries have width/depth ratios greater than 28. The width/depth ratio of 28 comes from an analysis of over 200 cross-sections on Vermont streams, and showed a w/d ratio of 27.9 on wide, meandering, low gradient Rosgen C-type streams with forested buffers on both banks (Streamside Sentinel, 2001). As the database grows for Vermont streams, this analysis should be carried out again with an expanded dataset on different stream types. Only 15% of the tributary cross-sections had width/depth ratios of less than 12. 36% of the tributary cross-sections surveyed with slopes greater than 4% had flood-plain access. This is probably due to the presence of large woody debris, and the common occurrence of channel avulsion which creates floodplain access. Alternatively, it could also be due to underfit streams in formerly glaciated valleys. Figures 8 and 9 show the entrenchment ratio (ER). The ER is determined by dividing the floodprone width (width at 2 x maximum depth) by the bankfull width. Streams with an ER greater than 2.2 access the floodplain during bankfull events (Rosgen, 1996). Approximately one-third of the basins under 10 sq. miles have flood plain access, however on the mainstem of the Mad River (over 20 sq. miles drainage area), the majority of the cross-sections do not have access to the floodplain; they are moderately to greatly entrenched.
FINAL DRAFT JUNE 3, 2003
38
Mad River Mainstem Width/Depth Ratio, n=30
0
2
4
6
8
10
12
11 < 28 28 < 40 40 < 99
<28 = stable, >28 = over-widened
# si
tes
Figure 4: Mainstem Width/Depth Ratio. Approximately 2/3 of cross-sections are over-widened.
Mad River Tributaries Width/Depth Ratio n=74
05
1015
2025
30
<12 12-20 20-28 28-40 40-70Width/Depth Ratio
# of
site
s
Figure 5: Tributary Width/Depth Ratio. Approximately 1/3 of cross-sections are over-widened
Figures 10 and 11compare the hydraulic geometry of the Mad River Basin with the Third Branch of the White River Basin (Barg, 2002). The data around the trend lines should be viewed as a band, not a line. Since all data is included here, there is a wide variety of slopes, channel and valley types, land uses etc. One of the differences seen between the Third Branch tributaries and the Mad River tributaries is that in watersheds under 10 sq. miles, the band on the Mad River tributaries is wider, potentially indicating increased adjustment. The streams that are outliers are primarily Dowsville Brook and Clay Brook. The data in the appendices can be examined on a reach basis to determine which cross-sections are the outliers. The results of the cross-sectional analysis were compared to the VT ANR’s measurements and the USGS measurements database available on the internet which gives field measurements when flows were
FINAL DRAFT JUNE 3, 2003
41
measured. This was done to calibrate the cross-sectional dimensions measured on the mainstem as part of this study. The return frequency flows estimated by the VT ANR regional hydraulic curve for the 1.5 year bankfull flow is 4960 cfs at the Mad River gage. The USGS flow measurements taken during near bankfull discharge are shown in Table 18. The USGS flows were measured from the steel bridge which has a maximum span of 113 feet (AOT database). The channel cross-section is slightly constricted, potentially slowing the velocity on the upstrseam side of the bridge, and increasing it on the downstream side of the bridge. ANR measured four cross-sections upstream and downstream of the bridge near the USGS gage. All results are shown in Table 18, which is sorted by discharge.
Table 18: Mad River Channel Dimensions: USGS/ANR*
Source data
Description Channel Width
(ft)
Mean Depth (ft)
Cross-Sectional Area
(sq. ft) Discharge
CFS USGS Pool at bridge 107 9.1 975 6230
ANR Hydraulic Curve (2001)
Riffle 1684’ u/s of bridge
138
4.0 559 4960
ANR Pool at bridge
gage plate 143
6.2 895 4945
ANR 1st riffle below
weir 127
4.6 588 4898 USGS Pool at bridge 108 7.3 787 3840 USGS Pool at bridge 106 7.2 759 3760 USGS Pool at bridge 107 6.8 724 3200 ANR riffle 134 4.4 585 2862
*ANR discharges are calculated. All other parameters measured
FINAL DRAFT JUNE 3, 2003
42
Mad River Basin Hydraulic Geometry Phase II Fluvial Geomorphic Study, 2002
1
10
100
1000
1 10 100 1000
Drainage Area (sq. mi.)Cross Sectional Area
BankfullWidth
Maximum Depth
Figure 10: Mad River Basin Hydraulic Geometry
Third Branch White River Hydraulic Geometry Phase II Fluvial Geomorphic Study, 2001
1
10
100
1000
1 10 100 1000
Drainage Area (sq. mi.)
Cross-Sectional Area (sq. Feet)
Bankfull Width (ft)
Maximum Depth (ft)
Figure 11: Third Branch of the White River Hydraulic Geometry
6.1.2 CHANNEL EVOLUTION MODEL, STREAM TYPE Table 19 summarizes the results of the Channel Evolution Model (CEM) (Schumm). The reaches in CEM Stage 2, 3 and 4 are unable to effectively transport sediment. They are degrading, over-widened or stabilizing at a lower elevation. Simon and Kuhnle (2001) identify CEM Stages I and VI (Stage 5 in
FINAL DRAFT JUNE 3, 2003
43
Schumm) as defining “reference” rates for suspended sediment transport. Stage 1 and 5 (Schumm) and Stage I and VI (Simon) represent streams that effectively transport water and sediment. CEM Stage 2 through 4 in Schumm’s Channel Evolution Model are equivalent to Stage 2 – 5 in Simon (1989a) and represent channels that are adjusting through the processes of degradation, widening and aggradation. The channel evolution model can be used for determining reference conditions. Reaches that are in Stages 2,3 and 4 do not effectively transport sediment. “An advantage of a process-based channel-evolution scheme for use in TMDL development is that Stages I and VI [1 and 5 (Schumm)] represent two true “reference” conditions.” (Simon and Kuhnle et. al, 2001). Rosgen (1996) D, F and G stream types may be found as unstable stream types. Table 20 lists the number of cross-sections with these Rosgen stream types. These reaches are in adjustment and their dimension, profile and planform is changing.
Table 19: Channel Evolution Model Summary: Number of cross-sections in each stage
Channel Evolution Model Stage Mainstem
# cross-sections Lower Tributaries
# cross-sections Upper Tributaries
# cross-sections
Stage 2 Incising 2 1 5
Stage 3 Widening 5 8 6
Stage 4 Stabilizing 6 8 1
Stage 1 and 5 Stable 12 30 14 Percent of cross-sections
in Stage 2, 3 or 4 52% 36% 46%
Table 20: Rosgen Entrenched Potentially Unstable Stream Types 6.2 QUANITIFYING HORIZONTAL AND VERTICAL CHANGE 6.2.1 LATERAL MIGRATION The channel migration zone (King County, 1998) is an important parameter for determining potential hazard. It is derived by overlaying aerial photos from different epochs. The rate of migration was probably increased by land clearing, and the removal of the riparian buffer along much of the mainstem. Historic changes in channel location are combined with present day channel characteristics to delineate the channel migration zone. Topographic maps, aerial and orthophotos from the 1960s, 1970s and 1990’s were georectified and overlain by George Springston of Norwich University at the scale of digital orthophotos 1:5000 on the mainstem between Waitsfield and Warren. The Mad River between Moretown and Waitsfield is a low-gradient meandering stream and has been rip-rapped along much of its length. This has not prevented channel migration, and oxbows and failed rip-rap are evident throughout this reach. There has been a limited amount of incision that has undermined the rip-rap. Between the village of Waitsfield and Warren, the stream has been actively migrating, channel
Number of Cross-Sections
Unstable Rosgen Stream Type Location
11 1
F G Mainstem
7 4
F G Lower Tributaries
3 1
F G Upper Tributaries
FINAL DRAFT JUNE 3, 2003
44
avulsions and cut-off chutes are found in almost every reach, particularly downstream of the snow-making pond, and upstream and downstream of bedrock or bridges that constrict the channel. Areas with substantial active channel migration are found upstream of Butternut gorge (M15b) , above and below the punch bowl (M15c); upstream of the Lareau swim hole (M13b), and upstream and downstream of the confluence with Bradley Brook (M17/M18). 6.2.2 VERTICAL DEGRADATION AND GRADE CONTROL Bedrock grade control on the mainstem is found in every reach of the Mad River except for M5, M6, M12, M13, M17, and M21. Despite the presence of bedrock control on the majority of the mainstem, there is evidence of changes in vertical elevation along the mainstem. Upstream of Moretown Gorge, there are two concrete box culverts that are suspended between 3-5 feet above low water level of the mainstem. These culverts were probably installed prior to the 1927 flood. When the Moretown dams were washed out by the flood (and not re-built), the grade lowered upstream of the gorge. There is a 5 – 6 ‘ drop between the bottom of the concrete box culvert and low water level. Other areas where concrete box culverts are suspended ~3 ft above low water level include Reach M11-b, M11-S3 and at the confluence with Bradley Brook (M17). Bridge surveys from the Vermont Agency of Transportation, USGS Bridge Scour surveys and FEMA floodplain studies were used to determine amounts of vertical degradation over a specific period of time. Surveys were found for several bridges, the results are summarized in Table 21. Upstream of Waitsfield Village by the Lareau swim hole (Reach M13), there is an AOT survey of the bridge from 1938 (AOT). Photographic documentation from the Vermont Agency of Transportation and this study has been compared to the original survey (Figures 12, 13). This shows that ~6 feet of degradation has occurred at this site, where bridge footings are either exposed, or suspended several feet above low water level. There are active headcuts upstream of the bridge, the pools are filled with soft unconsolidated sediment, and there is evidence of older and more recent channel avulsions. Instability migrates downstream, and the area downstream of the bridge has had 5 artificial grade control structures (boulder riffle-lines) installed by Sugarbush Ski area as part of a natural channel design remediation project. This project may be at risk. Oral history and physical evidence was also used to estimate degradation. Indicators of degradation included culverts and exposed bridge footings. The bridge and culvert surveys conducted by volunteers and investigators showed many culverts and bridges with scour holes on the downstream side. Mr. Turner has commented that bedrock has been exposed in the last 35 years upstream of the confluence with Shepherd Brook (Cahoon, personal communication 2002). In this area, the VT ANR has documented degradation, they wrote: “By 1985 DEC was observing indicators of extreme streambed degradation, or a lowering of the streambed elevation. The most important indicator was that much of the bank armoring that had been installed 2 feet below streambed was now totally exposed and the streambed in several locations was as much as 1.5 feet below the bottom of the blanket; a change of up to 3.5 feet in less than 15 years! Much of the rip rap was failing as a result. The excessive gravel excavation was threatening to destroy much of the hundreds of thousands of dollars in investment in bank stabilization done just a few years before.” (VT ANR, February, 1999).
FINAL DRAFT JUNE 3, 2003
45
Figure 12: Degradation at Route 100 Bridge upstream of Waitsfield. 1938 shows bed elevation and low, mean and high water levels. Ph1998 from Vermont Agency of Transportation. 2002 shows increased degradation, note staff gage for scale. Middle pier [not in photo]
FINAL DRAFT JUNE 3, 2003
46
Table 21: AOT Survey Of Degradation in the Mad River Valley
SA58 Village covered bridge sheet 3 (no #) USGS benchmark at 698.24 on left abutment upstream
669.5’
1941 674.5
+5 scour pool
1941 – 1981
covered bridge SAB7113 sheet 14 of 18
674 1973 674 thalweg
+4.5
1941 - 1973
BR 175, RTs 100, Charles Folsom Brook, sheet 10 of 14,
749’ 1971 747 -2 1971 - 1981
FINAL DRAFT JUNE 3, 2003
47
6.3 PEBBLE COUNTS Pebble counts were conducted at riffles on 3 streams in the southwestern part of the watershed with drainage areas of ~5 sq. mi. Figure 13 shows a decrease in diameter (d) of particles less than or equal to <d30 on Clay Brook. This stream is listed on the ANR impaired waters (303-D) list as degraded due to sediment.
Riffle Pebble Count, B axis-100 pebbles-Mad River Tributaries ~5 sq. mi. Drainage Area
1
10
100
1000
d15
d20
d25
d30
d35
d40
d45
d50
d55
d60
d65
d70
d75
d80
d85
d90
d95
mm
.
Clay Brook Stetson Brook Austin Brook
Figure 13: Pebble Count: Three watersheds. Note decrease in size less than D30. SECTION 6.4 CHANNEL CONSTRICTION WITH INFRASTRUCTURE Data on bridge or culvert width was measured in the field by professionals and volunteers (Figure 14), or derived from VT Agency of Transportation database using parameter titled “length of maximum span” which goes from abutment to abutment (Figure 15). Cross sections and bridges were measured within the same reach, but not at the same location. Cross sections were surveyed away from the influence of bridges or culverts. Figure 15 shows that in the majority of cases, the channels were significantly constricted by either bridges or culverts.
FINAL DRAFT JUNE 3, 2003
48
Comparison of Bridge/culvert Width and Bankfull Width by Reach
0
10
20
30
40
50
60
70
80
Mill Broo
k
Mill Broo
k
Pine B
rook
Shepa
rd
Shepa
rd
Mad R
iver
Stetso
n
Breach
ed P
ond B
rook
Dowsv
ille
Linco
ln
Mad R
iver
Shepa
rd
Mill Broo
k
Doctor
s
Freeman
Bradley
Weld
er
High Brid
ge B
rook
Austin
Bradley
High Brid
ge B
rook
Dowsv
ille
Weld
er
Linco
ln
Freeman
trib (
Just
Brook)
Breach
ed P
ond B
rook
Breach
ed P
ond B
rook
Carpen
ter fa
rm tri
b
Hungry
horse
trib o
f Linc
olnRice
(feet
)
BRIDGE/CULVERT WIDTH
BANKFULL WIDTH
Figures 14 and 15: Comparison of Bridge/Culvert and Bankfull Width, sorted by width of structure. Where dotted line intersects vertical bars, the structures do not constrict the channel. Where dotted line is above the
bars, the structure constricts the channel at bankfull flows. The majority of structures are smaller than bankfull width. Bankfull width was measured in each reach.
AOT Bridge Database: Bankfull Width compared to Length of Maximum Span
0
20
40
60
80
100
120
140
160
(feet
)
Length of Maximum Span BankfullWidth
FINAL DRAFT JUNE 3, 2003
49
SECTION 7.0 RESULTS OF QUALITATIVE GEOMORPHIC ASSESSMENTS 7.1 RAPID GEOMORPHIC ASSESSMENT: (RGA) The RGA rates a stream for four variables: widening, incision, change in planform and aggradation. The Rapid Habitat Assessment (RHA) based on EPA’s Rapid Bioassessment Protocol (EPA, 1999) results were collected for most reaches to measure physical and biological parameters. Streams that receive lower scores are more unstable, results are summarized in Tables 22 and Figures 16 - 18. Appendix D contains complete data. Table 24 summarizes the method of adjustment for the unstable reaches. In the tributaries, the channels are aggrading and changing planform. The mainstem is adjusting primarily through widening and aggradation. Lower scores indicate increasing instability.
Table 22: Results of Rapid Geomorphic Assessment; Number of Reaches by Category
Rating Poor Fair Good Reference Good/Reference
Rating RGA-MAINSTEM 5 8 8 5 50%
RGA-Lower Tributaries 1 13 27 5 70%
RGA-Upper tributaries 2 17 5 2 27%
TOTAL RGA 8 38 40 12 53%
Volunteer RGA Tributaries 8 13 12 7 48%
RHA MAINSTEM 0 17 4 0 19%
RHA-Lower Tributaries 0 21 19 0 47%
RHA-Upper Tributaries 0 25 0 0 0%
TOTAL RHA 0 63 23 0 27%
Mad River Mainstem: Results RGA and RHA
0.000.100.200.300.400.500.600.700.800.901.00
M1
M2
M3
M4
M5
M7
M8
M9
M10
M11
-A
M11
-B
M12
M13
M13
-B
M14
M15
-A
M15
-B
M15
-C
M15
-D
M16
-A
M16
-B
M19
M20
M21
M22
M23
Figure 16: Mainstem Results of Rapid Geomorphic Assessment (columns) and Rapid Habitat Assessment (lines). Score of 0 means not assessed for RHA
FINAL DRAFT JUNE 3, 2003
50
Mad River Lower Tributaries: Results RGA and RHA
0.000.100.200.300.400.500.600.700.800.901.00
M10-S
1.1
M10-T
4.1
M10-T
4.3
M11-S
1.1
M11-S
1.3
M11-S
3
M11-S
4.1.1
M11-T
6.1
M11-T
6.2
M12-T
7.1-S
1
M12-T
7.1-S
3
M12-T
7.1-S
4.2
M12-T
7.2
M12-T
7.3-S
1
M12-T
7.5
M15-T
8.1
M15-T
8.2-B
M15-T
8.3
M16-T
9.4
M5-S1
M5-T1.4
M7-T2.2
M9-T3.1
-S1
Upper Tributaries Mad River: Results RGA and RHA
0.000.100.200.300.400.500.600.700.800.901.00
M16
-T9.
1
M16
-T9.
2
M16
-T9.
2-S
1
M16
-T9.
3
M16
-T9.
3-S
1
M16
-T9.
3-S
2
M17
-T10
.1
M17
-T10
.2
M18
-T11
.2
M18
-T11
.2-S
1
M18
-T11
.3
M19
-T12
.1
M19
-T12
.2
M19
-T12
.2-S
1
M19
-T12
.2-S
2
M19
-T12
.2-S
3
M19
-T12
.2-S
4
M19
-T12
.3
M20
-T13
.1
M20
-T13
.2
M20
-T13
.2
M20
-T13
.3
M20
-T13
.4
M22
-T15
.1
M22
-T15
.1-S
1
M22
-T15
.2
Figure 17: Tributary Results of Rapid Geomorphic Assessment (columns) and Rapid Habitat Assessment (lines). Score of 0 means not assessed for RHA
Table 23: Results of RGA, Methods of Adjustment for reaches with scores <0.64 (fair/poor) Method of Adjustment Degradation Aggradation Widening Planform Upper Tributaries n=19 0.56 0.46 0.52 0.46 Lower Tributaries n=14 0.49 0.53 0.61 0.37 Mainstem, n=13 0.63 0.35 0.33 0.37
FINAL DRAFT JUNE 3, 2003
51
SECTION 8.0 SUMMARY OF RESULTS: PHYSICAL FEATURES FEMA floodplain maps have traditionally only defined the limit of inundation along the mainstem and some tributaries, but do not adequately represent hazards from fluvial erosion. Many of the hazards throughout the watershed are related to the surficial geology and geomorphology of the watershed. Other potential causes of hazard are due to anthropogenic disturbances and adjustments in the channel, including incision, widening, change in planform, aggradation and bar development. The following tables summarize the physical features that can be used to assess riverine erosion and landslide potential.
FINAL DRAFT JUNE 3, 2003
52
Table 24: Summary Of Physical Features PARAMETER RESULT Road density Stream density
2.1 miles per square mile 0.97 miles per square mile
Total # of tributary mass failures 87 Tributaries with highest # of mass failures
Clay brook =21 mass failures = 3.57 per square mile DA Stetson Brook =17 mass failures = 3.44 per square mile DA
Total # of mainstem mass failures 7 Density of mass failures Density: 94 mass failures in 144 sq. mile watershed =
0.65 mass failures per square mile 72 on west side tributaries = 1.32 per square mile DA 15 on east side tributaries = 0.42 per square mile DA
Channel Avulsions:
Total sites with channel avulsions = 51 of 99 cross-sections Mainstem = 10 sites Tributaries = 41 sites
Cut-off chutes:
Total with cut-off chutes = 52 9 mainstem sites , 43 tributaries
Headcuts or steep riffles =
Total =24 headcuts 4 mainstem sites, 20 tributary sites
Bedrock Control along mainstem in lower watershed Mile 0 – mile 16
14 locations with bedrock control, average 0.88 per river mile
# Mainstem dams 2 (Algonquin, Warren (to be removed in near future), 1(USGS low-head dam)
4 large washed out dams –1927 flood 1 -Waitsfield, 2-Moretown Village, 1-Lovers Lane # of streams with active alluvial fans = 7
Pine, High Bridge, Un-named, Clay d/s snow-making pond, Hungry horse trib of Lincoln, Austin, Stetson
Flood Plain Encroachment:
35 cross-sections had roads adjacent, 4 had improved paths.
Total # of feet rip-rapped along mainstem between Waitsfield and Moretown, 1973 and 1976
12,465 feet
Total # of miles surveyed in detail Total # of miles surveyed in detailed cross-sections (17.7 miles): Total erosion length Mainstem = 7,410 feet Lower tributaries = 5,860 feet Upper tributaries = 13,415 feet
Lincoln M10-T4.1 Shepard M11-S1.1Un-named, North road
FINAL DRAFT JUNE 3, 2003
55
SECTION 9.0 RESULTS: VOLUNTEER DATA Volunteers completed 40 reach assessments on 44 miles of 14 tributaries. Complete results of volunteer assessments are in Appendix L. Results are summarized in Table 28. The primary method of adjustment in poor/fair rated streams (<0.65) was degradation and widening.
Table 28: Summary of Volunteer data, Number of Reaches and Ranking RGA ranking Poor Fair Good Reference
Range 0-0.34 0.35-0.64 0.65-0.84 0.85-1 n = 40 8 13 12 7
Streams Austin Clay Freeman High Bridge Welder
Austin Breached Pond Clay Freeman Pine Welder.
RGA Adjustment
method (<0.65) n=21
Channel Degradation
Channel Aggradation
Over-Widened Channel
Changes in Planform
Mean 0.35 0.42 0.33 0.43 Median 0.35 0.40 0.25 0.40
9.1 RESULTS: VOLUNTEER DATA VS. PROFESSIONAL DATA Volunteers participated in a pilot project to test the Phase II ANR draft protocols for river assessment. Volunteers received one-half day of instruction in the field and an evening classroom session on the surficial geology of the basin and a truncated version of the Phase II draft protocols (ANR 2001). Volunteers correctly identified, and placed on topographic maps features such as mass failures, channel avulsions, bedrock control and scour at the downstream end of culverts and bridges. This footwork was critical to understanding the watershed, tagging the potential problem areas and areas that were in good shape. Volunteers correctly noted and located most of the features on the map description sheet. Perhaps as a result of their knowledge of the area and as a result of the training, most features were correctly located. Areas that were mapped with high concentrations of mass failures, channel avulsions and bank failures were visited by the author. The volunteer effort provided an invaluable contribution to the study because people supplied information based on their long-term experience in the area. In a watershed of this size, volunteers gave us ‘notice’ of areas that required further investigation. The map description sheets were accurate, and provided useful data. The results of 30 Rapid Geomorphic Assessments (RGA) (Figure 18) obtained by volunteers were compared to results obtained by professionals. The results show that the RGA’s are inconsistent, except if volunteers have received extensive training. For example, the Clay and Lincoln Brook assessments were done by volunteers who work in the River Management Section of the Vermont Agency of Natural Resources and compare well with the assessments performed by the authors.
FINAL DRAFT JUNE 3, 2003
56
Figure 18: Comparison of Volunteer and Professional RGA. See text for discussion.
Compare Volunteer/Professional RGA
0.00
0.35
0.70
M10-T
4.1
M10-T
4.3
M11-S
4.1
M11-S
4.2
M11-T
6.1
M12-T
7.1-S
4.2
M12-T
7.3
M16-T
9.1
M16-T
9.3
M16-T
9.4
M17-T
10.2
M18-T
11.3
M19-T
12.2
M22-T
15.2
M5-T1.4
Volunteer Professional
FINAL DRAFT JUNE 3, 2003
57
SECTION 10.0 DISCUSSION 10.1 DISCUSSION OF METHODOLOGY: In 2001, the Vermont Agency of Natural Resources initiated protocols for collection of fluvial geomorphic data. The Protocols are being field-tested and reviewed. This study followed the Phase II and some of the Phase III protocols, and the Phase I protocol provided baseline information collected concurrently with the field study. In the future Phase I data should be finished prior to Phase 2 data collection. If that is not possible, than Phase I should be limited to a delineation of like reaches, drainage areas, channel slopes, sinuosity and other parameters best suited to remote sensing. The mainstem and tributaries were divided into like reaches that were up to 4 mi. in length although most averaged around 1 mile. Within 'like reaches’ hazard potential can vary. Historical data and previous studies are critical in identifying areas of potential hazard. Studies that are being done for creating hazard maps should conduct a detailed assessment near the mouth of tributaries. The “like reach” approach permits the first reach to be miles long. The mouths of tributaries are geomorphically active. The size of the delta bar, the presence of alluvial fans, or channelized former alluvial fans and other parameters are good indicators of potential instability within the watershed. This was the approach taken on the study completed on the Third Branch of the White River in 2001 (Barg, 2002) If the assessments are done upstream of the tributary mouth, bedrock control, and other factors may be present which makes it harder to see how the channel is responding to impacts further up in the watershed. The Phase II assessment doesn’t include some important parameters. Additional data to be collected includes length, height and material of mass failures, channel slope within the reach being surveyed, specific location of flood plain encroachment. The pebble count provides important information. It is recommended that the pebble count methodology used by the ANR Bio-monitoring section (i.e., 50 pebbles in a riffle) be adopted for the Phase II protocols. Rapid assessment data needs to be supplemented with surficial geologic mapping, topographic analysis, aerial photo interpretation, detailed mapping of surface waters (including ephemeral and intermittent streams) and historical data. The combination of detailed surficial geologic mapping and remote sensing combined with field work and assessments of hazard areas can be used to identify potential hazards. Prior to field work, it would help if channel migration zones were mapped from aerial photos along the mainstem and lower reaches of major tributaries was completed. The Rapid Geomorphic Assessment needs to be re-visited. The RGA was based on MacRae’s Rapid Geomorphic Assessment. MacRae’s approach (CWP, 1999) which normalizes the RGA within the watershed being assessed. ANR’s approach is based on a scale ranging from 0 – 20 that is similar to the Rapid Bioassessment protocols (EPA, 1999). This requires that the reach is placed within one of four categories. This places a limit on the interpretation that allows a ranking that may not adequately describe the processes occurring in the watershed. The MacRae approach is normalized within the watershed, so that the presence/absence of certain physical features does not skew the ranking, as features that are not present are removed from the denominator. The downside to this is that it would prevent inter-basin comparisons. The Phase II protocols lack the ability to adequately describe all bed sediment storage bars. For example, there are bars in tributaries, formed upstream of bedrock constrictions that do not fit any of the bar descriptions. They are not points, deltas, or transverse bars, but need another name to describe them. Further discussion on methodology is in Appendix M.
FINAL DRAFT JUNE 3, 2003
58
10.2 DISCUSSION OF RESULTS: A limitation of the study is the amount of available personnel to cover a 144 square mile watershed in one field season. 17.7 miles of cross-sectional reaches were examined in detail, 26 miles of mainstem were paddled or walked, volunteers walked 44 miles of stream, and professionals walked over 40 miles of tributaries. Four geologists walked streams noting mass failures, bedrock control, channel avulsions and other stream features. Although the point data is limited, the extensive field work in the watershed and previous studies has filled in some of the blanks between assessment points. A drive-by survey of the watershed which was conducted in the spring, when the water was high, and before the leaves were on the trees, was critical in getting a sense of the watershed. The active involvement of citizen volunteers, the road crews, Town personnel and others is necessary for the success of a study of this magnitude over one summer of field work. It is suggested in the future that volunteers conduct the bridge and culvert assessment, and document observable features such as mass failures, mid-channel bars, bank failures, channel avulsions etc, using photos and maps. The Phase I approach of dividing the stream into like reaches often meant that reaches could be up to two miles long. Despite the level of analysis, there are still many gaps. Detailed examination of particular areas should be conducted if any change in land use is anticipated. The selected parameters are divided into three categories (Table 29) 1) Quantitative Studies, 2) Physical Features and 3) Human Impact. The results from these three categories are augmented by the results from the qualitative Rapid Geomorphic Assessment and can be used to produce the final maps of landslide hazard and riverine erosion potential. A more detailed discussion of each parameter is presented in the following sections.
Table 29: Parameters Selected for Determining Erosion Potential Quantitative Studies Physical features Human impact
• Bridge And Culvert Widths Compared To Bankfull Width,
• Number, Length and Height of Mass Failures,
• Channel Avulsions, • Headcutting And Other
Signs Of Recent Degradation,
• Alluvial Fans, • Channel Evolution
Model Based On Both Physical Features And Cross-Sectional Analysis.
• Flood History
• Flood Plain Encroachment,
• Gravel Mining, • Channel Management
Including Dredging, Straightening And Bar Scalping,
• Rip-Rap, • In-Stream
Impoundments, • Bridge And Culvert
Assessments, • Changes In Hydrology
Due To Land Use 10.2.1 QUANTITATIVE STUDIES: 10.2.2 HYDROLOGIC/LAND USE CHANGES: The flood frequency analysis which divided the period of record in two showed that for more frequent bankfull flows showed that the discharge increased by approximately 7% (1965 – 2001) when compared to the first half of the period of record (1927 – 1964). When the information on hydrologic change, including increase annual peaks during the 1990s, is combined with the quantitative cross-sectional analysis of width, depth and cross-sectional area, it indicates the dimension of some of the smaller tributaries (less than 10 sq. mi.) is in adjustment. An investigation into pre-1960s and current land use and road density could be used to determine changes in forest, agriculture and impervious cover. This
FINAL DRAFT JUNE 3, 2003
59
would help to answer the question on if land use or road density is contributing to hydrologic change. A second line of evidence that the streams are adjusting due to changes in hydrology from changes in land use is found in the paired watershed analysis in progress on the east side of Mount Mansfield. This study shows that there is almost a 40% increase in flow on an equal area basis from the West Branch of the Little River draining a ski area, as compared to the forested Ranch Brook watershed (USGS, 2002). Hydrologic changes occur from ski areas. Shanley and Wemple (2002) write “Further, ski trails and service roads delivered rain and snowmelt more efficiently to stream channels than adjacent permeable forest soils. On the other hand, compaction of snow on ski trails by skiers and by trail grooming activity may have offsetting effects, causing snow to melt more slowly and delaying runoff. In addition, machine-made snow is intrinsically more dense and also tends to melt more slowly. For example, at a ski area in New Hampshire, complete snowpack loss occurred nineteen days later on slopes with snowmaking than without snowmaking. ….Unlike natural snow, machine-made snow is intrinsically dense, and thus tends to melt more slowly.” Although a limited study of the increase in precipitation with elevation has been made in the West Branch and Ranch Brook watersheds (Musselman, 2003). More research is needed to help determine other factors that can be contributing to the difference in runoff. At the Sugarbush ski area, stream flow and snow-making data was examined for the 2001 and 2002 season. It showed average use of water to make snow of 0.6 cfs in snow-making during that ski season. The snow-making in Sugarbush is an out-of-basin transfer of water from the Sugarbush snow-making pond, which takes water from the 46 sq. mile watershed at the weir and sprays it on the ski slopes where it runs off into the Clay, Chase, Slide, Lockwood and Rice Brook tributaries. Shanley and Wemple conducted their study during the same period that was investigated for snow-making in the Sugarbush Ski area, the 2000-2002 season. They write: “During the 2001 snowmelt period, unit area flows were higher for West Branch than for Ranch Brook during the initial melt but became nearly equal for the 2 sites as snowmelt progressed toward peak flow…It should be noted that snow conditions in the winter of 2001 worked to minimize potential effects of development on differences in flow in the two basins. An unusual abundance of natural snow led to far less machine-made snow produced than in a typical year. Percentage-wise, machine-made snow made up very little of the snowpack and melting of the natural snowpack dominated both watersheds. Yet, the high diurnal peaks on May 1-4 and the sustained flow differential throughout May clearly showed that the snowpack persisted at West Branch and contributed meltwater to streamflow for a much longer time than at Ranch Brook. These results are consistent with the findings of Chase, discussed earlier, of synchronous hydrograph peaks (both watersheds peaked on April 24), and of Fallon and Bartsen of sustained melt runoff later into the spring.” The high road density of 2.1 mi/square mile in the Mad River basin is more than double the stream density and enough to cause hydrologic change. This figure does not include driveways and other private roads, which can be located on steep slopes and can direct flow onto public roads. During the 1998 flood, damage was concentrated along roads. Road ditches decrease the time of concentration during floods enabling water to reach the stream channels more rapidly. Forman (1998) writes: “In short, roads accelerate water flows and sediment transport, which raise flood levels and degrade aquatic ecosystems..… Increased peak flows in streams may be evident at road densities of 2–3 km/km 2.…In southeastern Ontario, the species richness of wetland plants, amphibians/reptiles, and birds each correlated negatively with road density within 1–2 km of a wetland. Road density is an overall index that averages patterns over an area.” 10.2.3 WIDTH/DEPTH RATIO: A width/depth ratio >28 indicates over-widened streams with limited ability to effectively transport sediment. In these wide, shallow channels, the sediment is deposited in a haphazard way causing more
FINAL DRAFT JUNE 3, 2003
60
erosion and widening. The cross-sectional analysis showed that 67% of mainstem sites and 33% of tributaries have width/depth ratios >28. Mass failures on the tributaries contribute to over-widening. An analysis that overlays the mass failures, the over-widened reaches and the proximity of roads to the stream channel is recommended for future work. A comparison of the width/depth ratios on the Mad River and the 136 sq. mi. Third Branch of the White River watershed, which abuts the Mad River Basin on the southeastern portion of the watershed, was conducted. There are fewer outliers on the Third Branch tributaries under 10 sq. miles in size. These figures indicate that the smaller streams in the Mad River basin are adjusting. The tributary outliers in the Mad River Basin - Clay Brook and Dowsville Brook - have both incurred recent land use change. Clay Brook drains the Sugarbush Ski Area, and Dowsville had a large clear-cut. Both flow through glacio-lacustrine deposits. The annual cross-sectional surveys conducted for 11 years on Reach M10 by the Vermont Agency of Natural Resources showed that since the reduction of active gravel mining that the width/depth ratios are generally decreasing. This indicates that the stream is in the process of re-developing a channel that will be able to effectively transport both water and sediment. The Mad River valley has many bedrock gorges, both on the mainstem and the tributaries. These gorges constrict the channel. The bedrock constrictions reduce the velocity causing sediment to be deposited. Upstream of these gorges aggradational areas often develop with channel avulsions and large sediment deposits within the channel leading to channel widening. Downstream of the constriction, both scour and deposition are found. Along the mainstem of the Mad River widening is found upstream of the Moretown, Lovers Lane, Algonquin, Ward swimming hole and Warren gorges/dams. Downstream of the Moretown gorge is a growing mid-channel bar. Landforms indicating former pond sites that were upstream of the breached dams at Lovers Lane (Figure 19), and Moretown gorge are evident. In the tributaries, there are many areas with upland sediment storage.
Figure 19: Pond above Lovers Lane Dam, pre –1927 flood. Reach M2
Bedrock constriction also affects the geometry of the pools and size of the sediment within the pools. Thompson and Hoffman (2001) studied pool geometry and sorting characteristics of 145 pools in New England that were influenced by channel constrictions. They conclude that “pool depth is significantly influenced to a decreasing degree by pool exit-slope width, constriction gradient, constriction width, drainage area, upstream channel width, and the exit-slope expansion ratio.” The presence of large organic debris (LOD) in a river system impacts channel width and depth. A study of LOD in Vermont streams counted LOD that was at least 10 cm. in diameter caused “channels to widen
FINAL DRAFT JUNE 3, 2003
61
and deepen upstream and downstream of the LOD. LOD also affects the spacing of pools and riffles. As previous research suggested pooling upstream from LOD causes rapid widening and deepening of the channel, decreasing sediment transport capabilities and increasing deposition.” Thompson (1995). An important, and basic issue in fluvial geomorphic analysis is the accurate recognition of bankfull features. This researcher underestimates bankfull in grassed channels, and often adjusts bankfull heights using slope breaks and other indicators in channels with grass banks. Grass has extremely good root-binding capacity, and edge of vegetation is not an accurate indicator of bankfull elevation in grassed channels. Grassed channels are found as far down the mainstem as reach M3. Therefore, it is important that field work identify all features that may indicate bankfull, and that the results are compared, if available, with gage data from the USGS. Faulty identification of bankfull in grassed channels will affect the width/depth ratio. 10.2.4 ENTRENCHMENT RATIO/ BANK ARMORING: Only one-third of the mainstem sites have flood plain access. Approximately two-thirds of the cross-sections show the stream is degrading. The mainstem is in adjustment. The mainstem, especially between Moretown and Waitsfield, has been rip-rapped for much of its length. The hard armor, gravel mining, road density, increased velocities downstream of undersized bridges and culverts, changing land use and accompanying hydrologic change in the watershed are likely contributing to the incision and the high percentage of cross-sections in the watershed that are entrenched. About one-third of the tributaries less than 10 sq. mi. in drainage area have flood plain access. 31% of the tributaries with flood plain access have channel slopes greater than 4%. These steep streams with flood plain access may be due to a variety of factors including: glacial history, underfit streams, channel avulsions and woody debris jams which can cause channel avulsions and increase sediment storage upstream which is associated with channel widening. Of the 31 cross-sections surveyed with slopes >4% only four (13%) had a width/depth ratio <12 and meet Rosgen’s (1996) criteria for A type streams. Eight of these steep streams were over-widened with width/depth ratios greater than 30. Similar proportions were found on studies in other Vermont watersheds (Barg and Springston, 2000, Barg, 2001) 10.2.5 VERTICAL DEGRADATION: The entrenchment ratio is related to vertical degradation in the watershed. Although there is bedrock control, including 6 gorges, along the mainstem of the Mad, there is evidence of up to 6 ft. of vertical degradation since 1938. The mainstem, from Shepherd Brook to upstream of Waitsfield village, has only 1 place with bedrock control. This degradation combined with the entrenchment ratio, width/depth ratio and results of the Channel Evolution Model indicate that the mainstem is in adjustment. Likely causes are the extensive rip-rap, channelization and gravel mining that has occurred, as well as the increased runoff and decreased infiltration due to land use change and the resulting hydrologic changes that are currently occurring. The result of this vertical degradation is the removal of flood plain access for the river. This increases stream power and velocity and causes streams to degrade and widen in order to reach a stable bankfull dimension.
FINAL DRAFT JUNE 3, 2003
62
10.2.6 PEBBLE COUNTS: It is recommended that in future studies that measurements of 100 pebble B-axis data is collected on a statistically significant sample of smaller streams with similar drainage areas, or that pebble counts be conducted at all sites. Preliminary results show that with diameters less than d30 the pebble diameter is reduced by approximately one-third in size in unstable streams. The smaller pebble size in the smaller size fraction of the bedload indicates increased embeddedness, and increased finer sediment load, probably from eroding banks, mass failures, or hydrologic changes mobilizing more sediment from within the channel. These studies parallel the result of a similar investigation on the mainstem of the Third Branch of the White River upstream and downstream of the confluence with tributaries, one stable and one unstable which also indicated that in sizes less than d30 the particle size diminishes in unstable streams (Barg, 2002). 10.2.7 ROSGEN UNSTABLE STREAM TYPE: In the Mad River Basin 12 mainstem cross-sections and 15 tributary cross-sections were classified as either Rosgen F or G stream types. Rosgen defines F stream types as “…laterally unstable with high bank erosion rates.” and G stream types as “...unstable, with grade control problems and high bank erosion rates” (Rosgen, 1996). The G type tributaries in the lower watershed are usually reaches that were straightened, probably during the 19th century. These narrow, entrenched streams, generally flow through wetlands, and the grass riparian buffer has relatively strong root-binding capacity. The F stream types are entrenched and are likely to widen and create a new flood plain at a lower elevation. They are often in Stage 2 of the Channel Evolution Model (Schumm). Simon and Kuhnle (2002) summarize: “Although the Rosgen (1985) stream classification system is widely used to describe channel form, stream types D, F, and G are by the author’s own definitions, unstable (Rosgen, 1996, p. 4-5). These stream reaches, therefore, would be expected to produce and transport enhanced amounts of sediment and represent impacted, if not impaired conditions.” B type streams are generally viewed as a stable stream type, but in the Mad River valley, streams that flow through glacio-lacustrine deposits on Dowsville and Clay Brook for example, were extremely sensitive to changes in hydrology and were actively adjusting their dimension, profile and planform. 10.2.8 CHANNEL EVOLUTION MODEL: The channel evolution model (Schumm, 1984) is determined by combining physical features and cross-sectional analysis. The channel evolution model is based on processes that are occurring within the channel and can be related to suspended sediment and bed-material movement, fish community structure, rates of channel widening and density and distribution of riparian vegetation (Simon and Kuhnle, 2002) Over half of the mainstem sites, one-third of the lower tributaries and almost half of the upper tributaries are in Stages 2,3 or 4, incising, widening or stabilizing at a lower elevations. Along the mainstem and tributaries several factors are contributing to the degradation and widening (Stage 2 and 3 of the channel evolution model) including: channel straightening, road density, channelization through the use of rip-rap, changes in hydrology as seen in the flood frequency analysis, breaching of the snow-making pond and changes in sediment transport capacity due to the weir by the snow-making pond, lack of woody riparian vegetation and gravel mining. The tributaries generally have woody riparian vegetation, and have not experienced gravel mining. Smaller watersheds often have a longer response time to stabilize after a flood event. 10.2.9 BRIDGE AND CULVERT WIDTHS COMPARED TO BANKFULL WIDTH This study included a preliminary assessment of bridges and culverts. The Town of Warren is currently completing a detailed survey of town culverts, to date, there are over 400 that have been measured, and mapped on a large scale map. The majority of bridges and culverts surveyed are undersized. Undersized infrastructure is associated with many problems including scour on the downstream side, aggradation
FINAL DRAFT JUNE 3, 2003
63
upstream, increased flow and velocity through the structure and associated bank failures downstream. A study for the Vermont Geological Survey found that approximately half of all flood damage could have been avoided, much of it is associated with undersized culverts and bridges (Stone Environmental, 1998). There are a few bridges that are not undersized, such as, the covered bridge built on Pine Brook in 1870 after the flood of 1869. This bridge did not incur any damage during subsequent floods of 1927 and 1998. Other bridges and culverts in the watershed that are sized to allow for flood-prone width have withstood high return frequency events. In reaches that are entrenched, bridges sized for bankfull width will adequately transport flow. The use of larger culverts, ½ bridges, or open-bottom culverts with a minimum of bankfull width would reduce possibilities of future flood damage. Bridges or culverts located at a meander bend should probably be 1.5 times average bankfull width to prevent channel constriction (Melville, 2000). The bridges built by the Green Mountain Forest Service on Stetson Brook and Shephard Brook (downstream of the confluence with Deer Brook) are wider than bankfull width, but they were built on alluvial fans, and are at risk because the stream channel changes position. The bridge on Shephard was washed out during the flood of 1998. The road downstream of the Stetson Brook bridge was washed out, although the bridge held, and there was aggradation upstream of the bridge (Jaquith, 1999). Appendix A lists the areas that were damaged during the 1998 flood. 10.3 PHYSICAL FEATURES: 10.3.1 NUMBER, LENGTH AND HEIGHT OF MASS FAILURES: Slope failures and mass failures occurred in all types of unconsolidated deposits, especially basal till, ice contact and lacustrine deposits. Most failures seem to be initiated within the unconsolidated deposits and do not go to the bedrock. Tributaries that flow through valleys with glacio-lacustrine deposits are especially sensitive. The presence of mass failures is often accompanied by channel widening and channel avulsions from the sediment being deposited in the channel. Of the 94 mass failures mapped, the majority are on the tributaries, with only seven on the mainstem. The high concentration of mass failures on the tributaries may be associated with roads, the presence of glacio-lacustrine deposits, and changes in hydrology. The highest concentration of mass failures is found on Clay Brook, which flows through glacial Lake Granville deposits. This watershed has experienced extensive land use change including out-of-basin transfer to the tributaries from snow-making (water from the mainstem is pumped up to tributaries and then flows back into Mad), high road density and a snow-making pond which breached during the 1998 flood. The active stream bed degradation in this watershed due to changes in hydrology is also a likely factor. Different surficial deposits fail differently, rotational mass failures occur in somewhat cohesive sediments and typically drop in elevation, but remain cohesive, with trees and other vegetation remaining upright, but at lower elevations. These failures can be relatively stable if they are not further disturbed by cutting of the toe by the river. Coarse lacustrine sediments fail by slumping. Channel widening is associated with mass failures. Clay and Stetson Brooks, which had the highest concentration of mass failures, also had width/depth ratios >30 indicating over-widening. The presence of roads increases the occurrence of mass failures (Swanson and Dyrness 1975, Beschta 1978). While erosion is a natural process, the increased sediment load generated by landslides associated with roads can disrupt aquatic eco-systems and impact channel morphology. In forested areas, logging roads produce more erosion and sediment yield than the areas that are logged. Road ditches typically deposit finer sediment in streams. Fine sediment increases turbidity, while the mass failures provide coarse sediment. (Forman, 1998)
FINAL DRAFT JUNE 3, 2003
64
Another study of landslides in a research forest in Puerto Rico documented an increased landslide frequency that “was 2.4 times higher than the average rate, indicating that within 100 m of a road, associated landslide disturbance is significant.” The sediment load generated from the mass wasting increased the sediment load by a factor of 6 per square kilometer of watershed (15 tons to 94 ton annual increase). The sediment generated from mass wasting constituted a significant portion of the total annual export of sediment (Larsen, 1995). Further research comparing proximity of roads, or road density and mass failures in Vermont should be done. The research cited above shows that between 25 – 85% of the sediment exported from the watershed can be due to mass wasting near roads. Both the Great Brook watershed in Plainfield, Vermont (Barg and Springston, 2000), Adams Brook watershed in Randolph Vermont (Barg, 2001), and Stetson Brook in the Mad River watershed show extensive mass failures on streams that parallel roads. The mass failures on the Great Brook are falling-stage dominated failures and were likely caused by channelization of the stream, and the location of the road in a narrow valley; while the Adams Brook failures primarily are due to changes in hydrology from road development in the watershed. The failures along Clay Brook also appear to be due to changes in hydrology and high road density (Table 30), while those in Stetson Brook may be due to the road sharing a narrow valley with the stream (similar to the Great Brook watershed).
Table 30: Road Density of Small Watersheds Stream Number of Road
Miles Size of Watershed
(sq. mi) Road Density
(miles per sq. mi.) Clay Brook (includes Rice) 22.05 5.87 3.76 Lincoln Brook 11.38 7.67 1.48 Stetson Brook 2.72 4.94 0.55 Austin Brook 1.98 4.86 0.41 (VCGI roads coverage) 10.3.2 CHANNEL MIGRATION ZONE/ ALLUVIAL FANS: The channel migration zone was mapped by George Springston of Norwich University using aerial photography along the mainstem upstream of Waitsfield to Warren from 1965 to 1995 (prior to the 1998 flood). Lateral migration is concentrated upstream and downstream of channel constrictions, either bridges, or bedrock. The maximum movement shown on the overlays is ~150 feet. The areas that are migrating are relatively limited, especially when compared to channel migration zone on the Third Branch of the White River (Barg, 2001). Aerial photo overlays over the longest time sequence possible would help define channel migration zones along the mainstem. From Waitsfield downstream, the channel has been rip-rapped for much of it’s length, and flood chutes, channel avulsions and some oxbows have been filled in because of the value of the agricultural land along the mainstem. Research by Thomas (2001) on channel migration on the Winooski showed that channel migration ranged from 1.7-3.5 meters per year from 1802-1869, and that since reforestation of the uplands, channel migration rates have dropped to a rate of 0.8 m. per year. Similar results have been documented in Missouri with the clearing of the Ozark Plateaus (Jacobsen, 1997). The Mad probably experienced similar movement, which may have led to channel straightening along many of the tributary mouths when they meet the valley created by the mainstem of the Mad. It appears that much of this channel straightening was done in the 19th century, probably as the valley was settled, streams were “tamed” to maximize agricultural fields. The most recent tributary mouth to be straightened was Shephard Brook after the 1973 flood. Along the tributaries, channels are migrating most actively in alluvial fans, upstream and downstream of channel constrictions and woody debris jams. Prior to straightening the channels in the 19th century near
FINAL DRAFT JUNE 3, 2003
65
the confluence with the mainstem, the streams changed course more frequently. Some of these straightened streams have low width/depth ratios and are entrenched. Infrastructure located in an alluvial fan can create a problem. As mentioned earlier, the US Forest Service bridges on Shephard Brook (near the confluence with Deer Brook, and Stetson Brook are located on alluvial fans. The bridge on Shephard appears to have been rebuilt by the Green Mountain National Forest after the 1998 flood. More detailed topographic mapping on a smaller contour interval (<10 ft) would help to distinguish alluvial fans, and former channels. 10.3.3 CHANNEL AVULSIONS: Channel avulsions along the mainstem and some tributaries are concentrated upstream of bedrock channel constrictions. They can also be initiated by large woody debris jams during floods damming the existing channel. Along the mainstem downstream of Waitsfield, several factors have likely contributed to channel avulsions including: recent degradation between 3-6 feet documented at several locations, a lack of forested riparian buffer; and loss of the root-binding capacity as the stream has degraded below the root binding capacity of the vegetation. Channel avulsions have been filled in after floods downstream of the village of Waitsfield. South of the Village of Waitsfield, the channel avulsions are primarily found upstream of bedrock and bridges that constrict the channel. The breaching of the snow-making pond adjacent to the mainstem has contributed large sediment loads to the stream, deep pools are almost entirely filled by very loose unconsolidated sediment. 10.3.4 HEADCUTS: Within the stream, headcutting can be initiated through channelization, gravel mining, constriction of flow, concentration of flow by roads, trails and ditches, steepening of gradient and energy slope, increased discharge, decreased sediment load, decreased vegetation cover, disturbance of bed armor. Degradation in the mainstem can result in tributary rejuvenation (Schumm et. al, 1984). Headcuts migrate rapidly during storm events and have been known to move more than ½ a mile during single storm events (CWP, 1999a) The most active headcuts in the mainstem are located between Waitsfield and Warren. The most active mainstem headcut is found upstream of the Lareau Park above the bridge. Artificial grade control was placed at several locations in the stream downstream of this bridge, but headcuts continue to occur upstream of this recently restored reach. Bedrock and large boulder control is effective at limiting upstream migration of headcuts. The lowest score for degradation in the tributaries was found in the lower reach of Shephard Brook, which was straightened after the 1973 flood. Shepherd Brook which was channelized after the 1973 flood has active headcuts upstream of the straightened area where lake bottom clays are exposed in scour pools. Clay Brook in the upper watershed shows active degradation, channel widening and changes in planform due both to channelization and channel avulsions. 10.3.5 FLOOD HISTORY: FEMA and NRCS Emergency Watershed Protection reports from the 1998 flood and historical records provide important information on where potential hazards may occur. All sources of information including Town Annual Reports, interviews with road commissioners, FEMA, NRCS, newspaper and other historical information needs to be consulted for the creation of erosion potential maps. In Warren, Lincoln Brook, Clay Brook, Stetson Brook and Fuller Hill experienced flood damage in part as a result of channelization of flow due to roads or undersized culverts. The past is not the ‘key to the future’ in rapidly developing watersheds. A local historian, Earline Marsh has conducted research on flood and landslide history is found in Appendix B and C, this information provides further resources for creation of
FINAL DRAFT JUNE 3, 2003
66
a landslide hazard and riverine erosion potential map. 10.4 HUMAN IMPACT 10.4.1 FLOOD PLAIN ENCROACHMENT: On both the mainstem and tributaries, there are 11 cross-sections where development occurs adjacent to the channel. Further work to overlay the 100 year floodplain, as mapped by FEMA, along the mainstem will show which houses are located within the 100 year floodplain. This includes houses located immediately adjacent to channels, two of which are located on bedrock at the outside of meander bends. Two houses on the mainstem between the Punch Bowl and Butternut gorge and a house downstream of Waitsfield school are adjacent to the Mad River. On the tributaries, there are houses on Lincoln, Stetson and other brooks which are located adjacent to the channel. The “Like Reach” approach is too broad for looking at flood plain encroachment from a riverine erosion perspective. Particular sites within these reaches need to be mapped. Infrastructure located at the outside of meander bends, above and below gorges (where streams aggrade) need particular attention. A house downstream of Butternut gorge (upstream of the confluence with Folsom Brook) was located where the river moved ~100 feet during the 1998 flood. The well casing from this house is now exposed towards the right bank of the Mad River. 10.4.2 CHANNEL MANAGEMENT: In-stream management includes dredging, straightening and bar scalping. Although gravel mining has been reduced in the watershed, gravel mining continues to occur. ANR cross-sectional study on the mainstem reach M10 that experienced heavy gravel mining has a decreasing width/depth ratio indicating the channel is developing the ability to adequately transport sediment. The flows that were once spread out in a wide and shallow channel caused sediment to be deposited haphazardly which caused further widening and channel braiding are now being contained in a narrow channel. Gravel mining may causes what is known as the “hungry water syndrome”. A river has a certain amount of energy that it uses to move both water and sediment. When the sediment is removed through gravel mining, the stream balances it’s energy by removing gravel from other locations, usually the bed and banks (CWP, 1999a). This causes degradation and widening according to the Channel Evolution Model (Schumm, 1984). The rapid degradation on both the mainstem is attributed by VT ANR (Feb. 1999) to be in part a result of gravel mining. Despite attempts to eliminate it, illegal gravel mining has continued to occur on the mainstem (Cahoon, personal communication 2002). Hard armoring of the banks using rip-rap has been extensive along the mainstem and some of the tributaries. The channelization and rip-rap has included some channel straightening. Straight channels are not in adjustment in terms of planform, meander belt width, radius of curvature etc. The hard armoring of streambanks, and confinement of the channel can remove roughness, increase velocity, lower sinuosity, and increase flows causing increased damage downstream of the hard armoring. In King County Washington, for example, new structures are not permitted to be protected by bank armoring as this transfers the problems downstream (King County, 1998). 10.4.3 IN-STREAM IMPOUNDMENTS: Both mainstem and tributary dams have washed out and not been rebuilt. Instream impoundments and dam sites pose potential hazards when they breach and release large volumes of water and sediment rapidly into the channel (Costa, 1998). The Lovers Lane, Moretown and many other dams (Appendix C) failed during the 1927 flood and were not re-built. The most recent large impoundment to fail is the Sugarbush snowmaking pond. It has been breached three times since it was built in 1995. Damage includes headcutting at the upstream end of the pond, and avulsions of the channel into the pond and deposition of sediment at the weir. The intake structure is creating a depositional area and sediment trap which needs constant maintenance or avulsions will continue to occur (Cahoon, personal communication, 2002).
FINAL DRAFT JUNE 3, 2003
67
During the 1998 flood, the snow-making pond on Clay Brook and a private pond on Lincoln Brook failed causing damage downstream when the sediment load was released. In 2001, an un-named tributary, M11-S4, had a private pond that breached. Due to the low-flow of the drought year the sediment plume (Figure 20) from this failed pond was evident for several days as it moved downstream. Small weirs are located on several tributaries including Slide, Chase, and a Mill Brook Tributary (T7.1-S3) and a flume is located on Clay Brook.
Figure 20: Sediment plume in Mad River from breached pond on un-named Tributary M11-S4. Low-flow conditions on Mad River. 10.4.4 QUALITATIVE ASSESSMENTS The Rapid Geomorphic Assessment supports the findings of the quantitiative studies in the broad picture. The results show that 73% of the cross-sections in the tributaries in the upper part of the watershed were unstable, while in the lower tributaries only 30% were unstable. On the mainstem, half of the cross-sections surveyed were unstable. One problem with the Rapid Geomorphic Assessment is that streams that are geomorphically stable, but have high degrees of movement (such as braided rivers, and alluvial fans) are designated as unstable. The results can be used to reduce the construction of infrastructure within the channel migration zone to reduce future flood damage. In the tributaries, the channels are aggrading and changing planform. The mainstem is adjusting primarily through widening and aggradation. These are the processes that typically follow degradation. Sear (1996) describes many fluvial geomorphic features that are both indicators of stability and instability. Professional judgment needs to be applied in an assessment of the watershed to determine if the processes that are occurring are natural or not.
FINAL DRAFT JUNE 3, 2003
68
SECTION 11.0 GEOLOGIC/GEOMORPHIC SENSITIVITY Geology and geomorphology are the foundation of the watershed, but land use impacts hydrology and stream dimensions. In the Mad River basin, glacial Lakes Granville, Winooski and Mansfield all filled the Mad River Basin to progressively lower elevations. The coarse lacustrine deposits are highly erodible. Hydraulic loading can occur at the contact between overlying coarser sands and gravels and fine lake-bottom silts and clays and cause failures. The highest mass failure in the watershed is on Dowsville Brook in lake bottom clays, but other large failures occur on ice-contact and alluvial deposits. The geologic sensitivity of the watershed is exacerbated by human activities such as road building, flood plain encroachment and channel constriction through construction of undersized bridges and culverts which can lead to catastrophic failure. The tributaries of the Mad River basin are the most sensitive and show the most adjustment in dimension and profile. Tributaries typically take longer to respond to floods (Patton, 1998). The selected features from this study mentioned in this report can be linked with a GIS database to create a map of the watershed overlaying features that contribute to riverine erosion and landslide potential. Cross-sectional and quantitative data used for creating maps of riverine erosion should meet the higher standard. Overlays of the parameters selected in this report can give a preliminary idea of areas that are geologically sensitive and geomorphically active. The information obtained can be used to reduce flood damage through planning and zoning, creation of factor of safety setbacks, restricting development in areas that are prone to catastrophic failure, or managing stormwater for dispersal, rather than concentration of flow.
FINAL DRAFT JUNE 3, 2003
69
SECTION 12.0 FUTURE STUDIES There are some specific topics that could use further study. Previous work in Washington state and Puerto Rico studied the relationship between landslides and roads. As the Vermont database builds, this could be done here as well. Results from previous work on the Great Brook in Plainfield, Vermont, the Third Branch of the White River watershed in Central Vermont and the Mad River watershed could be used to determine the relationship between mass failures, road density, proximity of streams to roads, and other watershed characteristics. This could be incorporated in a larger analysis of Rosgen stream type, channel evolution stage, and Rapid Geomorphic Assessment scores. Over 200 mass failures have been mapped in these three watersheds, with Adams Brook and Gilead Brook in the Third Branch of the White, Great Brook, and Stetson and Clay Brooks in the Mad River watershed all having high concentrations of mass failures. Another topic that needs further study is the collection of sufficient data to have a statistically significant sample to look at the change in the finer size fraction of pebble counts in riffles of watersheds with approximately the same drainage area. In watersheds that are adjusting their dimension and planform, the pebble count data, and the decrease in the size of the finer size fraction could be an indicator of streams that are adjusting more rapidly. Both on the mainstem and tributaries, much of the sediment that is trapped upstream of bedrock constrictions stays there. There are many places throughout the watershed where large amounts of sediment are stored in the tributaries in this fashion. De-stabilizing these tributaries through land use change could contribute large amounts of sediment to the mainstem. Sediment transport in the tributaries is another avenue for further study. A sediment budget could be developed to examine the amount of sediment generated by the mass failures as was done in Puerto Rico by the USGS. Finally, the flood frequency analysis indicates an increase in the more frequent return floods. A comparison of land use prior to 1960 and current land use would help determine the significance of land use and road density as contributing factors.
FINAL DRAFT JUNE 3, 2003
70
SECTION 13.0 CONCLUSIONS It is difficult to make generalized conclusions when working on a 144 square mile watershed which extends from the summits of some of the highest Vermont mountains down into valleys filled with deposits from several glacial lakes. The watershed also has a long history of land use change. However, with that caveat, some general conclusions can be drawn. While there is a 74 year stream gaging record on the mainstem, there is no similar record on the tributaries or upper watershed. However, there are several different lines of evidence that point to hydrologic changes occurring within the watershed, and specifically to rapid adjustment in some headwater tributaries. These include: the increase in more frequent flood flows; the recent increase in peak flows; the channel evolution model; and the hydraulic geometry curve (Figure 10) which shows outliers in some basins that are under 10 square miles. Some of the headwater tributaries are in rapid adjustment. Small headwater streams are more sensitive to changes in sediment discharge and changes in land use than larger rivers. The majority of the mainstem reaches are entrenched and have high width/depth ratios. This indicates that the mainstem is in adjustment as well, and that bank failures are likely to continue to occur as the stream begins to move towards Stage 4 of the channel evolution model. Bedrock and surficial geology are critically important in a watershed-level analysis. For example, a comparison of the data gathered from the 136-square-mile Third Branch of the White River watershed, flowing south from Roxbury to Bethel and the adjacent 144-square-mile Mad River watershed, flowing north from Warren to Moretown was presented to the Vermont Geological Society (Barg, 2003). These watersheds have similar drainage areas, mainstems of approximately equal length, are located on the east side of the Green Mountains, and had valleys formerly occupied by glacial lakes – Winooski and Granville in the Mad River basin and Hitchcock in the Third Branch basin. The east side of the Mad River basin and the west side of the Third Branch basin are underlain by the Ottaquechee and Stowe formations. Both mainstems have been heavily mined for gravel in the past, and both have had extensive rip-rap along the mainstem. These watersheds differ in the amount of bedrock control and in surficial geologic characteristics. For example, in the first 16 miles of the mainstem on the Mad River, there are 14 locations with channel-spanning bedrock control. On the mainstem of the Third Branch, there are only two locations with bedrock control in the same distance. The bedrock control has limited incision and degradation on the Mad, while the Third Branch has incised into the unconsolidated lacustrine and alluvial deposits along the mainstem. The glacial history of the valleys has a profound effect on the geomorphology. For example, the varves from glacial Lake Hitchcock can be as much as 1.5 meters in thickness, showing large annual sediment inputs into the Third Branch, while narrow laminated clays are typically found along the mainstem of the Mad River. Clay is much more difficult to erode than sand or gravel deposits, and clay can act as grade control in some small streams because of its resistant to erosion. Although tills can have clay/silt matrices, they have a mix of other grain sizes. Tills can be more susceptible to erosion than massive clay because of this. Clays also fail differently than sands. Clays are more cohesive and tend to fail as rotational block failures, while sand slumps. Clays and sands have different hydraulic conductivities, clays can serve as an aquitard and cause hydraulic loading, affect groundwater movement and mass failures differently than more homogenous well-drained sands. The type and depth of different surficial deposits has been mapped as a companion to this study. This will provide critical information. There are many more mass failures along the mainstem of the Third Branch (26 mass failures) in the deep glacio-lacustrine sediments, than along the mainstem of the Mad (7 mass failures). In the Mad River, most of the failures are along the tributaries (87 mass failures), and particularly along the tributaries with high elevation glacio-lacustrine deposits and higher road densities. The depth of surficial deposits and the amount of sediment in the watershed are influenced by the time the lake occupied the valley and the drainage history of the lake. Lakes that drained more rapidly carried more sediment out of the valley.
Comment: This sentence isa non-sequiter.
FINAL DRAFT JUNE 3, 2003
71
The Third branch does not have any high-level glacial lakes, while the Mad River has glacial Lake Granville at ~1410 feet, and yet un-named small high-level glacial lakes in high valleys including along Dowsville brook, where the tallest mass failure (~170 ft.) is found at 1010 ft.. The tributaries in the southwest section of the Mad, especially Clay, Stetson, Austin and Lincoln brooks are extremely sensitive. They contain alluvial fans at breaks in slope throughout the watersheds. They have high elevation, deep glacio-lacustrine deposits, they have high road densities, or roads adjacent to the channel, and a micro-climate due to the orography that can trap storms. The streams that drain the Sugarbush ski area have had the hydrology altered by the contribution of additional water from an out-of-basin transfer from snow-making and water withdrawals for drinking water from Clay Brook . The differences in surficial geology and bedrock control have caused the mainstem and tributaries to respond differently to similar impacts from in-stream channel management and land use history. The bedrock, valley shape, surficial geology and hydrology are the fundamental basin characteristics that shape how the stream responds. Recent impacts occur from land-use change and changes in hydrology within the watershed and in-stream management. In-stream management includes the presence of in-stream ponds, or ponds that are adjacent to the stream. For example, the snow-making pond has breached three times since it was built, and several in-stream headwater ponds have failed in the last five years. There is a change in sediment transport capacity at the weir by the snow-making pond that impacts the Mad River both upstream and downstream of this structure. Another human impact to the watershed is the prevalence of under-sized culverts and bridges. The majority of the bridges and culverts surveyed were narrower than bankfull width. This has two potential impacts on the rivers, downstream of the structure there is scour due to the increased velocities, and sediment can be deposited upstream of the under-sized structure. Other human impacts include the straightening, dredging or rip-rapping of a large portion of the mainstem and some of the tributaries near the confluence with the mainstem.
FINAL DRAFT JUNE 3, 2003
72
REFERENCES Ackerly, S.C., and Larsen, F.D., 1987, Southwest-trending striations in the Green Mountains, central
Vermont: in Westerman, D.S., ed., Guidebook for New England Intercollegiate Geological Conference 79th meeting,, Trip C-1, p.370-382.
Annual Reports, Towns of Moretown, Duxbury, Waitsfield, Fayston, Warren. Barg, L, Springston, G., 2001, Assessment of Fluvial Geomorphology in Relation to Hazards from
Riverine Erosion and Landslides in the Great Brook Watershed, Plainfield, Vermont: prepared for Vermont Geological Survey.
Barg, L, 2002, Assessment of Fluvial Geomorphology in Relation to Hazards from Riverine Erosion and
Landslides in the Third Branch of the White River Watershed, Central Vermont: prepared for Vermont Geological Survey.
Barg, L. 2003, A Paired Watershed Approach to Two Large Vermont Watersheds. Abstract. Vermont
Geological Society. Barnes, H. A. 1967, Roughness Characteristics of Natural Channels USGS: Water Supply Paper 1849
http://manningsn.sdsu.edu/manningsnabstract.html Barre Daily Times: Vermont Thursday, November 10, 1927. Beschta R. 1978, Long-Term Patterns Of Sediment Production Following Road Construction And
Logging In The Oregon Coast Range: Water Resour. Res. 14:1011–1016. Birkeland Karl W. 1996, The Effect of Ski Run Cutting and Artificial Snowmaking on Snow Water
Accumulation at Big Sky Area, Montana: Proc. Western Snow Conf. 137 -146. Bloom, A., 1978, Geomorphology, A Systematic Analysis of Late Cenozoic Landforms: Prentice Hall,
NY, 510 pp. Bragg, Anna Bixby 1898, Fayston Centennial Celebration. Brown SA. 1982, Prediction of channel bed grade changes at highway stream crossings: Transp. Res.
Rec. 896:1–11. Cahoon, Barry, 2002, Vermont Agency of Natural Resources Stream Alteration engineer. personal
communication. Center for Watershed Protection et. al, 1999a,. Impact Assessment of Instream Management Practices on
Channel Morphology: Prepared for Vermont Geological Survey. Center for Watershed Protection et. al, 1999b, Watershed Hydrology Protection and Flood Mitigation
Center for Watershed Protection, Nov. 8, 2000, Memo #6 Results of Biomonitoring/Watershed
Imperviousness Assessment: Vermont Geological Survey. Costa, J., 1998, Floods From Dam Failures in Flood Geomorphology: edited Baker, V.T, Kochel, R.C.,
Patton, P.C., 1998 491 pp. Wiley. Czaplinski, R. et. al., 1995. The Best River Ever, A conservation plan to protect and restore Vermont’s
FINAL DRAFT JUNE 3, 2003
73
beautiful mad river watershed. Friends of the Mad River. 188 pp. Denny, C.S., 1982, Geomorphology of New England: U.S. Geological Survey Professional Paper 1208,
18p. Dingman, S. Lawrence, 1994, Physical Hydrology: Prentice-Hall 575pp. Dingman, S. Lawrence, 1981, Elevation: A Major Influence On The Hydrology Of New Hampshire And
Vermont: Vermont Geological Survey, 1:250,000. Environmental Protection Agency, 1999, Rapid Bioassessment Protocols for Use in Wadeable Streams
and Rivers: 841-B-99-002. Fallon, Kathleen, S.. Barten, Paul K. 1992, A Study of the Natural and Artificial Snowpacks at a New
Hampshire Ski Area: unpublished M.F.S research project, Yale School of Forestry and Environmental Studies.
Federal Emergency Management Agency Disaster Survey Reports. Federal Emergency Management Agency 1977, Flood Insurance Study, Town of Warren, Vermont
Washington County. Federal Emergency Management Agency 1981, Flood Insurance Study, Town of Waitsfield, Vermont
Washington County. Federal Emergency Management Agency 1984, Flood Insurance Study, Town of Moretown, Vermont
Washington County. Federal Emergency Management Agency Flood Insurance Rate Maps, Waitsfield, Warren, Moretown,
Vermont. Forman, Richard T. T., Alexander, Lauren E . 1998, Roads And Their Major Ecological Effects: Annu.
Rev. Ecol. Syst. 1998. 29:207–31. Goodnough, X.F., 1928, “Rainfall in New England During the Storm of November 3 and 4, 1927,”
Journal of the New England Water Works Association, v. XLII, No. 2, pp. 150–187. Green Mountain National Forest, 2001, Unpublished research, Kathleen Donna. Hatch, N.L., Jr., 1988, Some revisions to the stratigraphy and structure of the Connecticut Valley trough,
eastern Vermont: American Journal of Science, v. 288, p.1041-1059. Heinz Center for Science, Economics and the Environment. 2002, The State of the Nation’s Ecosystems:
Measuring the Lands, Waters, and Living Resources of the United States: www.heinzctr.org/ecosystems.
Hemenway, Abby Maria, 1882, Vermont History Gazetteer.Volume 4 Fisk, Rev. P.B.: Floods in Waitsfield . Hill, Roger, 7/10/02, Meteorologist, personal communication.
FINAL DRAFT JUNE 3, 2003
74
Hornbeck, J. W., et al, 1993, Long-term Impacts of Forest Treatments on Water Yield: A Summary for
Northeastern USA: Journal of Hydrology, 150 (1993) 323-344. Hornbeck S. & Stuart G., 1976, When Ski Trails Are Cut Through Forestland, What Happens to
Streamflow?: Ski Area Mgmt. 34. Jacobs, E.C., 1950, The physical features of Vermont: Vermont Geological Survey Bulletin. Jaquith Shayne, February, 1999. Effects of Natural and Human Driven Watershed Disturbance on
Sediment Concentrations in Streams of Central Vermont. Unpublished Master’s Thesis. Antioch New England 30 pp.
Johnson, L.B., 1928, Vermont in Floodtime: Roy L. Johnson Co., Randolph, Vermont, 209pp. Keim, Barry, 12/10/02, New Hampshire Meteorologist, personal communication. King County Sensitive Areas Ordinance; 1998, www.metrokc.gov/ddes/lusd/chan_mig.htm Channel
Migration Hazard Areas. King County Sensitive Areas Ordinance; 1998, www.metrokc.gov/ddes/lusd/chan_mig.htm Channel
Migration Hazard Areas. Larsen, F.D., 1972, Glacial history of Central Vermont: in Doolan, B.L. and Stanley, R.S., eds.,
Guidebook for New England Intercollegiate Geological Conference 64th meeting, p.297-316. Larsen, F.D., 1987, Glacial Lake Hitchcock in the Valleys of the White and Ottauquechee Rivers East-
Central Vermont: in Westerman, D.S., ed., Guidebook for New England Intercollegiate Geological Conference 79th meeting, p.214-237.
Larsen, F.D., 1987b, History of glacial lakes in the Dog River valley, Central Vermont: in Westerman,
D.S., ed., Guidebook for New England Intercollegiate Geological Conference 79th meeting,, Trip B-4, p.214-236.
Larsen, M.C., 1995, How wide is a road? The association of roads and mass wasting in a forested
montane environment: Puerto Rico [abs] American Geophysical Union, EOS Supplement, v. 76, no. 17, p. S309.
Leopold, Luna, 1978, Water in Environmental Planning: W. H. Freeman 817pp. Ludlum, D.M., 1996, The Vermont Weather Book: Vermont Historical Society, Montpelier, 300p. Marsh, Earline, Waitsfield Telecom. 1996, 1997, 1998, 1999, 2000, 2001, History sections. Mayo, Mike, 2003, March 3, Mountain Water System Operator. Phone conversation. McCabe, Gregory, Wolock, David. 2002, A step increase in streamflow in the conterminous United
States: Geophysical Research Letters December 24, 2002 http://ks.water.usgs.gov/Kansas/pubs/reports/dmw.grl.v29.html.
Melville, B., Coleman, S.E., 2000, Bridge Scour: Water Resources Publications LLC 550pp. Montgomery, D., and Buffington, J., 1997, Channel-reach Morphology in Mountain Drainage Basins:
Geological Society of America Bulletin; v. 109; no. 5; pp 596–611.
FINAL DRAFT JUNE 3, 2003
75
Musselman, K.N., 2003, Analysis of Spatial Variability of Precipitation and Snow Accumulation on
Mount Mansfield, Stowe, Vermont: Abstract. The Green Mountain Geologist. Vermont Geological Society, V. 30 #2, pp 10-11.
Natural Resource Conservation Service 1999, White River Watershed Assessment Third Branch Stream
Classification: 37 pp. Natural Resource Conservation Service. Streambank Hazard Mapping Report, December 3, 2001.
received from Reed Sims, Winooski, Vermont office. Unpublished. National Climate Data Center 1927, Chelsea station over total storm (5.5 in. over 24 hours). National Oceanic Atmospheric Administration, 1927, National Weather Service records for Northfield
Station, VT. Olson, S. A,. Flow-Frequency Characterisitics of Vermont Streams: Water Resources Investigations
Report 02-4238. 47pp. Patton, P.C., 1998, Geomorphic Response of Streams to Floods in the Glaciated Terrain of Southern New
England: in Flood Geomorphology: Baker, V.T.., Kochel, R.C., Patton, P.C., editors Wiley, 491 pp. Ridge, J.C., Besonen, M.R., Brochu, M., Brown, S.L., Callahan, J.W., Cook, G.J., Nicholson, R.S., and
Toll, N.T., 1999, Varve, paleomagnetic, and 14C chronologies for Late Pleistocene events in New Hampshire and Vermont, U.S.A.: Géographie physique et Quaternaire, v. 53, p.79-107.
Rosgen, D.L., 1985, A classification of natural rivers: Catena, 22, 169-199. Rosgen D., 1996, Applied Fluvial Morphology: Wildland Hydrology Books, Pagosa Springs, Co. Schumm, S., 1984, The Fluvial System: John Wiley and Sons, New York. Schumm, S. Harvey, M. and Watson, C 1984, Incised Channels, Morphology, Dynamics and Control:
Water Resources Publication, LLC, 200 pp. Sear, D, 1996, The Sediment System and Channel Stability in River Channel Restoration: Guiding
Principles for Sustainable Projects: A. Brookes and F.D. Shields. Jr, editors Wiley and Sons, pp 148-177.
Shanley, James, Wemple Beverley, 2002, Water Quantity And Quality In The Mountain Environment
Vermont Law Review, Vol. 26:717, p 717-751. Simon and Kuhnle, 2001, “Reference” and Enhanced Rates of Suspended Sediment Transport for Use in
Developing Clean-Sediment TMDL’s: Examples from Mississippi and the Southeastern United States: USDA Agricultural Research Service, National Sedimentation Laboratory, Oxford, MS 12pp.
Soil Conservation Service 1978, Soil Survey of Orange County Vermont, United States Department of
Agriculture 92pp. Spencer, Fred, 2003, personal communication. Waitsfield weather observer. Steffen, Lyle. 2002, Natural Resource Conservation Service. Flood Frequency Analysis. Using Army
Corps of Engineers http://www.hec.usace.army.mil/publications/index.html program. Unpublished. Stewart, D.P., and MacClintock, P., 1969, The surficial geology and Pleistocene history of Vermont:
FINAL DRAFT JUNE 3, 2003
76
Vermont Geological Survey, Bulletin 31: Montpelier, 251p. Stone Environmental Inc., 1998, Final Report for Watershed Hydrology Protection and Flood Mitigation:
Phase I: prepared for Vermont Geologica l Survey. Streamside Sentinel, 2001, Vermont Agency of Natural Resources. 12pp. Research/Editor Lori Barg. Strong, A.M., C.C. Rimmer, K.P. McFarland, and K. Hagen. 2002, Effects of mountain resorts on
wildlife: Vermont Law Review 26:689-716. Sugarbush Resort: Personal Communication, March 12, 2003, with Mike Blazewicz, Friends of Mad
River. Swanson and Lienkamper, 1978, Physical Consequence of Large Organic Debris in Pacific Northwest
Streams: Pacific Forest and Range Experiment Station, Portland Oregon Swanson FJ, Dyrness CT. 1975, Impact of clear-cutting and road construction on soil erosion by
landslides in the western Cascade Range, Oregon: Geology 3:393–96. Thomas, P. A., 2001a, The Nineteenth-Century Alluvial Landscape in Vermont. 7pp. Unpublished field
trip guide, Peter A. Thomas, Richmond, Vermont. Thompson Douglas 1995, The Effects of Large Organic Debris On Sediment Processes And Stream
Morphology In Vermont: Geomorphology V no.11, pp 235-244. Thompson , Douglas M., Hoffman Kim S. 2001, Equilibrium pool dimensions and sediment-sorting
patterns in coarse-grained, New England channels: Geomorphology V.38 301–316. USGS Level II Scour Analysis (USGS) 1997-1998, Prepared in cooperation with Vermont Agency of
Transportation and Federal Highway Administration. Olson, S, Weber, M. USGS Open-File Report 98-272 , Town Highway 10 crossing Shepard Brook, Fayston, Vermont, 50pp. USGS Open-File Report 97-755, on Town Highway 1, crossing Shepard Brook, Fayston, Vermont.50pp.
USGS Flood Frequency Analysis for Vermont and New Hampshire, 1998. U.S. Geological Survey. 2000, National Landslide Hazards National Landslide Hazards Mitigation
Strategy Mitigation Strategy A Framework For Loss Reduction Open-File Report 00-450). USGS 2002, unpublished stream flow data Ranch Brook, West Branch Little River, Jamie Shanley,
USGS Montpelier, Vermont. Vermont Agency of Transportation, 2001, Bridge database from Pam Thurber. Vermont Agency of Transportation. July 29,1938, Waitsfield, McAllister Bridge. Detail of Abutment #2.
State 157l. Vermont Flood Survey Committee, 1928, Flood Loss and Damage Survey: Statement of Returns to
March 1, 1928: Montpelier. Vermont Department of Fish and Wildlife, June 1997, A Ten-Year Evaluation of the Effects of Ski Area
Development on Wild Brook Trout Populations in Vermont Streams. Vermont Department of Water Resources, 1962, Drainage Areas of Vermont Streams: Donald Webster. VT ANR, 1987 – 1998, Facilities Engineering Division. Unpublished Surveys. Received from John
FINAL DRAFT JUNE 3, 2003
77
Guilmette. VTANR Biomonitoring and Aquatic Studies Section, 1998, Water Quality Monitoring and Aquatic
Bioassessment Related to Logging Practices in the Dowsville Brook, Shepard Brook and Mill Brook Watersheds: October 1998.
VT ANR, Feb. 1999, Options for State Flood Control Policies and a Flood Control Program. VT ANR Dec. 1999, Status of Implementation of Agency of Natural Resources Flood Control Policies
and Programs. VT ANR, 2001 provisional, Vermont Regional Hydraulic Geometry Curves: Water Quality Division. VT ANR River Management Section, Vermont Geological Survey, Fish and Wildlife Division and Barg,
L., 2002, Draft Phase I Handbook Water Quality Division. VT ANR River Management Section, Vermont Geological Survey, Fish and Wildlife Division and Barg,
L., 2002, Draft Phase II Handbook Water Quality Division. VT ANR River Management Section, Vermont Geological Survey, Fish and Wildlife Division 2002,
Draft Phase III Handbook Water Quality Division. Wohl, E, 2000, Mountain Rivers: American Geophysical Union 320pp. Wolman, M.G, 1954, A Method of Sampling Coarse River Bed Material: Transactions American