82
Assessment of impacts of plantation drainage on the Kampar Peninsula peatland, Riau
Assessment of impacts of plantation drainage
on the Kampar Peninsula peatland, Riau
Assessment of impacts of plantation drainageon the Kampar Peninsula peatland, Riau
Report 1207384
Commissioned by
Wetlands International
under the projects
• Mitigating Impacts of Pulp on Peatlands (MIPP) funded by CLUA
• Sustainable Peatland for People and Climate (SPPC) funded by Norad
November 2015

Table of Contents
1 Introduction 91.1 This report 9
2 Peat loss, carbon emissions and subsidence rates in drained peatlands 112.1 Causes of subsidence after peatland drainage 11
2.2 Impacts of peatland subsidence 12
2.3 Peat loss after drainage is highest in the tropics and in deep fibric peat 12
2.4 Peat loss is not dependent on water table depth alone 14
2.5 Subsidence after drainage remains more or less constant for a long period 15
2.6 Peatland water management that maintains a high water table depth can reduce
subsidence only by a limited amount 16
2.7 Likely implications for the Kampar Peninsula 19
3 Landscape morphology and peat characteristics of the Kampar Peninsula 213.1 Elevation model 22
3.2 Peat thickness of the Kampar Peninsula 23
3.3 Peat characteristics 26
4 Land use on the Kampar Peninsula 30
5 The potential impact of drainage on subsidence and flood risk on the Kampar Peninsula 315.1 Landscape scale subsidence and flood risk assessment 32
5.2 The impact of drainage on subsidence and flood risk 33
6 The potential impact of drainage on carbon emissions on the Kampar Peninsula 436.1 The potential impact of drainage on fire occurrence on the Kampar Peninsula 44
7 References 46
Annex A - Details of Kampar subsidence assessment 50 Data on concession boundaries 51
Determining current development status of concessions 51
Annex B – Elevation model for the Kampar Peninsula 55
Annex C – Peat thickness and carbon stock model of the Kampar Peninsula 64 Peat thickness data and model 64
Carbon stock model 66
Annex D – Subsidence and flooding projections for the Kampar Peninsula 69 Flood risk types 69
Calculation and presentation of flood risk 72
Annex E – Additional sources of official HTI concessions 78

Assessment of impacts of plantation drainage on the Kampar Peninsula peatlands
4
To be cited as Hooijer, A., Vernimmen, R., Mawdsley, N., Page, S., Mulyadi, D., Visser, M., 2015.Assessment of impacts of plantation drainage on the Kampar Peninsula peatland,Riau. Deltares Report 1207384 to Wetlands International, CLUA and Norad.

Assessment of impacts of plantation drainage on the Kampar Peninsula peatlands
5
Preface Peat swamp forests in SE Asia have been subject to rapid conversion to drained land-uses, especially oil palm and Acacia plantations. Over the last decade increasing concerns have been raised about environmental issues linked to this development. These include loss of biodiversity and the very high CO2 emissions related to the oxidation of the carbon stored in the peat as well as the increased occurrence of fires in the desiccated peatlands. Fires occur every year but in very dry years - related to the El Niño - the number and duration of fires can take on disastrous proportions, with the resulting haze and smog blanketing substantial areas of SE Asia causing huge economic losses and impacting public health. However another environmental impact, soil subsidence, has received little attention so far in SE Asia, even though it has been well known from other peatland regions in the world since the 19th Century. This is especially of concern in lowland regions where land subsidence can bring the soil surface down to levels at which drainability and flooding become an issue. Eventually it can result in extensive loss of productive land.
Wetlands International has been advocating against unsustainable land-use developments in peatlands worldwide and for alternative sustainable peatland management, including the conservation and restoration of peatlands. We are particularly concerned about the degradation of the peatlands in SE Asia, in view of their high biodiversity as well as the disproportionately high GHG emissions. Our advocacy has contributed to increased awareness on these issues and over the last years resulted in significant steps by key players in the plantations industry and by the Indonesian government. These include commitments to halt expansion on peat and the adoption of more stringent policies for improved peatland management. However, peatland drainage is unsustainable, even under best management practice, and results in continued peat loss and thus carbon emissions and soil subsidence.
Wetlands International believes that the issue of peatland subsidence and related flood risks will only be taken serious if policy makers and land-use planners have access to appropriate science-based information. We have therefore commissioned Deltares to carry out a case study in the Kampar Peninsula, which in terms of its peat swamp qualities can stand as a prime example for many lowland peat swamps in Sumatra and elsewhere in SE Asia. It has been subject to forest clearing and plantation development by pulp-for-paper and palm oil companies. Over the last decades, substantial areas of the peninsula’s natural peat swamp forests have been clear-felled for these drainage-based land-uses. The question this study addresses is for how long this land-use can be continued given the inevitability of the subsidence of the peat soil under drainage.
Marcel Silvius
Head of Programme, Climate-smart land-use Wetlands International
Assessment of impacts of plantation drainage on the Kampar Peninsula peatlands 5

Assessment of impacts of plantation drainage on the Kampar Peninsula peatlands
6
Summary and Key Findings It has long been known that drainage of peatlands inevitably causes peat loss resulting in CO2 emissions and land subsidence. In turn, subsidence results in increased flood risk as the land surface falls below river and sea flood levels. These impacts have been well described and understood for many decades (Figure 1, Figure 4; Figure 5), and, for this reason, most countries have long ago stopped peatland conversion to agriculture and are now actively restoring some areas to nature in attempts to reduce emissions and flood risk. Indonesia and Malaysia are now the only countries attempting to convert peatlands to agriculture and silviculture at a large scale. The rate of carbon loss, and of associated CO2 emissions and land subsidence, is highly temperature dependent (Figure 2), and therefore proceeds at a faster rate in the tropics than in other climate zones (Table 1).
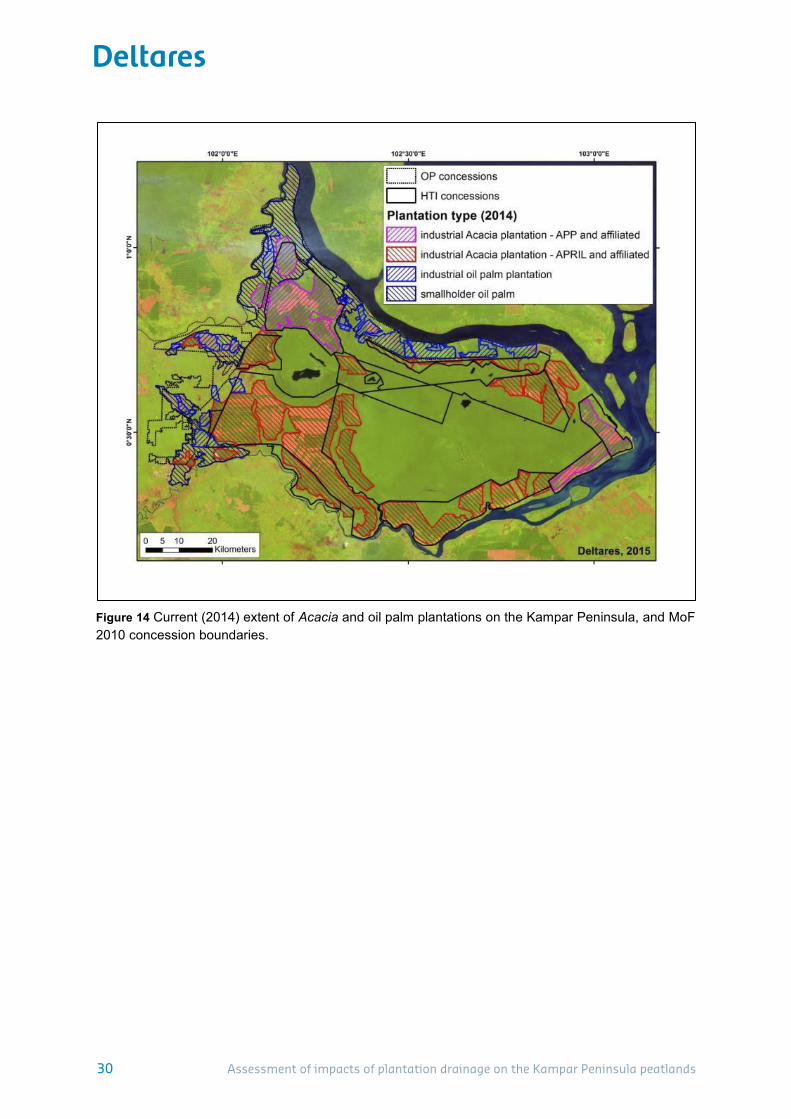
We demonstrate the rate of peat surface subsidence, increased flood risk and carbon emission for the Kampar Peninsula (KP) in Riau, Indonesia. An elevation model (DTM) was constructed from LiDAR data (Figure 7), and land use was determined from Landsat analyses and plantation concession data from the government (Figure 14). The elevation model was used to create a map of minimum peat thickness and carbon stock for the KP (Figure 9), assuming the base of the peat (i.e. where the underlying mineral soil layer starts) to be at 2 m above Mean Sea Level (MSL). This measure of minimum peat thickness can underestimate actual peat thickness by several metres, as the peat base is actually often around or even below MSL, as explained in this report (Figure 10).
The total KP study area of 674,200 ha is almost entirely covered by peat that has an average minimum thickness of 4.9 m (Table 4) and a more likely average thickness of ~7 m. By 2014, 294,227 ha (43.6 %) was converted to plantations (Table 4; Table 5), with the remainder still covered by peat swamp forest of reasonable to good quality. Three types of plantations are distinguished in this analysis: Acacia plantations (AP) for the pulp and paper industry (31.3 % of the KP area and 71.7 % of the total plantation area), industrial oil palm plantations (IOPP; 5.2 and 11.9 %) and smallholder oil palm plantations (SOPP; 7.2 and 16.4 %). These plantation types tend to be in very different settings in the landscape, with AP being on the highest elevations and the deepest peat (6.4 m +MSL and 4.5 m, respectively); SOPP closest to rivers at the lowest elevation that tend to have shallow peat (3.7 m +MSL and 2.8 m), and IOPP in intermediate positions (4.3 m +MSL and 3.2 m).
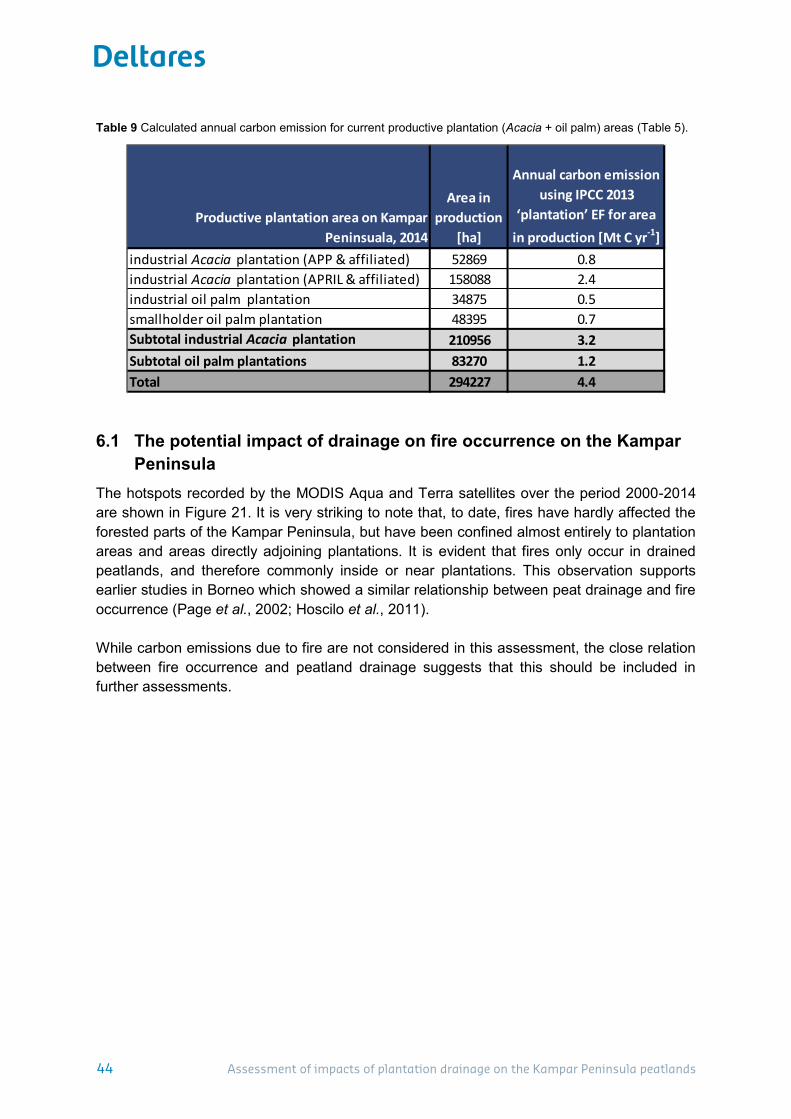
Current peat oxidation CO2 emissions from the KP, applying the average IPCC (2013) emission factor of 15 t C ha-1 yr-1 for plantations (Table 1), amount to 4.4 Mt C yr-1 for the KP as a whole. Separate emissions from AP, SOPP and IOPP plantation types are 3.2, 0.7 and 0.5 Mt C yr-1 respectively. The minimum carbon stock of the KP is 1.6 Gt C, 364 times annual total emission, indicating that major emissions can be expected to continue for decades to come if drainage continues. This emission number excludes the initial peat emission spike following drainage, as well as emissions outside of plantation areas that are caused by the lateral drainage effects of plantations as well as drainage by logging canals in remaining forest. The number also excludes fire emissions; a substantial omission considering that fires on the KP occur almost exclusively within plantation areas (Figure 21). Overall, the assessment of carbon emission can therefore be considered to be very conservative.
6 Assessment of impacts of plantation drainage on the Kampar Peninsula peatlands

Assessment of impacts of plantation drainage on the Kampar Peninsula peatlands
7
Current and future (with continued subsidence) flood risk was calculated using a High Water Level (HWL; Figure 15) that was determined from the level of river banks (RBL) along main tidal rivers (excluding blackwater rivers on the peat dome), and validated against tidal data for the area. The subsidence rate applied to the DTM is 3.5 cm yr-1, which corresponds with the IPCC (2013) emission factor of 15 t C ha-1 yr-1 for plantations assuming subsidence is caused by peat loss alone (if peat compaction also contributes, subsidence rate would be higher). The difference in elevation between plantation types is expressed in very different flooding regimes. SOPP are often already so low-lying (by 2014) that 39.2% (Table 6) are below HWL i.e. prone to flooding by river water. For AP this is only 5.1 %, whereas for IOPP an intermediate figure of 28.7 % is at risk of flooding. Extending the analysis into the future reveals that in 50 years, the difference between plantation types is still considerable at 74.1, 54.8 and 36.9 % for SOPP, IOPP and AP respectively, whereas after 100 years, 68.1 % of AP, 86.6 of SOPP and 86.9 % of IOPP are at risk of flooding. In the longer term the differences are further reduced as all plantations are expected to flood at some point in the future given the low average position of the peat bottom (around MSL). For Acacia plantations, the projection of future flood risk is considered conservative because the actual subsidence rates measured in such areas is found to be around 5 cm yr-1, even at water table depths of 0.7 m on average, which is considered close to ‘best management practice’. For smallholder oil palm plantations, on the other hand, it is possible that subsidence rates in shallow peat with frequent high water levels could drop towards 2 cm yr-1, which would mean that flood risk could increase at a somewhat lower rate than predicted. However this reduction would typically only happen after the flood risk was already high.
The precise flood regime to which areas at risk of flooding are exposed cannot be quantified for lack of local river water level data. But typical river level regimes in the region suggest that these areas may be assumed to be flooded at least every few years, for periods of months in the wet season. This will have an impact on plantation production that will decrease as floods intensify. It is expected that most plantations on the Kampar Peninsula peatland will be economically unviable at some point, but the timing of plantation abandonment is hard to predict as it depends on the mitigation measures taken and also on the tolerance of plantation managers to reduced productivity.
We recommend thorough site investigations and water level data collection to further quantify the current and future risks involved. Nevertheless, based on the current evidence we can conclude that - depending on the location in the terrain – most drainage-based land-use on peatland in the Kampar Peninsula will sooner or later become impossible, as the subsiding land will inevitably become subject to more frequent and prolonged flooding. We suggest that policy makers, businesses and small-holder farmers in Indonesia would be wise to consider peatland subsidence and increased flooding in their economic and land use decisions, as their counterparts do in other parts of the world.
Assessment of impacts of plantation drainage on the Kampar Peninsula peatlands 7
Assessment of impacts of plantation drainage on the Kampar Peninsula peatlands
8
Key Points
Peatland drainage for agriculture inevitably leads to rapid land surface subsidence and carbon loss, anywhere in the world, often followed by flooding.
Rates of subsidence and carbon loss in drained peatlands are temperature dependent and are highest in the tropics. Flood risk therefore also increases much faster in tropical drained peatlands that in other parts of the world.
Water management improvements can somehow, but not greatly, reduce rates of subsidence and carbon loss.
The peatland of the Kampar Peninsula (KP) is representative of peatlands elsewhere in Southeast Asia; it is dome shaped with a peat base located at or below river and sea flood levels.
Land surface subsidence caused by plantation drainage on the KP will cause a steady decline in drainability, and eventually in the surface being below river flood levels, resulting in increased flooding.
Already, 31 % of the plantation area on the KP is probably subject to drainability problems and/or flooding.
Within 25, 50 and 100 years, 71%, 83% and 98% of the existing plantation area is projected to experience drainability problems and/or flooding.
This will affect plantation productivity and may result in land abandonment. Smallholder OP plantations are first affected by flooding as they are situated at lower
elevations closer to the river, whereas Acacia pulp plantations tend to be situated at higher elevations where flooding problems will take longer to develop. However the end result for all these plantations will be the same regardless of crop or management type.
We recommend that land managers and policy makers should consider this increased risk of flooding in their economic and land use decisions.
8 Assessment of impacts of plantation drainage on the Kampar Peninsula peatlands
Assessment of impacts of plantation drainage on the Kampar Peninsula peatlands
9
1 Introduction Peatlands are wetland ecosystems formed by the accumulation of organic matter from partially decomposed vegetation over thousands of years in waterlogged conditions. As peat is not really a ‘soil’ in the normal sense but an unstable mix of water (90%) and partially decomposed vegetation remains (mostly carbon), it will inevitably disappear through decomposition when the water is drained and the peat exposed to air. Under such conditions, peat will rapidly oxidize and be lost as carbon emissions. These processes have been documented and studied scientifically in peatlands in all regions of the world including Indonesia, with peat oxidation through decomposition recognized as the major contributor to peatland subsidence following drainage (Stephens et al., 1984; Hooijer et al., 2012). Peatland subsidence has created challenges for continued agriculture in all peatland regions because it inevitably leads to a lowering of the land surface that results in a loss of drainability and often increased flood risk. These impacts threaten production and increase the risk that such peatland will be abandoned at some point in the future in an unmanaged degraded state.
These impacts are now of major relevance for Indonesia in terms of determining the most appropriate policies to manage its peatlands. Despite legislation introduced in 1990 to protect much of the country’s peatland with a peat depth deeper than 3m from drainage and development, most peatland in Sumatra and Kalimantan has since been cleared of forest and drained, irrespective of the peat depth, with millions of hectares developed for oil palm and Acacia pulp fibre plantations. In association with the expansion of canals and roads that have come with these developments, people have migrated into these sensitive areas, which previously were hardly populated. The earlier use of these peatlands - selective logging using light railway systems that involved no drainage - has been abandoned despite being considered relatively sustainable. The forest loss, fires and flooding that have accompanied these recent developments have had significant environmental and social impacts: on local communities, on businesses, and internationally as a result of haze episodes and globally significant emissions of greenhouse gases. However, the focus of discussion on peatland management has remained on haze and carbon emissions, perhaps in view of the immediate noticeable impacts of the haze and the major policy attention to climate change. The consequences of peatland drainage in terms of land subsidence and increased flood risk have been given very little attention, but will also give rise to considerable societal, economic and environmental impacts.
1.1 This report This report explores the question: for how long can the drainage-based land-use on the Kampar Peninsula peatlands be continued given the inevitability of the subsidence of peat soil under drainage? It considers the case of the Kampar Peninsula in Riau, Sumatra, a major area of peatland that is the largest and thickest single peat deposit in Indonesia, but which has seen rapid expansion of plantations in recent years.
These findings have implications not just for the Kampar Peninsula but also for national peatland policy with a focus on raised (ombrogenous, rain-fed) peatlands, which are the dominant peatland formation in Indonesia.
Assessment of impacts of plantation drainage on the Kampar Peninsula peatlands 9
Assessment of impacts of plantation drainage on the Kampar Peninsula peatlands
10
Findings are presented as follows:
Chapter 2 discusses the historical and global experience with peatland drainage and considers how the problems of peatland drainage – most notably land subsidence - have been studied and the key scientific lessons from this research.
Chapters 3 and 4 present a new assessment of the Kampar Peninsula landscape, its peat characteristics and current land use.
Chapters 5 and 6 present a projection of the impacts of peatland drainage and subsidence on the peatland morphology of the Kampar Peninsula and future drainability problems and flood risks, as well as carbon emissions.
In ANNEXES we provide detailed descriptions of technical analyses supporting this study.
10 Assessment of impacts of plantation drainage on the Kampar Peninsula peatlands

Assessment of impacts of plantation drainage on the Kampar Peninsula peatlands
11
2 Peat loss, carbon emissions and subsidence rates in drained peatlands
Peatlands in Europe and the USA have been drained for centuries in order to transform these wetlands into drier lands that can be used for agriculture. However, experience globally has shown that peatland drainage creates substantial long-term problems. Most significant are the high rates of land subsidence and subsequent flooding that accompany peatland drainage and that have long been widely accepted in mainstream science (Armentano, 1980; Fowler, 1933; Galloway et al., 1999; Hutchinson, 1980; Lindsay et al., 2014; Prokopovich, 1985; Stephens et al., 1984). Recognition of these problems has broadly led to the end of large-scale peatland conversion to agriculture during the mid to late 20th century in Europe and USA, in some cases followed by costly initiatives to return peatlands to wetlands and reduce emissions and other problems (e.g. Turrini, 1991; Cris et al., 2014).
Figure 1 Historical peat subsidence in the UK Fenlands. Left: Periods of rapid subsidence coincide with periods of major drainage. In recent decades subsidence has slowed down substantially because the land effectively became undrainable and was therefore returned to a state of near-natural water table depths, as pasture (for non-intensive summer grazing) and nature area. Right: The subsidence pole at Holme post photographed in 1913; the top of the pole coincides with the original peat surface level. Source: Hutchinson (1980).
2.1 Causes of subsidence after peatland drainage Subsidence during the initial period following drainage of peatland is mainly due to physical compression but over the longer-term, subsidence is dominated by the biochemical process of peat decomposition through oxidation that causes peat loss and also results in carbon emission to the atmosphere (Stephens and Speir, 1969; Schothorst, 1977; Gambolati et al,. 2003; Page and Hooijer, 2014). In fact, the peat loss process is so dominant after the first years beyond drainage that in carbon emission monitoring in Western Europe it is assumed to cause 100 % of subsidence beyond the first few years following drainage (van den Akker et al., 2008), and the same approach has been demonstrated for SE Asia (Couwenberg and Hooijer, 2013). Peat loss through oxidation occurs in drained peatland because the lowering
Assessment of impacts of plantation drainage on the Kampar Peninsula peatlands 11
Assessment of impacts of plantation drainage on the Kampar Peninsula peatlands
12
of the water table introduces oxygen into the peat soil, creating oxygen-rich aerobic conditions that stimulate increased microbial activity that breaks down the peat.
2.2 Impacts of peatland subsidence The parallel loss of peat carbon and of land elevation is inevitable once drainage starts. In a comprehensive review of the subsidence of organic soils globally, Stephens et al. (1984) conclude that “even with optimum water-table control for good production, subsidence will continue at an undesirable rate”. Eventually, subsidence often brings the land surface to an elevation where flood risk is high, drainage of excess rain water by gravity is impeded and flooding by river or sea water becomes possible. In extreme cases, such as the Netherlands (Schothorst, 1977; Hoogland et al., 2012; Querner et al., 2012), the Fenlands of the UK (Hutchinson, 1980) or the Sacramento Delta in the USA (Deverel and Leighton, 2010), the land surface may end up below sea level.
2.3 Peat loss after drainage is highest in the tropics and in deep fibric peat
Being driven by biological processes, the long-term rates of subsidence in drained peatlands are strongly dependent on temperature, so that the highest subsidence rates will be found in tropical climates (Stephens et al., 1984; Andriesse, 1988; see Figure 2). In temperate climates, long-term subsidence rates after peatland drainage are typically in the range of 0.5 to 2 cm yr-1, while in the tropics they are in the range of 2 to 6 cm yr-1, with the variation within these climate zones being explained largely by peat type and water table depth. The corresponding long-term carbon emission rates for peatlands drained for agriculture (cropland and industrial plantations) are around 8 t C ha-1 yr-1 in temperate climates and 14‒15 t C ha-1 yr-1 in the tropics (excluding the emission spike shortly after drainage; Hooijer et al., 2012; Hooijer et al., 2014) as published in numerous scientific papers and summarized by IPCC (2013) and FAO (Page and Hooijer, 2014; Table 1).
In fibric peat in the tropics, extremely high subsidence rates are reported, that amount to metres of elevation loss in the first decades after drainage (Andriesse, 1988; Wösten et al., 1997; Hooijer et al., 2012). This may be attributed to this peat consisting almost entirely of organic material (> 99%), with the mineral component being so limited that no ‘mature’ top layer develops that is more resistant to decomposition. As the chemical and structural characteristics of the top peat layer do not change over time, neither does the rate of peat loss as long as management conditions remain the same.
Some tropical peat, however, has higher mineral content and is more resistant to decomposition. This is typically true in areas of shallow peat, that are often near rivers or that remain where deep peat has largely been oxidized already after decades of drainage. Subsidence rates in such areas are often around 2 cm yr-1 (Dradjad et al., 2003; Othman et al., 2011).
12 Assessment of impacts of plantation drainage on the Kampar Peninsula peatlands

Assessment of impacts of plantation drainage on the Kampar Peninsula peatlands
13
Figure 2 Relation between temperature, water table depth (D) and subsidence rate (from Stephens et al., 1984).
Table 1 Emission factors from drained peatlands as presented in the FAO publication: Towards climate-responsible peatlands management (Page and Hooijer, 2014; summarizing numbers in IPCC (2013) per climate zone). The tropical plantation emission factor is averaged over Acacia and oil palm plantations.
Assessment of impacts of plantation drainage on the Kampar Peninsula peatlands 13
Assessment of impacts of plantation drainage on the Kampar Peninsula peatlands
14
2.4 Peat loss is not dependent on water table depth alone Most studies into peat loss and subsidence after drainage have reported a relation with water table depth, either average annual values in subsidence studies and most CO2 flux studies, or instantaneous values in a few short-term CO2 flux studies. Few studies however report correlation co-efficient (R2) values for this relation that are above 0.5, indicating that there are factors other than water table depth that affect peat loss. This is true for both temperate and tropical peats.
It is thought that peat loss in agricultural areas is affected by a combination of several management factors, including fertilizer application, higher top soil temperature after removal of the original vegetation cover, and greater air entry into the soil after it is disturbed (Jauhiainen et al., 2014). All of these factors enhance bacterial and fungal activity and therefore peat loss. Together, they may have an effect on peat decomposition rates that is as strong as that of water table depth alone. As a result of this, recent studies in drained tropical peatland (Hooijer et al., 2012; Jauhiainen et al., 2012; Husnain et al., 2014) report relations with intercepts that suggest substantial peat loss (carbon emission and subsidence) even if the average water table were at the peat surface (Figure 3), while Gandois et al. (2013) report substantial impacts of logging on the characteristics of undrained tropical peat, even without any drainage.
The implication is that peat loss in tropical peatland that is used for agriculture will likely always be substantial, even in the hypothetical case that water levels are brought up close to the surface. Subsidence and carbon emission cannot be reduced to negligible rates in any management regime that requires clearing, soil disturbance or fertilization. To reduce peat loss, it is necessary to not only raise water levels but also to reduce these other disturbances.
14 Assessment of impacts of plantation drainage on the Kampar Peninsula peatlands
Assessment of impacts of plantation drainage on the Kampar Peninsula peatlands
15
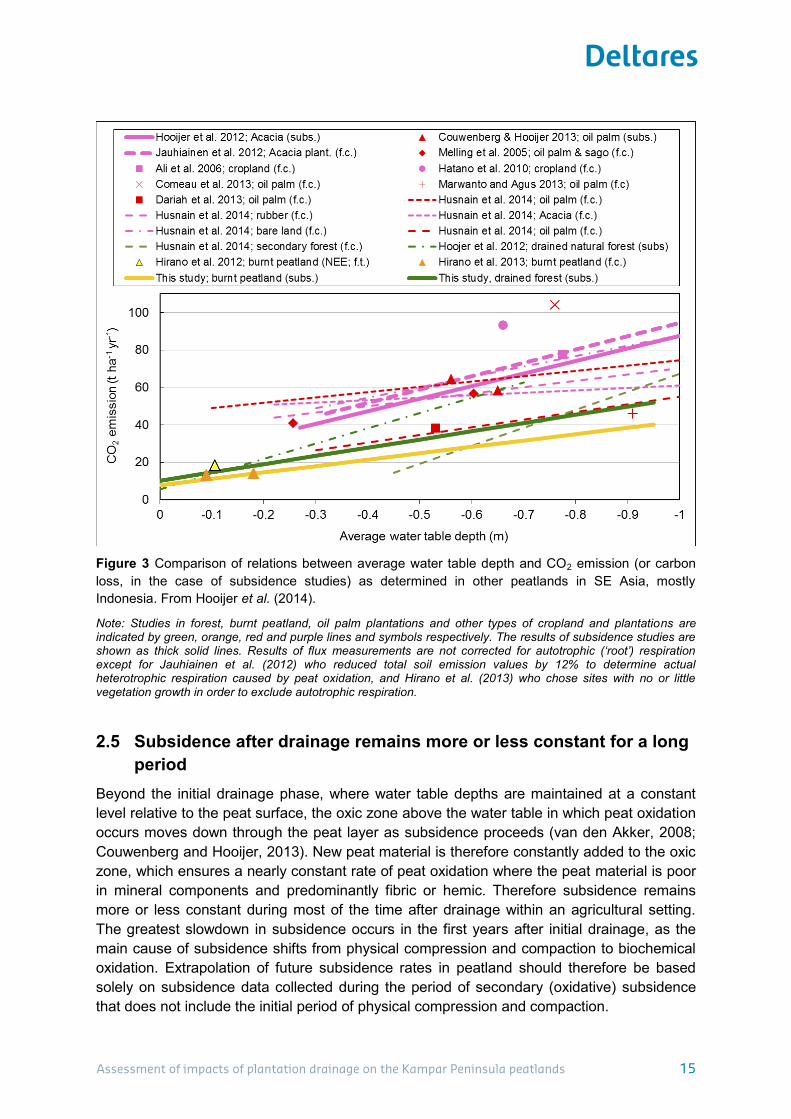
Figure 3 Comparison of relations between average water table depth and CO2 emission (or carbon loss, in the case of subsidence studies) as determined in other peatlands in SE Asia, mostly Indonesia. From Hooijer et al. (2014).
Note: Studies in forest, burnt peatland, oil palm plantations and other types of cropland and plantations are indicated by green, orange, red and purple lines and symbols respectively. The results of subsidence studies are shown as thick solid lines. Results of flux measurements are not corrected for autotrophic (‘root’) respiration except for Jauhiainen et al. (2012) who reduced total soil emission values by 12% to determine actual heterotrophic respiration caused by peat oxidation, and Hirano et al. (2013) who chose sites with no or little vegetation growth in order to exclude autotrophic respiration.
2.5 Subsidence after drainage remains more or less constant for a long period
Beyond the initial drainage phase, where water table depths are maintained at a constant level relative to the peat surface, the oxic zone above the water table in which peat oxidation occurs moves down through the peat layer as subsidence proceeds (van den Akker, 2008; Couwenberg and Hooijer, 2013). New peat material is therefore constantly added to the oxic zone, which ensures a nearly constant rate of peat oxidation where the peat material is poor in mineral components and predominantly fibric or hemic. Therefore subsidence remains more or less constant during most of the time after drainage within an agricultural setting. The greatest slowdown in subsidence occurs in the first years after initial drainage, as the main cause of subsidence shifts from physical compression and compaction to biochemical oxidation. Extrapolation of future subsidence rates in peatland should therefore be based solely on subsidence data collected during the period of secondary (oxidative) subsidence that does not include the initial period of physical compression and compaction.
Assessment of impacts of plantation drainage on the Kampar Peninsula peatlands 15
Assessment of impacts of plantation drainage on the Kampar Peninsula peatlands
16
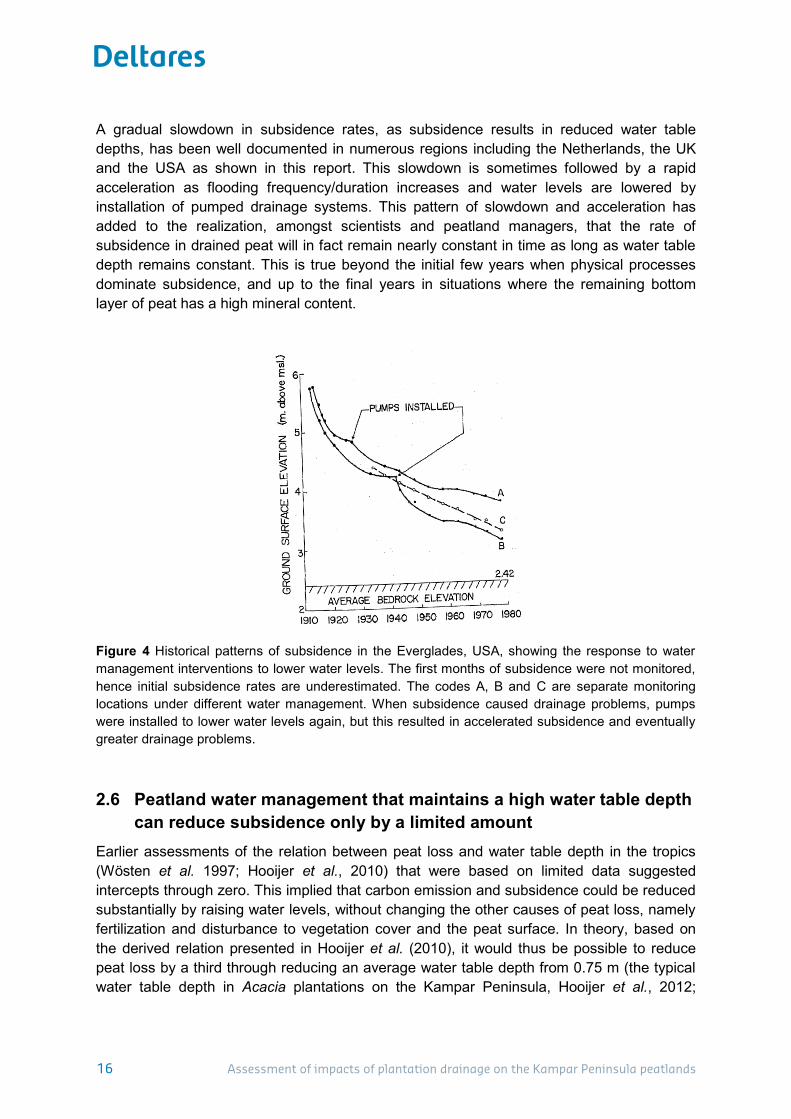
A gradual slowdown in subsidence rates, as subsidence results in reduced water table depths, has been well documented in numerous regions including the Netherlands, the UK and the USA as shown in this report. This slowdown is sometimes followed by a rapid acceleration as flooding frequency/duration increases and water levels are lowered by installation of pumped drainage systems. This pattern of slowdown and acceleration has added to the realization, amongst scientists and peatland managers, that the rate of subsidence in drained peat will in fact remain nearly constant in time as long as water table depth remains constant. This is true beyond the initial few years when physical processes dominate subsidence, and up to the final years in situations where the remaining bottom layer of peat has a high mineral content.
Figure 4 Historical patterns of subsidence in the Everglades, USA, showing the response to water management interventions to lower water levels. The first months of subsidence were not monitored, hence initial subsidence rates are underestimated. The codes A, B and C are separate monitoring locations under different water management. When subsidence caused drainage problems, pumps were installed to lower water levels again, but this resulted in accelerated subsidence and eventually greater drainage problems.
2.6 Peatland water management that maintains a high water table depth can reduce subsidence only by a limited amount
Earlier assessments of the relation between peat loss and water table depth in the tropics (Wösten et al. 1997; Hooijer et al., 2010) that were based on limited data suggested intercepts through zero. This implied that carbon emission and subsidence could be reduced substantially by raising water levels, without changing the other causes of peat loss, namely fertilization and disturbance to vegetation cover and the peat surface. In theory, based on the derived relation presented in Hooijer et al. (2010), it would thus be possible to reduce peat loss by a third through reducing an average water table depth from 0.75 m (the typical water table depth in Acacia plantations on the Kampar Peninsula, Hooijer et al., 2012;
16 Assessment of impacts of plantation drainage on the Kampar Peninsula peatlands
Assessment of impacts of plantation drainage on the Kampar Peninsula peatlands
17
Jauhiainen et al., 2012) to 0.5 m (the highest average water table depth that is possible under best management).
With the benefit of recent studies, it is now clear that the relation between water table depth and peat loss is ‘flatter’ than previously thought. The impact of raising water levels will therefore be less effective; a rise from 0.75 m to 0.5 m would reduce peat loss by only 20% at most (Hooijer et al., 2012; Jauhiainen et al., 2012), not 33% as would be the case if the slope intercept were through zero.
These quantitative assessments make clear that improved water management in drained plantations can only reduce subsidence by a limited amount, probably not much more than 20 % (compared to ‘business as usual’) in Acacia or oil palm plantations as both crops need a relatively deep water level for adequate growth.
Assessment of impacts of plantation drainage on the Kampar Peninsula peatlands 17

Assessment of impacts of plantation drainage on the Kampar Peninsula peatlands
18
Figure 5 Subsidence rates in tropical and sub-tropical peatlands (from Hooijer et al., 2012). Top: Average subsidence rates as measured at 14 locations in Acacia plantations on the Kampar Peninsula, over the first 9 yrs after drainage. It should be noted that measurements started after canals had been constructed and drainage started, so in fact this graph underestimates total subsidence since the start of drainage (the same is true for measurements in the Everglades, see bottom graph). Bottom: as measured at a larger number of drained peatland locations in Sumatra, Malaysia (from Wösten et al.,1997, based on DID Malaysia 1996), Mildred Island in the California Sacramento Delta (Deverel and Leighton, 2010) and Florida Everglades. The Everglades record is averaged from three records presented by Stephens and Speir (1969); as the first two years after completing the drainage system in 1912 were missing from the subsidence record, which started in 1914, we added a subsidence of 22.5 cm yr−1 for those years, which is the average subsidence rate over 1914 and 1915 and therefore almost certainly an underestimate of actual initial subsidence. Also shown are long-term calculated subsidence rates for SE Asia, applying both the relation determined for Florida Everglades (Stephens et al., 1984), assuming a water depth of 0.7 m and an average temperature of 30 °C, and the relation found for SE Asia in this paper.
Couwenberg and Hooijer (2013) summarised published subsidence rates for relevant studies in SE Asia and find an average subsidence rate of 4.1 cm yr-1 (Table 2). The subsidence rates for the Kampar Peninsula (‘this study’ in Table 2 based on Hooijer et al., 2012) show that even at water table depths of 50-70 cm in line with best practice management prescriptions, subsidence rates of 4-5 cm yr-1 can be expected.
18 Assessment of impacts of plantation drainage on the Kampar Peninsula peatlands

Assessment of impacts of plantation drainage on the Kampar Peninsula peatlands
19
Table 2 Published subsidence rates and derived carbon emissions in SE Asia. From Couwenberg and Hooijer (2013). This study refers to subsidence measurements on the Kampar Peninsula.
Note: This table excludes data from shallow peat (< 1.6 m), peat with high mineral content (> 5 %), subsidence records < 1 year long and areas that were (potentially) drained < 3 years ago. It therefore reflects the best measurements available for deep fibric peat that is found on the Kampar Peninsula and most other large peat domes in Indonesia.
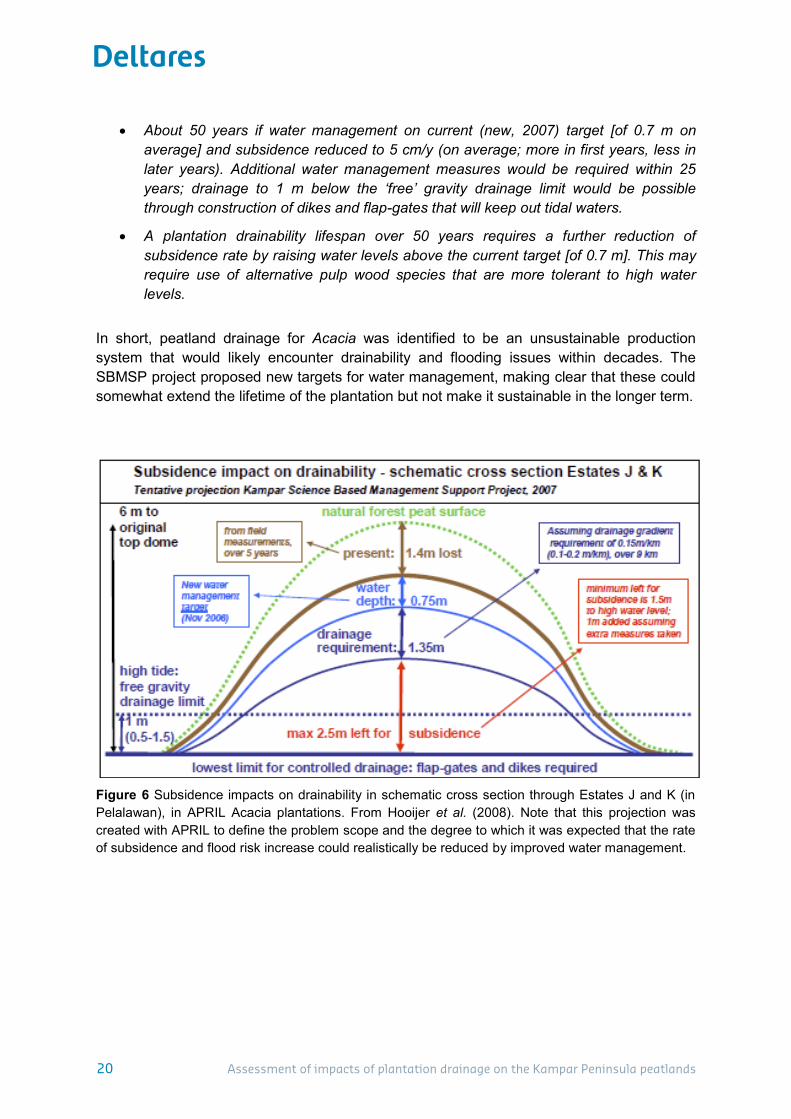
2.7 Likely implications for the Kampar Peninsula The SBSMP project used the results of subsidence monitoring and other data to define the likely impacts of peatland drainage and subsidence on peat drainability in plantations on the Kampar Peninsula (Figure 6). The tentative conclusions of this projection, that were at the time approved by APRIL (who manage the largest plantation extent on Kampar Peninsula), were reported as follows (Hooijer et al., 2008):
“For this location, which appears to be representative for many other plantations in Pelalawan in terms of peat depth and drainage gradient, it was found that up to 2.5 m subsidence can be sustained before the area will become undrainable and less suitable for plantations. Note that 1.4 m of subsidence has already occurred here, within 6 years, as water management practice in these plantations has been well below ‘APRIL best practice’; dams are now being constructed to bring up water levels to target range and to reduce subsidence.
The following tentative conclusions were drawn on expected plantation drainability lifespan:
About 25 years if water management continued as up to 2006 (previous water management target).
Assessment of impacts of plantation drainage on the Kampar Peninsula peatlands 19
Assessment of impacts of plantation drainage on the Kampar Peninsula peatlands
20
About 50 years if water management on current (new, 2007) target [of 0.7 m on average] and subsidence reduced to 5 cm/y (on average; more in first years, less in later years). Additional water management measures would be required within 25 years; drainage to 1 m below the ‘free’ gravity drainage limit would be possible through construction of dikes and flap-gates that will keep out tidal waters.
A plantation drainability lifespan over 50 years requires a further reduction of subsidence rate by raising water levels above the current target [of 0.7 m]. This may require use of alternative pulp wood species that are more tolerant to high water levels.
In short, peatland drainage for Acacia was identified to be an unsustainable production system that would likely encounter drainability and flooding issues within decades. The SBMSP project proposed new targets for water management, making clear that these could somewhat extend the lifetime of the plantation but not make it sustainable in the longer term.
Figure 6 Subsidence impacts on drainability in schematic cross section through Estates J and K (in Pelalawan), in APRIL Acacia plantations. From Hooijer et al. (2008). Note that this projection was created with APRIL to define the problem scope and the degree to which it was expected that the rate of subsidence and flood risk increase could realistically be reduced by improved water management.
20 Assessment of impacts of plantation drainage on the Kampar Peninsula peatlands

Assessment of impacts of plantation drainage on the Kampar Peninsula peatlands
21
3 Landscape morphology and peat characteristics of the Kampar Peninsula
The Kampar Peninsula is probably the largest peat dome landscape in Sumatra and Kalimantan, and must count as one of the greatest single peat and peat carbon deposits not only within the tropics but also globally. This chapter describes the area in the context of understanding the likely long-term impacts of drainage.
3.1 Elevation model For this study, we have constructed an elevation model as explained in Annex B, from LiDAR and SRTM data. The resulting elevation map is shown in Figure 7. Figure 8 presents the elevation distribution in the study area determined from the LiDAR DTM shown in Figure 7.
Figure 7 Elevation map for the Kampar Peninsula (see Annex B for explanation). Shown as well are the plantations (black line).
From the elevation distribution shown in Figure 8 and Table 3 we can see that most of the oil palm plantations are located on peat with the lowest elevations, with 48.4 % and 64.1 % of industrial and small holder oil palm plantations, respectively located on land less than 3 m +MSL while for Acacia plantations this is much less at 7.8 %. The majority (58.1 %) of the Acacia plantations are located on land with peat surface elevations more than 6 m +MSL, while onlyAcacia plantations exist on elevations more than 10 m +MSL.
Assessment of impacts of plantation drainage on the Kampar Peninsula peatlands 21

Assessment of impacts of plantation drainage on the Kampar Peninsula peatlands
22
Figure 8 Relative distribution of surface elevation in the LiDAR-derived DTM, for the whole Kampar study area (black bars), as well as for all Acacia plantations (grey bars) and industrial (blue bars) and small holder (green bars) oil palm plantations.
Table 3 Elevation characteristics of LiDAR-derived DTM for the whole study area, as well as for all Acacia plantations and industrial and small holder oil palm plantations.
3.2 Peat thickness of the Kampar Peninsula The elevation model shown in Figure 7 has been used to create a map of minimum peat thickness, by assuming a uniform peat basal depth of 2 meters above sea level (+ MSL).1
1 The full method used in this minimum peat thickness analysis will be published separately in 2016.
Elevation characteristics
Whole study area
Acacia plantations
Industrial OP
smallholder OP
Mean [m] 6.8 6.4 4.3 3.7% <2 m 3.4 3.8 25.3 35.6% <3 m 11.4 7.8 48.4 64.1% <4 m 17.5 12.7 57.5 73.0% <6 m 36.9 41.9 79.1 85.8% <8 m 63.7 84.8 99.0 96.8
% <10 m 85.9 98.4 100.0 100.0% <12 m 100.0 100.0 100.0 100.0
22 Assessment of impacts of plantation drainage on the Kampar Peninsula peatlands

Assessment of impacts of plantation drainage on the Kampar Peninsula peatlands
23
Figure 9 Map of minimum peat thickness for the Kampar Peninsula as derived from the elevation model shown in Figure 7 and an assumed peat base (i.e. elevation where the peat overlies the mineral soil) at 2 m above mean sea level (MSL) (see Annex C for explanation). Shown as well are the plantations (black line).
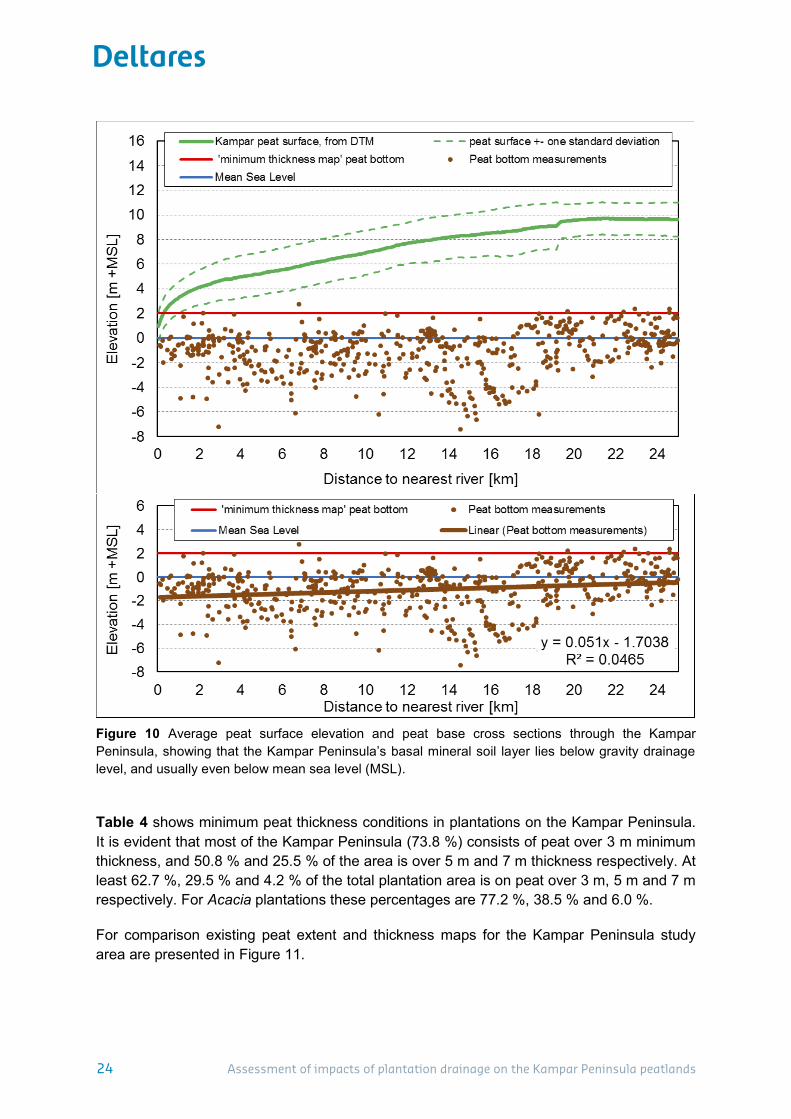
Figure 10 shows that while patterns in the shape of the peat base may exist for smaller areas, no such shape is evident for the Kampar Peninsula as a whole. A horizontal peat basal surface is therefore the best approximation. Assuming a peat base at 2 m +MSL is justified by the finding that for 99.0% of the 577 peat thickness measurements available to us for the Kampar Peninsula, the peat base is below 2 m +MSL (Figure 10, Table 11 in Annex C). In fact, the peat base was below MSL for 71.2 % of measurements. Therefore, the minimum peat map underestimates peat thickness by several metres. This underestimation is even greater if we account for the fact that peat thickness measurements in the field tend to systematically underestimate actual peat thickness; the most common error is that the bottom is often assumed to be reached when the auger gets stuck in wood that is in fact above the true base of the peat deposit.
Assessment of impacts of plantation drainage on the Kampar Peninsula peatlands 23
Assessment of impacts of plantation drainage on the Kampar Peninsula peatlands
24
Figure 10 Average peat surface elevation and peat base cross sections through the Kampar Peninsula, showing that the Kampar Peninsula’s basal mineral soil layer lies below gravity drainage level, and usually even below mean sea level (MSL).
Table 4 shows minimum peat thickness conditions in plantations on the Kampar Peninsula. It is evident that most of the Kampar Peninsula (73.8 %) consists of peat over 3 m minimum thickness, and 50.8 % and 25.5 % of the area is over 5 m and 7 m thickness respectively. At least 62.7 %, 29.5 % and 4.2 % of the total plantation area is on peat over 3 m, 5 m and 7 m respectively. For Acacia plantations these percentages are 77.2 %, 38.5 % and 6.0 %.
For comparison existing peat extent and thickness maps for the Kampar Peninsula study area are presented in Figure 11.
24 Assessment of impacts of plantation drainage on the Kampar Peninsula peatlands

Assessment of impacts of plantation drainage on the Kampar Peninsula peatlands
25
Table 4 Minimum peat thickness in existing plantations on the Kampar Peninsula. Note: Total areas as presented here differ from other tables since calculations are done on a grid of 100 x 100 m and do not exactly cover the vector boundary lines.
Figure 11 Existing peat extent and thickness maps for the Kampar Peninsula study area. (LEFT) Puslitanak map of 2004 and (RIGHT) BBSDLP map of 2011.
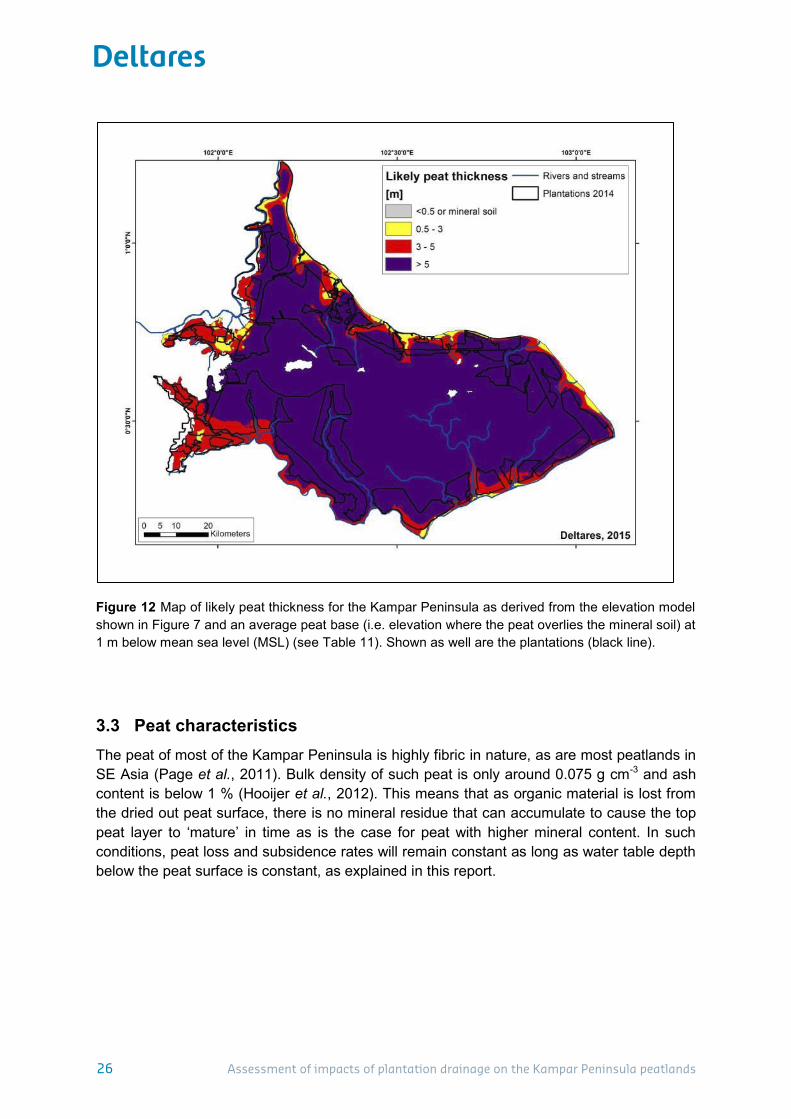
We have also tentatively created a map of more likely peat thickness (Figure 12), by assuming the peat base is at 1 m below MSL as we find to be true for the Kampar as a whole (Table 11). This map provides a better idea of the total peat stock of the area. However, we advise using only the minimum peat thickness map in further assessments, for two reasons. First, the peat stock below mean sea level, and probably below high tide level (which roughly corresponds with 2 m +MSL) is not available to oxidation (as it will always be waterlogged) and therefore is not relevant to carbon emission projections; predictions of future emissions that use total peat stock usually overestimate emissions. Second, any peat thickness map using an assumed constant peat basal level, while being useful for large-scale mapping, should be improved with local data to create a map that is suitable for detailed land use planning.
average min.Total area peat thickness
[ha] [ha] [%] [ha] [%] [ha] [%] [ha] [%] [m]Kampar Peninsula whole 678058 124325 18.3 156174 23.0 171426 25.3 172921 25.5 4.86
All plantations 305023 70253 23.0 101214 33.2 77106 25.3 12922 4.2 4.15All Acacia plantations 211394 42224 20.0 81899 38.7 68617 32.5 12768 6.0 4.47
All OP plantations 93629 28029 29.9 19315 20.6 8489 9.1 154 0.2 2.96industrial Acacia plantation (APP & affiliated) 52829 15470 29.3 19117 36.2 17425 33.0 94 0.2 4.07
industrial Acacia plantation (APRIL & affiliated) 158565 26754 16.9 62782 39.6 51192 32.3 12674 8.0 4.61industrial oil palm plantation 35767 9562 26.7 12139 33.9 3352 9.4 0 0.0 3.2
smallholder oil palm plantation 57862 18467 31.9 7176 12.4 5137 8.9 154 0.3 2.76
Area>7 m5 - 7 m3 - 5 m0.5 - 3 m
Min. peat thickness class
Assessment of impacts of plantation drainage on the Kampar Peninsula peatlands 25
Assessment of impacts of plantation drainage on the Kampar Peninsula peatlands
26
Figure 12 Map of likely peat thickness for the Kampar Peninsula as derived from the elevation model shown in Figure 7 and an average peat base (i.e. elevation where the peat overlies the mineral soil) at 1 m below mean sea level (MSL) (see Table 11). Shown as well are the plantations (black line).
3.3 Peat characteristics The peat of most of the Kampar Peninsula is highly fibric in nature, as are most peatlands in SE Asia (Page et al., 2011). Bulk density of such peat is only around 0.075 g cm-3 and ash content is below 1 % (Hooijer et al., 2012). This means that as organic material is lost from the dried out peat surface, there is no mineral residue that can accumulate to cause the top peat layer to ‘mature’ in time as is the case for peat with higher mineral content. In such conditions, peat loss and subsidence rates will remain constant as long as water table depth below the peat surface is constant, as explained in this report.
26 Assessment of impacts of plantation drainage on the Kampar Peninsula peatlands

Assessment of impacts of plantation drainage on the Kampar Peninsula peatlands
27
4 Land use on the Kampar Peninsula We have determined the area of Acacia and oil palm plantations on the Kampar Peninsula as explained in Annex A. The total area covered by Acacia (HTI) concessions in 2014 is 292,659 ha or 43.4 % of the Kampar Peninsula peatland area (applying the peat extent mapped by Wahyunto et al., 2003; Table 5). The total area covered by industrial-scale oil palm concessions is 73,498 ha, or 10.9 % of the Kampar Peninsula peatland area. Combined, industrial plantation concessions cover 54.3 % of the Kampar Peninsula peatland area. Most of this area, but not all, has already been developed into plantations, i.e. cleared, drained and planted.
It was found that 62 % (182,625 ha) of HTI concessions (using the MoF 2010 concession data; Table 5) was converted to plantation by 2014 (i.e. the land had a drainage pattern consistent with a productive plantation as seen in 2014 Landsat images). For APRIL and APP plantations, these numbers are 60 % (131,965 ha) and 70 % (50,661 ha) respectively. APRIL has a far greater concession area on the Kampar Peninsula than APP (220,061 ha versus 72,598 ha; MoF 2010 numbers).
An additional 28,331 ha of apparently productive Acacia plantations were delineated outside the 2010 MoF concession boundaries (26,123 ha by APRIL, 2,208 ha by APP; concessions with white numbers as shown in Figure 13). This brings the total 2014 area of productive Acacia plantations on the Kampar Peninsula to 210,957 ha, of which 158,088 ha (74.9 %) is managed by APRIL and 52,869 ha (25.1 %) by APP (Table 5).
The drained oil palm plantation area covered 83,270 ha in 2014, of which 41.9 % was attributed to industrial-scale plantations (judging from drainage patterns) and 58.1 % to smallholder plantations (but potentially associated with industrial estates). 62.9 % (52,361 ha) of the oil palm production takes place within the official MoF 2010 concession boundaries, and 30.7 % outside (Table 5). On the Kampar Peninsula, oil palm plantations tend to be nearer to rivers than Acacia plantations, and are therefore at lower elevations (Figure 8) and on the shallower peat (Table 4).
Assessment of impacts of plantation drainage on the Kampar Peninsula peatlands 27
Assessment of impacts of plantation drainage on the Kampar Peninsula peatlands
28
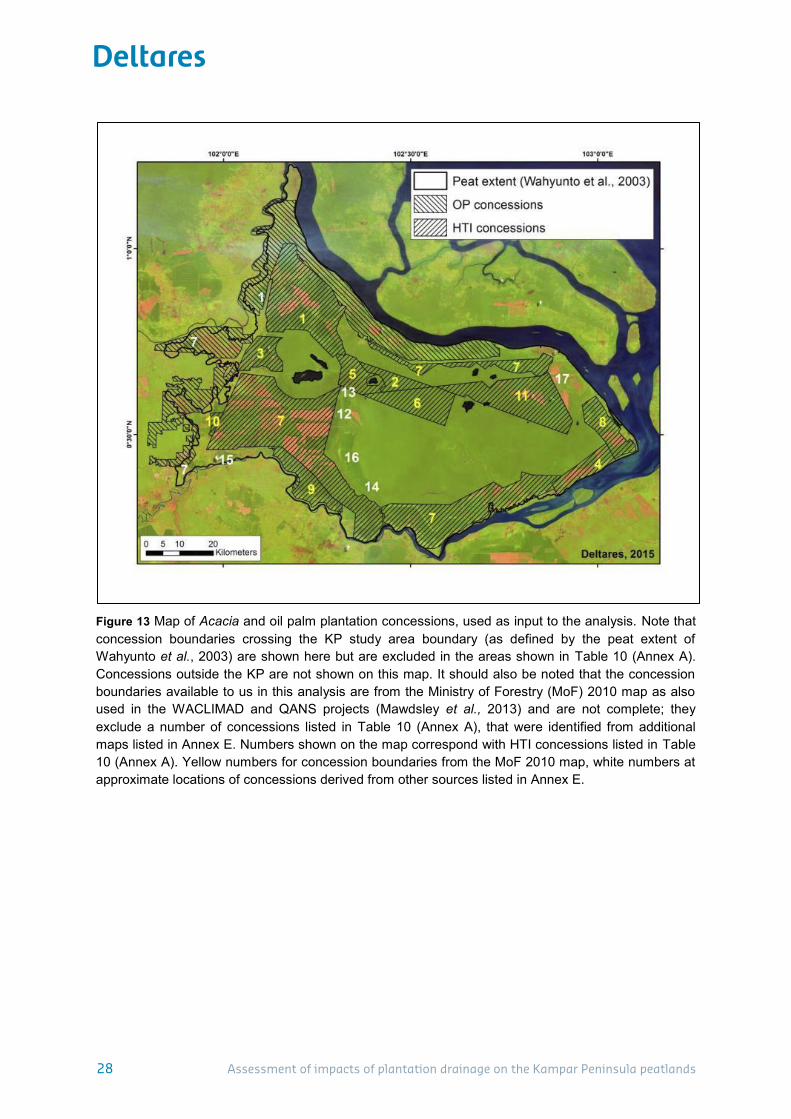
Figure 13 Map of Acacia and oil palm plantation concessions, used as input to the analysis. Note that concession boundaries crossing the KP study area boundary (as defined by the peat extent of Wahyunto et al., 2003) are shown here but are excluded in the areas shown in Table 10 (Annex A). Concessions outside the KP are not shown on this map. It should also be noted that the concession boundaries available to us in this analysis are from the Ministry of Forestry (MoF) 2010 map as also used in the WACLIMAD and QANS projects (Mawdsley et al., 2013) and are not complete; they exclude a number of concessions listed in Table 10 (Annex A), that were identified from additional maps listed in Annex E. Numbers shown on the map correspond with HTI concessions listed in Table 10 (Annex A). Yellow numbers for concession boundaries from the MoF 2010 map, white numbers at approximate locations of concessions derived from other sources listed in Annex E.
28 Assessment of impacts of plantation drainage on the Kampar Peninsula peatlands
Assessment of impacts of plantation drainage on the Kampar Peninsula peatlands
29
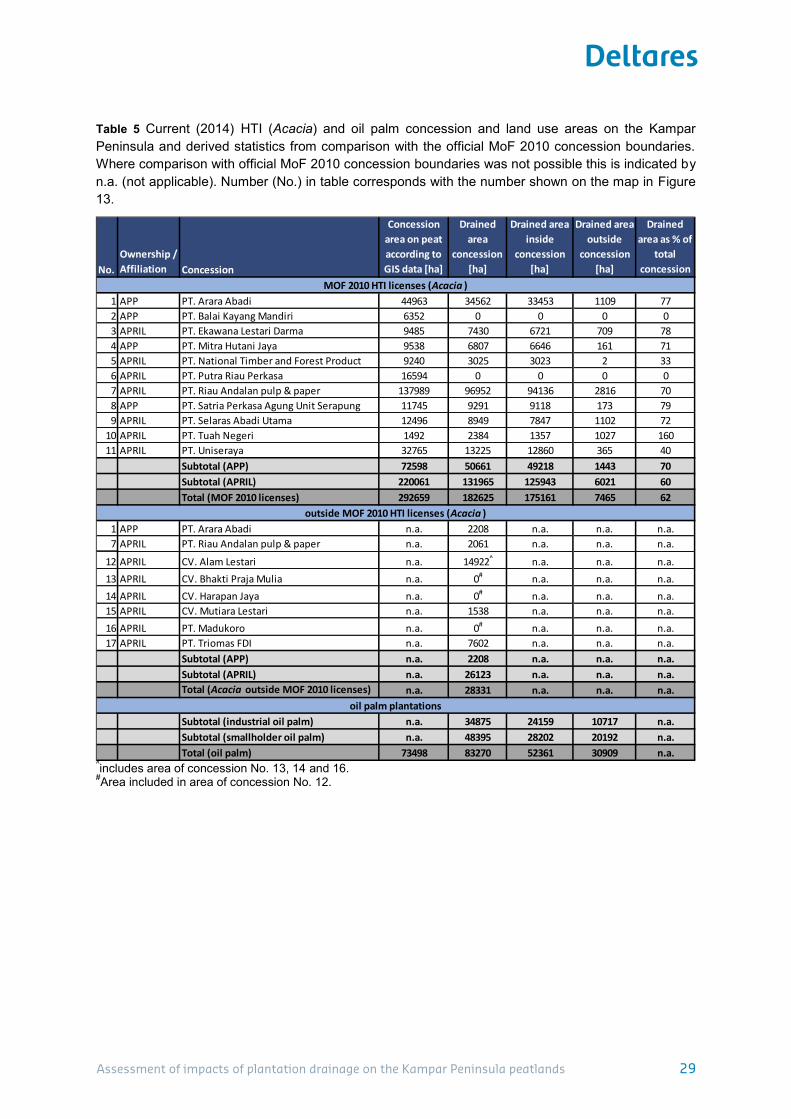
Table 5 Current (2014) HTI (Acacia) and oil palm concession and land use areas on the Kampar Peninsula and derived statistics from comparison with the official MoF 2010 concession boundaries. Where comparison with official MoF 2010 concession boundaries was not possible this is indicated by n.a. (not applicable). Number (No.) in table corresponds with the number shown on the map in Figure 13.
^includes area of concession No. 13, 14 and 16. #Area included in area of concession No. 12.
No.Ownership / Affiliation Concession
Concession area on peat according to GIS data [ha]
Drained area
concession [ha]
Drained area inside
concession [ha]
Drained area outside
concession [ha]
Drained area as % of
total concession
1 APP PT. Arara Abadi 44963 34562 33453 1109 772 APP PT. Balai Kayang Mandiri 6352 0 0 0 03 APRIL PT. Ekawana Lestari Darma 9485 7430 6721 709 784 APP PT. Mitra Hutani Jaya 9538 6807 6646 161 715 APRIL PT. National Timber and Forest Product 9240 3025 3023 2 336 APRIL PT. Putra Riau Perkasa 16594 0 0 0 07 APRIL PT. Riau Andalan pulp & paper 137989 96952 94136 2816 708 APP PT. Satria Perkasa Agung Unit Serapung 11745 9291 9118 173 799 APRIL PT. Selaras Abadi Utama 12496 8949 7847 1102 72
10 APRIL PT. Tuah Negeri 1492 2384 1357 1027 16011 APRIL PT. Uniseraya 32765 13225 12860 365 40
Subtotal (APP) 72598 50661 49218 1443 70Subtotal (APRIL) 220061 131965 125943 6021 60Total (MOF 2010 licenses) 292659 182625 175161 7465 62
1 APP PT. Arara Abadi n.a. 2208 n.a. n.a. n.a.7 APRIL PT. Riau Andalan pulp & paper n.a. 2061 n.a. n.a. n.a.
12 APRIL CV. Alam Lestari n.a. 14922^ n.a. n.a. n.a.13 APRIL CV. Bhakti Praja Mulia n.a. 0# n.a. n.a. n.a.14 APRIL CV. Harapan Jaya n.a. 0# n.a. n.a. n.a.15 APRIL CV. Mutiara Lestari n.a. 1538 n.a. n.a. n.a.16 APRIL PT. Madukoro n.a. 0# n.a. n.a. n.a.17 APRIL PT. Triomas FDI n.a. 7602 n.a. n.a. n.a.
Subtotal (APP) n.a. 2208 n.a. n.a. n.a.Subtotal (APRIL) n.a. 26123 n.a. n.a. n.a.Total (Acacia outside MOF 2010 licenses) n.a. 28331 n.a. n.a. n.a.
Subtotal (industrial oil palm) n.a. 34875 24159 10717 n.a.Subtotal (smallholder oil palm) n.a. 48395 28202 20192 n.a.Total (oil palm) 73498 83270 52361 30909 n.a.
MOF 2010 HTI licenses (Acacia )
outside MOF 2010 HTI licenses (Acacia )
oil palm plantations
Assessment of impacts of plantation drainage on the Kampar Peninsula peatlands 29
Assessment of impacts of plantation drainage on the Kampar Peninsula peatlands
30
Figure 14 Current (2014) extent of Acacia and oil palm plantations on the Kampar Peninsula, and MoF 2010 concession boundaries.
30 Assessment of impacts of plantation drainage on the Kampar Peninsula peatlands

Assessment of impacts of plantation drainage on the Kampar Peninsula peatlands
31
5 The potential impact of drainage on subsidence and flood risk on the Kampar Peninsula
Peatland drainage leads to peat loss that not only generates significant loss of carbon and, hence, high emissions of greenhouse gases but through land subsidence will also lead to flooding and the forced ending of production systems with gravity-based drainage. This future for drained peatlands is inevitable as Section 2 of this report explains. What is less clear is the time period over which these impacts will occur, which requires detailed analysis for individual peatland landscapes. This section of the report presents a new analysis of the likely future impacts of drainage on subsidence, flood risk, fire risk and carbon emissions. We use the elevation model and peat map presented in Section 3 and apply subsidence rates to project the likely impact of current drainage on future drainage problems and flood risk.
5.1 Landscape scale subsidence and flood risk assessment The analysis presented here applies observed subsidence rates across the Kampar peatland landscape to project the extent and timing of potential drainability and flooding issues within industrial Acacia plantation and oil palm concessions as well as areas identified as smallholder oil palm.
5.1.1 Landscape scale subsidence model
Annual subsidence rates have been applied to the elevation model presented in Section 3 with the conservative assumption that only industrial plantations and smallholder oil palm areas would be affected by drainage and subsidence, i.e. the subsidence that takes place in areas outside plantations that are also affected by plantation drainage is not included in the analysis.
It should be noted that the hydraulic conductivity of the Kampar Peninsula peat is extremely high, at between 50 and 200 m d-1 according to different analysis approaches and datasets (Hooijer et al., 2009). In combination with the great depth of this peat, this means that the drainage impact of canals extends over long distances (up to several kilometers; DID Sarawak 2001; Hooijer et al., 2012). By only accounting for impacts within plantation boundaries and not around them, we are therefore substantially underestimating overall impact of drainage on the Kampar Peninsula.
We have applied both a ‘Business As Usual’ subsidence rate of 5 cm yr-1 as was measured in Acacia plantations on the Kampar Peninsula (Table 2), and a lower ‘Best Management Practice’ subsidence rate of 3.5 cm yr-1 that is likely to be the best achievable outcome of best practice management. The outcomes of calculations applying these two subsidence rates thus present the ‘business as usual’ and ‘best practice minimum’ scenarios for future flood risk and production loss.
Assessment of impacts of plantation drainage on the Kampar Peninsula peatlands 31

Assessment of impacts of plantation drainage on the Kampar Peninsula peatlands
32
5.1.2 Flood risk calculation
As the peatland surface subsides, it will eventually reach a point where flooding will occur. Flood risk was assessed by determining the area of peatland that lies below two elevation thresholds (see also Figure 15):
1) High Water Level (HWL) - This is the level at which flooding by river water becomes possible and is represented by a single elevation threshold across the whole landscape. The HWL is associated with a high likelihood of flooding and the most severe threshold defined;
2) Free Drainability Limit (FDL) – This is the level at which subsidence across the landscape lowers the drainage gradient to rivers to a point that gravity-based drainage becomes problematic and so is associated with less severe flooding impacts than HWL. For any point on the peatland the FDL is located at a higher elevation than the HWL and is defined by a 0.2 m km-1 conveyance gradient from the HWL at the river (DID Sarawak 2001; Hooijer et al., 2015) plus 50 cm for crop requirements. The difference between HWL and FDL therefore gradually increases from the river to the interior of the peatland.
The levels for HWL and FDL that were applied in this analysis are presented in Annex D.
Figure 15 Illustration of the High Water Level (HWL, the level of severe flood risk) and Free Drainage Limit (FDL, the level below which drainage by gravity becomes impeded and inundation after heavy rainfall is likely) drainage limits in relation to River Bank Level (RBL), which is the elevation of the river side that is known to flood frequently.
32 Assessment of impacts of plantation drainage on the Kampar Peninsula peatlands

Assessment of impacts of plantation drainage on the Kampar Peninsula peatlands
33
Figure 16 Existing plantation areas (including smallholders) and undeveloped concession areas in 2014.
5.1.3 Flooding and drainability in possible plantation expansion areas A considerable part, 110,000 ha, of the Kampar Peninsula is under concession license but has not been developed yet into plantations (Figure 16). Assuming that these undeveloped concession areas will be developed in future, we present an additional scenario for flooding and drainability conditions on the Kampar Peninsula in Table 7.
5.2 The impact of drainage on subsidence and flood risk Three assessments of the impact of drainage on subsidence and flood risk are presented:
A ‘Best Management Practice’ subsidence rate of 3.5 cm yr-1 on existing plantations only (5.2.1)
A ‘Best Management Practice’ subsidence rate of 3.5 cm yr-1 on existing plantations and undeveloped concession areas (5.2.2)
A comparison of the ‘Best Management Practice’ subsidence rate of 3.5 cm yr-1 and ‘Business As Usual’ subsidence rate of 5 cm yr-1 on existing plantations (5.2.3)
5.2.1 Impact on existing plantations The flooding and drainability impacts on existing developed plantations under a ‘Best Management Practice’ scenario with a subsidence rate of 3.5 cm yr-1 are presented in Table 6. The flooding and drainability conditions are projected 150 years into the future at 25 year time steps for different peatland land user groups. The area of peatland that lies below the
Assessment of impacts of plantation drainage on the Kampar Peninsula peatlands 33

Assessment of impacts of plantation drainage on the Kampar Peninsula peatlands
34
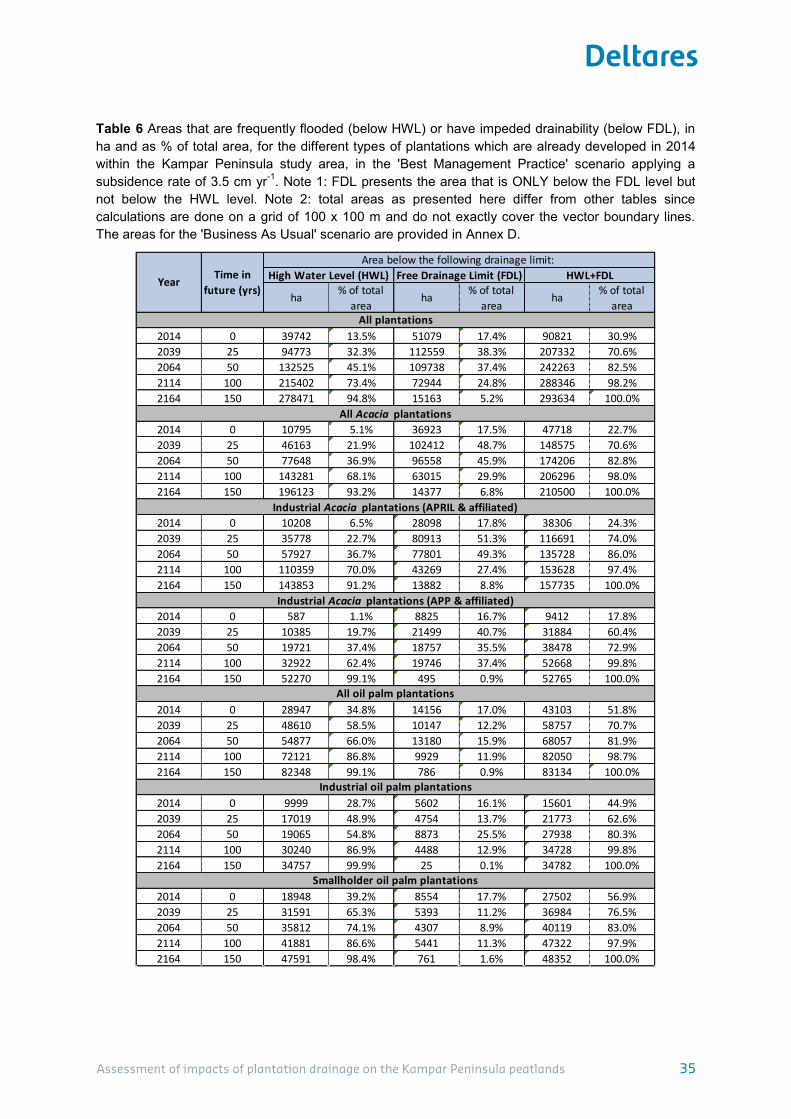
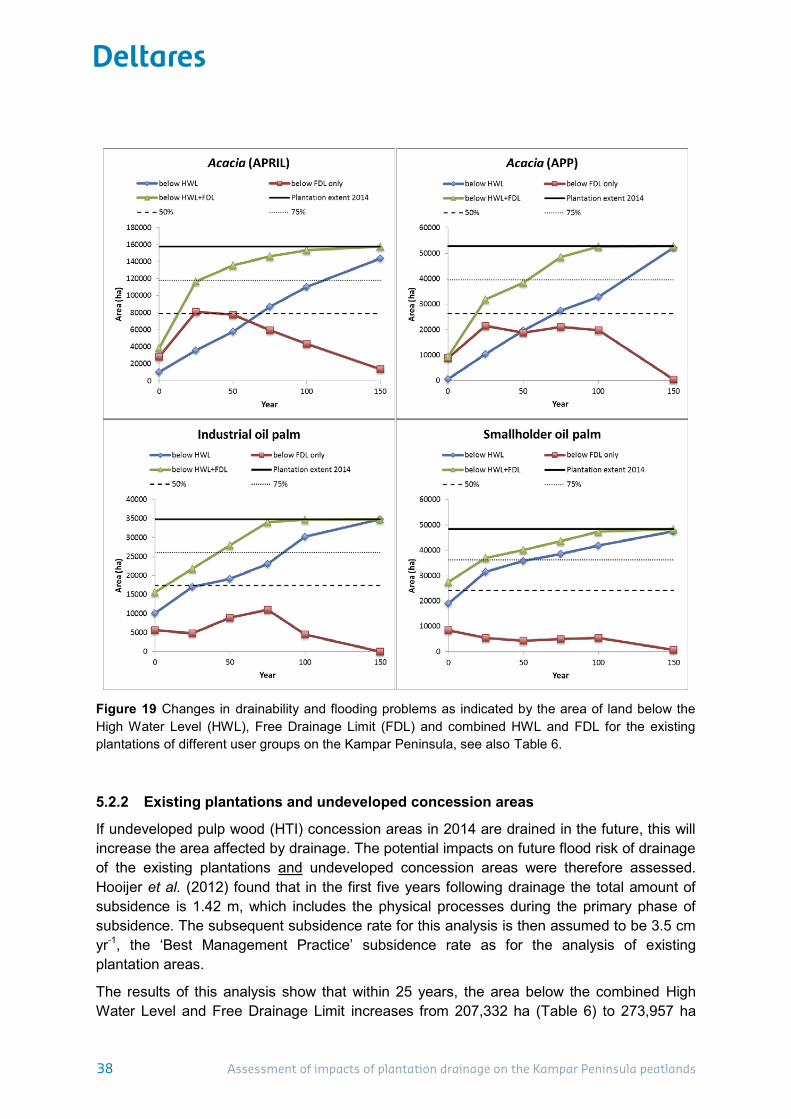
HWL, between the HWL and FDL and below the FDL are shown in Table 6 for different years into the future. Overall this analysis finds that the Kampar Peninsula will be irreversibly changed by drainage, even if only areas that are already drained are considered (Figure 16). Already, by 2014, 14 % of the area is below HWL i.e. subject to flooding by river water, while an additional 17% is below FDL i.e. likely to experience drainability problems. The total area that has either flooding or drainability problems is 31% according to the data available. Within 25 years, the existing plantation area below HWL, FDL and HWL will increase to 32, 38 and 71 % respectively. Within 50 years, this will have become 45, 37 and 83 %, and within 100 years 73, 25 and 98 %, i.e. nearly the entire plantation area that now exists. It is clear from this analysis that the current use of the Kampar Peninsula for drainage-based plantations even under a Best Management Practice scenario is not a sustainable production system and that these impacts will begin to be experienced within the coming decades (Figure 18). There are clear differences between the timing of when the impacts of subsidence on drainability and flooding will affect different user groups (Table 6, Figure 19). Smallholder oil palm plantations tend to be located nearest the rivers in the lowest lying areas (on average 3.7 m +MSL; Table 3; Figure 8), and therefore no less than 39 % of these already experienced flooding problems by 2014 according to our elevation data. By 2064, after 50 years of further subsidence, this is projected to be 74 %. For industrial oil palm plantations, that are at a slightly higher elevation of 4.3 m + MSL on average (Table 3; Figure 8), these numbers are 29 % and 55 % respectively. Industrial Acacia plantations are least affected by flooding by river water in the short to medium term, with 5 % and 37 % below HWL in 2014 and in 50 years respectively. However an additional 18 and 46 % of Acacia plantations are below FDL at these times. In the long term the differences in flood risk for the different user groups disappear, as nearly all plantations on the Kampar Peninsula are likely to flood eventually if drainage is continued. By 2114, after an additional 100 years of continued subsidence, 68 % of Acacia plantations is projected to be below HWL and 87 % of oil palm plantations (both smallholder and industrial).
34 Assessment of impacts of plantation drainage on the Kampar Peninsula peatlands
Assessment of impacts of plantation drainage on the Kampar Peninsula peatlands
35
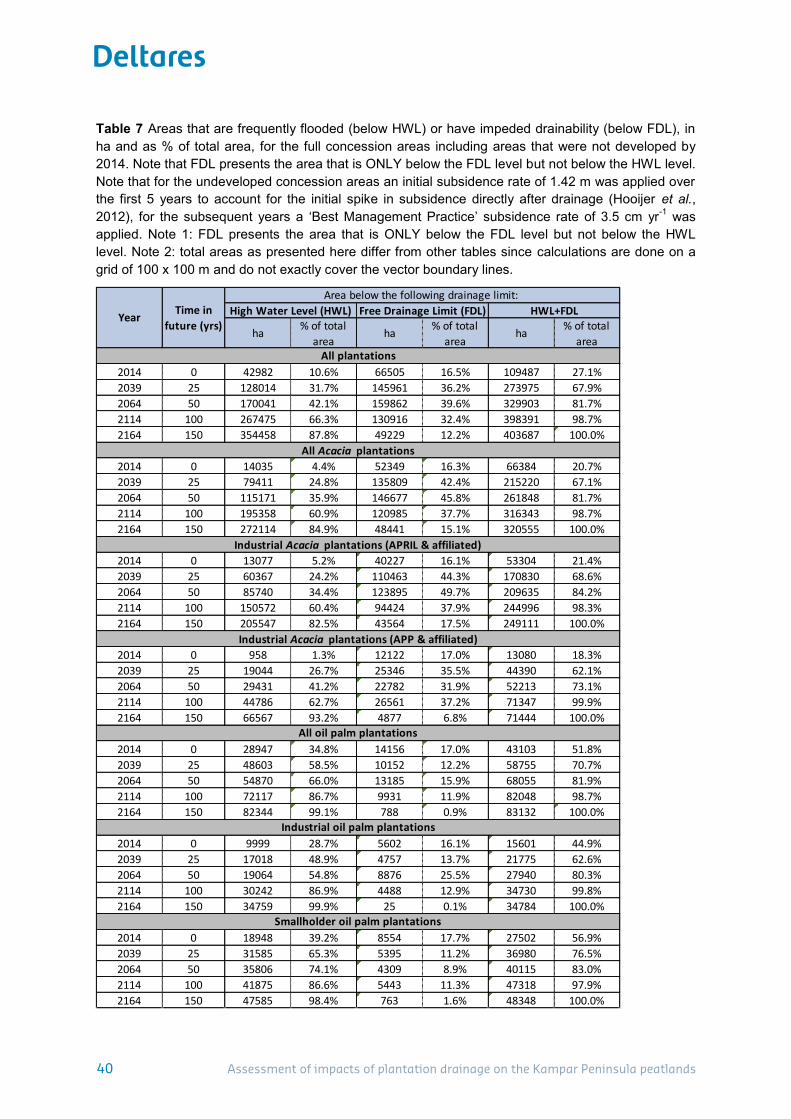
Table 6 Areas that are frequently flooded (below HWL) or have impeded drainability (below FDL), in ha and as % of total area, for the different types of plantations which are already developed in 2014 within the Kampar Peninsula study area, in the 'Best Management Practice' scenario applying a subsidence rate of 3.5 cm yr-1. Note 1: FDL presents the area that is ONLY below the FDL level but not below the HWL level. Note 2: total areas as presented here differ from other tables since calculations are done on a grid of 100 x 100 m and do not exactly cover the vector boundary lines. The areas for the 'Business As Usual' scenario are provided in Annex D.
ha % of total area
ha % of total area
ha % of total area
2014 0 39742 13.5% 51079 17.4% 90821 30.9%2039 25 94773 32.3% 112559 38.3% 207332 70.6%2064 50 132525 45.1% 109738 37.4% 242263 82.5%2114 100 215402 73.4% 72944 24.8% 288346 98.2%2164 150 278471 94.8% 15163 5.2% 293634 100.0%
2014 0 10795 5.1% 36923 17.5% 47718 22.7%2039 25 46163 21.9% 102412 48.7% 148575 70.6%2064 50 77648 36.9% 96558 45.9% 174206 82.8%2114 100 143281 68.1% 63015 29.9% 206296 98.0%2164 150 196123 93.2% 14377 6.8% 210500 100.0%
2014 0 10208 6.5% 28098 17.8% 38306 24.3%2039 25 35778 22.7% 80913 51.3% 116691 74.0%2064 50 57927 36.7% 77801 49.3% 135728 86.0%2114 100 110359 70.0% 43269 27.4% 153628 97.4%2164 150 143853 91.2% 13882 8.8% 157735 100.0%
2014 0 587 1.1% 8825 16.7% 9412 17.8%2039 25 10385 19.7% 21499 40.7% 31884 60.4%2064 50 19721 37.4% 18757 35.5% 38478 72.9%2114 100 32922 62.4% 19746 37.4% 52668 99.8%2164 150 52270 99.1% 495 0.9% 52765 100.0%
2014 0 28947 34.8% 14156 17.0% 43103 51.8%2039 25 48610 58.5% 10147 12.2% 58757 70.7%2064 50 54877 66.0% 13180 15.9% 68057 81.9%2114 100 72121 86.8% 9929 11.9% 82050 98.7%2164 150 82348 99.1% 786 0.9% 83134 100.0%
2014 0 9999 28.7% 5602 16.1% 15601 44.9%2039 25 17019 48.9% 4754 13.7% 21773 62.6%2064 50 19065 54.8% 8873 25.5% 27938 80.3%2114 100 30240 86.9% 4488 12.9% 34728 99.8%2164 150 34757 99.9% 25 0.1% 34782 100.0%
2014 0 18948 39.2% 8554 17.7% 27502 56.9%2039 25 31591 65.3% 5393 11.2% 36984 76.5%2064 50 35812 74.1% 4307 8.9% 40119 83.0%2114 100 41881 86.6% 5441 11.3% 47322 97.9%2164 150 47591 98.4% 761 1.6% 48352 100.0%
All plantations
Industrial Acacia plantations (APRIL & affiliated)
Industrial Acacia plantations (APP & affiliated)
Industrial oil palm plantations
Smallholder oil palm plantations
All Acacia plantations
All oil palm plantations
Year Time in future (yrs)
Area below the following drainage limit: High Water Level (HWL) Free Drainage Limit (FDL) HWL+FDL
Assessment of impacts of plantation drainage on the Kampar Peninsula peatlands 35

Assessment of impacts of plantation drainage on the Kampar Peninsula peatlands
36
Figure 17 DTM at 0, 25, 50, 75 and 100 years after 2014 applying a ‘Best Management Practice’ subsidence rate of 3.5 cm yr-1 for the developed plantation areas. The right bottom map shows the area where the DTM is less accurate since for those areas no LiDAR data are available. See also the confidence map shown in Figure 35.
36 Assessment of impacts of plantation drainage on the Kampar Peninsula peatlands

Assessment of impacts of plantation drainage on the Kampar Peninsula peatlands
37
Figure 18 Flood extent projection for 0, 25, 50, 75 and 100 applying a ‘Best Management Practice’ subsidence rate of 3.5 cm yr-1 to existing plantations (Figure 14) and flooding thresholds after 2014 (the date for which the DTM was created using LiDAR data). The associated areas are presented in Table 6. The flood extent projections applying a ‘Business As Usual’ subsidence rate of 5 cm yr-1 are shown in Figure 45. The right bottom map shows the area where the Flood extent projection will be less accurate since for those areas no LiDAR data are available. See also the confidence map shown in Figure 35.
Assessment of impacts of plantation drainage on the Kampar Peninsula peatlands 37
Assessment of impacts of plantation drainage on the Kampar Peninsula peatlands
38
Figure 19 Changes in drainability and flooding problems as indicated by the area of land below the High Water Level (HWL), Free Drainage Limit (FDL) and combined HWL and FDL for the existing plantations of different user groups on the Kampar Peninsula, see also Table 6.
5.2.2 Existing plantations and undeveloped concession areas
If undeveloped pulp wood (HTI) concession areas in 2014 are drained in the future, this will increase the area affected by drainage. The potential impacts on future flood risk of drainage of the existing plantations and undeveloped concession areas were therefore assessed. Hooijer et al. (2012) found that in the first five years following drainage the total amount of subsidence is 1.42 m, which includes the physical processes during the primary phase of subsidence. The subsequent subsidence rate for this analysis is then assumed to be 3.5 cm yr-1, the ‘Best Management Practice’ subsidence rate as for the analysis of existing plantation areas.
The results of this analysis show that within 25 years, the area below the combined High Water Level and Free Drainage Limit increases from 207,332 ha (Table 6) to 273,957 ha
38 Assessment of impacts of plantation drainage on the Kampar Peninsula peatlands
Assessment of impacts of plantation drainage on the Kampar Peninsula peatlands
39
(Table 7). However, because the undeveloped concessions are mostly located in the higher interior of the peatland, the proportion of the drained peatland below the combined High Water Level and Free Drainage Limit falls from 71 % to 68 %. Nonetheless, practically the whole area of concessions is affected by drainage problems and flooding within 100 years.
5.2.3 Comparison of subsidence rates as a proxy for water management
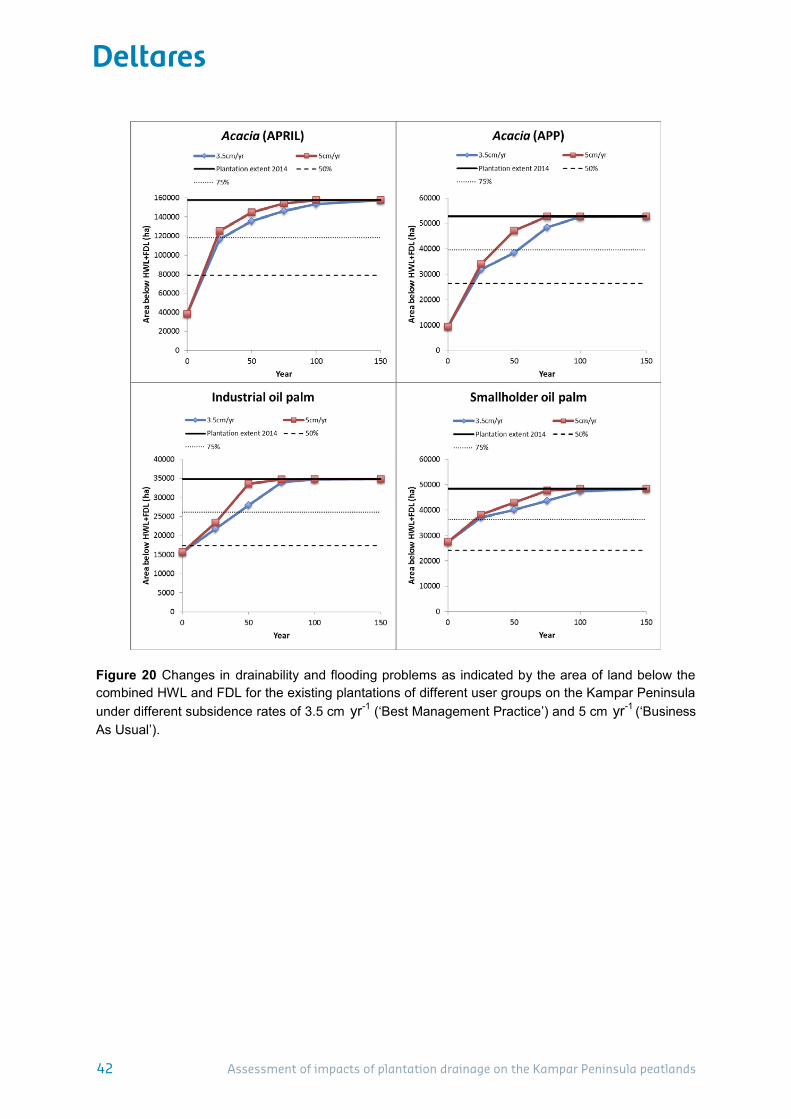
A key finding from this analysis is that the effect of improved water management on the rate of the development of drainability and flood risk problems over time is limited. For Acacia plantations, for example, a ‘Business As Usual’ subsidence rate of 5 cm yr-1 is projected to result in drainability and flooding problems for 76 % of the area within 25 years, while a ‘Best Management Practice’ subsidence rate of 3.5 cm yr-1 leads to drainability and flooding problems for 71 % of the area in this time period (Table 8). Similarly for oil palm, the impact of improved water management is marginal on preventing drainability and flooding problems over the next fifty years. Improved water management may lengthen the lifetime of the whole area under production but this is generally by much less than 25 years and in all cases, the whole plantation area is affected by drainability and flooding problems within 150 years for both the ‘Business As Usual’ and ‘Best Management Practice’ subsidence rates.
Assessment of impacts of plantation drainage on the Kampar Peninsula peatlands 39
Assessment of impacts of plantation drainage on the Kampar Peninsula peatlands
40
Table 7 Areas that are frequently flooded (below HWL) or have impeded drainability (below FDL), in ha and as % of total area, for the full concession areas including areas that were not developed by 2014. Note that FDL presents the area that is ONLY below the FDL level but not below the HWL level. Note that for the undeveloped concession areas an initial subsidence rate of 1.42 m was applied over the first 5 years to account for the initial spike in subsidence directly after drainage (Hooijer et al., 2012), for the subsequent years a ‘Best Management Practice’ subsidence rate of 3.5 cm yr-1 was applied. Note 1: FDL presents the area that is ONLY below the FDL level but not below the HWL level. Note 2: total areas as presented here differ from other tables since calculations are done on a grid of 100 x 100 m and do not exactly cover the vector boundary lines.
ha % of total area
ha % of total area
ha % of total area
2014 0 42982 10.6% 66505 16.5% 109487 27.1%2039 25 128014 31.7% 145961 36.2% 273975 67.9%2064 50 170041 42.1% 159862 39.6% 329903 81.7%2114 100 267475 66.3% 130916 32.4% 398391 98.7%2164 150 354458 87.8% 49229 12.2% 403687 100.0%
2014 0 14035 4.4% 52349 16.3% 66384 20.7%2039 25 79411 24.8% 135809 42.4% 215220 67.1%2064 50 115171 35.9% 146677 45.8% 261848 81.7%2114 100 195358 60.9% 120985 37.7% 316343 98.7%2164 150 272114 84.9% 48441 15.1% 320555 100.0%
2014 0 13077 5.2% 40227 16.1% 53304 21.4%2039 25 60367 24.2% 110463 44.3% 170830 68.6%2064 50 85740 34.4% 123895 49.7% 209635 84.2%2114 100 150572 60.4% 94424 37.9% 244996 98.3%2164 150 205547 82.5% 43564 17.5% 249111 100.0%
2014 0 958 1.3% 12122 17.0% 13080 18.3%2039 25 19044 26.7% 25346 35.5% 44390 62.1%2064 50 29431 41.2% 22782 31.9% 52213 73.1%2114 100 44786 62.7% 26561 37.2% 71347 99.9%2164 150 66567 93.2% 4877 6.8% 71444 100.0%
2014 0 28947 34.8% 14156 17.0% 43103 51.8%2039 25 48603 58.5% 10152 12.2% 58755 70.7%2064 50 54870 66.0% 13185 15.9% 68055 81.9%2114 100 72117 86.7% 9931 11.9% 82048 98.7%2164 150 82344 99.1% 788 0.9% 83132 100.0%
2014 0 9999 28.7% 5602 16.1% 15601 44.9%2039 25 17018 48.9% 4757 13.7% 21775 62.6%2064 50 19064 54.8% 8876 25.5% 27940 80.3%2114 100 30242 86.9% 4488 12.9% 34730 99.8%2164 150 34759 99.9% 25 0.1% 34784 100.0%
2014 0 18948 39.2% 8554 17.7% 27502 56.9%2039 25 31585 65.3% 5395 11.2% 36980 76.5%2064 50 35806 74.1% 4309 8.9% 40115 83.0%2114 100 41875 86.6% 5443 11.3% 47318 97.9%2164 150 47585 98.4% 763 1.6% 48348 100.0%
Year Time in future (yrs)
Area below the following drainage limit: High Water Level (HWL) Free Drainage Limit (FDL) HWL+FDL
All plantations
Industrial Acacia plantations (APRIL & affiliated)
Industrial Acacia plantations (APP & affiliated)
Industrial oil palm plantations
Smallholder oil palm plantations
All Acacia plantations
All oil palm plantations
40 Assessment of impacts of plantation drainage on the Kampar Peninsula peatlands

Assessment of impacts of plantation drainage on the Kampar Peninsula peatlands
41
Table 8 Comparison of percentage of minimum areas that are frequently flooded (below HWL) or have impeded drainability (below FDL) and subsidence rate (‘Best Management Practice’ 3.5 cm yr-1 compared to ‘Business As Usual’ 5 cm yr-1) as a % of total existing plantation area already developed in 2014 within the study area. Note 1: FDL presents the area that is ONLY below the FDL level but not below the HWL level. Note 2: total areas as presented here differ from other tables since calculations are done on a grid of 100 x 100 m and do not exactly cover the vector boundary lines.
3.5 cm/yr 5 cm/yr 3.5 cm/yr 5 cm/yr 3.5 cm/yr 5 cm/yr
2014 0 5.1 5.1 17.5 17.5 22.7 22.72039 25 21.9 29.5 48.7 46.3 70.6 75.72064 50 36.9 52.8 45.9 38.4 82.8 91.22114 100 68.1 91.7 29.9 8.3 98.0 100.02164 150 93.2 100.0 6.8 0.0 100.0 100.0
2014 0 6.5 6.5 17.8 17.8 24.3 24.32039 25 22.7 30.0 51.3 49.5 74.0 79.52064 50 36.7 53.5 49.3 38.2 86.0 91.72114 100 70.0 89.7 27.4 10.3 97.4 100.02164 150 91.2 100.0 8.8 0.0 100.0 100.0
2014 0 1.1 1.1 16.7 16.7 17.8 17.82039 25 19.7 27.9 40.7 36.6 60.4 64.52064 50 37.4 50.5 35.5 39.1 72.9 89.62114 100 62.4 97.7 37.4 2.3 99.8 100.02164 150 99.1 100.0 0.9 0.0 100.0 100.0
2014 0 28.7 28.7 16.1 16.1 44.8 44.82039 25 48.9 51.5 13.7 15.7 62.6 67.22064 50 54.8 60.2 25.5 36.2 80.3 96.42114 100 86.9 99.9 12.9 0.1 99.8 100.02164 150 99.9 99.9 0.1 0.1 100.0 100.0
2014 0 39.2 39.2 17.7 17.7 56.9 56.92039 25 65.3 68.6 11.2 10.4 76.5 79.02064 50 74.1 78.9 8.9 10.1 83.0 88.92114 100 86.6 97.6 11.3 2.4 97.9 100.02164 150 98.4 100.0 1.6 0.0 100.0 100.0
All Acacia plantations
Percentage of area below the following drainage limit by subsidence rate:
Industrial Acacia plantations (APRIL & affiliated)
Industrial Acacia plantations (APP & affiliated)
Industrial oil palm plantations
Smallholder oil palm plantations
YearTime in future (yrs)
HWL FDL HWL+FDL
Assessment of impacts of plantation drainage on the Kampar Peninsula peatlands 41
Assessment of impacts of plantation drainage on the Kampar Peninsula peatlands
42
Figure 20 Changes in drainability and flooding problems as indicated by the area of land below the combined HWL and FDL for the existing plantations of different user groups on the Kampar Peninsula under different subsidence rates of 3.5 cm yr-1 (‘Best Management Practice’) and 5 cm yr-1 (‘Business As Usual’).
42 Assessment of impacts of plantation drainage on the Kampar Peninsula peatlands

Assessment of impacts of plantation drainage on the Kampar Peninsula peatlands
43
6 The potential impact of drainage on carbon emissions on the Kampar Peninsula
As nearly all of the Kampar Peninsula is covered with peat (Figure 22), nearly all plantations on the Kampar Peninsula will be emitting carbon from peat oxidation. Emissions are calculated for the current (2014) active plantation extent.
We have applied an Emission Factor (EF) of 15 t C ha-1 yr-1 which is the IPCC (2013) EF for plantations in general (including both Acacia and oil palm plantations) that corresponds to a ‘Best Management Practice’ subsidence rate of 3.5 cm yr-1 as explained in Chapter 3. Note that IPCC (2013) in fact applies a higher EF for Acacia, of 20 t C ha-1 yr-1, based partly on studies on the Kampar Peninsula (Hooijer et al., 2012; Jauhiainen et al., 2012), and a lower value of 11 t C ha-1 yr-1 for oil palm, but we have chosen to use the middle value presented by IPCC for reasons of simplification. Given that Acacia is the dominant crop of the Kampar Peninsula, the use of the middle value is conservative and results in a lower emission estimate.
The calculated emissions exclude most emissions in the first 5 years after drainage, when a spike in emissions occurs as the initial breakdown rate of fresh ‘labile’ peat is much higher. Hooijer et al. (2012) estimate the annual emission in the first 5 years to be 178 t CO2 ha-1 yr-1 or 49 t C ha-1 yr-1; recent studies in Kalimantan confirm this spike and find even higher emissions in that initial period (79 t C ha-1 yr-1; Hooijer et al., 2014). These numbers also exclude the CH4 (methane) emission that occurs from plantation canals, which is reported to be 1.7 t C ha-1 yr-1 for tropical peatlands by the 2013 IPCC guidelines (IPCC, 2013; FAO, 2014). Despite this potentially high impact, we do not use these numbers in the current assessment which aims to be conservative. Furthermore, we have excluded emissions from canals for log transport outside concessions, for the same reason. This will reduce carbon loss to levels that are typical for degraded lands and a fraction of plantation emissions (IPCC, 2013; Hooijer et al., 2014). Finally, we also exclude emissions from peatland outside of plantations that is affected by plantation drainage.
Given that we have excluded several emission sources (fire, methane), and also areas (logging canals, impact zones around plantations), we consider the emission numbers resulting from this study to be conservative. The calculated emissions for the plantation areas currently in production (Table 5) are presented in Table 9. For the total productive plantation area on the Kampar Peninsula, the annual emissions in 2014 from peat oxidation are estimated to be 4.4 Mt C yr-1 under a ‘Best Management Practice’ scenario that assumes a subsidence rate of 3.5 cm yr-1.
Assessment of impacts of plantation drainage on the Kampar Peninsula peatlands 43
Assessment of impacts of plantation drainage on the Kampar Peninsula peatlands
44
Table 9 Calculated annual carbon emission for current productive plantation (Acacia + oil palm) areas (Table 5).
6.1 The potential impact of drainage on fire occurrence on the Kampar Peninsula
The hotspots recorded by the MODIS Aqua and Terra satellites over the period 2000-2014 are shown in Figure 21. It is very striking to note that, to date, fires have hardly affected the forested parts of the Kampar Peninsula, but have been confined almost entirely to plantation areas and areas directly adjoining plantations. It is evident that fires only occur in drained peatlands, and therefore commonly inside or near plantations. This observation supports earlier studies in Borneo which showed a similar relationship between peat drainage and fire occurrence (Page et al., 2002; Hoscilo et al., 2011). While carbon emissions due to fire are not considered in this assessment, the close relation between fire occurrence and peatland drainage suggests that this should be included in further assessments.
Productive plantation area on Kampar Peninsuala, 2014
Area in production
[ha]
Annual carbon emission using IPCC 2013
‘plantation’ EF for area in production [Mt C yr-1]
industrial Acacia plantation (APP & affiliated) 52869 0.8industrial Acacia plantation (APRIL & affiliated) 158088 2.4industrial oil palm plantation 34875 0.5smallholder oil palm plantation 48395 0.7Subtotal industrial Acacia plantation 210956 3.2Subtotal oil palm plantations 83270 1.2Total 294227 4.4
44 Assessment of impacts of plantation drainage on the Kampar Peninsula peatlands

Assessment of impacts of plantation drainage on the Kampar Peninsula peatlands
45
Figure 21 Extent of 2014 industrial pulp and palm plantations and fires in the study area. Fire hotspots are concentrated almost entirely in or near plantation areas.
Assessment of impacts of plantation drainage on the Kampar Peninsula peatlands 45
Assessment of impacts of plantation drainage on the Kampar Peninsula peatlands
46
7 References Andriesse JP, 1988. Nature and management of tropical peat soils. FAO Soils Bulletin 59,
240 pp. Armentano TV, 1980. Drainage of Organic Soils as a Factor in the World Carbon Cycle.
BioScience 30: 825-830. Cecil CB, Dulong FT, Cobb JC, Supardi, 1993. Allogenic and autogenic controls on
sedimentation in the central Sumatra basis as an analogue for Pennsylvanian coal-bearing strate in the Appalachian basin. In: Cobb JC, Cecil CB (Eds.), Modern and Ancient Coal-Forming Environments, Geological Society of America Special Paper, 286, pp. 3–22.
Couwenberg J, Hooijer A, 2013. Towards robust subsidence-based soil carbon emission factors for peat soils in SE Asia, with special reference to oil palm plantations. Mires and Peat, Volume 12: 1–13.
Cris R, Buckmaster S, Bain C, Reed M (Eds), 2014. Global Peatland Restoration demonstrating SUCCESS. IUCN UK National Committee Peatland Programme, Edinburgh.
Deverel SJ, Leighton DA, 2010. Historic, Recent, and Future Subsidence, Sacramento-San Joaquin Delta, California, USA. San Francisco Estuary and Watershed Science, 8(2), 1-23.
DID Sarawak, 2001. Water management guidelines for agricultural development in lowland peat swamps of Sarawak (Report of the Department of Irrigation and Drainage, Sarawak, Malaysia, 78 pp.
Dradjad M, Soekodarmodjo S, Hidayat MS, Nitisapto M, 2003. Subsidence of peat soils the tidal swamplands of Barambai, South Kalimantan, Jurnal Ilmu Tanah dan Lingkungan, 4, 32–40.
FAO, 2014. Towards climate-responsible peatlands management. Mitigation Of Climate Change In Agriculture Series 9.
Fowler G, 1933. Shrinkage of the peat-covered fenlands. Geographical Journal 81: 149-150. Galloway D, Jones DR, Ingebritsen SE, 1999. Land Subsidence in the United States. U.S.
Geological Survey Circular 1182. Available at http://pubs.usgs.gov/circ/circ1182/. Gandois L, Cobb AR, Hei IC, Lim LBL, Salim KA, Harvey CF, 2013. Impact of deforestation
on solid and dissolved organic matter characteristics of tropical peat forests: implications for carbon release. Biogeochemistry, 114(1-3), 183-199.
Hooijer A, 2008. Kampar Peninsula Science Based Management Support Project Summary Interim Report, April-December 2007. Introduction to the SBMS Project and preliminary results to date. Delft Hydraulics report for APRIL/RAPP, 25 pp.
Hooijer A, Page S, Jauhiainen J, 2009. Kampar Peninsula Science Based Management Support Project ‒ Summary Interim Report, 2007-2008, First tentative findings on hydrology, water management, carbon emissions and landscape ecology. Delft Hydraulics report for APRIL/RAPP, 38 pp.
46 Assessment of impacts of plantation drainage on the Kampar Peninsula peatlands
Assessment of impacts of plantation drainage on the Kampar Peninsula peatlands
47
Hooijer A, Page S, Canadell JG, Silvius M, Kwadijk J, Wösten H, Jauhiainen J, 2010. Current and future CO2 emissions from drained peatlands in SE Asia, Biogeosciences, 7, 1505–1514, doi:10.5194/bg-7-1505-2010.
Hooijer A, Page S, Jauhiainen J, Lee WA, Lu X, Idris A, Anshari G, 2012. Subsidence and carbon loss in drained tropical peatlands. Biogeosciences 9: 1053–1071. http://www.biogeosciences.net/9/1053/2012/bg-9-1053-2012.html.
Hooijer A, Vernimmen R, 2013. Peatland maps for Indonesia. Including accuracy assessment and recommendations for improvement, elevation mapping and evaluation of future flood risk. QANS Lowland Development Report, for Government of Indonesia and Partners for Water (Netherlands), 112 pp.
Hooijer A, Page S, Navratil P, Vernimmen R, van der Vat M, Tansey K, Konecny K, Siegert F, Ballhorn U, Mawdsley N, 2014. Carbon emissions from drained and degraded peatland in Indonesia and emission factors for measurement, reporting and verification (MRV) of peatland greenhouse gas emissions ‒ a summary of KFCP research results for practitioners. IAFCP, Jakarta, Indonesia. http://www.forda-mof.org/files/12._Carbon_Emissions_from_Drained_and_Degraded_Peatland_in_Indonesia.pdf.
Hooijer A, Vernimmen R, Visser M, Mawdsley N, 2015. Flooding projections from elevation and subsidence models for oil palm plantations in the Rajang Delta peatlands, Sarawak, Malaysia. Deltares report 1207384, 76 pp.
Hoogland T, van den Akker JJH, Brus DJ, 2012. Modeling the subsidence of peat soils in the Dutch coastal area. Geoderma 171-172: 92-97.
Hoscilo A, Page SE, Tansey K, Rieley JO, 2011. Effect of repeated fires on land-cover change on peatland in southern Central Kalimantan, Indonesia, from 1973 to 2005. International Journal of Wildland Fire, 20, 578–588.
Husnain H, Putu Wigena IG, Dariah A, Marwanto S, Setyanto P, Agus F, 2014. CO2 emissions from tropical drained peat in Sumatra, Indonesia. Mitig Adapt Strateg Glob Change. DOI 10.1007/s11027-014-9550-y.
Hutchinson JN, 1980. The record of peat wastage in the East Anglian Fenlands at Holme Post, 1848-1978 AD. Journal of Ecology 68, 229-249.
IPCC, 2013. 2013 Supplement to the 2006 IPCC Guidelines for National Greenhouse Gas Inventories: Wetlands. Hiraishi, T., Krug, T., Tanabe, K., Srivastava, N., Baasansuren, J., Fukuda, M. and Troxler, T.G., eds. Available at: http://www.ipcc-nggip.iges.or.jp/public/wetlands/pdf/Wetlands_Supplement_Entire_Report.pdf.
Jauhiainen J, Hooijer A, Page SE, 2012. Carbon dioxide emissions from an Acacia plantation on peatland in Sumatra, Indonesia. Biogeosciences, 9, 617–630. http://www.biogeosciences.net/9/617/2012/bg-9-617-2012.html.
Jauhiainen J, Kerojoki O, Silvennoinen H, Limin S, Vasander H, 2014. Heterotrophic respiration in drained tropical peat is greatly affected by temperature—a passive ecosystem cooling experiment. Environ. Res. Lett. 9: 105013-105031.
Lindsay R, Birnie R, Clough J, 2014. Impacts of Artificial Drainage on Peatlands. IUCN UK Committee Peatland Programme. Briefing Note No3. Available at: http://www.iucn-uk-peatlandprogramme.org.
Assessment of impacts of plantation drainage on the Kampar Peninsula peatlands 47
Assessment of impacts of plantation drainage on the Kampar Peninsula peatlands
48
Mawdsley N, Hooijer A, van der Vat M, Giesen W, Boissevain W, 2013. Technical guidance for peatland policy development. Report on QANS Activity 5.2, for Government of Indonesia and Partners for Water (Netherlands), 86 pp.
Othman H, Mohammed AT, Darus FM, Harun MH, Zambri MP, 2011. Best management practices for oil palm cultivation on peat: ground water-table maintenance in relation to peat subsidence and estimation of CO2 emissions at Sessang, Sarawak. Journal of Oil Palm Research, 23, 1078–1086.
Page SE, Siegert F, Rieley JO, Boehm HDV, Jaya A, Limin S, 2002. The amount of carbon released from peat and forest fires in Indonesia during 1997, Nature, 420, 61–65
Page SE, Rieley JO, Banks CJ, 2011. Global and regional importance of the tropical peatland carbon pool. Glob. Change Biol., 17, 798-818.
Page S, Hooijer A, 2014. Environmental impacts and consequences of utilizing peatlands. In Biancalani, R. and Armine Avagyan, A. (Eds.) Towards climate-responsible peatlands management. Food and Agriculture Organization of the United Nations (FAO), Mitigation of climate change in agriculture series, 9.
ProForest and Deltares, 2005. Landscape-Level assessment of hydrological & ecological values in the Kampar Peninsular. ProForest report for APRIL/RAPP, 106 pp.
Prokopovich N, 1985. Subsidence of peat in California and Florida. Bulletin of the Association of Engineering Geologists 22: 394-420.
Querner EP, Jansen PC, van den Akker JJH, Kwakernaak C, 2012. Analysing water level strategies to reduce soil subsidence in Dutch peat meadows. Journal of Hydrology 446–447: 59–69.
Schothorst CJ, 1977. Subsidence of low moor peat soils in the western Netherlands. Geoderma 17, 265–291.
Stephens JC, Speir WH, 1969. Subsidence of organic soils in the USA. IAHS-AIHS Publication, 89, 523–534.
Stephens JC, Allen LH, Chen E, 1984. Organic soil subsidence, Geological Society of America, Reviews in Engineering Geology, Vol. VI, 107–122.
Turrini AN, 1991. Swampbuster: A Report from the Front. Indiana Law Review 24: 1507-1524.
van den Akker , Kuikman P , de ries F, oving I, Pleijter M, endriks RFA, Wolleswinkel R , Sim es RT , Kwakernaak C, 200 . Emission of CO2 from agricultural peat soils in the Netherlands and ways to limit this emission. In: Farrell C,, Feehan J (eds.) Proceedings of the 13th International Peat Congress “After Wise Use – The Future of Peatlands”, ol. 1 Oral Presentations. International Peat Society, yvaskyla, 645–648.
Vernimmen R, Visser M, Hooijer A, 2014. Demonstration and validation of LiDAR strip approach for peat dome mapping in Indonesia, for the EMRP area in Central Kalimantan and application for part of the Kampar Peninsula in Riau.
Wahyunto, Ritung S, Subagjo H, 2003. Peta Luas Sebaran Lahan Gambut dan Kandungan Karbon di Pulau Sumatera / Map of Area of Peatland Distribution and Carbon Content in Sumatera, 1990-2002. Wetlands International - Indonesia Programme and Wildlife Habitat Canada (WHC), Bogor, Indonesia.
48 Assessment of impacts of plantation drainage on the Kampar Peninsula peatlands

Assessment of impacts of plantation drainage on the Kampar Peninsula peatlands
49
Wösten JHM, Ismail AB, Van Wijk ALM, 1997. Peat subsidence and its practical implications: a case study in Malaysia. Geoderma 78, 25-36.
Assessment of impacts of plantation drainage on the Kampar Peninsula peatlands 49
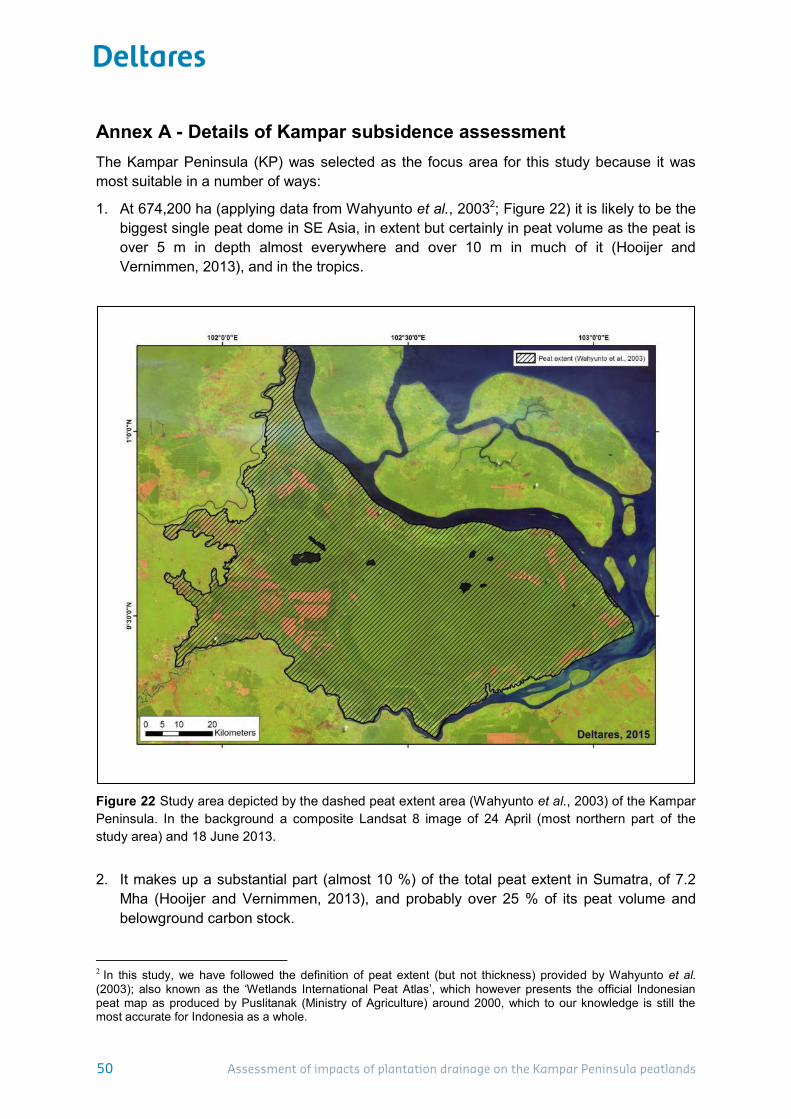
Assessment of impacts of plantation drainage on the Kampar Peninsula peatlands
50
Annex A - Details of Kampar subsidence assessment The Kampar Peninsula (KP) was selected as the focus area for this study because it was most suitable in a number of ways:
1. At 674,200 ha (applying data from Wahyunto et al., 20032; Figure 22) it is likely to be the biggest single peat dome in SE Asia, in extent but certainly in peat volume as the peat is over 5 m in depth almost everywhere and over 10 m in much of it (Hooijer and Vernimmen, 2013), and in the tropics.
Figure 22 Study area depicted by the dashed peat extent area (Wahyunto et al., 2003) of the Kampar Peninsula. In the background a composite Landsat 8 image of 24 April (most northern part of the study area) and 18 June 2013.
2. It makes up a substantial part (almost 10 %) of the total peat extent in Sumatra, of 7.2
Mha (Hooijer and Vernimmen, 2013), and probably over 25 % of its peat volume and belowground carbon stock.
2 In this study, we have followed the definition of peat extent (but not thickness) provided by Wahyunto et al. (2003); also known as the ‘Wetlands International Peat Atlas’, which however presents the official Indonesian peat map as produced by Puslitanak (Ministry of Agriculture) around 2000, which to our knowledge is still the most accurate for Indonesia as a whole.
50 Assessment of impacts of plantation drainage on the Kampar Peninsula peatlands

Assessment of impacts of plantation drainage on the Kampar Peninsula peatlands
51
3. Forest clearing and peat drainage in this area is mostly for Acacia plantations and relatively easily identified, unlike other peat domes that are impacted by multiple conversion processes in often interrelated and confusing ways.
4. Data availability (elevation, peat thickness, peat type, subsidence rate, emission rate) is far better than any peat area in SE Asia outside the EMRP area in Central Kalimantan, thanks to earlier studies by Deltares (ProForest and Deltares, 2005; Hooijer et al., 2009; Hooijer et al., 2012; Jauhiainen et al., 2012; Couwenberg and Hooijer, 2013; Hooijer and Vernimmen, 2013; Vernimmen et al., 2014) and also UGM (who conducted peat thickness surveys in the northern part some years ago, and with whom the airborne LiDAR data for the southern half of the KP were collected in 2014, partly for MIPP and SPPC; see Annex B) and of course the companies active here (most of the peat thickness data points used in this study were collected by APRIL3). Some additional peat thickness data for its concessions were provided by APP.
Focusing on the KP therefore allows a far more robust and confident assessment of the impact of pulp and paper industry on peatlands than is possible for any other area in Indonesia in 20154.
Data on concession boundaries As a starting point, we used the Ministry of Forestry (MoF) map of 2010 on Acacia pulp wood (HTI) and agricultural plantation (oil palm) concessions in Sumatra as also used in the WACLIMAD and QANS projects (Mawdsley et al., 2013; Figure 13). For the HTI concessions, ownership was determined as the MIPP project focusses on the pulp sector (Table 10).
Determining current development status of concessions The actual land use/cover status of plantation concessions on the KP in 2014 was assessed manually from cloud free Landsat images (24 April 2013, 18 June 2013 and 21 June 2014). This was done for Acacia plantations and oil palm plantations, as well as some areas of unclear use. Because the actual land use types in some cases appeared to cross concession boundaries, and it can be hard to distinguish productive and unproductive areas, we started ‘from scratch’ by digitizing all individual primary and secondary canals within plantations (Figure 23). Where an area had a drainage pattern that was consistent with a plantation development that land use status was assigned to it regardless of whether the area was within an official concession boundary. However, the concession type ‘overruled’ observed drainage patterns: if drainage patterns looked consistent with OP, but the area was located in an Acacia (HTI) plantation, the area was considered to be an Acacia plantation (or vice versa) (Figure 24). Smallholder oil palm plantations were assigned to areas which were clearly disturbed as visible from the Landsat imagery by their fragmented pattern. Small (tertiary) canals could for most of the time not be discerned due to the Landsat image resolution (30 m), but primary or secondary drainage canals along the perimeter of the area are often present as these areas were often in the vicinity of industrial oil palm plantations (Figure 25).
3 Data from APRIL used in this study were shared with Deltares in the SBMSP project (Hooijer et al., 2009) and are free to be used by Deltares for other purposes. 4 Projects are ongoing that will allow expansion of this analysis to most of Sumatra by 2016.
Assessment of impacts of plantation drainage on the Kampar Peninsula peatlands 51
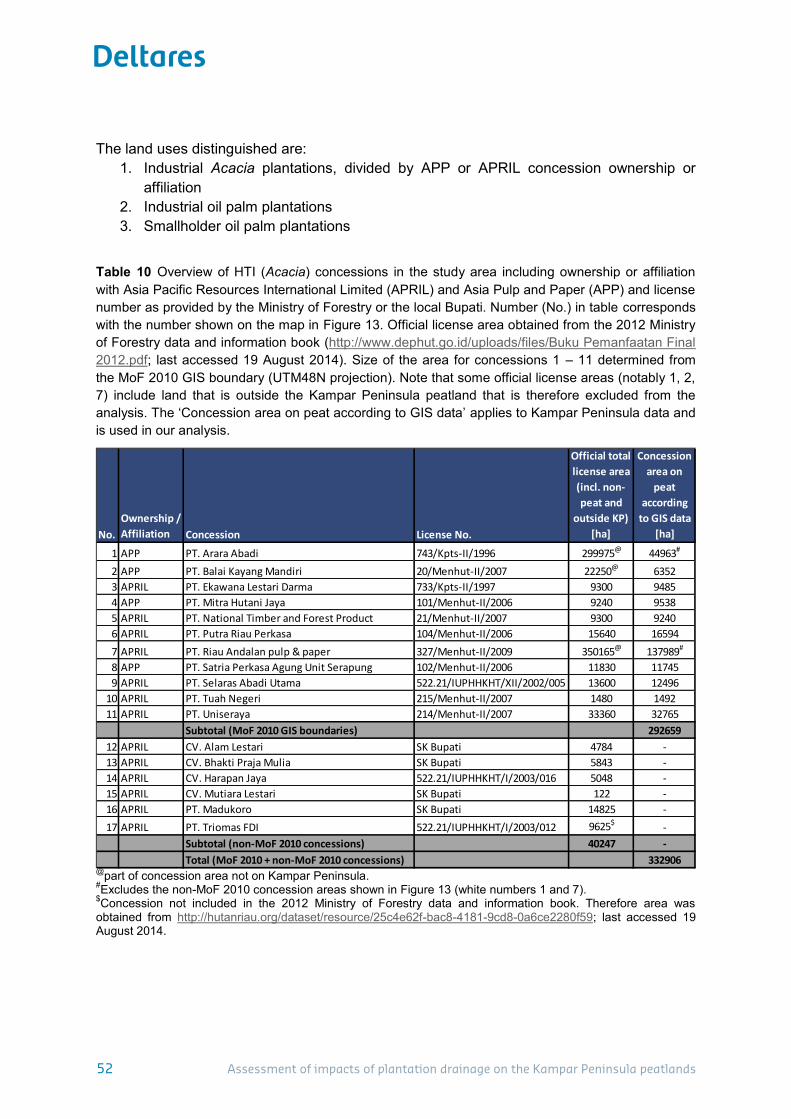
Assessment of impacts of plantation drainage on the Kampar Peninsula peatlands
52
The land uses distinguished are:
1. Industrial Acacia plantations, divided by APP or APRIL concession ownership or affiliation
2. Industrial oil palm plantations 3. Smallholder oil palm plantations
Table 10 Overview of HTI (Acacia) concessions in the study area including ownership or affiliation with Asia Pacific Resources International Limited (APRIL) and Asia Pulp and Paper (APP) and license number as provided by the Ministry of Forestry or the local Bupati. Number (No.) in table corresponds with the number shown on the map in Figure 13. Official license area obtained from the 2012 Ministry of Forestry data and information book (http://www.dephut.go.id/uploads/files/Buku Pemanfaatan Final 2012.pdf; last accessed 19 August 2014). Size of the area for concessions 1 – 11 determined from the MoF 2010 GIS boundary (UTM48N projection). Note that some official license areas (notably 1, 2, 7) include land that is outside the Kampar Peninsula peatland that is therefore excluded from the analysis. The ‘Concession area on peat according to GIS data’ applies to Kampar Peninsula data and is used in our analysis.
@part of concession area not on Kampar Peninsula. #Excludes the non-MoF 2010 concession areas shown in Figure 13 (white numbers 1 and 7). $Concession not included in the 2012 Ministry of Forestry data and information book. Therefore area was obtained from http://hutanriau.org/dataset/resource/25c4e62f-bac8-4181-9cd8-0a6ce2280f59; last accessed 19 August 2014.
No.Ownership / Affiliation Concession License No.
Official total license area (incl. non-peat and
outside KP) [ha]
Concession area on
peat according
to GIS data [ha]
1 APP PT. Arara Abadi 743/Kpts-II/1996 299975@ 44963#
2 APP PT. Balai Kayang Mandiri 20/Menhut-II/2007 22250@ 63523 APRIL PT. Ekawana Lestari Darma 733/Kpts-II/1997 9300 94854 APP PT. Mitra Hutani Jaya 101/Menhut-II/2006 9240 95385 APRIL PT. National Timber and Forest Product 21/Menhut-II/2007 9300 92406 APRIL PT. Putra Riau Perkasa 104/Menhut-II/2006 15640 165947 APRIL PT. Riau Andalan pulp & paper 327/Menhut-II/2009 350165@ 137989#
8 APP PT. Satria Perkasa Agung Unit Serapung 102/Menhut-II/2006 11830 117459 APRIL PT. Selaras Abadi Utama 522.21/IUPHHKHT/XII/2002/005 13600 12496
10 APRIL PT. Tuah Negeri 215/Menhut-II/2007 1480 149211 APRIL PT. Uniseraya 214/Menhut-II/2007 33360 32765
Subtotal (MoF 2010 GIS boundaries) 29265912 APRIL CV. Alam Lestari SK Bupati 4784 -13 APRIL CV. Bhakti Praja Mulia SK Bupati 5843 -14 APRIL CV. Harapan Jaya 522.21/IUPHHKHT/I/2003/016 5048 -15 APRIL CV. Mutiara Lestari SK Bupati 122 -16 APRIL PT. Madukoro SK Bupati 14825 -17 APRIL PT. Triomas FDI 522.21/IUPHHKHT/I/2003/012 9625$ -
Subtotal (non-MoF 2010 concessions) 40247 -Total (MoF 2010 + non-MoF 2010 concessions) 332906
52 Assessment of impacts of plantation drainage on the Kampar Peninsula peatlands
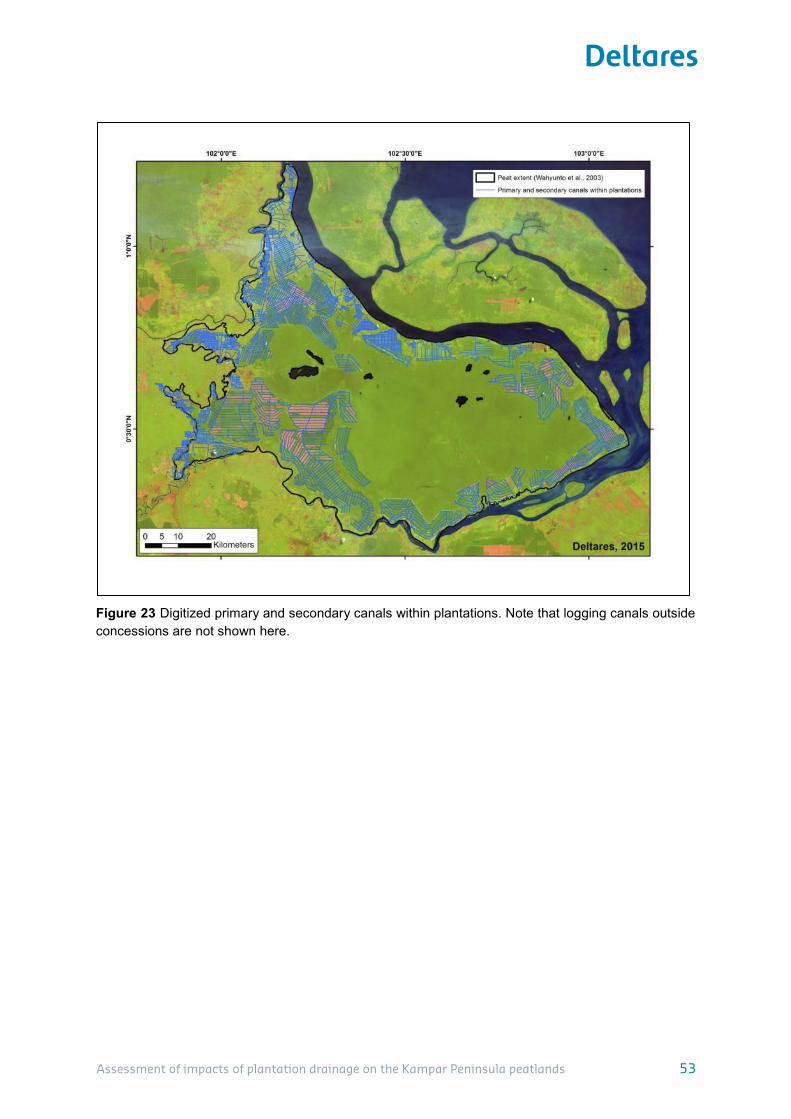
Assessment of impacts of plantation drainage on the Kampar Peninsula peatlands
53
Figure 23 Digitized primary and secondary canals within plantations. Note that logging canals outside concessions are not shown here.
Assessment of impacts of plantation drainage on the Kampar Peninsula peatlands 53
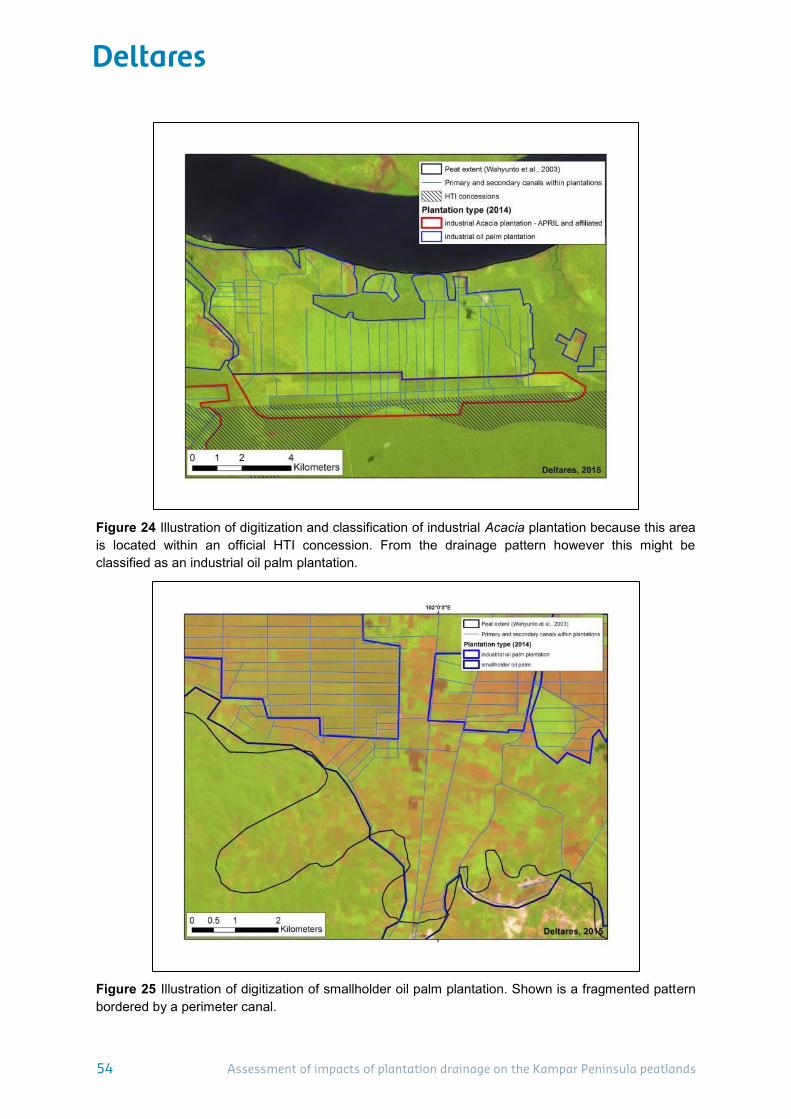
Assessment of impacts of plantation drainage on the Kampar Peninsula peatlands
54
Figure 24 Illustration of digitization and classification of industrial Acacia plantation because this area is located within an official HTI concession. From the drainage pattern however this might be classified as an industrial oil palm plantation.
Figure 25 Illustration of digitization of smallholder oil palm plantation. Shown is a fragmented pattern bordered by a perimeter canal.
54 Assessment of impacts of plantation drainage on the Kampar Peninsula peatlands
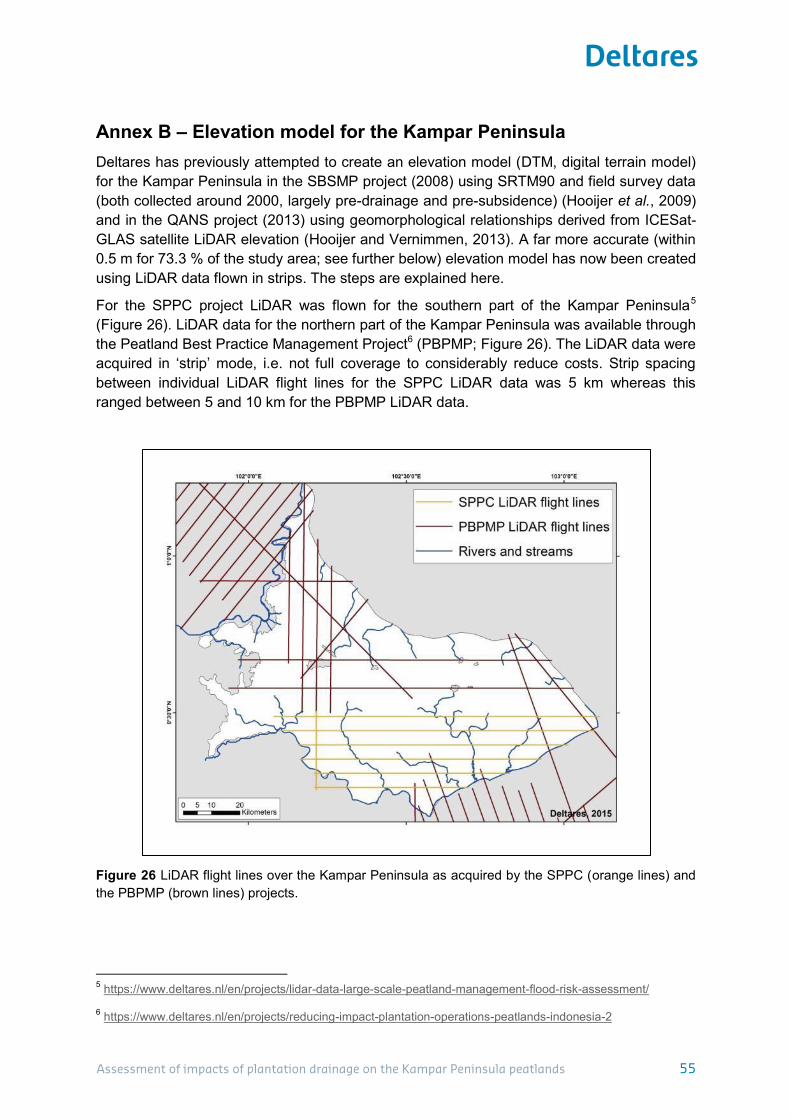
Assessment of impacts of plantation drainage on the Kampar Peninsula peatlands
55
Annex B – Elevation model for the Kampar Peninsula Deltares has previously attempted to create an elevation model (DTM, digital terrain model) for the Kampar Peninsula in the SBSMP project (2008) using SRTM90 and field survey data (both collected around 2000, largely pre-drainage and pre-subsidence) (Hooijer et al., 2009) and in the QANS project (2013) using geomorphological relationships derived from ICESat-GLAS satellite LiDAR elevation (Hooijer and Vernimmen, 2013). A far more accurate (within 0.5 m for 73.3 % of the study area; see further below) elevation model has now been created using LiDAR data flown in strips. The steps are explained here.
For the SPPC project LiDAR was flown for the southern part of the Kampar Peninsula5 (Figure 26). LiDAR data for the northern part of the Kampar Peninsula was available through the Peatland Best Practice Management Project6 (PBPMP; Figure 26). The LiDAR data were acquired in ‘strip’ mode, i.e. not full coverage to considerably reduce costs. Strip spacing between individual LiDAR flight lines for the SPPC LiDAR data was 5 km whereas this ranged between 5 and 10 km for the PBPMP LiDAR data.
Figure 26 LiDAR flight lines over the Kampar Peninsula as acquired by the SPPC (orange lines) and the PBPMP (brown lines) projects.
5 https://www.deltares.nl/en/projects/lidar-data-large-scale-peatland-management-flood-risk-assessment/ 6 https://www.deltares.nl/en/projects/reducing-impact-plantation-operations-peatlands-indonesia-2
Assessment of impacts of plantation drainage on the Kampar Peninsula peatlands 55

Assessment of impacts of plantation drainage on the Kampar Peninsula peatlands
56
The raw LiDAR data were processed by taking the 0.1 percentile elevation value within a 25 m grid as representing the peat surface. To avoid any possible edge effects the 2 outer most cells along the LiDAR strip were removed from the dataset thereby effectively reducing the strip width with 100 m.
The two datasets were brought together, for which the SPPC LiDAR data were first referenced to MSL using the same geoid to MSL correction (-0.706 m) applied to the PBPMP LiDAR data. The resulting data are shown in Figure 27.
Figure 27 Processed LiDAR strip data for the Kampar Peninsula peatland study area.
Before a full coverage elevation model could be created contour lines were drawn between the LiDAR strips which follow the shape of the peat dome. Before these contour lines were drawn, the location of natural streams and rivers were first identified from cloud free Landsat satellite images (Figure 28). Landsat images were also used to identify the shape of peat dome in case the LiDAR strip data itself did not provide sufficient information to complete the drawing of the contour lines.
56 Assessment of impacts of plantation drainage on the Kampar Peninsula peatlands
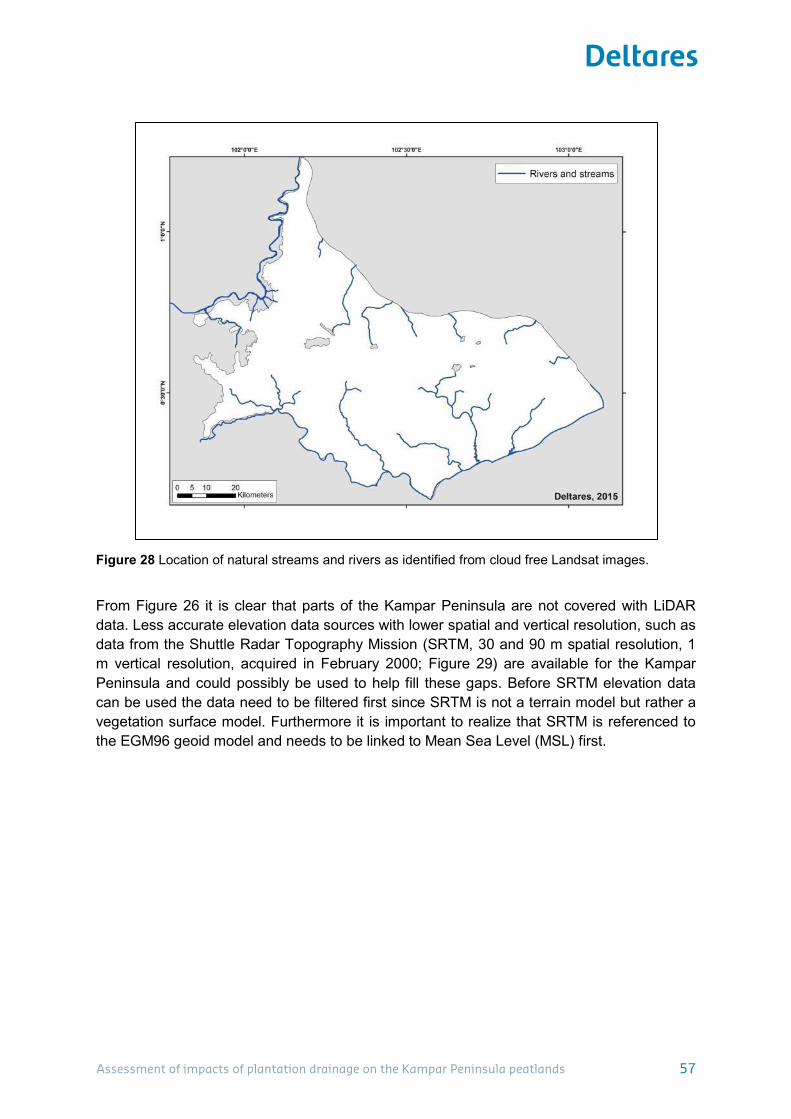
Assessment of impacts of plantation drainage on the Kampar Peninsula peatlands
57
Figure 28 Location of natural streams and rivers as identified from cloud free Landsat images.
From Figure 26 it is clear that parts of the Kampar Peninsula are not covered with LiDAR data. Less accurate elevation data sources with lower spatial and vertical resolution, such as data from the Shuttle Radar Topography Mission (SRTM, 30 and 90 m spatial resolution, 1 m vertical resolution, acquired in February 2000; Figure 29) are available for the Kampar Peninsula and could possibly be used to help fill these gaps. Before SRTM elevation data can be used the data need to be filtered first since SRTM is not a terrain model but rather a vegetation surface model. Furthermore it is important to realize that SRTM is referenced to the EGM96 geoid model and needs to be linked to Mean Sea Level (MSL) first.
Assessment of impacts of plantation drainage on the Kampar Peninsula peatlands 57
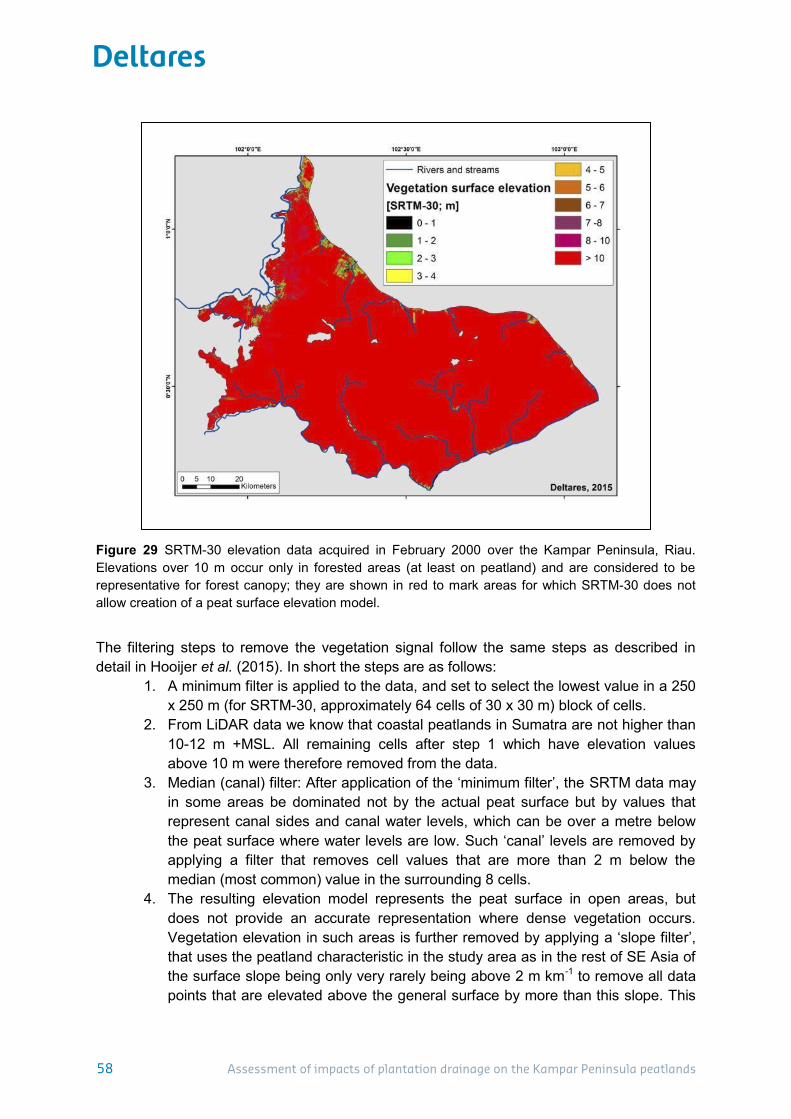
Assessment of impacts of plantation drainage on the Kampar Peninsula peatlands
58
Figure 29 SRTM-30 elevation data acquired in February 2000 over the Kampar Peninsula, Riau. Elevations over 10 m occur only in forested areas (at least on peatland) and are considered to be representative for forest canopy; they are shown in red to mark areas for which SRTM-30 does not allow creation of a peat surface elevation model.
The filtering steps to remove the vegetation signal follow the same steps as described in detail in Hooijer et al. (2015). In short the steps are as follows:
1. A minimum filter is applied to the data, and set to select the lowest value in a 250 x 250 m (for SRTM-30, approximately 64 cells of 30 x 30 m) block of cells.
2. From LiDAR data we know that coastal peatlands in Sumatra are not higher than 10-12 m +MSL. All remaining cells after step 1 which have elevation values above 10 m were therefore removed from the data.
3. Median (canal) filter: After application of the ‘minimum filter’, the SRTM data may in some areas be dominated not by the actual peat surface but by values that represent canal sides and canal water levels, which can be over a metre below the peat surface where water levels are low. Such ‘canal’ levels are removed by applying a filter that removes cell values that are more than 2 m below the median (most common) value in the surrounding 8 cells.
4. The resulting elevation model represents the peat surface in open areas, but does not provide an accurate representation where dense vegetation occurs. egetation elevation in such areas is further removed by applying a ‘slope filter’, that uses the peatland characteristic in the study area as in the rest of SE Asia of the surface slope being only very rarely being above 2 m km-1 to remove all data points that are elevated above the general surface by more than this slope. This
58 Assessment of impacts of plantation drainage on the Kampar Peninsula peatlands
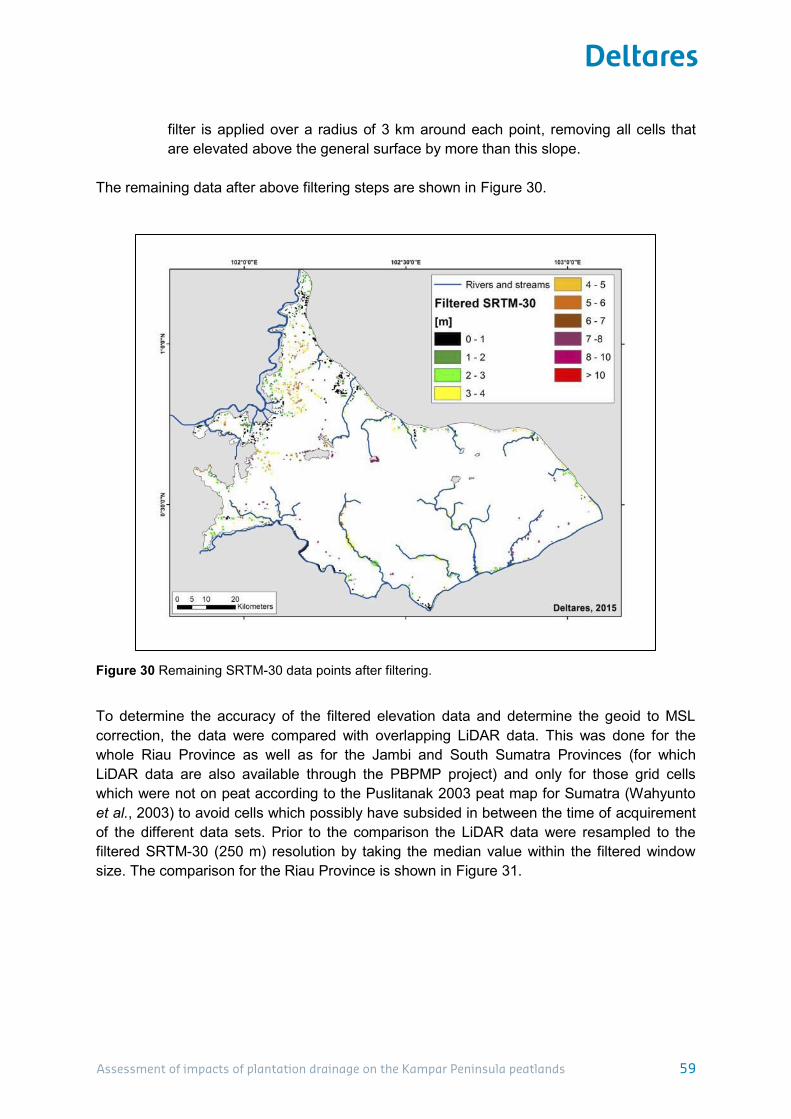
Assessment of impacts of plantation drainage on the Kampar Peninsula peatlands
59
filter is applied over a radius of 3 km around each point, removing all cells that are elevated above the general surface by more than this slope.
The remaining data after above filtering steps are shown in Figure 30.
Figure 30 Remaining SRTM-30 data points after filtering.
To determine the accuracy of the filtered elevation data and determine the geoid to MSL correction, the data were compared with overlapping LiDAR data. This was done for the whole Riau Province as well as for the Jambi and South Sumatra Provinces (for which LiDAR data are also available through the PBPMP project) and only for those grid cells which were not on peat according to the Puslitanak 2003 peat map for Sumatra (Wahyunto et al., 2003) to avoid cells which possibly have subsided in between the time of acquirement of the different data sets. Prior to the comparison the LiDAR data were resampled to the filtered SRTM-30 (250 m) resolution by taking the median value within the filtered window size. The comparison for the Riau Province is shown in Figure 31.
Assessment of impacts of plantation drainage on the Kampar Peninsula peatlands 59
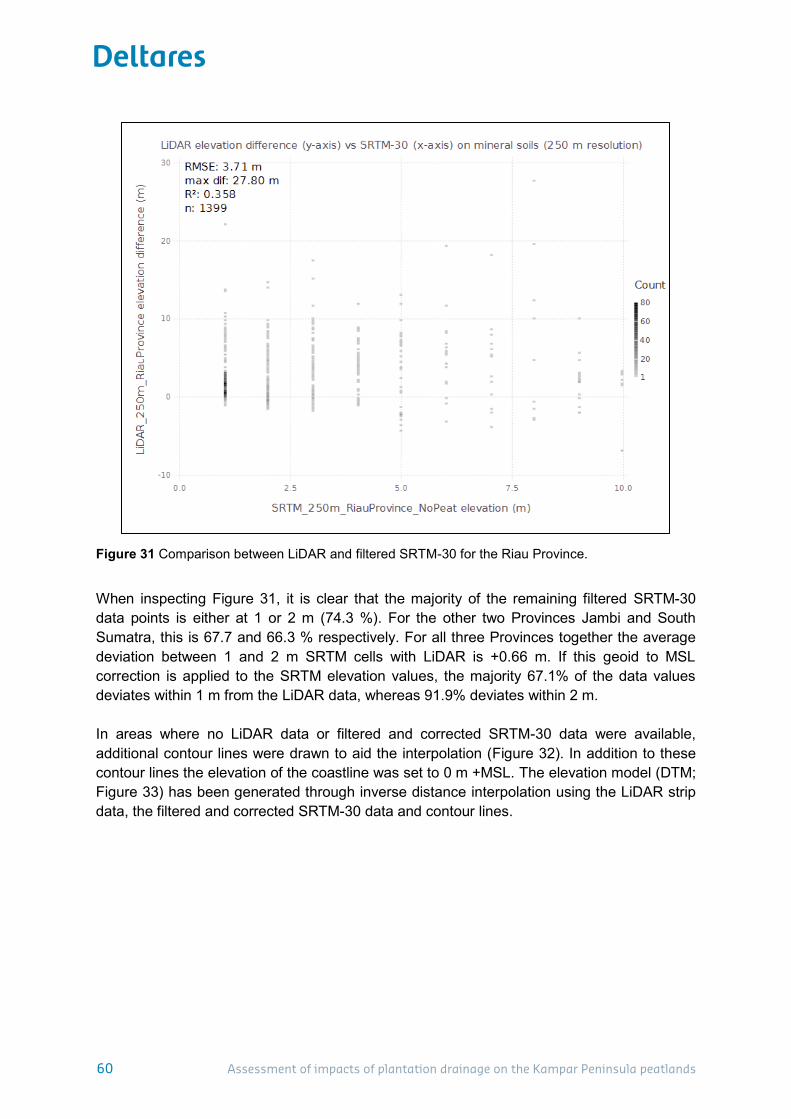
Assessment of impacts of plantation drainage on the Kampar Peninsula peatlands
60
Figure 31 Comparison between LiDAR and filtered SRTM-30 for the Riau Province.
When inspecting Figure 31, it is clear that the majority of the remaining filtered SRTM-30 data points is either at 1 or 2 m (74.3 %). For the other two Provinces Jambi and South Sumatra, this is 67.7 and 66.3 % respectively. For all three Provinces together the average deviation between 1 and 2 m SRTM cells with LiDAR is +0.66 m. If this geoid to MSL correction is applied to the SRTM elevation values, the majority 67.1% of the data values deviates within 1 m from the LiDAR data, whereas 91.9% deviates within 2 m. In areas where no LiDAR data or filtered and corrected SRTM-30 data were available, additional contour lines were drawn to aid the interpolation (Figure 32). In addition to these contour lines the elevation of the coastline was set to 0 m +MSL. The elevation model (DTM; Figure 33) has been generated through inverse distance interpolation using the LiDAR strip data, the filtered and corrected SRTM-30 data and contour lines.
60 Assessment of impacts of plantation drainage on the Kampar Peninsula peatlands
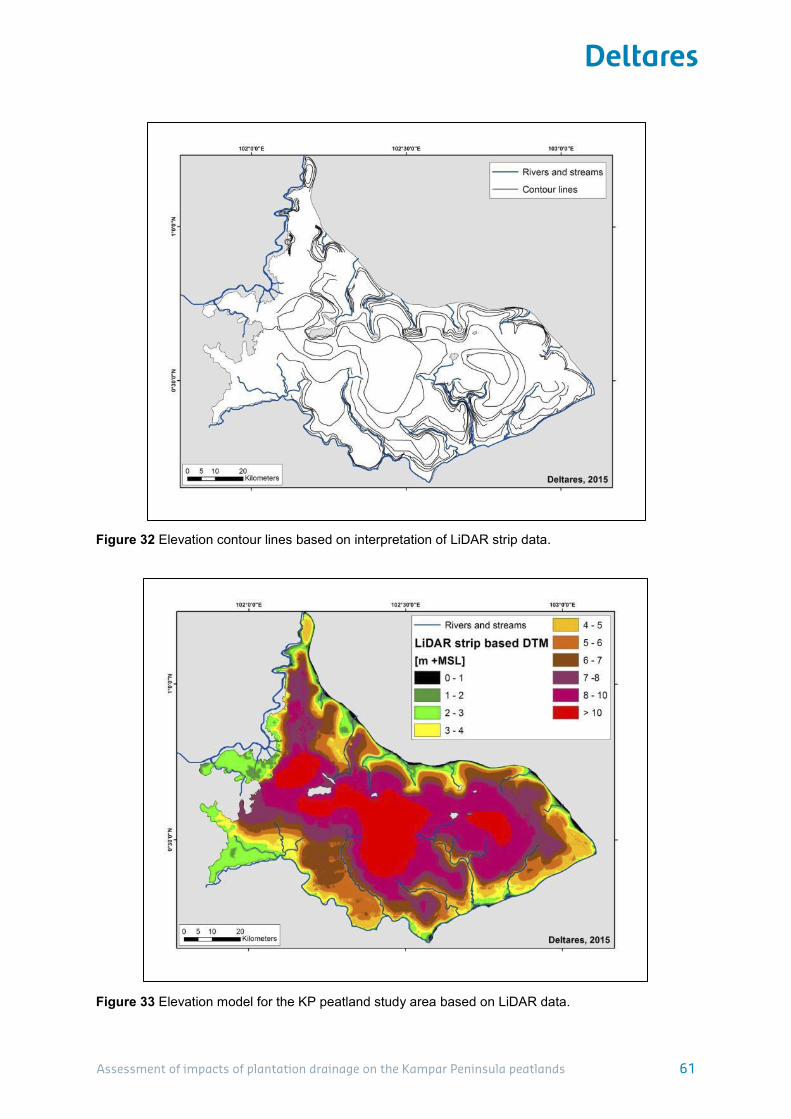
Assessment of impacts of plantation drainage on the Kampar Peninsula peatlands
61
Figure 32 Elevation contour lines based on interpretation of LiDAR strip data.
Figure 33 Elevation model for the KP peatland study area based on LiDAR data.
Assessment of impacts of plantation drainage on the Kampar Peninsula peatlands 61

Assessment of impacts of plantation drainage on the Kampar Peninsula peatlands
62
Figure 34 Three-dimensional DTM versions of the study area, with elevation intervals as in Figure 33. The bottom image also shows the location of the LiDAR flight lines.
We realize that the elevation model will not everywhere be as accurate as on the location of the LiDAR strip data. A confidence map (Figure 35) has therefore been created which accompanies the elevation model (Figure 33). Four confidence classes are defined as follows:
1. On the LiDAR strip data, accuracy is within 0.25 m 2. Within 3 km from the LiDAR strip data, accuracy is for 90% of the area within 0.5 m,
and within 1 m for 100 % of the area (based on findings in Vernimmen et al., 2014)
62 Assessment of impacts of plantation drainage on the Kampar Peninsula peatlands

Assessment of impacts of plantation drainage on the Kampar Peninsula peatlands
63
3. More than 3 km from the LiDAR strip data, where there are filtered and corrected SRTM-30 data, within 1 m for 67 % of the area and within 2 m for 92 % of the area.
4. More than 3 km from the LiDAR strip data, where there are no SRTM-30 data available estimated 75 % of the area within 2 m.
Figure 35 Elevation confidence map for elevation model shown in Figure 33. Confidence classes as explained in text.
Assessment of impacts of plantation drainage on the Kampar Peninsula peatlands 63

Assessment of impacts of plantation drainage on the Kampar Peninsula peatlands
64
Annex C – Peat thickness and carbon stock model of the Kampar Peninsula
Peat thickness data and model The peat thickness and position of the peat bottom in the Kampar Peninsula peat dome need to be quantified before it is possible to understand current and future impacts of drainage on carbon emission and flooding. A total of 577 peat thickness measurements (with an average peat thickness of 8.0±2.7 m), as collected in the QANS project (521 measurements) from several sources (Hooijer and Vernimmen, 2013) and provided by APP through the PBPMP project (56 measurements), were available for the Kampar study area to determine the position of the peat bottom (Figure 36). Of the 577 peat thickness measurements 122 (21.1 %) were located on the LiDAR strip data as shown in Figure 35. An additional 358 peat thickness measurements (62.0 %) were located within 3 km distance from the LiDAR strip data. The remaining 97 (16.8 %) peat thickness measurements were located in areas which have the lowest elevation confidence (see explanation in Annex B). For those peat thickness measurements with the highest confidence in elevation the average peat bottom position is at -0.88±1.99 m below MSL (Table 11).
Table 11 Statistics on peat bottom position determined from peat thickness measurements and the LiDAR elevation model. Distinction has also been made for the separate elevation confidence classes as explained in Annex B.
From Figure 37 it is evident that the peat surface elevation and peat thickness, plotted as a function of distance to the nearest major river (excluding smaller black water rivers, as these are part of the peat dome system and also are not fully mapped), yield nearly identical regression lines although it is noted that the variation in peat thickness is much greater than in elevation, and the regression line for peat thickness therefore has a lower R2 (of 0.39, vs 0.63 for elevation). It follows that the elevation of the peat bottom, which is calculated by subtracting peat thickness from surface elevation, must be close to Mean Sea Level on average and must be close to horizontal, as is also evident from Figure 37. Indeed, the average peat bottom elevation calculated over this dataset is -1.02±1.82 m below MSL.
All 1 2 3 4Average [m MSL] -1.02 -0.88 -1.14 -2.30 -0.75
St. dev. [m] 1.82 1.99 1.70 0.65 1.98n 577 122 358 2 95
min [m MSL] -9.04 -9.04 -7.24 -2.76 -5.04max [m MSL] 2.71 1.95 2.71 -1.84 2.53% <0 m +MSL 71.2 63.1 76.3 100.0 62.1% <2 m +MSL 99.0 100.0 99.4 100.0 95.8
Elevation confidence classes
64 Assessment of impacts of plantation drainage on the Kampar Peninsula peatlands
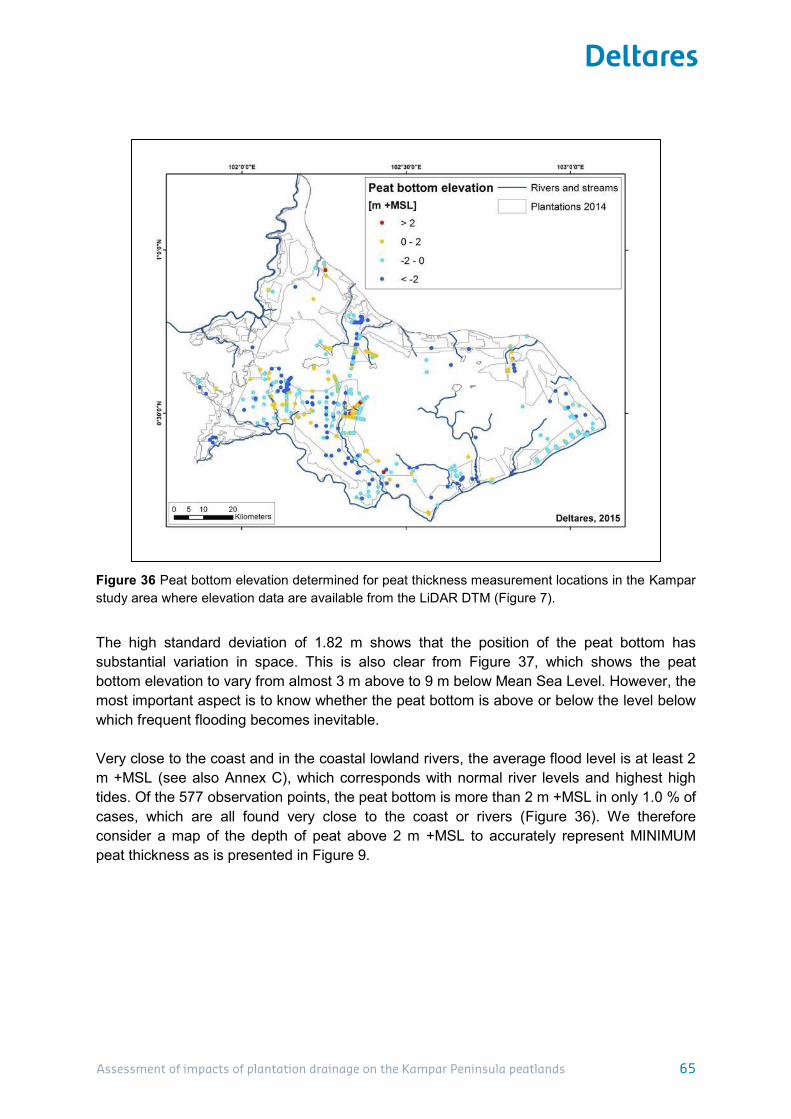
Assessment of impacts of plantation drainage on the Kampar Peninsula peatlands
65
Figure 36 Peat bottom elevation determined for peat thickness measurement locations in the Kampar study area where elevation data are available from the LiDAR DTM (Figure 7).
The high standard deviation of 1.82 m shows that the position of the peat bottom has substantial variation in space. This is also clear from Figure 37, which shows the peat bottom elevation to vary from almost 3 m above to 9 m below Mean Sea Level. However, the most important aspect is to know whether the peat bottom is above or below the level below which frequent flooding becomes inevitable. Very close to the coast and in the coastal lowland rivers, the average flood level is at least 2 m +MSL (see also Annex C), which corresponds with normal river levels and highest high tides. Of the 577 observation points, the peat bottom is more than 2 m +MSL in only 1.0 % of cases, which are all found very close to the coast or rivers (Figure 36). We therefore consider a map of the depth of peat above 2 m +MSL to accurately represent MINIMUM peat thickness as is presented in Figure 9.
Assessment of impacts of plantation drainage on the Kampar Peninsula peatlands 65

Assessment of impacts of plantation drainage on the Kampar Peninsula peatlands
66
Figure 37 Synthesized profiles on peat surface elevation (top), peat thickness (middle) and peat bottom elevation (bottom) of the Kampar Peninsula study area where elevation data are available from the LiDAR-derived DTM as shown in Figure 7.
Carbon stock model In order to quantify the potential future carbon loss it is necessary to know how much carbon is stored in the Kampar peat dome. The amount of carbon stored in a unit volume of peat is estimated by multiplying the bulk density (BD) by the carbon concentration (CC) of dry peat. For all peat a BD value of 0.09 g cm-3 and a uniform CC value of 56 % is applied, following Page et al. (2011), who used these average values to calculate the SE Asia tropical peatland carbon pool. The resulting carbon density is 0.0504 g cm-3. Applying this value to the minimum peat thickness map of the Kampar study area (Figure 9), a total amount of carbon of 1.6 Gt (giga tonnes) is determined, which is 2.8 % of Indonesia’s estimated below ground carbon pool of 57.4 Gt (Page et al., 2011). The distribution of the carbon stock is shown in Figure 38.
66 Assessment of impacts of plantation drainage on the Kampar Peninsula peatlands

Assessment of impacts of plantation drainage on the Kampar Peninsula peatlands
67
Figure 38 MINIMUM peat carbon stock map. Calculated using the minimum peat thickness map (Figure 9) multiplied by a carbon density of 0.0504 g cm-3.
A more likely carbon stock is estimated from the likely peat thickness map derived by applying an average peat bottom position of 1 m below MSL (Table 11) to the elevation model. A total amount of carbon of 2.6 Gt (4.6 % of Indonesia’s estimated below ground carbon pool of 57.4 Gt; Page et al., 2011) is determined. The distribution of the carbon stock is shown in Figure 39.
Assessment of impacts of plantation drainage on the Kampar Peninsula peatlands 67
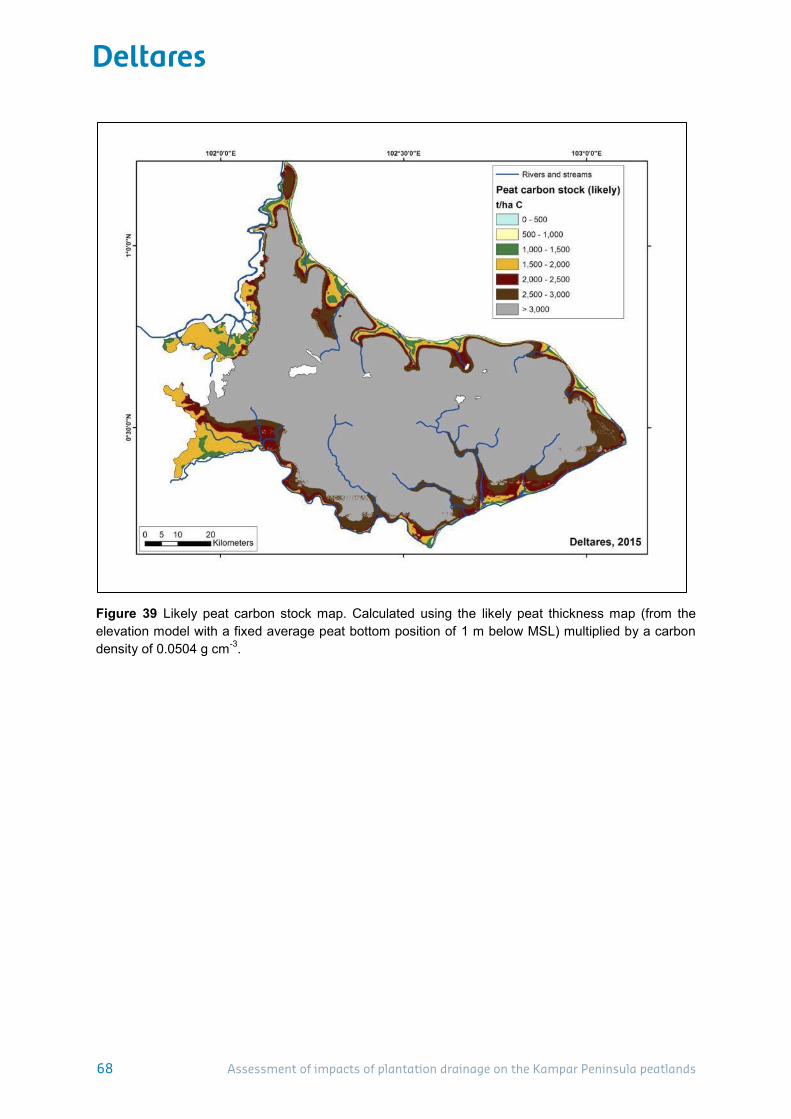
Assessment of impacts of plantation drainage on the Kampar Peninsula peatlands
68
Figure 39 Likely peat carbon stock map. Calculated using the likely peat thickness map (from the elevation model with a fixed average peat bottom position of 1 m below MSL) multiplied by a carbon density of 0.0504 g cm-3.
68 Assessment of impacts of plantation drainage on the Kampar Peninsula peatlands
Assessment of impacts of plantation drainage on the Kampar Peninsula peatlands
69
Annex D – Subsidence and flooding projections for the Kampar Peninsula
Flood risk types
1. Defining the Coastal and River High Water Levels, HWL The High Water Level (HWL) represents the elevation that can be reached by sea and river levels for prolonged periods. HWL therefore represents the elevation below which the land surface would be flooded periodically and for long periods without feasible options to remove flood waters7. Where subsidence is allowed to bring the peat surface below HWL, agriculture will almost certainly be impossible. HWL along the coast Along the coast, tidal HWL is determined by tidal regime and storm surges. Tidal flooding occurs where the land surface is below the upper limit of the astronomic high tide level of the sea surface. As peak high tides occur only over short periods of less than a day, they can sometimes be managed (using ‘flap gate’ systems, or sometimes pumping in small urban areas) near the coast, but usually only as long as they do not coincide with extreme rainfall events. In the long term, such a coincidence of conditions is almost inevitable and flooding to at least high tide level is likely. Such events may be rare and brief, and may not end agricultural productivity by themselves, but they will complicate management, reduce yields and bring up water management cost. Astronomical tidal range could be determined for four tidal stations in the vicinity of the study area (Figure 40). The tidal range in the Kampar River is almost 2 m higher compared to the Siak River (Figure 41). Astronomical tide peak for the Kampar River is 2.5 m +MSL whereas for the Siak River entrance this is 1.4 m +MSL. To the maximum astronomical tide levels an estimated 0.5 m storm surge was added. In the model we have therefore applied a tidal HWL along the coast of 1.9 m +MSL from the Siak River entrance up to 3 m +MSL in the Kampar River. Tidal HWL in the Panjang Strait was estimated through linear interpolation between tidal HWL levels at the Siak River entrance and Kampar River. These levels were in strong agreement with embankment levels as determined from LiDAR strip crossings, which along the Panjang Strait ranged from 1.5 to 3 m +MSL.
7 While pumping can solve flooding problems in small urban areas and some larger areas in Europe and the USA, this solution is almost certainly not feasible in rural areas in SE Asia, because i) the protected agricultural investments here are too low to justify the very high cost and ii) rainfall intensities are far higher than in other parts of the world, requiring proportionally more pumping capacity.
Assessment of impacts of plantation drainage on the Kampar Peninsula peatlands 69

Assessment of impacts of plantation drainage on the Kampar Peninsula peatlands
70
Figure 40 Location of tidal stations in the vicinity of the Kampar Peninsula study area.
Figure 41 Astronomical tidal range for the period April – May 2015 for 4 IHO (International Hydrographic Organization) tidal stations in the vicinity of the Kampar Peninsula study area. Astronomical tide data were extracted using the Delft Dashboard available from https://publicwiki.deltares.nl/display/OET/DelftDashboard. For location of the tidal stations see Figure 40.
HWL along rivers Both Siak and Kampar rivers are known to be tidal for more than 100 km inland (Cecil et al., 1993). Further away from the coast, HWL is increasingly determined by river discharge and
70 Assessment of impacts of plantation drainage on the Kampar Peninsula peatlands
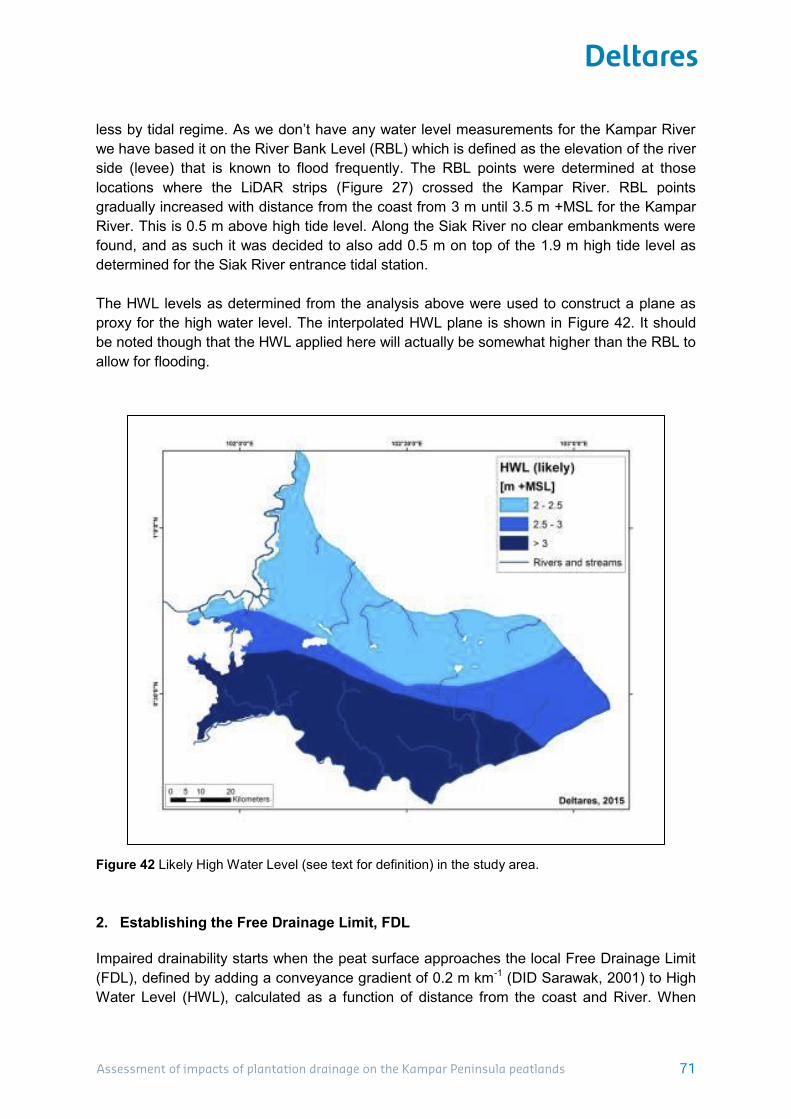
Assessment of impacts of plantation drainage on the Kampar Peninsula peatlands
71
less by tidal regime. As we don’t have any water level measurements for the Kampar River we have based it on the River Bank Level (RBL) which is defined as the elevation of the river side (levee) that is known to flood frequently. The RBL points were determined at those locations where the LiDAR strips (Figure 27) crossed the Kampar River. RBL points gradually increased with distance from the coast from 3 m until 3.5 m +MSL for the Kampar River. This is 0.5 m above high tide level. Along the Siak River no clear embankments were found, and as such it was decided to also add 0.5 m on top of the 1.9 m high tide level as determined for the Siak River entrance tidal station. The HWL levels as determined from the analysis above were used to construct a plane as proxy for the high water level. The interpolated HWL plane is shown in Figure 42. It should be noted though that the HWL applied here will actually be somewhat higher than the RBL to allow for flooding.
Figure 42 Likely High Water Level (see text for definition) in the study area.
2. Establishing the Free Drainage Limit, FDL Impaired drainability starts when the peat surface approaches the local Free Drainage Limit (FDL), defined by adding a conveyance gradient of 0.2 m km-1 (DID Sarawak, 2001) to High Water Level (HWL), calculated as a function of distance from the coast and River. When
Assessment of impacts of plantation drainage on the Kampar Peninsula peatlands 71
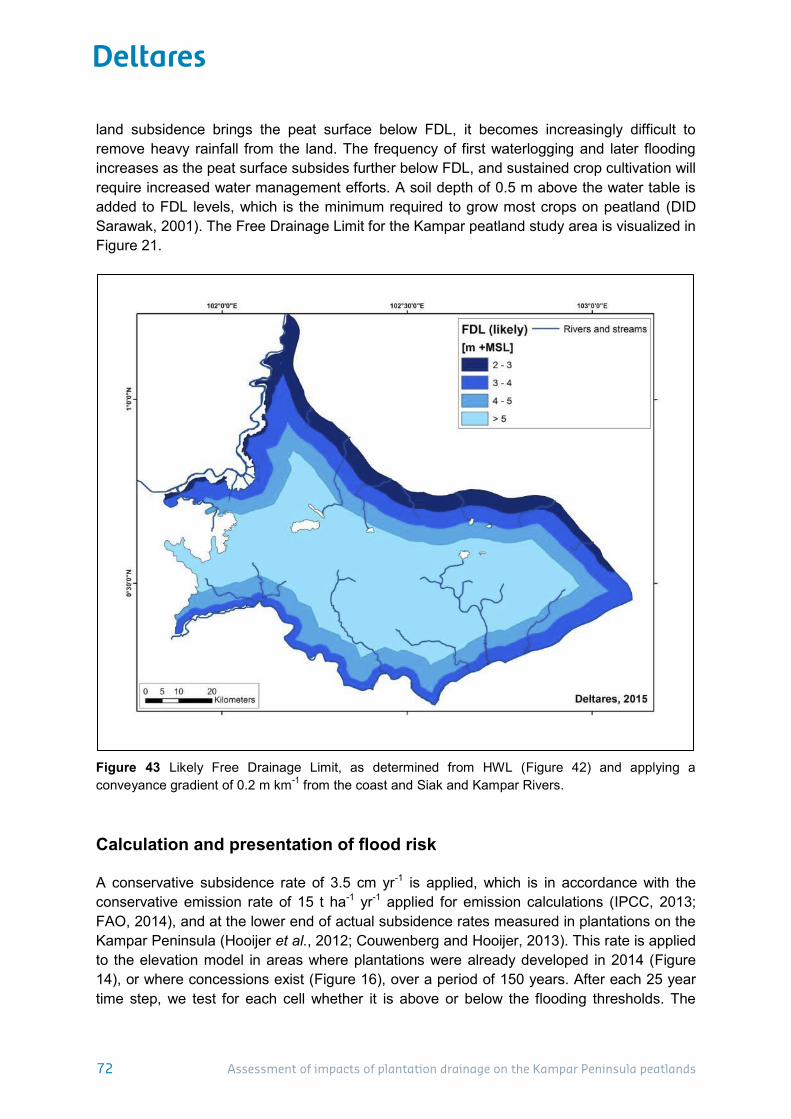
Assessment of impacts of plantation drainage on the Kampar Peninsula peatlands
72
land subsidence brings the peat surface below FDL, it becomes increasingly difficult to remove heavy rainfall from the land. The frequency of first waterlogging and later flooding increases as the peat surface subsides further below FDL, and sustained crop cultivation will require increased water management efforts. A soil depth of 0.5 m above the water table is added to FDL levels, which is the minimum required to grow most crops on peatland (DID Sarawak, 2001). The Free Drainage Limit for the Kampar peatland study area is visualized in Figure 21.
Figure 43 Likely Free Drainage Limit, as determined from HWL (Figure 42) and applying a conveyance gradient of 0.2 m km-1 from the coast and Siak and Kampar Rivers.
Calculation and presentation of flood risk A conservative subsidence rate of 3.5 cm yr-1 is applied, which is in accordance with the conservative emission rate of 15 t ha-1 yr-1 applied for emission calculations (IPCC, 2013; FAO, 2014), and at the lower end of actual subsidence rates measured in plantations on the Kampar Peninsula (Hooijer et al., 2012; Couwenberg and Hooijer, 2013). This rate is applied to the elevation model in areas where plantations were already developed in 2014 (Figure 14), or where concessions exist (Figure 16), over a period of 150 years. After each 25 year time step, we test for each cell whether it is above or below the flooding thresholds. The
72 Assessment of impacts of plantation drainage on the Kampar Peninsula peatlands
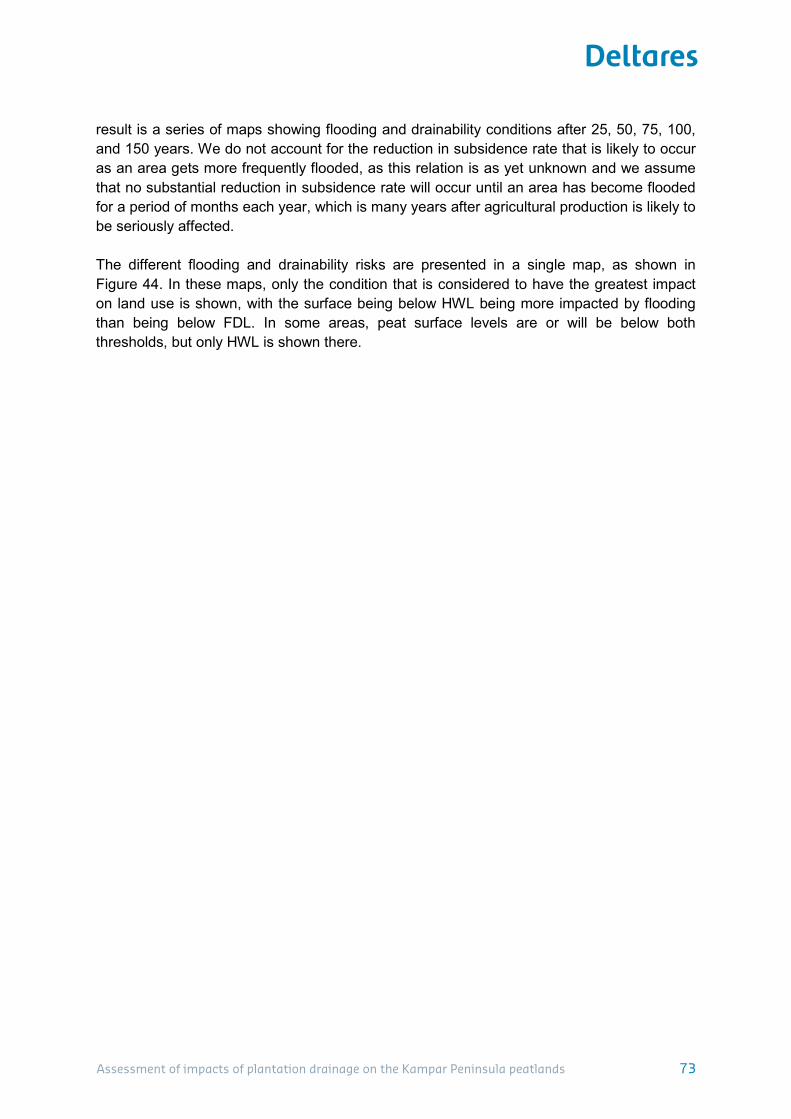
Assessment of impacts of plantation drainage on the Kampar Peninsula peatlands
73
result is a series of maps showing flooding and drainability conditions after 25, 50, 75, 100, and 150 years. We do not account for the reduction in subsidence rate that is likely to occur as an area gets more frequently flooded, as this relation is as yet unknown and we assume that no substantial reduction in subsidence rate will occur until an area has become flooded for a period of months each year, which is many years after agricultural production is likely to be seriously affected. The different flooding and drainability risks are presented in a single map, as shown in Figure 44. In these maps, only the condition that is considered to have the greatest impact on land use is shown, with the surface being below HWL being more impacted by flooding than being below FDL. In some areas, peat surface levels are or will be below both thresholds, but only HWL is shown there.
Assessment of impacts of plantation drainage on the Kampar Peninsula peatlands 73
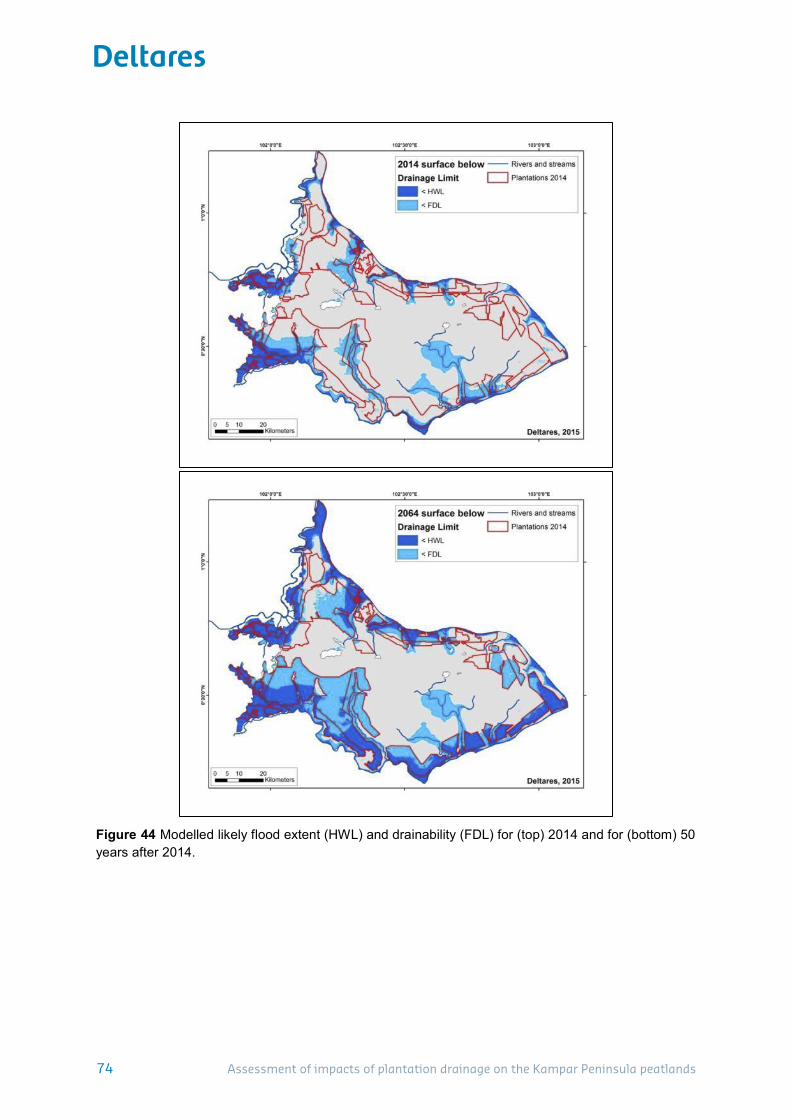
Assessment of impacts of plantation drainage on the Kampar Peninsula peatlands
74
Figure 44 Modelled likely flood extent (HWL) and drainability (FDL) for (top) 2014 and for (bottom) 50 years after 2014.
74 Assessment of impacts of plantation drainage on the Kampar Peninsula peatlands
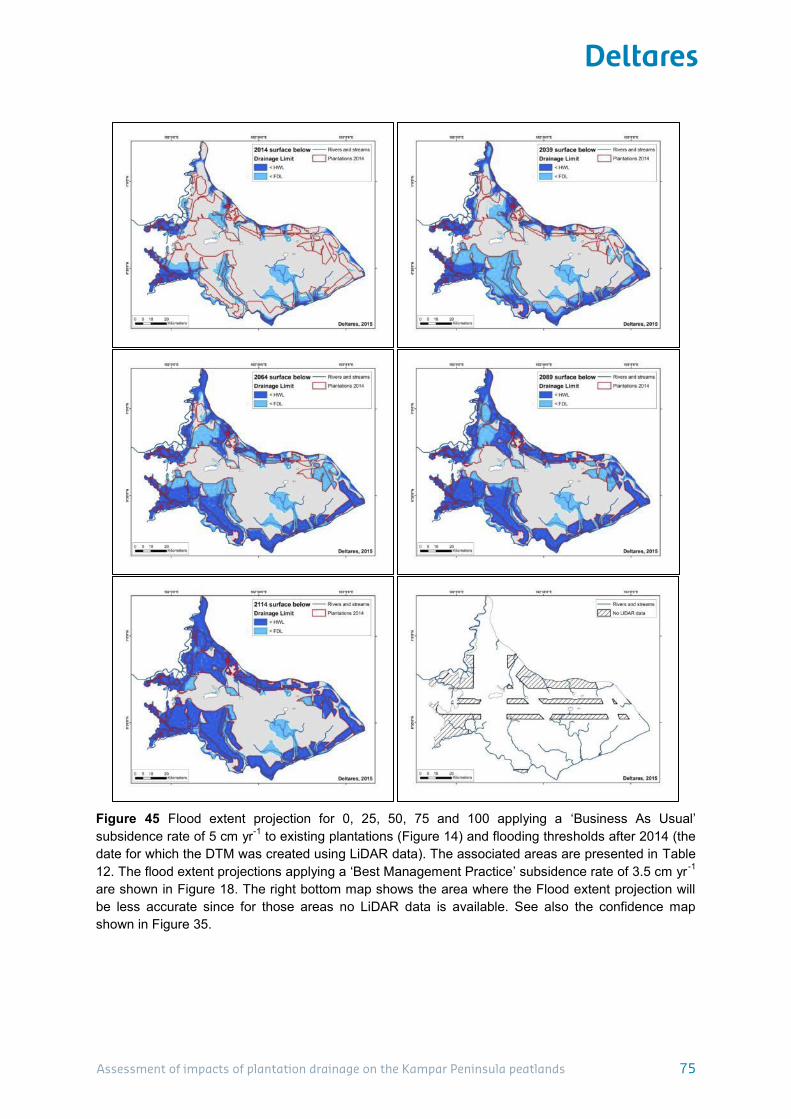
Assessment of impacts of plantation drainage on the Kampar Peninsula peatlands
75
Figure 45 Flood extent projection for 0, 25, 50, 75 and 100 applying a ‘Business As Usual’ subsidence rate of 5 cm yr-1 to existing plantations (Figure 14) and flooding thresholds after 2014 (the date for which the DTM was created using LiDAR data). The associated areas are presented in Table 12. The flood extent projections applying a ‘Best Management Practice’ subsidence rate of 3.5 cm yr -1 are shown in Figure 18. The right bottom map shows the area where the Flood extent projection will be less accurate since for those areas no LiDAR data is available. See also the confidence map shown in Figure 35.
Assessment of impacts of plantation drainage on the Kampar Peninsula peatlands 75

Assessment of impacts of plantation drainage on the Kampar Peninsula peatlands
76
Table 12 Areas that are frequently flooded (below HWL) or have impeded drainability (below FDL), in ha and as % of total area, for the different type of plantations which are already developed in 2014 within the Kampar Peninsula study area, in the 'Business As Usual' scenario applying a subsidence rate of 5 cm yr-1. Note 1: FDL presents the area that is ONLY below the FDL level but not below the HWL level. Note 2: total areas as presented here differ from other tables since calculations are done on a grid of 100 x 100 m and do not exactly cover the vector boundary lines. The areas for the 'Best Management Practice' scenario are provided in Table 5.
ha % of total area
ha % of total area
ha % of total area
2014 0 39742 13.5% 51079 17.4% 90821 30.9%2039 25 113117 38.5% 107858 36.7% 220975 75.3%2064 50 170133 57.9% 98354 33.5% 268487 91.4%2089 75 228951 78.0% 60319 20.5% 289270 98.5%2114 100 274920 93.6% 18714 6.4% 293634 100.0%2139 150 293533 100.0% 101 0.0% 293634 100.0%2189 200 293542 100.0% 92 0.0% 293634 100.0%
2014 0 10208 6.5% 28098 17.8% 38306 24.3%2039 25 47343 30.0% 78026 49.5% 125369 79.5%2064 50 84411 53.5% 60291 38.2% 144702 91.7%2089 75 118614 75.2% 35478 22.5% 154092 97.7%2114 100 141424 89.7% 16311 10.3% 157735 100.0%2139 150 157670 100.0% 65 0.0% 157735 100.0%2189 200 157679 100.0% 56 0.0% 157735 100.0%
2014 0 587 1.1% 8825 16.7% 9412 17.8%2039 25 14696 27.9% 19337 36.6% 34033 64.5%2064 50 26640 50.5% 20616 39.1% 47256 89.6%2089 75 35131 66.6% 17627 33.4% 52758 100.0%2114 100 51576 97.7% 1189 2.3% 52765 100.0%2139 150 52759 100.0% 6 0.0% 52765 100.0%2189 200 52759 100.0% 6 0.0% 52765 100.0%
2014 0 9999 28.7% 5602 16.1% 15601 44.9%2039 25 17907 51.5% 5465 15.7% 23372 67.2%2064 50 20956 60.2% 12583 36.2% 33539 96.4%2089 75 32202 92.6% 2565 7.4% 34767 100.0%2114 100 34748 99.9% 34 0.1% 34782 100.0%2139 150 34763 99.9% 19 0.1% 34782 100.0%2189 200 34763 99.9% 19 0.1% 34782 100.0%
2014 0 18948 39.2% 8554 17.7% 27502 56.9%2039 25 33171 68.6% 5030 10.4% 38201 79.0%2064 50 38126 78.9% 4864 10.1% 42990 88.9%2089 75 43004 88.9% 4649 9.6% 47653 98.6%2114 100 47172 97.6% 1180 2.4% 48352 100.0%2139 150 48341 100.0% 11 0.0% 48352 100.0%2189 200 48341 100.0% 11 0.0% 48352 100.0%
Year Time in future (yrs)
Area below the following drainage limit: High Water Level (HWL) Free Drainage Limit (FDL) HWL+FDL
All existing industrial and smallholder drainage
Industrial Acacia plantation (APRIL & affiliated)
Industrial Acacia plantation (APP & affiliated)
Large scale Oil Palm Plantations
Smallholder Oil Palm Plantations
76 Assessment of impacts of plantation drainage on the Kampar Peninsula peatlands
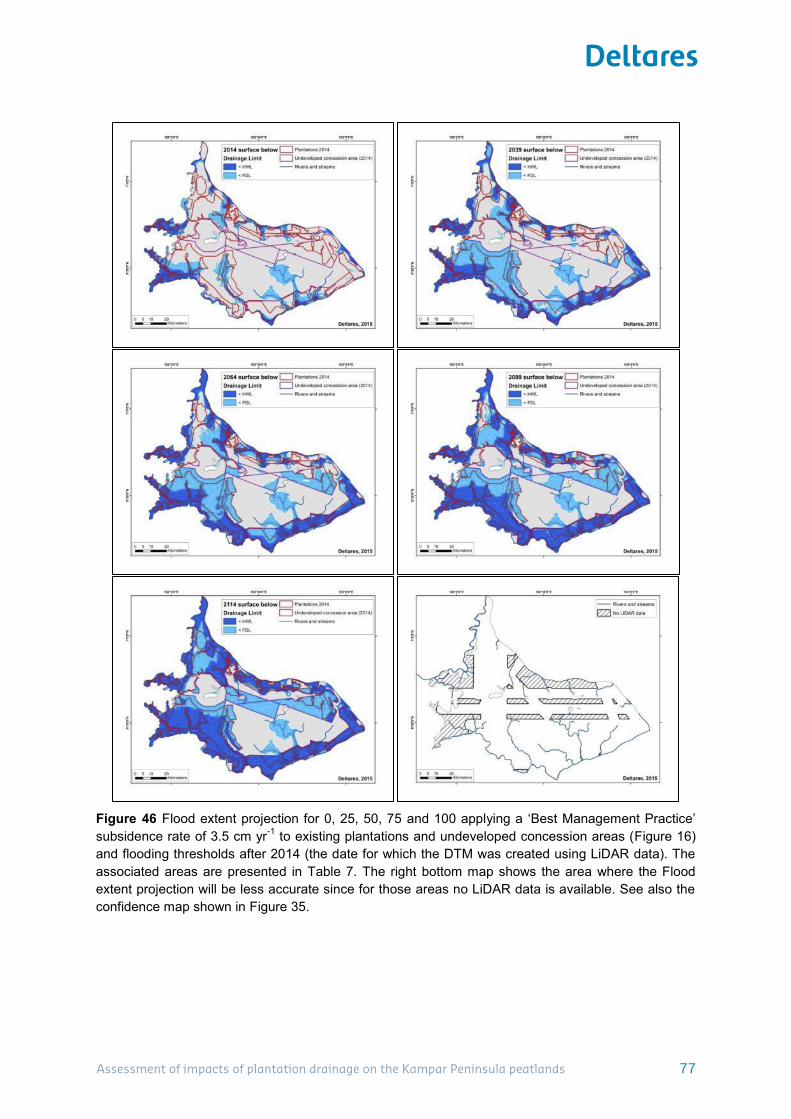
Assessment of impacts of plantation drainage on the Kampar Peninsula peatlands
77
Figure 46 Flood extent projection for 0, 25, 50, 75 and 100 applying a ‘Best Management Practice’ subsidence rate of 3.5 cm yr-1 to existing plantations and undeveloped concession areas (Figure 16) and flooding thresholds after 2014 (the date for which the DTM was created using LiDAR data). The associated areas are presented in Table 7. The right bottom map shows the area where the Flood extent projection will be less accurate since for those areas no LiDAR data is available. See also the confidence map shown in Figure 35.
Assessment of impacts of plantation drainage on the Kampar Peninsula peatlands 77

Assessment of impacts of plantation drainage on the Kampar Peninsula peatlands
78
Annex E – Additional sources of official HTI concessions In this Annex, maps showing location of official recent HTI concessions are presented which include concessions which were not included in the MoF 2010 GIS vector shape file. These maps were used to identify the location and owners of these ‘additional’ TI concessions.
Figure 47 Paper and Pulp plantation concessions from Eyes on the Forest (http://maps.eyesontheforest.or.id/; accessed 19 August 2014).
78 Assessment of impacts of plantation drainage on the Kampar Peninsula peatlands
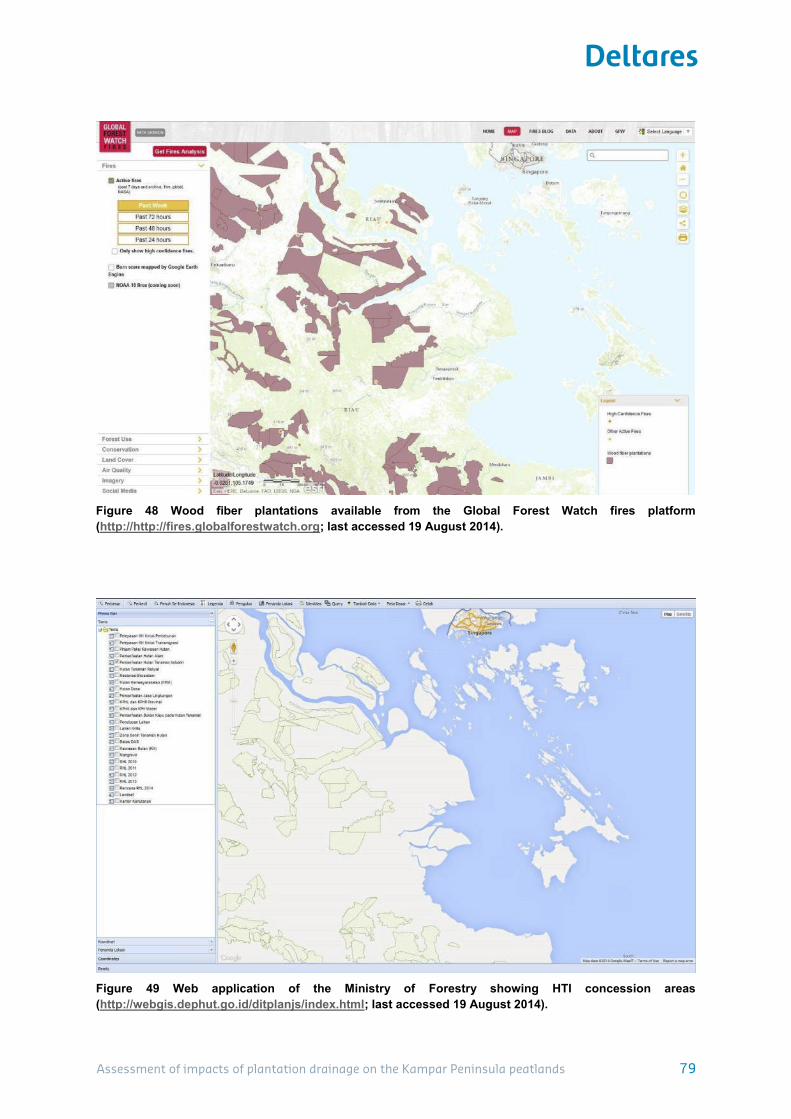
Assessment of impacts of plantation drainage on the Kampar Peninsula peatlands
79
Figure 48 Wood fiber plantations available from the Global Forest Watch fires platform (http://http://fires.globalforestwatch.org; last accessed 19 August 2014).
Figure 49 Web application of the Ministry of Forestry showing HTI concession areas (http://webgis.dephut.go.id/ditplanjs/index.html; last accessed 19 August 2014).
Assessment of impacts of plantation drainage on the Kampar Peninsula peatlands 79
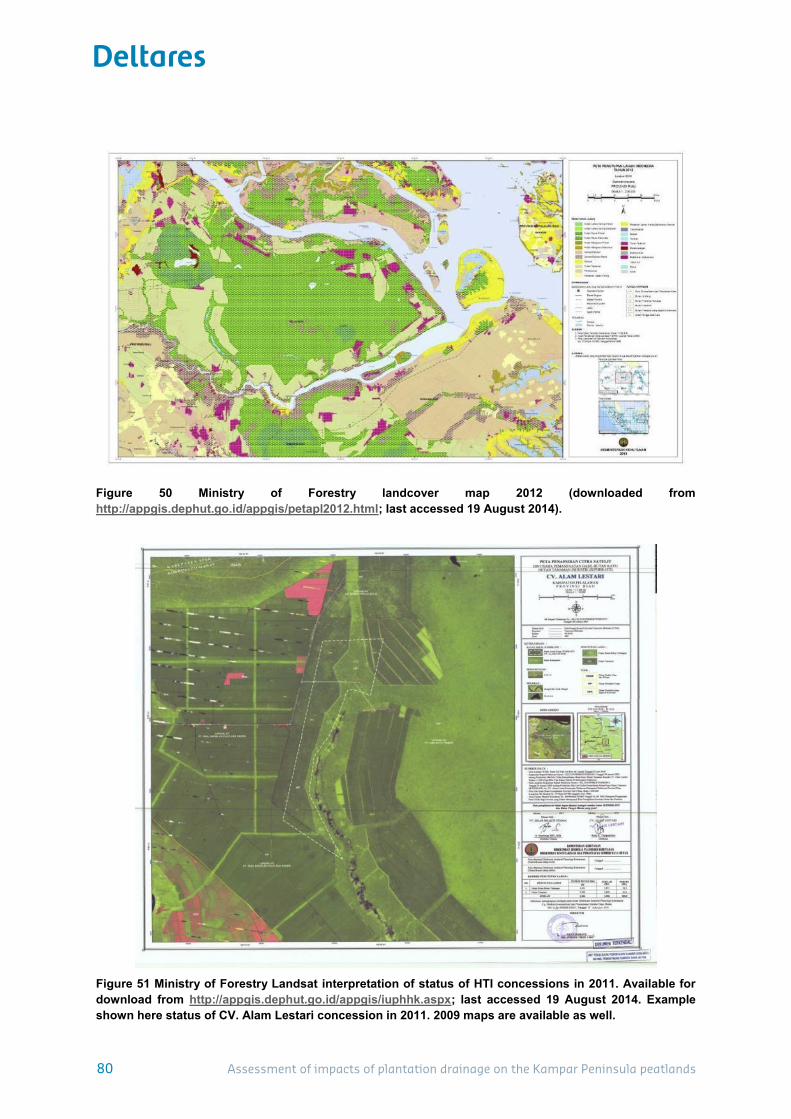
Assessment of impacts of plantation drainage on the Kampar Peninsula peatlands
80
Figure 50 Ministry of Forestry landcover map 2012 (downloaded from http://appgis.dephut.go.id/appgis/petapl2012.html; last accessed 19 August 2014).
Figure 51 Ministry of Forestry Landsat interpretation of status of HTI concessions in 2011. Available for download from http://appgis.dephut.go.id/appgis/iuphhk.aspx; last accessed 19 August 2014. Example shown here status of CV. Alam Lestari concession in 2011. 2009 maps are available as well.
80 Assessment of impacts of plantation drainage on the Kampar Peninsula peatlands

Commissioned by Wetlands International and funded by the Climate and Land-Use Alliance (CLUA) and Norad


