INTERNATIONAL JOURNAL OF GEOMATICS AND GEOSCIENCES
Volume 5, No 1, 2014
© Copyright by the authors - Licensee IPA- Under Creative Commons license 3.0
Research article ISSN 0976 – 4380
Submitted on June 2014 published on August 2014 171
Assessment of land use and land cover changes in south Andaman Island
using remote sensing and GIS Yuvaraj E, Saravanan, Dharanirajan K
Department of Disaster Management, Pondicherry University, Port Blair.
[email protected]
ABSTRACT
Remote Sensing and GIS techniques were used to study the landuse and landcover change in
the South Andaman Island. The study assesses the spatial-temporal land use and land cover
changes between 1979 and 2013 for the southern part of the South Andaman Island. IRS
LISS IV satellite images were used to identify and map the various features of landscapes. In
South Andaman Island the development of landuse is increasing steadily in the last three
decades. The change in landuse prominently depends on the tourism, civil, defence and
fishing sectors which plays an important economic role of development of the union territory.
Settlement area developed from 1637 to 12083.55 ha from the last three decades varies from
urban settlement with houses and major infrastructures where as rural settlement with
adjacent vegetation. Port Blair is the capital city which connects through the mainland
transportation, so the density of population is high around this city. Agricultural activities
present in flat terrain and low lying areas which covers around 1345.31ha. Plantations
practices in flat terrain, coastal low-lying areas and hilly slopes of the island by clearing
dense forest 2266.08 ha. These landuse developments threat the island ecosystem and have
major impacts on the forest, almost 9689.28ha of forest were cleared for the landuse purposes
and nearly 492.94 ha of mangroves were cleared and degraded. The tourism and recreational
activities increase stress on coral reefs and sandy beaches. Sandy beaches are the most
threatened ecosystem in the study area exist only 38.52 ha. It is in need for the sustainable
development of landuse in this island to protect the island ecosystem.
1. Introduction
Land use and land cover (LULC) changes are local, place specific and occurring
incrementally, which finally leads to attention in global scale (De-Sherbinin, 2002; Lambin
and Geist, 2006). Humans have been altering land cover since pre-history through the
clearance of patches of land for agriculture and livestock (De-Sherbinin, 2002). During the
past two centuries the impact of human activities on the land has grown enormously, altering
entire landscapes, and ultimately impacting the earth's nature. The results of the pressure are
numerous and they include intensified agriculture, decreasing amount of forestland, loss of
biodiversity, enormous land degradation and soil erosion (Pellika et al, 2004). Particular
coastal areas are highly sensitive and have valuable ecological areas with extensive
biodiversity and high productivity. Because of this importance, the population in the coastal
zones is increasing rapidly, which leads to industrialization and urbanization (Clarke, 1996).
So it is necessary to study the changes in LULC features in coastal zones (Santhiya et al,
2010) to understanding and assessing the environmental consequences of
such changes (Giri et al, 2005). GIS and Remote Sensing is the indispensable tool that has
been widely used for assessing, analysing and monitoring of land use and land cover change
(Anderson et al., 2001). It is the cost and time benefit technique used (Star et al, 1997) and
also possible to update and retrieve the data which is used in this study for assessing the
LULC change of South Andaman Island.
Assessment of land use and land cover changes in south Andaman Island using remote sensing and GIS
Yuvaraj E et al.,
International Journal of Geomatics and Geosciences
Volume 5 Issue 1, 2014 172
1.1 Land use scenario in Andaman Island
The Andaman and Nicobar Islands are the largest archipelago system in the Bay of Bengal,
consisting of 306 islands and 206 rocks and rocky outcrops (Jayaraj and Andrews, 2005).
During the British colonial period in 1883 a saw mill was established to reduce the timber
demand. Later in 1926 WIMCO matchstick factory (Khan, 1983), after independence the
rehabilitation operations for freedom fighters and industrial demands of the country forest
was cleared for settlement and development purposes (Sarkar, 1989). In the last three decades
there has been a spurt of immigration from mainland India because of subsidised ship fares,
subsidised food, and availability of jobs enhanced enormous people immigration (Jayaraj and
Andrews, 2005). This population flooding caused necessary land use developmental activities
in this island results to clearing of the forests and increased the pressure on natural resources.
Presently there are 555 inhabited villages in ANI with the population of 3,79,944 (Census of
India, 2011). South Andaman district has largest populated area in ANI separated by urban
and rural settlements. The Urban area of South Andaman contributes 97% of total urban
population of ANI consist of built up structures, settlements, infrastructures and other
recreation activities. The rural area of South Andaman contributes 42% of ANI population
consist of settlement with vegetation, agricultural lands and plantations.
2. Study area
Figure 1: Study area – Southern part of South Andaman
The study area southern part of South Andaman Island is very rich in floristic diversity and
enjoys ideal climatic conditions resulting in high diversity and endemism (Rodgers and
Panwar, 1988). The topography of the island is hilly terrain with small tracts of coastal fallow
lands. Geology of the island is considered to be flysch sediments of Paleogene age and
ophiolites and metamorphics of late Cretaceous-early paleogene occur in the main ridge
(Sharma and Srinivasan, 2007). The climate is tropical hot humid with average temperature
ranges from 18°C to 35° C. ANI gets the average rainfall of 3500mm contributing from
North East and South West Monsoons. The location of the study focuses on Southern part of
South Andaman stretching from 11°47’ N to 11°28’ N and 92°31’ E to 92°47’ E where the
human activities mainly exist from last three decades. The population of the study area is 2,
37,586 which divided into urban and rural settlements (census of India, 2011). Port Blair is
the capital city with harbour host of the island having 98% of urban population. The main
Assessment of land use and land cover changes in south Andaman Island using remote sensing and GIS
Yuvaraj E et al.,
International Journal of Geomatics and Geosciences
Volume 5 Issue 1, 2014 173
income of the local community is tourism and fishing. The average tourist arrival is about 1,
20,000 per year (Tourism statistics, 2009) and is increasing in recent years.
2.1 Materials
Spatial data such as Survey of India (SOI) toposheet, Multi-temporal IRS satellite images
(table 1) and secondary/ancillary data such as census report, forest, agricultural, tourism
statistics etc were used for this study. Software packages such as ERDAS IMAGINE 9.1 and
ARCGIS 10 were used for image processing, geo-rectification, digitizing, mapping,
evaluating and analysing the landuse and land cover change. For the field verification and
accuracy assessment purpose, Garmin Ertex GPS were used.
Table 1: Spatial data utilized for the study purpose
Spatial Data Year Resolution/Scale Source
SOI Toposheet 1979 1:25000 Survey of India
IRS 1D LISS III 1998 23.5m NRSC
IRS R2 LISS IV 2013 5.0m NRSC
3. Methodology
Basemap was prepared from the SOI toposheet for co-registering the satellite images
(Saravanan et al, 2013). The raw satellite images were processed in ERDAS IMAGINE 9.1
software and it was geo-referenced by first order polynomial method and nearest neighbour
image re-sampling algorithm (Samereh et al, 2011) with the RMS error range from 0.25 to
0.65 pixel, (Coppin et al., 2004). The False Colour Composite (FCC) of satellite images were
generated by combining near infrared, red and green bands for the clear delineation of
vegetation, built-up and other land cover areas (Prabhbir and Kamlesh, 2011). Visual
interpretation techniques were used to map the toposheet and satellite images. Using the
image interpretation key by SAC (1991) the LULC features were identified by the various
elements like tone, texture, size, shape, pattern, association etc., in the satellite images.
Onscreen classification was carried out (Prabaharan et al, 2010) to determine the changes.
The final map was prepared after the ground truth (Kuldeep and Kamlesh, 2011) and changes
were estimated in ArcGIS software. The output was analysed for land cover degradation and
interpreted with ancillary data collected from various governmental departments. Finally the
stress of landuse on coastal ecosystem was discussed for the better natural resource
management.
4. Result and discussion
4.1 Settlement with vegetation
Satellite image interpretation shows that 10445.61 ha of settlement were increased from 1979
to 2013. Presently the settlement occupies about 12083.55 ha (table 2) which divided to urban
and rural area. Most of the settlements are present with adjacent vegetation cover in this
island (Dharanirajan et al, 2007) instead of this habitation recently the pattern is changing
towards built-up structures in and around the Port Blair urban city. In South Andaman for the
past two decades the landuse development attains maximum due to population growth,
tourism development and immigration of people from mainland. Nearly 70% of the
population of ANI comes under the urban and rural area of South Andaman (census of India,
Assessment of land use and land cover changes in south Andaman Island using remote sensing and GIS
Yuvaraj E et al.,
International Journal of Geomatics and Geosciences
Volume 5 Issue 1, 2014 174
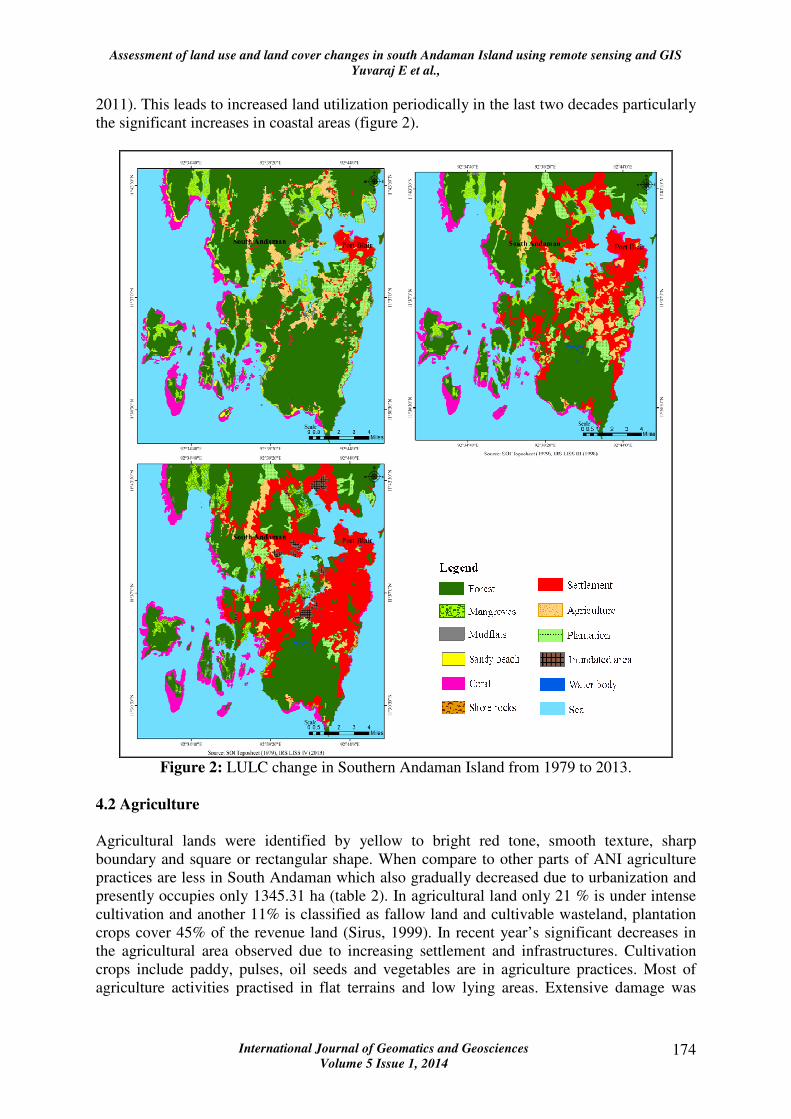
2011). This leads to increased land utilization periodically in the last two decades particularly
the significant increases in coastal areas (figure 2).
Figure 2: LULC change in Southern Andaman Island from 1979 to 2013.
4.2 Agriculture
Agricultural lands were identified by yellow to bright red tone, smooth texture, sharp
boundary and square or rectangular shape. When compare to other parts of ANI agriculture
practices are less in South Andaman which also gradually decreased due to urbanization and
presently occupies only 1345.31 ha (table 2). In agricultural land only 21 % is under intense
cultivation and another 11% is classified as fallow land and cultivable wasteland, plantation
crops cover 45% of the revenue land (Sirus, 1999). In recent year’s significant decreases in
the agricultural area observed due to increasing settlement and infrastructures. Cultivation
crops include paddy, pulses, oil seeds and vegetables are in agriculture practices. Most of
agriculture activities practised in flat terrains and low lying areas. Extensive damage was
Assessment of land use and land cover changes in south Andaman Island using remote sensing and GIS
Yuvaraj E et al.,
International Journal of Geomatics and Geosciences
Volume 5 Issue 1, 2014 175
caused to agricultural land by December 2004 Tsunami around 1317 ha of the agricultural
land are fully submerged by the tsunami inundation impacts (Dharanirajan et al, 2007).
4.3 Plantations
Plantations were identified by its bright red to red tone, coarse to smooth texture, defined
boundary and located in foot hills and uplands. Plantations include coconut, areca nut and
cashew nut are the major plantation found around the study area (NHM, 2013). When
compared to 1979 presently the plantation is less than 29% which occupies around the area of
2266.08 ha. But some of the scattered plantations also practices by the horticultural missions
by the government such as mango, Banana and citrus fruits. Apart from this rubber, teak and
padauk are also planted for industrial purposes.
Table 2: Land use and Landover Changes in South Andaman Island from 1979 to 2013.
Class
Area in
ha
(1979)
Area in
ha (1998)
Area in
ha
(2013)
Change
in ha.
1979-
1998
Change in
ha. 1998 -
2013
Total
Change
(ha)
Mangrove 3163.70 2898.10 2670.75 -265.59 -227.35 -492.94
Forest 29647.03 23194.15 19957.75 -6452.88 -3236.40 -9689.28
Coral 3423.36 3479.19 3344.06 55.83 -135.12 -79.29
Sandy
Beach 1012.15 125.24 38.52 -886.91 -86.72 -973.63
Mudflats 125.63 151.93 179.49 26.30 27.56 53.86
Settlement 1637.94 8602.49 12083.55 6964.55 3481.06 10445.61
Plantation 3223.65 2879.05 2266.08 -344.60 -612.97 -957.57
Agriculture 2703.55 2246.53 1345.31 -457.02 -901.22 -1358.24
Water body 20.65 55.17 77.89 34.52 22.72 57.24
4.4 Forest
Forest was identified imagery by its red tone, irregular shape and coarse texture. The forest
type of ANI is classified into ten types by Champion and Seth (1968) varies from evergreen
to deciduous forest. It forms important ecosystem role in preserving the natural treasures of
the island. Forest area was gradually cleared for the landuse activities presently around
9689.28 ha of forest were cleared for settlement and agriculture purposes in the study area.
Most of the clearance of forest was observed in and around the Port Blair city for developing
settlements and built-up area, whereas in rural areas it is cleared for agriculture purposes
(Figure 2). In some areas plantation replaces the natural vegetation which decreases natural
forest cover. Cutting of trees for the timber purposes are in controlled condition due to forest
department management strategies.
Assessment of land use and land cover changes in south Andaman Island using remote sensing and GIS
Yuvaraj E et al.,
International Journal of Geomatics and Geosciences
Volume 5 Issue 1, 2014 176
4.5 Mangroves
The bright red colour, smooth texture, irregular shape, located in the intertidal area and
associated with low energy coasts or quiet depositional areas were kept used to identify the
mangrove forest in FCC. There are about 22 true species of Mangroves exist in ANI islands
which acts as a barrier for coast which protects the coast from cyclone and tsunami and also
serves as a nursery ground for fishes, crabs and shells etc (Damroy and Krishnan, 2005). In
South Andaman Island mangroves occupy nearly 10% of the forest area. Approximately 1300
ha of the mangroves were affected and 169 ha are submerged and degraded during 26th
December 2004 tsunami (Dharanirajan et al, 2007). Presently there are around 2670.75 ha of
mangroves exist in the study area.
4.6 Coral reefs
Coral reefs were identified by the turquoise blue tone, irregular ovoid shape, smooth texture
and adjacent to coast in onshore. Luxuriant distributions of coral reef were present in the
western coast, whereas in the eastern coast narrow distribution of fringing reefs adjacent to
the shores was notified. Coral reefs act as a buffer zone and protect the land area. There are
about 3344 ha of coral reef exist in study area were identified in the satellite images (table 2),
among this reef flats were observed to be maximum in distribution. Nearly 135 ha of coral
reef were degraded, most of the reefs were damaged by the tsunami waves and significant
impacts were observed in the Wandoor (Maharaj et al, 2006). Extensive runoff is the major
threat for corals which deposits sediments and sands on coral reefs (Dharanirajan et al, 2010).
4.7 Sandy beaches
Sandy beaches were identified by its white, linear crescent shape and smooth texture which is
situated adjacent to the coast. According to toposheet information the sandy beach in 1979
was approximately 1012 ha but presently it occupies only 38 ha in the study area (Figure 3).
Natural hazards such as tsunami, cyclones and coastal erosion have adverse impacts on these
beaches. It is the most imperiled ecosystem in South Andaman Island, particularly after the
December 2004 tsunami this ecosystem is endangered in this island (Yuvaraj et al, 2012).
Anthropogenic impact like sand mining is a major threat that leads to loss of sandy beaches in
this island (Andrews and Vasumathi, 2002). Apart from these tourism activities, major
constructions and shore protection structures also have impacts on this beach ecosystem.
Figure 3: Chart shows LULC changes from 1979 to 2013 in the Southern Andaman
Island.
Assessment of land use and land cover changes in south Andaman Island using remote sensing and GIS
Yuvaraj E et al.,
International Journal of Geomatics and Geosciences
Volume 5 Issue 1, 2014 177
4.8 Mudflats
Mudflats are the coastal wetlands in the intertidal zones which mostly found near the
mangroves back swamps of the study area. It was identified by the Persian green with
brownish tone and smooth texture in FCC. These mudflats were mostly submerge during the
high tide. Due to tsunami mangroves in Bamboo flat and Saithankhari were damaged and
degraded (Dharanirajan et al, 2007) and are converted into mudflats. Whereas the inundation
caused by tsunami in low lying lands of sippighat, Saithankhari and Tirur the pasture and
vegetation lands were converted into mudflats. Mudflats presently occupy area of about
179.49 ha.
4.9 Water body
The water bodies like dams and lakes are manmade in the South Andaman Island which
provides water for the domestic purposes. Presently the water bodies occupy about 77.89 ha
in this island. Dhanikhari dam is the major reservoir with capacity of 4.2 million m3 of water
mostly contributes the water supply for the urban and rural areas of South Andaman. For the
Port Blair area Jawahar Sarowar dam provides water but it has lower storage capacity of
0.285 million m3.
4.10 Land use development and its impacts on Island ecosystem
South Andaman Island is the most inhabited and disturbed in Andaman Island group (IIRS,
2003). From the last three decades gradual increase in utilization of land was observed in
South Andaman Island. Landuse development dominate in the coastal areas where the
resources available for the economic development. The extended coastal and inland wealth
distributed throughout the island subsequently the economic development leads to increase
the landuse each year; this situation increases the stress on the island ecosystems (SAC,
2003) such as forest, mangroves, coral reefs and sandy beaches.
4.10.1 Impacts on forest
Increasing settlements results encroachment, forest fragmentation, agricultural development,
plantation and conversion to monocultures leading to forest degradation and loss of
biodiversity (Jayaraj and Andrew, 2005). In 1901 agricultural activities was initiated by
clearing forest area, but till 1960, only 1.2 % of the land area was cultivated (Saldhana, 1989).
Presently due to human intervention, economic needs and demands, agriculture activities
were extended in the low lying and flat lands of South Andaman Island. Plantations are also
increased throughout the island particularly archnut, and coconut plantations occupies in hilly
slopes and coastal lands. This condition leads to loss of natural vegetation, biomass reduction,
soil erosion and other runoff impacts.
4.10.2 Impacts on coastal ecosystem
Coastal ecosystem provides many resources which plays major economic role of people’s
income in this island (Roy and George, 2010). In recent years over exploitation of these
resources and recreation activities were observed (Jayaraj and Andrews, 2005). Sandy
beaches are in threatened condition in this island only 38 ha of beach is remain in the study
area which is less than 5% on compare to 1979 toposheet. If this condition persists, beaches
loss its tourism attraction and also loss of turtle nesting and other habitat. Tourism activities
Assessment of land use and land cover changes in south Andaman Island using remote sensing and GIS
Yuvaraj E et al.,
International Journal of Geomatics and Geosciences
Volume 5 Issue 1, 2014 178
increases the stress on this ecosystem, the beaches in North Bay, Wandoor, Chidyatapu and
Carbyn’s Cove are severely affected by the tourism recreational activities (Figure 4a).
Figure 4a: Restaurants and seawall construction in Carbyn’s cove beach. b) Conversion of
mangrove area into settlement at Wandur
Mangroves are under the risk of clearing for agriculture and fuel woods. Most of the
mangroves were cleared for the agricultural purposes this leads to loss of its productivity and
community structure (SAC, 2011). In some areas settlements were observed near the
mangrove forests it may leads to encroachment activities (Figure 4b). Landuse activities in
the watershed areas lead to extensive runoff which carries enormous sediment load (Clarke,
1996) which covers the coral reefs and affects its ecosystem. Tourism activities like coral
watch, snorkelling, scuba diving and sea walking are practices in this island which have
major impacts on this ecosystem. Fishing activities on the coastal areas also have impacts on
the coral reefs and mangroves.
5. Conclusion
Satellite remote sensing and GIS is an indispensible tool for mapping, evaluating and
monitoring the landuse changes. LULC changes in South Andaman Island mainly due to the
population growth, urbanization and tourism recreations. The LULC change indicates that
34% of forest was cleared from the past 30 years due to anthropogenic developmental
activities, further the urban area was extending steadily in the island especially in the coastal
zones. The trend in developing landuse was inevitable in Port Blair and gradual in other areas
of South Andaman which occupies 12083.55 ha. These developmental activities increase the
stress on natural ecosystems mainly on sandy beaches, forest, mangroves and coral reefs.
Sandy beaches of this island are the most threatened ecosystem which presently occupies
only 38.52 ha in the study area. The frequent landuse development activities from last three
decades increase stress on forest and coastal ecosystems. It is in need to monitor the LULC
change to prepare the appropriate landuse plan for the sustainable development of this island.
6. References
1. Anderson J.R., Hardy E.E., Roach J0.T., and Witmer R.E., (2001), a land use and land
cover classification system for use with remote sensor data. Geological Survey
Professional Paper 964 and a revision of the land use classification system as
presented in U.S. Geological Survey Circular 671.
Assessment of land use and land cover changes in south Andaman Island using remote sensing and GIS
Yuvaraj E et al.,
International Journal of Geomatics and Geosciences
Volume 5 Issue 1, 2014 179
2. Andrews H.V., and Vasumathi S., (2002), Sustainable Management of Protected areas
in Andaman and Nicobar Islands, ANET, IIPA and FFI. New Delhi.
3. Census of India, (2011), Andaman and Nicobar Islands – Data sheet on rural urban
breakup of population. Census directorate Andaman and Nicobar Islands, Port Blair.
4. Champion H.G., and. Seth S.K., 1968. A revised Survey of the forest Types of India.
Forest Research Institute, Dehra Dun, India.
5. Clarke R. John., (1996), Coastal zone management: Handbook, Taylor and Francis,
p.720
6. Coppin P., Jonckheere I., Nackaerts K., and Muys B., (2004), Digital change
detection methods in ecosystem monitoring: a review, International Journal Remote
Sensing, 25, pp 1565-1596.
7. Damroy S., and Krishnan P., (2005), Mangrove stands of Andamans vis-à-vis tsunami.
Current science, 89(11) pp 1800 – 1804.
8. Dam Roy S., and Grinson George., (2010), Marine resources of islands: status and
approaches for sustainable exploitation / conservation with special emphasis to
Andaman and Nicobar. Indian Journal of Animal Sciences, 80(4) pp 57-62.
9. De Sherbinin A., Kline K., and Raustiala K., (2002), Remote sensing Data; valuable
support for environmental treaties. Enviroment, 44(1) pp 20-31.
10. Dharanirajan K., Kasinathapandian P., Gurugnanam B., Narayanan R.M., and
Ramachandran S., (2007), An Integrated study for the Assessment of Tsunami
impacts: A case study of South Andaman Island, India using Remote Sensing and GIS.
Coastal Engineering Journal 49, pp 229 -266
11. Dharanirajan K., Thanikachalam M., Gurugnanam B., Narayanam R.M., and Gopal
Chandra Falia., (2010), Remote Sensing and GIS for the Study of Coastal Ecosystem
Changes and its Conservation. International Journal of Earth Sciences and
Engineering 3 (4), pp 512 – 524.
12. Giri C., Zhu Z., and Reed B., (2005), “Comparative analyses of the Global
Land Cover 2000 and MODIS land cover data sets”, Remote Sensing of
Environment , 94, pp123–132.
13. Jayaraj, R.S.C., and Andrews, H.V., (2005), Andaman and Nicobar Islands Union
Territory Biodiversity Strategy and Action Plan. Under the National Biodiversity
Strategy and Action Plan India. ANET, Port Blair.
14. Khan I.H., (1983), Wildlife. In. Hundred years of forestry in the Andaman’s, 1883-
1983. pp. 53- 60. Issue on the occasion of the centenary celebration of the Forest
Department, Andaman and Nicobar Islands, Port Blair.
Assessment of land use and land cover changes in south Andaman Island using remote sensing and GIS
Yuvaraj E et al.,
International Journal of Geomatics and Geosciences
Volume 5 Issue 1, 2014 180
15. Kuldeep Tiwari., and Kamlesh Khanduri., (2011), Land Use / Land cover change
detection in Doon valley (Dehradun Tehsil), Uttarakhand, using GIS and Remote
Sensing Technique. Inter. Journal, of. Geomatics and gosciences 2(1), pp 34-41.
16. Lambin., and Geist., (2006), Land use and Land Cover Change: Local processes and
global impacts (Global Change-IGBP Series). Springer-Verlog, Berlin Heidelberg,
Germany, p. 25.
17. Maharaj Vijay Reddy R., Gareth Shaw and Allan Williams.. (2006), Impact of the
Tsunami on the Tourism Industry and Ecosystem of the Andaman and Nicobar
Islands, India. UNESCO-MAB, Paris. France.
18. NHM, (2013), Report of the Joint Inspection Team which visited Andaman &
Nicobar Islands during 3-4 April, 2013 to review: National Horticulture Mission
Programmes. Ministry of Agriculture, Department of Agriculture & Cooperation,
New Delhi.
19. Pellika P., Clark B., Hurskainen P., Keskinen A., Lanne M., Masalin K., Nyman-
Ghezelbash P., and Sirvio T., (2004), Land use change monitoring applying
geographic information systems in the Taita Hills, SE-Kenya. Proceedings of the 5th
African Association of Remote Sensing of Environment Conference, 17- 22 Oct.,
2004, Nairobi, Kenya.
20. Prabaharan S., Srinivasa Raju K., Lakshumanan C., and Ramalingam M., (2010).
Remote Sensing and GIS Applications on Change Detection Study in Coastal Zone
Using Multi Temporal Satellite Data, International Journal of Geomatics and
Geosciences 1(2), pp 159 -166.
21. Prabhbir Singh., and Kamlesh Khanduri., (2011), Land use and Land cover change
detection through Remote Sensing & GIS Technology: Case study of Pathankot and
Dhar Kalan Tehsils. Inter. Journal, of. Geomatics and Geosciences 1(4), pp 839-846.
22. Rodgers W.A., and Panwar H.S., (1988), Biogeographical classification of India.WII,
Dehra Dun.
23. SAC, (1991), ‘Manual for mapping of coastal wetlands / landforms and shoreline
changes using satellite data’, Space Application Centre (ISRO), Ahmedabad, India,
and No: IRS-UP/SAC/MCE/TN/32/91, pp 28-38.
24. SAC, (2003), Island Ecosystem for Andaman and Nicobar. Technical Report 15,
Space Applications Centre, Ahmedabad.
25. SAC. (2011), Coastal Zones of India. Space Applications Centre, ISRO, Ahmedabad.
26. Saldhana, C. J. (1989), Andaman, Nicobar and Lakshadweep: An Environmental
Impact Assessment. New Delhi:Oxford University Press.
27. Samereh Falahatkar., Ali Reza Soffianian., Sayed Jamaleddin Khajeddin., Hamid
Reza Ziaee., and Mozhgan Ahmadi Nadoushan., (2011), Integration of Remote
Assessment of land use and land cover changes in south Andaman Island using remote sensing and GIS
Yuvaraj E et al.,
International Journal of Geomatics and Geosciences
Volume 5 Issue 1, 2014 181
Sensing data and GIS for prediction of land cover map, Inter. Journal, of. Geomatics
and gosciences 1(4), pp 847-864.
28. Santhiya G., Lakshumanan C., and Muthukumar S., (2010), Mapping of
Landuse/Landcover Changes of Chennai Coast and Issues related to Coastal
Environment Using Remote Sensing and GIS International Journal of
Geomatics and Geosciences 1 (3), pp 563–576.
29. Saravanan., Dharanirajan K., Yuvaraj E., and Karpoorasundarapandian N., (2013),
Quantifying the dynamic changes of landuse and landcover in Neil Island, Andaman
and Nicobar, India. International Journal of Geomatics and Geosciences 4(2), pp 427
– 433.
30. Sarkar J., (1989), Endangered tribes and their development in Andarnan and Nicobar
Islands, Journal of Indian Anthropological Society, 24, pp 1-45.
31. Sharma V., and Srinivasan MS., (2007), Geology of Andaman–Nicobar: The Neogene.
Capital Publishing Company, New Delhi.
32. Sirus H.S., (1999), A rapid assessment of threats to the coastal environment and their
root causes in the Andaman and Nicobar Islands, A component of IND/95/G41,
(UNDP), unpublished report, UNOP, New Delhi, India.
33. Star J.L., Estes J.E., and McGwire K.C., (1997), Integration of geographic
information systems and remote sensing. New York, NY: Cambridge University Press.
34. Tourism Statistics. (2009), Department of Information, Publicity and Tourism,
(DIP&T). Unpublished Annual Plan Reports, Andaman and Nicobar Administration,
Port Blair, India.
35. Yuvaraj E., Dharanirajan K., Gurugnanam B., Kasinatha Pandian and Gopal Chandra
Falia., (2012), Shoreline Change and its impacts on the Burmanala coast of South
Andaman: A Geospatial Approach. Indian Landslides 5 (2).