Assessment of Load Transfer and Load Distributionin Bridges Utilizing FRP Panels
Danielle D. Kleinhans, M.ASCE1; John J. Myers, M.ASCE2; and Antonio Nanni, M.ASCE3
Abstract: A primary means of demonstrating the feasibility and effectiveness of fiber-reinforced polymer �FRP� composite bridgematerials is via in situ bridge load testing. For this study, the prescribed or assumed design factors for each of the study bridges werecompared to those exhibited by the performance of the bridge. Specifically, the wheel load distribution factors and impact factors asdefined by AASHTO were considered in order to assess the load transfer and distribution in structures utilizing FRP panels. The in situtesting configurations for the study bridges are outlined, including the truck and instrumentation placement to obtain the desired infor-mation. Furthermore, comparisons were drawn between the design values for deflection and those experienced by the structures duringtesting. It was found that although the deflections exhibited by the bridges were well within the design limits, further research is neededto be able to prescribe bridge design factors for FRP panels.
DOI: 10.1061/�ASCE�1090-0268�2007�11:5�545�
CE Database subject headings: Bridge design; Bridges, composite; In situ tests; Impact loads; Load distribution; Load transfer;Fiber reinforced polymers; Panels.
Introduction
The feasibility and effectiveness of using fiber-reinforced poly-mer �FRP� composite bridge materials need to be demonstrated insitu. Industry estimates indicate that nearly 150 vehicular bridgeshave been constructed using FRP composites as the primarystructural material in the United States �Market 2005�. In 2001,the Ohio state legislature partially funded an initiative to replace100 bridge decks in the state of Ohio using FRP composite tech-nology; this is evidence that the technology has been developingrapidly in recent years. Nonetheless, both laboratory and in situvalidation of the technology of FRP composite materials forbridge construction are still needed to verify, among other things,their constructibility, in situ behavior, and long-term in situdurability.
It is worth noting that although in situ bridge load testing isrecommended by AASHTO �2000� as an “effective means ofevaluating the structural performance of a bridge,” no guidelinescurrently exist for bridge load test protocols. In each case the loadtest objectives, load configuration, instrumentation type andplacement, and analysis techniques are to be determined by the
2Associate Professor of Civil, Architectural and EnvironmentalEngineering, Univ. of Missouri-Rolla, Center for InfrastructureEngineering Studies, 325 Butler-Carlton CE Hall, Rolla, MO 65409.E-mail: [email protected]
3Dept. Chair and Professor of Civil Engineering, Univ. of Miami,1251 Memorial Drive, McArthur Engineering Building, Rm. 325, CoralGables, FL 33146. E-mail: [email protected]
Note. Discussion open until March 1, 2008. Separate discussions mustbe submitted for individual papers. To extend the closing date by onemonth, a written request must be filed with the ASCE Managing Editor.The manuscript for this paper was submitted for review and possiblepublication on August 17, 2004; approved on October 6, 2005. This paperis part of the Journal of Composites for Construction, Vol. 11, No. 5,
organization conducting the test. Furthermore, procedures regard-ing the adaptation of load test results into a load rating of a bridgeare undefined.
For this study, the prescribed or assumed design factors foreach of the bridges are compared to those exhibited by the per-formance of the bridge; these design factors include the wheelload distribution factor and the impact load factor. In the case ofthe girders, the AASHTO factors are prescribed, while for theFRP panels, assumptions regarding their behavior are utilized todetermine potentially appropriate factors based on existingAASHTO guidelines for other materials. The validity of theseassumptions is explored. Furthermore, comparisons are drawn be-tween the design values for deflection and those experienced bythe structures during testing; verification of the design methodol-ogy is conducted through this process.
If this FRP technology can be proven as a viable constructionmaterial, there is great potential for enhancing the transportationinfrastructure in the United States. FRP materials have an attrac-tive potential in both the rehabilitation of existing structures andin new construction. For new construction, FRP bars for rein-forcement of concrete or FRP bridge panels could be utilized,while for rehabilitation of existing structures, FRP bridge deckpanels hold the most promise, as a smaller area of applicationwould be for FRP-RC deck panels to be supported by steel gird-ers. Some key elements that FRP materials could address are �1�combating the corrosion of steel reinforcement in severe environ-ments; �2� addressing the issue of slow construction processes forbridge replacement with traditional materials; and �3� decreasingdead load when FRP panels are utilized as replacement bridgedeck panels, potentially addressing load posting and seismicconcerns.
This research program utilizes FRP sandwich bridge panelsand FRP sandwich bridge deck panels supported by steel girdersand has included the observation and study of the design, manu-facturing, and installation of four bridges in a residential area, twoof which will be discussed herein. The St. Francis Street Bridge
consists only of FRP panels, while the St. Johns Street Bridge
consists of FRP bridge deck panels supported by steel girders.Both types of construction consist of bridge panels that are pre-manufactured, transported to the site, erected, and assembled on-site. All design, manufacturing, and installation of the two bridgeswas performed by the FRP panel manufacturer. Further informa-tion about the other project bridges can be referenced in earlierpublications by Stone et al. �2001a,b, 2002a,b� and Kleinhanset al. �2003�.
This research paper focuses on assessing the appropriate fac-tors for design using FRP materials in bridge construction. Inparticular, the necessary material properties, design parameters�e.g., live load impact factors and wheel load distribution factors�,and design protocols �e.g., serviceability predictions� are thefocus of this research, with the ultimate goal being to assist theindustry in developing material and design standards for FRPmaterials. In this way, FRP materials may become a viable alter-native to traditional materials for the improvement of our nation’sdeteriorating infrastructure.
FRP Panel Design Approach
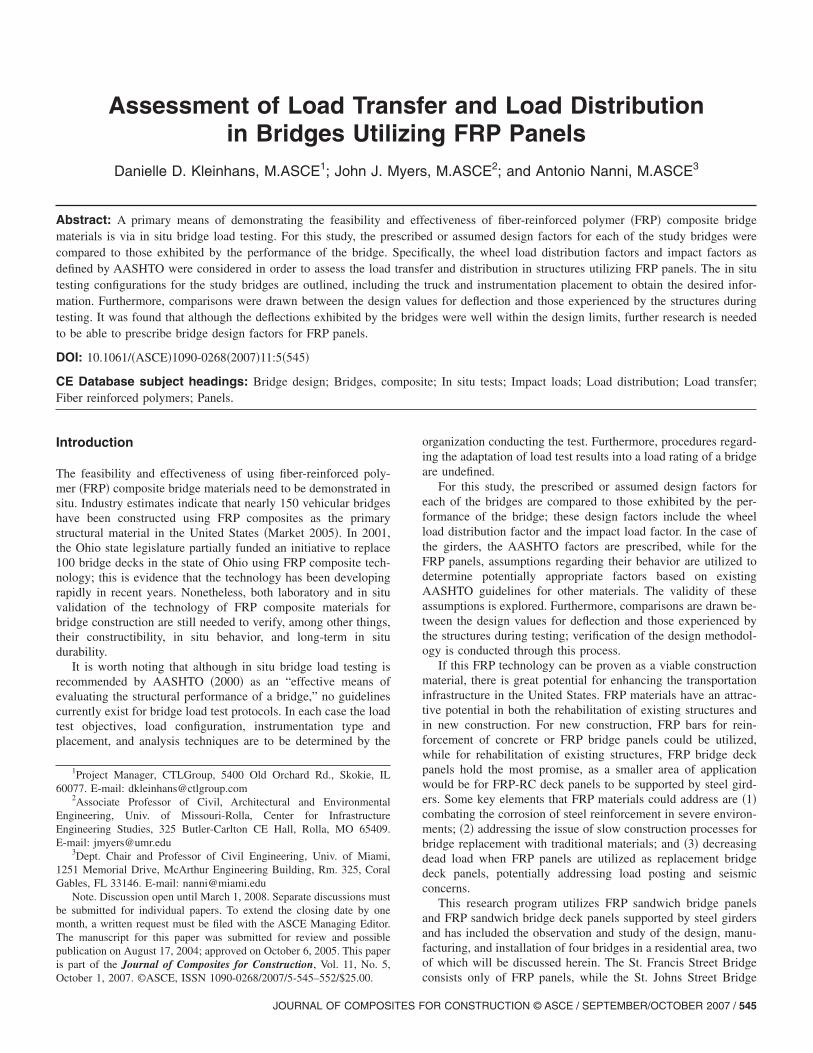
The design of the bridges was based on AASHTO deflection cri-teria and standard loads. The deflection criterion for the design ofthe bridges was set at a maximum value of span length divided by800, based on AASHTO Section 8.9.3.1 �AASHTO 1996�. It isimportant to note that due to the relatively low modulus of theFRP materials utilized, serviceability is often the controlling fac-tor for design. Standard HS20-44 truck loading configuration wasutilized based on AASHTO Section 3.7.4. �AASHTO 1996�. Fig.1 illustrates axle loading for the HS20-44 truck; the spacing be-tween the respective axles is 4.27 m �14 ft�. Although this couldbe considered excessive for a residential area, following currentdesign practices was considered to be the most appropriateprocedure.
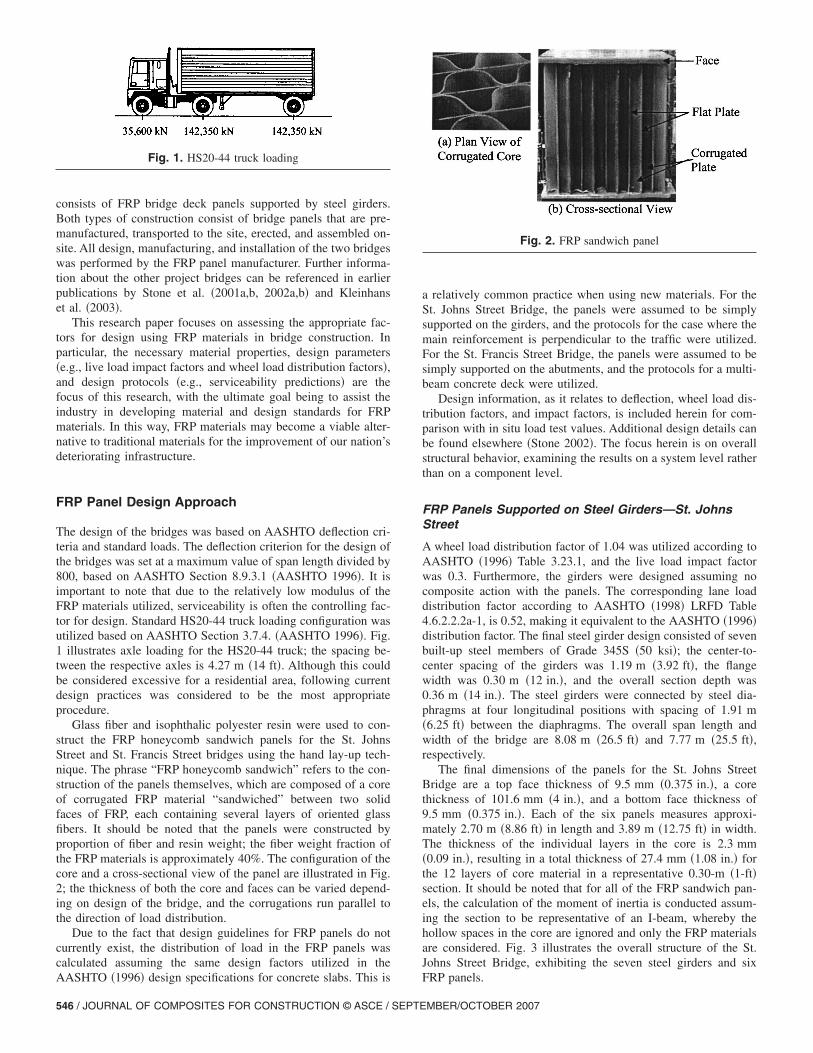
Glass fiber and isophthalic polyester resin were used to con-struct the FRP honeycomb sandwich panels for the St. JohnsStreet and St. Francis Street bridges using the hand lay-up tech-nique. The phrase “FRP honeycomb sandwich” refers to the con-struction of the panels themselves, which are composed of a coreof corrugated FRP material “sandwiched” between two solidfaces of FRP, each containing several layers of oriented glassfibers. It should be noted that the panels were constructed byproportion of fiber and resin weight; the fiber weight fraction ofthe FRP materials is approximately 40%. The configuration of thecore and a cross-sectional view of the panel are illustrated in Fig.2; the thickness of both the core and faces can be varied depend-ing on design of the bridge, and the corrugations run parallel tothe direction of load distribution.
Due to the fact that design guidelines for FRP panels do notcurrently exist, the distribution of load in the FRP panels wascalculated assuming the same design factors utilized in the
Fig. 1. HS20-44 truck loading
AASHTO �1996� design specifications for concrete slabs. This is
a relatively common practice when using new materials. For theSt. Johns Street Bridge, the panels were assumed to be simplysupported on the girders, and the protocols for the case where themain reinforcement is perpendicular to the traffic were utilized.For the St. Francis Street Bridge, the panels were assumed to besimply supported on the abutments, and the protocols for a multi-beam concrete deck were utilized.
Design information, as it relates to deflection, wheel load dis-tribution factors, and impact factors, is included herein for com-parison with in situ load test values. Additional design details canbe found elsewhere �Stone 2002�. The focus herein is on overallstructural behavior, examining the results on a system level ratherthan on a component level.
FRP Panels Supported on Steel Girders—St. JohnsStreet
A wheel load distribution factor of 1.04 was utilized according toAASHTO �1996� Table 3.23.1, and the live load impact factorwas 0.3. Furthermore, the girders were designed assuming nocomposite action with the panels. The corresponding lane loaddistribution factor according to AASHTO �1998� LRFD Table4.6.2.2.2a-1, is 0.52, making it equivalent to the AASHTO �1996�distribution factor. The final steel girder design consisted of sevenbuilt-up steel members of Grade 345S �50 ksi�; the center-to-center spacing of the girders was 1.19 m �3.92 ft�, the flangewidth was 0.30 m �12 in.�, and the overall section depth was0.36 m �14 in.�. The steel girders were connected by steel dia-phragms at four longitudinal positions with spacing of 1.91 m�6.25 ft� between the diaphragms. The overall span length andwidth of the bridge are 8.08 m �26.5 ft� and 7.77 m �25.5 ft�,respectively.
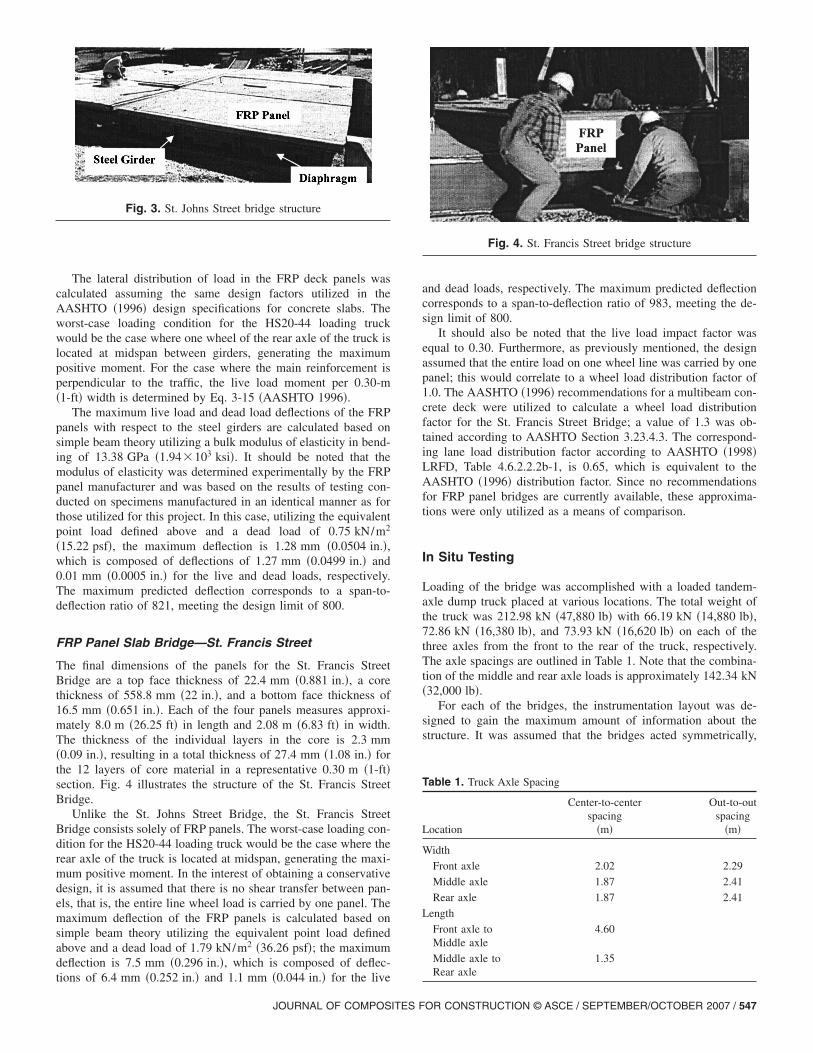
The final dimensions of the panels for the St. Johns StreetBridge are a top face thickness of 9.5 mm �0.375 in.�, a corethickness of 101.6 mm �4 in.�, and a bottom face thickness of9.5 mm �0.375 in.�. Each of the six panels measures approxi-mately 2.70 m �8.86 ft� in length and 3.89 m �12.75 ft� in width.The thickness of the individual layers in the core is 2.3 mm�0.09 in.�, resulting in a total thickness of 27.4 mm �1.08 in.� forthe 12 layers of core material in a representative 0.30-m �1-ft�section. It should be noted that for all of the FRP sandwich pan-els, the calculation of the moment of inertia is conducted assum-ing the section to be representative of an I-beam, whereby thehollow spaces in the core are ignored and only the FRP materialsare considered. Fig. 3 illustrates the overall structure of the St.Johns Street Bridge, exhibiting the seven steel girders and six
Fig. 2. FRP sandwich panel
FRP panels.
MBER/OCTOBER 2007
The lateral distribution of load in the FRP deck panels wascalculated assuming the same design factors utilized in theAASHTO �1996� design specifications for concrete slabs. Theworst-case loading condition for the HS20-44 loading truckwould be the case where one wheel of the rear axle of the truck islocated at midspan between girders, generating the maximumpositive moment. For the case where the main reinforcement isperpendicular to the traffic, the live load moment per 0.30-m�1-ft� width is determined by Eq. 3-15 �AASHTO 1996�.
The maximum live load and dead load deflections of the FRPpanels with respect to the steel girders are calculated based onsimple beam theory utilizing a bulk modulus of elasticity in bend-ing of 13.38 GPa �1.94�103 ksi�. It should be noted that themodulus of elasticity was determined experimentally by the FRPpanel manufacturer and was based on the results of testing con-ducted on specimens manufactured in an identical manner as forthose utilized for this project. In this case, utilizing the equivalentpoint load defined above and a dead load of 0.75 kN/m2
�15.22 psf�, the maximum deflection is 1.28 mm �0.0504 in.�,which is composed of deflections of 1.27 mm �0.0499 in.� and0.01 mm �0.0005 in.� for the live and dead loads, respectively.The maximum predicted deflection corresponds to a span-to-deflection ratio of 821, meeting the design limit of 800.
FRP Panel Slab Bridge—St. Francis Street
The final dimensions of the panels for the St. Francis StreetBridge are a top face thickness of 22.4 mm �0.881 in.�, a corethickness of 558.8 mm �22 in.�, and a bottom face thickness of16.5 mm �0.651 in.�. Each of the four panels measures approxi-mately 8.0 m �26.25 ft� in length and 2.08 m �6.83 ft� in width.The thickness of the individual layers in the core is 2.3 mm�0.09 in.�, resulting in a total thickness of 27.4 mm �1.08 in.� forthe 12 layers of core material in a representative 0.30 m �1-ft�section. Fig. 4 illustrates the structure of the St. Francis StreetBridge.
Unlike the St. Johns Street Bridge, the St. Francis StreetBridge consists solely of FRP panels. The worst-case loading con-dition for the HS20-44 loading truck would be the case where therear axle of the truck is located at midspan, generating the maxi-mum positive moment. In the interest of obtaining a conservativedesign, it is assumed that there is no shear transfer between pan-els, that is, the entire line wheel load is carried by one panel. Themaximum deflection of the FRP panels is calculated based onsimple beam theory utilizing the equivalent point load definedabove and a dead load of 1.79 kN/m2 �36.26 psf�; the maximumdeflection is 7.5 mm �0.296 in.�, which is composed of deflec-
Fig. 3. St. Johns Street bridge structure
tions of 6.4 mm �0.252 in.� and 1.1 mm �0.044 in.� for the live
JOURNAL OF COMPOSITES F
and dead loads, respectively. The maximum predicted deflectioncorresponds to a span-to-deflection ratio of 983, meeting the de-sign limit of 800.
It should also be noted that the live load impact factor wasequal to 0.30. Furthermore, as previously mentioned, the designassumed that the entire load on one wheel line was carried by onepanel; this would correlate to a wheel load distribution factor of1.0. The AASHTO �1996� recommendations for a multibeam con-crete deck were utilized to calculate a wheel load distributionfactor for the St. Francis Street Bridge; a value of 1.3 was ob-tained according to AASHTO Section 3.23.4.3. The correspond-ing lane load distribution factor according to AASHTO �1998�LRFD, Table 4.6.2.2.2b-1, is 0.65, which is equivalent to theAASHTO �1996� distribution factor. Since no recommendationsfor FRP panel bridges are currently available, these approxima-tions were only utilized as a means of comparison.
In Situ Testing
Loading of the bridge was accomplished with a loaded tandem-axle dump truck placed at various locations. The total weight ofthe truck was 212.98 kN �47,880 lb� with 66.19 kN �14,880 lb�,72.86 kN �16,380 lb�, and 73.93 kN �16,620 lb� on each of thethree axles from the front to the rear of the truck, respectively.The axle spacings are outlined in Table 1. Note that the combina-tion of the middle and rear axle loads is approximately 142.34 kN�32,000 lb�.
For each of the bridges, the instrumentation layout was de-signed to gain the maximum amount of information about thestructure. It was assumed that the bridges acted symmetrically,
and therefore instrumentation was concentrated on one-half of thebridge in each case. The details will be presented separately foreach of the bridges as the instrumentation for each is configuredin a different manner.
FRP Panels Supported on Steel Girders—St. JohnsStreet
The main research objectives for the testing of this bridge were todetermine the load distribution between the girders, examine theoverall performance of the bridge, and determine the load distri-bution from panel to panel. The interaction of panels and girderswill not be quantified herein. Further assessment of the load dis-tribution from panel to panel and the deflection of the panels willbe conducted during the presentation of the results of the in situtesting of the St. Francis Street Bridge.
Instrumentation utilized during the testing included direct cur-rent variable transformer �DCVT� transducers, which were in-stalled underneath the bridge to monitor deflection of the bridgepanels. Nine DCVT transducers were located at midspan andthree were located in the lateral center between girders 5 and 6 atvarious longitudinal positions of interest. Fig. 5 illustrates thelayout of the DCVT transducers; the deflection of both the FRPpanels and the steel girders was monitored.
Fig. 5. Layout of the DCVT transducers—St. Johns Street
Fig. 6. Truck pass and stop locations—St. Johns Street
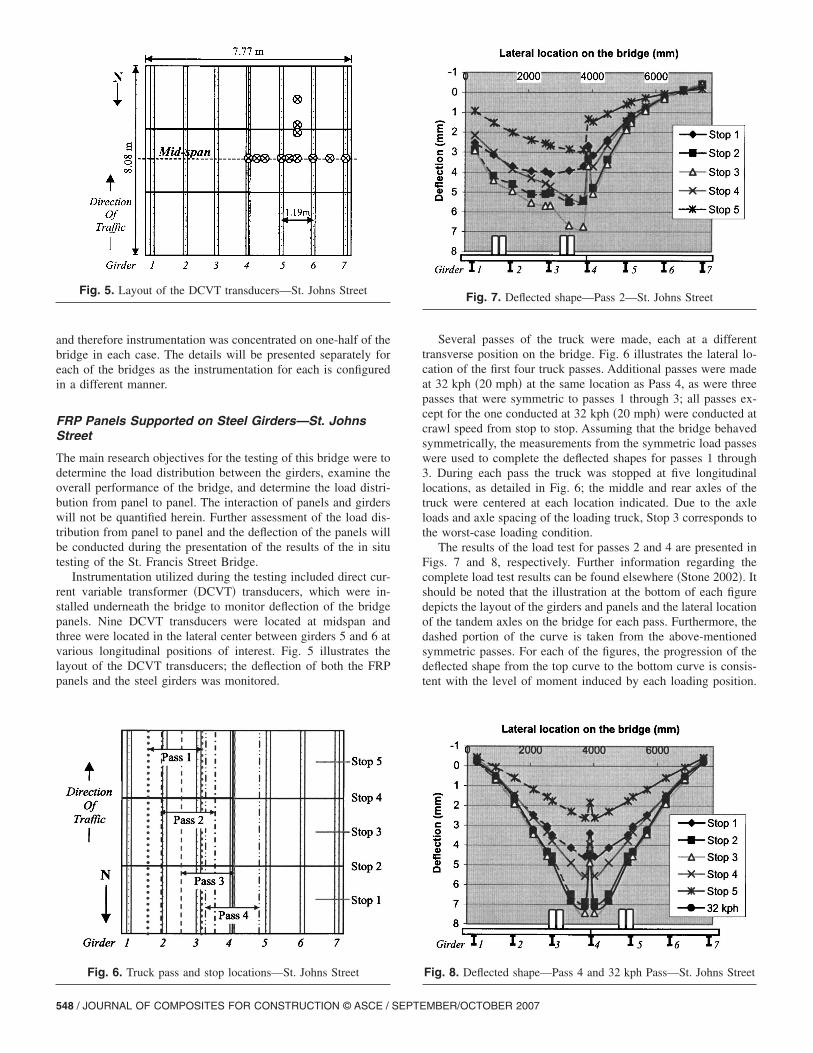
Several passes of the truck were made, each at a differenttransverse position on the bridge. Fig. 6 illustrates the lateral lo-cation of the first four truck passes. Additional passes were madeat 32 kph �20 mph� at the same location as Pass 4, as were threepasses that were symmetric to passes 1 through 3; all passes ex-cept for the one conducted at 32 kph �20 mph� were conducted atcrawl speed from stop to stop. Assuming that the bridge behavedsymmetrically, the measurements from the symmetric load passeswere used to complete the deflected shapes for passes 1 through3. During each pass the truck was stopped at five longitudinallocations, as detailed in Fig. 6; the middle and rear axles of thetruck were centered at each location indicated. Due to the axleloads and axle spacing of the loading truck, Stop 3 corresponds tothe worst-case loading condition.
The results of the load test for passes 2 and 4 are presented inFigs. 7 and 8, respectively. Further information regarding thecomplete load test results can be found elsewhere �Stone 2002�. Itshould be noted that the illustration at the bottom of each figuredepicts the layout of the girders and panels and the lateral locationof the tandem axles on the bridge for each pass. Furthermore, thedashed portion of the curve is taken from the above-mentionedsymmetric passes. For each of the figures, the progression of thedeflected shape from the top curve to the bottom curve is consis-tent with the level of moment induced by each loading position.
Fig. 7. Deflected shape—Pass 2—St. Johns Street
Fig. 8. Deflected shape—Pass 4 and 32 kph Pass—St. Johns Street
MBER/OCTOBER 2007
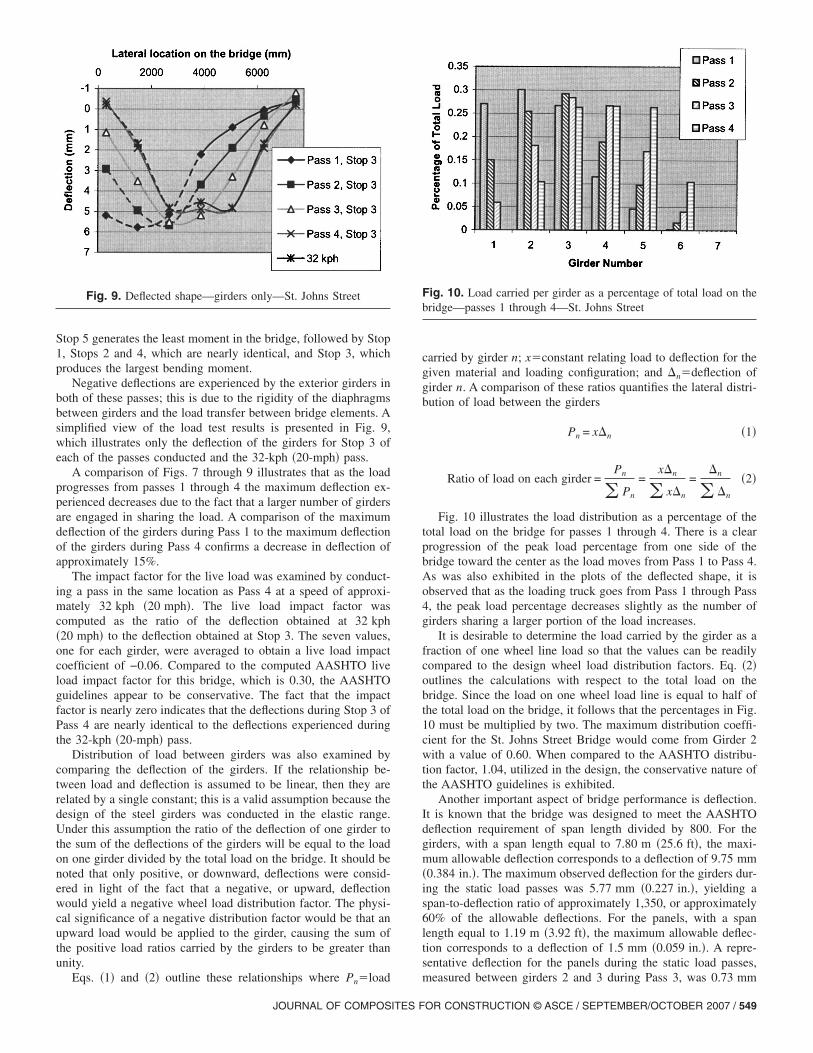
Stop 5 generates the least moment in the bridge, followed by Stop1, Stops 2 and 4, which are nearly identical, and Stop 3, whichproduces the largest bending moment.
Negative deflections are experienced by the exterior girders inboth of these passes; this is due to the rigidity of the diaphragmsbetween girders and the load transfer between bridge elements. Asimplified view of the load test results is presented in Fig. 9,which illustrates only the deflection of the girders for Stop 3 ofeach of the passes conducted and the 32-kph �20-mph� pass.
A comparison of Figs. 7 through 9 illustrates that as the loadprogresses from passes 1 through 4 the maximum deflection ex-perienced decreases due to the fact that a larger number of girdersare engaged in sharing the load. A comparison of the maximumdeflection of the girders during Pass 1 to the maximum deflectionof the girders during Pass 4 confirms a decrease in deflection ofapproximately 15%.
The impact factor for the live load was examined by conduct-ing a pass in the same location as Pass 4 at a speed of approxi-mately 32 kph �20 mph�. The live load impact factor wascomputed as the ratio of the deflection obtained at 32 kph�20 mph� to the deflection obtained at Stop 3. The seven values,one for each girder, were averaged to obtain a live load impactcoefficient of −0.06. Compared to the computed AASHTO liveload impact factor for this bridge, which is 0.30, the AASHTOguidelines appear to be conservative. The fact that the impactfactor is nearly zero indicates that the deflections during Stop 3 ofPass 4 are nearly identical to the deflections experienced duringthe 32-kph �20-mph� pass.
Distribution of load between girders was also examined bycomparing the deflection of the girders. If the relationship be-tween load and deflection is assumed to be linear, then they arerelated by a single constant; this is a valid assumption because thedesign of the steel girders was conducted in the elastic range.Under this assumption the ratio of the deflection of one girder tothe sum of the deflections of the girders will be equal to the loadon one girder divided by the total load on the bridge. It should benoted that only positive, or downward, deflections were consid-ered in light of the fact that a negative, or upward, deflectionwould yield a negative wheel load distribution factor. The physi-cal significance of a negative distribution factor would be that anupward load would be applied to the girder, causing the sum ofthe positive load ratios carried by the girders to be greater thanunity.
Fig. 9. Deflected shape—girders only—St. Johns Street
Eqs. �1� and �2� outline these relationships where Pn�load
JOURNAL OF COMPOSITES F
carried by girder n; x�constant relating load to deflection for thegiven material and loading configuration; and �n�deflection ofgirder n. A comparison of these ratios quantifies the lateral distri-bution of load between the girders
Pn = x�n �1�
Ratio of load on each girder =Pn
� Pn
=x�n
� x�n
=�n
� �n
�2�
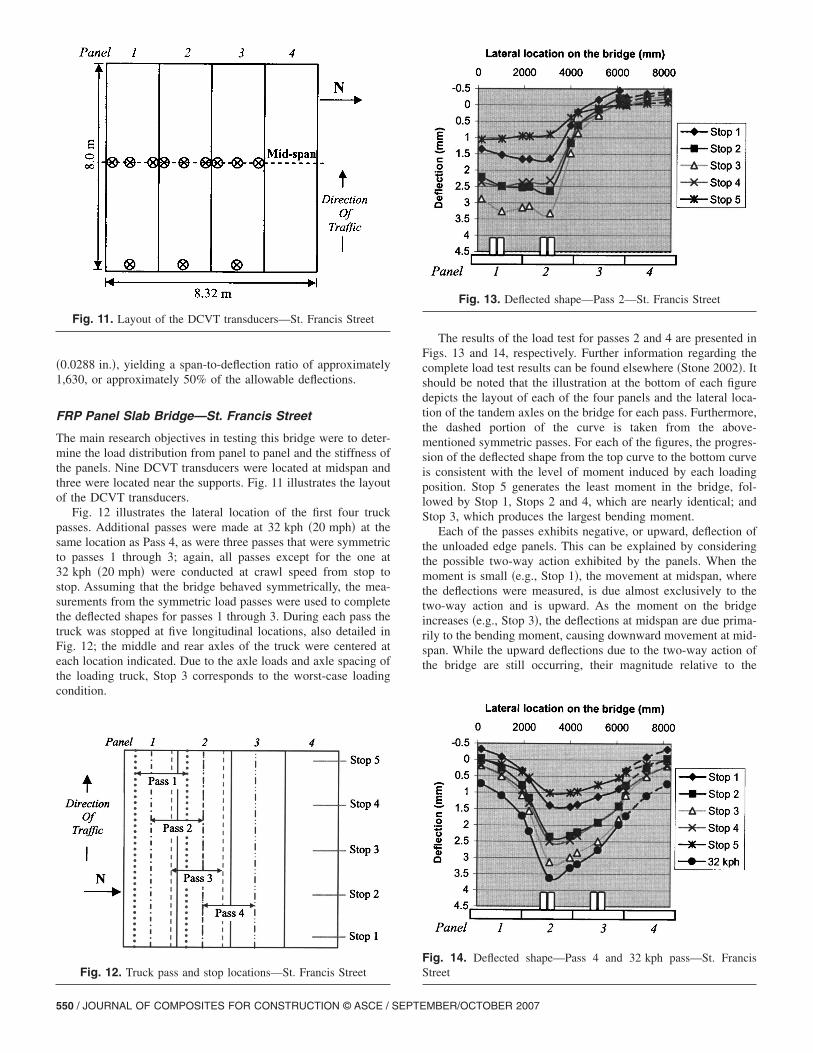
Fig. 10 illustrates the load distribution as a percentage of thetotal load on the bridge for passes 1 through 4. There is a clearprogression of the peak load percentage from one side of thebridge toward the center as the load moves from Pass 1 to Pass 4.As was also exhibited in the plots of the deflected shape, it isobserved that as the loading truck goes from Pass 1 through Pass4, the peak load percentage decreases slightly as the number ofgirders sharing a larger portion of the load increases.
It is desirable to determine the load carried by the girder as afraction of one wheel line load so that the values can be readilycompared to the design wheel load distribution factors. Eq. �2�outlines the calculations with respect to the total load on thebridge. Since the load on one wheel load line is equal to half ofthe total load on the bridge, it follows that the percentages in Fig.10 must be multiplied by two. The maximum distribution coeffi-cient for the St. Johns Street Bridge would come from Girder 2with a value of 0.60. When compared to the AASHTO distribu-tion factor, 1.04, utilized in the design, the conservative nature ofthe AASHTO guidelines is exhibited.
Another important aspect of bridge performance is deflection.It is known that the bridge was designed to meet the AASHTOdeflection requirement of span length divided by 800. For thegirders, with a span length equal to 7.80 m �25.6 ft�, the maxi-mum allowable deflection corresponds to a deflection of 9.75 mm�0.384 in.�. The maximum observed deflection for the girders dur-ing the static load passes was 5.77 mm �0.227 in.�, yielding aspan-to-deflection ratio of approximately 1,350, or approximately60% of the allowable deflections. For the panels, with a spanlength equal to 1.19 m �3.92 ft�, the maximum allowable deflec-tion corresponds to a deflection of 1.5 mm �0.059 in.�. A repre-sentative deflection for the panels during the static load passes,
Fig. 10. Load carried per girder as a percentage of total load on thebridge—passes 1 through 4—St. Johns Street
measured between girders 2 and 3 during Pass 3, was 0.73 mm
�0.0288 in.�, yielding a span-to-deflection ratio of approximately1,630, or approximately 50% of the allowable deflections.
FRP Panel Slab Bridge—St. Francis Street
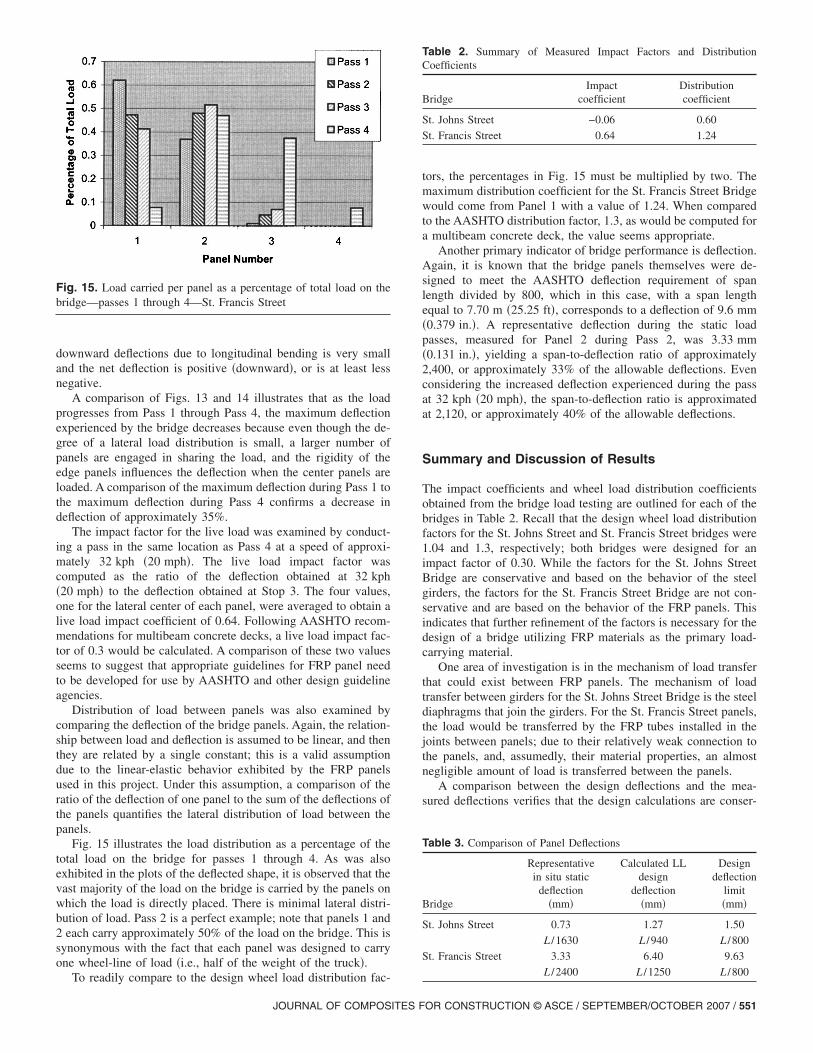
The main research objectives in testing this bridge were to deter-mine the load distribution from panel to panel and the stiffness ofthe panels. Nine DCVT transducers were located at midspan andthree were located near the supports. Fig. 11 illustrates the layoutof the DCVT transducers.
Fig. 12 illustrates the lateral location of the first four truckpasses. Additional passes were made at 32 kph �20 mph� at thesame location as Pass 4, as were three passes that were symmetricto passes 1 through 3; again, all passes except for the one at32 kph �20 mph� were conducted at crawl speed from stop tostop. Assuming that the bridge behaved symmetrically, the mea-surements from the symmetric load passes were used to completethe deflected shapes for passes 1 through 3. During each pass thetruck was stopped at five longitudinal locations, also detailed inFig. 12; the middle and rear axles of the truck were centered ateach location indicated. Due to the axle loads and axle spacing ofthe loading truck, Stop 3 corresponds to the worst-case loadingcondition.
Fig. 11. Layout of the DCVT transducers—St. Francis Street
Fig. 12. Truck pass and stop locations—St. Francis Street
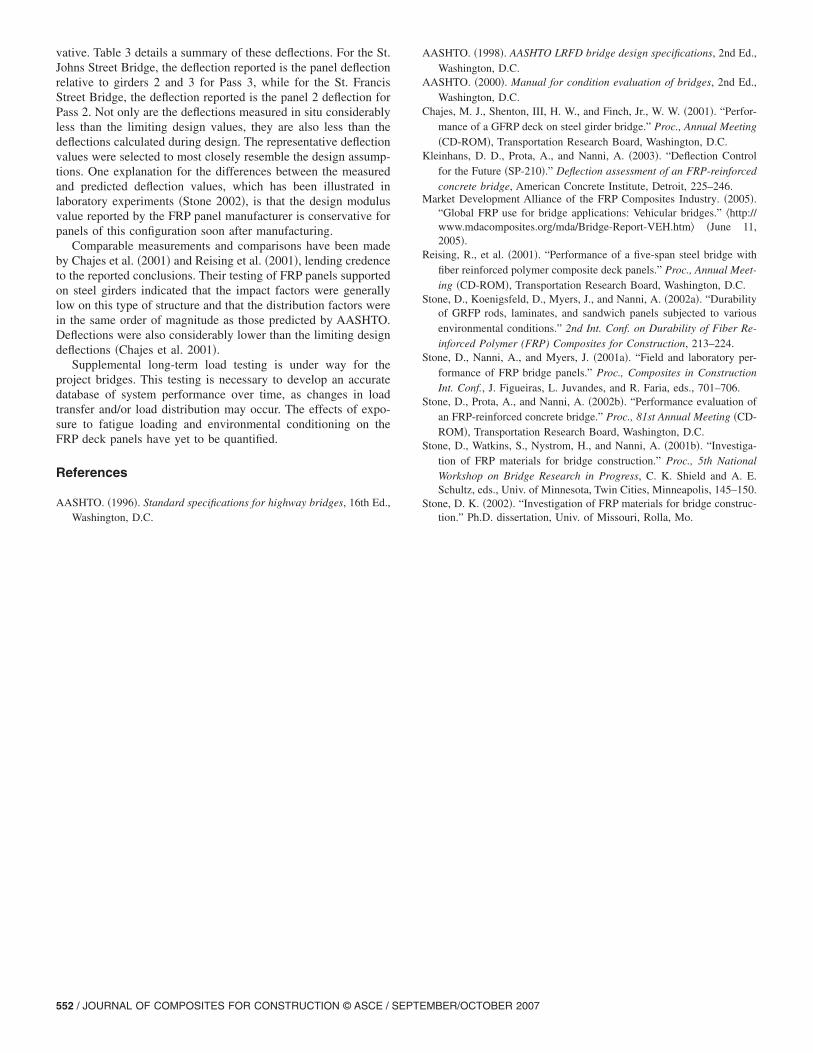
The results of the load test for passes 2 and 4 are presented inFigs. 13 and 14, respectively. Further information regarding thecomplete load test results can be found elsewhere �Stone 2002�. Itshould be noted that the illustration at the bottom of each figuredepicts the layout of each of the four panels and the lateral loca-tion of the tandem axles on the bridge for each pass. Furthermore,the dashed portion of the curve is taken from the above-mentioned symmetric passes. For each of the figures, the progres-sion of the deflected shape from the top curve to the bottom curveis consistent with the level of moment induced by each loadingposition. Stop 5 generates the least moment in the bridge, fol-lowed by Stop 1, Stops 2 and 4, which are nearly identical; andStop 3, which produces the largest bending moment.
Each of the passes exhibits negative, or upward, deflection ofthe unloaded edge panels. This can be explained by consideringthe possible two-way action exhibited by the panels. When themoment is small �e.g., Stop 1�, the movement at midspan, wherethe deflections were measured, is due almost exclusively to thetwo-way action and is upward. As the moment on the bridgeincreases �e.g., Stop 3�, the deflections at midspan are due prima-rily to the bending moment, causing downward movement at mid-span. While the upward deflections due to the two-way action ofthe bridge are still occurring, their magnitude relative to the
Fig. 13. Deflected shape—Pass 2—St. Francis Street
Fig. 14. Deflected shape—Pass 4 and 32 kph pass—St. FrancisStreet
MBER/OCTOBER 2007
downward deflections due to longitudinal bending is very smalland the net deflection is positive �downward�, or is at least lessnegative.
A comparison of Figs. 13 and 14 illustrates that as the loadprogresses from Pass 1 through Pass 4, the maximum deflectionexperienced by the bridge decreases because even though the de-gree of a lateral load distribution is small, a larger number ofpanels are engaged in sharing the load, and the rigidity of theedge panels influences the deflection when the center panels areloaded. A comparison of the maximum deflection during Pass 1 tothe maximum deflection during Pass 4 confirms a decrease indeflection of approximately 35%.
The impact factor for the live load was examined by conduct-ing a pass in the same location as Pass 4 at a speed of approxi-mately 32 kph �20 mph�. The live load impact factor wascomputed as the ratio of the deflection obtained at 32 kph�20 mph� to the deflection obtained at Stop 3. The four values,one for the lateral center of each panel, were averaged to obtain alive load impact coefficient of 0.64. Following AASHTO recom-mendations for multibeam concrete decks, a live load impact fac-tor of 0.3 would be calculated. A comparison of these two valuesseems to suggest that appropriate guidelines for FRP panel needto be developed for use by AASHTO and other design guidelineagencies.
Distribution of load between panels was also examined bycomparing the deflection of the bridge panels. Again, the relation-ship between load and deflection is assumed to be linear, and thenthey are related by a single constant; this is a valid assumptiondue to the linear-elastic behavior exhibited by the FRP panelsused in this project. Under this assumption, a comparison of theratio of the deflection of one panel to the sum of the deflections ofthe panels quantifies the lateral distribution of load between thepanels.
Fig. 15 illustrates the load distribution as a percentage of thetotal load on the bridge for passes 1 through 4. As was alsoexhibited in the plots of the deflected shape, it is observed that thevast majority of the load on the bridge is carried by the panels onwhich the load is directly placed. There is minimal lateral distri-bution of load. Pass 2 is a perfect example; note that panels 1 and2 each carry approximately 50% of the load on the bridge. This issynonymous with the fact that each panel was designed to carryone wheel-line of load �i.e., half of the weight of the truck�.
Fig. 15. Load carried per panel as a percentage of total load on thebridge—passes 1 through 4—St. Francis Street
To readily compare to the design wheel load distribution fac-
JOURNAL OF COMPOSITES F
tors, the percentages in Fig. 15 must be multiplied by two. Themaximum distribution coefficient for the St. Francis Street Bridgewould come from Panel 1 with a value of 1.24. When comparedto the AASHTO distribution factor, 1.3, as would be computed fora multibeam concrete deck, the value seems appropriate.
Another primary indicator of bridge performance is deflection.Again, it is known that the bridge panels themselves were de-signed to meet the AASHTO deflection requirement of spanlength divided by 800, which in this case, with a span lengthequal to 7.70 m �25.25 ft�, corresponds to a deflection of 9.6 mm�0.379 in.�. A representative deflection during the static loadpasses, measured for Panel 2 during Pass 2, was 3.33 mm�0.131 in.�, yielding a span-to-deflection ratio of approximately2,400, or approximately 33% of the allowable deflections. Evenconsidering the increased deflection experienced during the passat 32 kph �20 mph�, the span-to-deflection ratio is approximatedat 2,120, or approximately 40% of the allowable deflections.
Summary and Discussion of Results
The impact coefficients and wheel load distribution coefficientsobtained from the bridge load testing are outlined for each of thebridges in Table 2. Recall that the design wheel load distributionfactors for the St. Johns Street and St. Francis Street bridges were1.04 and 1.3, respectively; both bridges were designed for animpact factor of 0.30. While the factors for the St. Johns StreetBridge are conservative and based on the behavior of the steelgirders, the factors for the St. Francis Street Bridge are not con-servative and are based on the behavior of the FRP panels. Thisindicates that further refinement of the factors is necessary for thedesign of a bridge utilizing FRP materials as the primary load-carrying material.
One area of investigation is in the mechanism of load transferthat could exist between FRP panels. The mechanism of loadtransfer between girders for the St. Johns Street Bridge is the steeldiaphragms that join the girders. For the St. Francis Street panels,the load would be transferred by the FRP tubes installed in thejoints between panels; due to their relatively weak connection tothe panels, and, assumedly, their material properties, an almostnegligible amount of load is transferred between the panels.
A comparison between the design deflections and the mea-sured deflections verifies that the design calculations are conser-
Table 2. Summary of Measured Impact Factors and DistributionCoefficients
vative. Table 3 details a summary of these deflections. For the St.Johns Street Bridge, the deflection reported is the panel deflectionrelative to girders 2 and 3 for Pass 3, while for the St. FrancisStreet Bridge, the deflection reported is the panel 2 deflection forPass 2. Not only are the deflections measured in situ considerablyless than the limiting design values, they are also less than thedeflections calculated during design. The representative deflectionvalues were selected to most closely resemble the design assump-tions. One explanation for the differences between the measuredand predicted deflection values, which has been illustrated inlaboratory experiments �Stone 2002�, is that the design modulusvalue reported by the FRP panel manufacturer is conservative forpanels of this configuration soon after manufacturing.
Comparable measurements and comparisons have been madeby Chajes et al. �2001� and Reising et al. �2001�, lending credenceto the reported conclusions. Their testing of FRP panels supportedon steel girders indicated that the impact factors were generallylow on this type of structure and that the distribution factors werein the same order of magnitude as those predicted by AASHTO.Deflections were also considerably lower than the limiting designdeflections �Chajes et al. 2001�.
Supplemental long-term load testing is under way for theproject bridges. This testing is necessary to develop an accuratedatabase of system performance over time, as changes in loadtransfer and/or load distribution may occur. The effects of expo-sure to fatigue loading and environmental conditioning on theFRP deck panels have yet to be quantified.
References
AASHTO. �1996�. Standard specifications for highway bridges, 16th Ed.,
AASHTO. �2000�. Manual for condition evaluation of bridges, 2nd Ed.,Washington, D.C.
Chajes, M. J., Shenton, III, H. W., and Finch, Jr., W. W. �2001�. “Perfor-mance of a GFRP deck on steel girder bridge.” Proc., Annual Meeting�CD-ROM�, Transportation Research Board, Washington, D.C.
Kleinhans, D. D., Prota, A., and Nanni, A. �2003�. “Deflection Controlfor the Future �SP-210�.” Deflection assessment of an FRP-reinforcedconcrete bridge, American Concrete Institute, Detroit, 225–246.
Market Development Alliance of the FRP Composites Industry. �2005�.“Global FRP use for bridge applications: Vehicular bridges.” �http://www.mdacomposites.org/mda/Bridge-Report-VEH.htm� �June 11,2005�.
Reising, R., et al. �2001�. “Performance of a five-span steel bridge withfiber reinforced polymer composite deck panels.” Proc., Annual Meet-ing �CD-ROM�, Transportation Research Board, Washington, D.C.
Stone, D., Koenigsfeld, D., Myers, J., and Nanni, A. �2002a�. “Durabilityof GRFP rods, laminates, and sandwich panels subjected to variousenvironmental conditions.” 2nd Int. Conf. on Durability of Fiber Re-inforced Polymer (FRP) Composites for Construction, 213–224.
Stone, D., Nanni, A., and Myers, J. �2001a�. “Field and laboratory per-formance of FRP bridge panels.” Proc., Composites in ConstructionInt. Conf., J. Figueiras, L. Juvandes, and R. Faria, eds., 701–706.
Stone, D., Prota, A., and Nanni, A. �2002b�. “Performance evaluation ofan FRP-reinforced concrete bridge.” Proc., 81st Annual Meeting �CD-ROM�, Transportation Research Board, Washington, D.C.
Stone, D., Watkins, S., Nystrom, H., and Nanni, A. �2001b�. “Investiga-tion of FRP materials for bridge construction.” Proc., 5th NationalWorkshop on Bridge Research in Progress, C. K. Shield and A. E.Schultz, eds., Univ. of Minnesota, Twin Cities, Minneapolis, 145–150.
Stone, D. K. �2002�. “Investigation of FRP materials for bridge construc-tion.” Ph.D. dissertation, Univ. of Missouri, Rolla, Mo.