Assessment of Materials Management Options for the Massachusetts Solid Waste Master Plan Review Final Report Appendices Submitted to: Massachusetts Department of Environmental Protection Contract EQEH193 Submitted by: Tellus Institute Boston, MA In Partnership with: Cascadia Consulting Group & Sound Resource Management December 2008
Transcript
Assessment of Materials Management Options for
the Massachusetts Solid Waste Master Plan Review
Final Report Appendices
Submitted to:
Massachusetts Department of Environmental Protection
Contract EQEH193
Submitted by:
Tellus Institute
Boston, MA
In Partnership with:
Cascadia Consulting Group
&
Sound Resource Management
December 2008
Disclaimer
This report was prepared by the Tellus Institute, a not-for-profit research and policy
organization under a contract with the Massachusetts Department of Environmental
Protection. The report (including its summary and analysis of information) is entirely the
work of the Tellus Institute and its subcontractors on this project. The opinions expressed
in this report are those of the Tellus Institute and do not necessarily reflect MassDEP
policies.
Materials Management Options for MA Solid Waste Master Plan Review Final Report
Assessment of Materials Management Options for the
Massachusetts Solid Waste Master Plan Review
Appendices
Appendix 1: Waste Reduction Experience in Other Jurisdictions: Detailed
Review
Appendix 2: Documentation for the Morris Environmental Benefits
Materials Management Options for MA Solid Waste Master Plan Review Final Report
17
sector RM projects in other states have been implemented at the county and school
district levels.
While not a state-incentivized program, General Motors’ successful implementation of
RM contracting in several of its North American plants provides a sense of the potential
impact of RM. GM saw dramatic waste reductions, increases in recycling, and cost
savings. Raytheon has also recently implemented RM contracting in its Northeast
operations and has been monitoring its waste reduction impacts.
Challenges
A key challenge is to help create a sustainable, long-term market for RM services so
waste management companies as well as firms with procurement expertise and industrial
and commercial operations experience develop RM capabilities and become RM service
providers. To accomplish this may require additional resources from DEP to educate and
motivate both potential customers and suppliers of RM services. The goal should be to
develop and implement a critical mass of RM programs so that customers and RM
service providers will perpetuate RM contracting activity without significant further
resources from the Department.
Assessment
Over 120 MA municipalities have implemented PAYT programs, though many of the
Commonwealth’s largest cities have not yet done so. As part of MA DEP’s 2006
Revision to Solid Waste Master Plan, the Department continued its longstanding support
for Pay-As-You-Throw programs through grants and technical support for municipal
PAYT programs. Based on the vast experience in MA communities and other
jurisdictions, there may be room to expand PAYT into larger cities and refine
implementation strategies to make it even more effective.
Resource Management contracting pilots in Massachusetts and elsewhere show
significant waste reduction potential, on the order of 15-30%. RM aligns the interests of
businesses and their Resource Management contractors and shifts the incentives towards
minimizing waste. RM contracting can be applied across many industrial and commercial
sectors
While in the near term RM contractors are likely to continue to come from the waste
management and recycling industry and focus primarily on diversion and recycling, the
potential exists for transitioning RM contracting into an effective waste prevention
strategy. Such a transition will require the RM industry to mature and attract new
contractors with expertise in a range of industrial and commercial operations, including
procurement, product design, and packaging. Over time, the strategic alliances formed
may enable RM contractors to influence upstream decisions related to product design and
material choice, use, and handling, not just waste management practices. This upstream
focus will be necessary for RM contracting to achieve more significant waste reductions
and contribute to the Commonwealth’s aggressive waste prevention objectives.
Materials Management Options for MA Solid Waste Master Plan Review Final Report
18
There are strong precedents for this kind of approach in the energy and the chemicals
arenas. As a voluntary approach, there should be little opposition from industry, though
the waste management industry may be reluctant to embrace a new business model.
Moreover, waste management practices and costs generally do not receive much attention
from business managers. State educational and training efforts would need to be offered
to businesses and potential RM service providers, emphasizing the potential for win-win
outcomes. Coupled with other initiatives, RM contracting holds considerable promise as
a means to help transform business thinking from a waste management mentality to a
waste prevention and materials management approach.
Materials Management Options for MA Solid Waste Master Plan Review Final Report
19
Regulatory Requirements
Overview
A variety of regulatory requirements have been successful in achieving waste prevention
targets. Among the most effective initiatives are: extended producer responsibility (EPR)
and material or waste bans.5 These programs often lead to or are closely linked with the
alternative business models, such as Design for Environment or product stewardship,
described above. It is important to note that while it may be more difficult to gain
political support for regulatory requirements than voluntary programs, they provide a
more potent tool to government agencies for reaching significant waste prevention
targets.
As defined by the Organization for Economic Co-operation and Development (OECD),
EPR is an environmental policy approach in which a producer’s responsibility, physical
and/or financial, for a product is extended to the post-consumer stage of a product’s life
cycle. There are two key features of EPR policy: (1) the shifting of responsibility
(physically and/or economically, fully or partially) upstream to the producer and away
from municipalities, and (2) to provide incentives to producers to take environmental
considerations into the design of the product. European countries have implemented EPR
programs for many years, and have had particular success with reducing packaging
materials through fee systems and other mechanisms.6
Material or waste bans can also be powerful motivators for preventing waste,
encouraging reuse, or reducing toxicity. Bans can be focused either on product inputs or
on product disposal. Both are aimed at changing the practices of businesses and
consumers. Some programs prohibit use of certain materials in product formulation or
manufacture, such as mercury. These are generally pursued to eliminate or reduce toxic
materials and are based on an understanding that viable alternative materials exist. Thus,
these are often referred to as toxics substitution initiatives. Other programs ban the
disposal of certain types of materials, either because of their toxicity, or their high
volume in the waste stream and availability of alternative management options.
5 Mandatory requirements and specifications for governments to purchase environmentally preferable products (EPP) may also be considered a regulatory approach. For purposes of this review, since EPP
programs are often voluntary guidelines and because their direct focused is government internal behavior,
they are discussed below under Government Leadership by Example.
6 OR DEQ has produced an excellent fact sheet on International Packaging Regulations, which is available
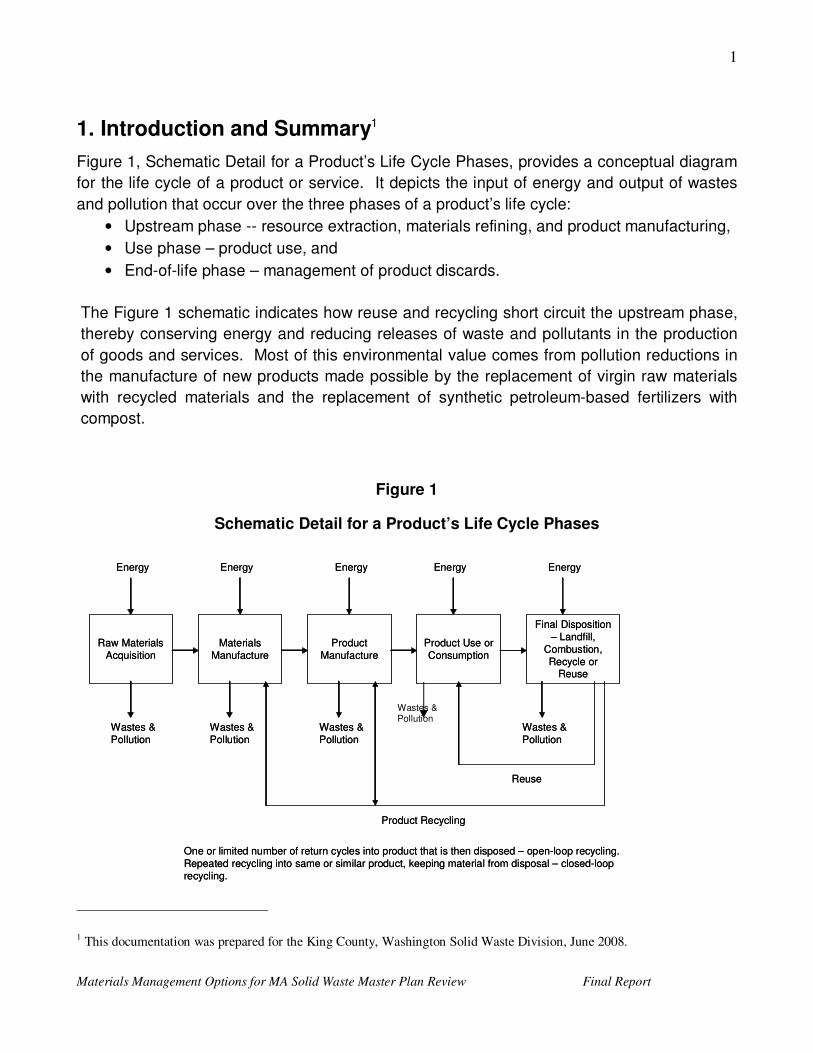
• End-of-life phase – management of product discards.
The Figure 1 schematic indicates how reuse and recycling short circuit the upstream phase,
thereby conserving energy and reducing releases of waste and pollutants in the production
of goods and services. Most of this environmental value comes from pollution reductions in
the manufacture of new products made possible by the replacement of virgin raw materials
with recycled materials and the replacement of synthetic petroleum-based fertilizers with
compost.
Figure 1
Schematic Detail for a Product’s Life Cycle Phases
1 This documentation was prepared for the King County, Washington Solid Waste Division, June 2008.
Raw Materials Acquisition
Materials Manufacture
Product Manufacture
Product Use or Consumption
Final Disposition – Landfill,
Combustion, Recycle or
Reuse
Energy Energy EnergyEnergyEnergy
Wastes & Pollution
Wastes & Pollution
Wastes & Pollution
Wastes & Pollution
Reuse
Product Recycling
One or limited number of return cycles into product that is then disposed – open-loop recycling. Repeated recycling into same or similar product, keeping material from disposal – closed-loop recycling.
Wastes & Pollution
Materials Management Options for MA Solid Waste Master Plan Review Final Report
2
Composting organic materials adds environmental value in two important ways:
1) Diversion to composting prevents methane generation when materials with high
anaerobic decomposition propensities, such as food scraps, are composted rather
than landfilled.
2) Soils fortified with compost need fewer or no applications of synthetic fertilizers and
pesticides, thus preventing pollution that would otherwise be released during
production and use of fertilizers and pesticides.
To estimate the environmental value for curbside recycling and composting, Sound Resource
Management developed a comprehensive recycling and composting environmental costs and
benefits valuation model.2 The model includes a “best-of” compendium of life cycle data from
a number of environmental life cycle inventory and assessment models, including:
• US EPA’s WARM model (available on the internet at
6 See Morris et al (2007). 7 Bare (2002) and Bare et al (2003). 8 See a description of the CalTOX model, references, and downloadable manual and software at
http://eetd.lbl.gov/IED/ERA/caltox/index.html .
Materials Management Options for MA Solid Waste Master Plan Review Final Report
5
Given the estimated pollutant reductions for each category of environmental impact, the
environmental costs and benefits model attaches a monetary value to those reductions.
Monetization provides a method for evaluating trade-offs between the seven types of
environmental impacts, and is a standard approach within the field of environmental
economics. The difficulty, as discussed in Morris et al (2007), is that monetization is
controversial, especially regarding the issue of placing a dollar value on human and non-
human lives. Nevertheless, monetization allows us to compare environmental benefits to
monetary costs and benefits for recycling and composting.
The final step in estimating an environmental value for recycling and composting is, then, to
determine a dollar value for the damage to public health and/or ecosystems caused by each
of the indicator pollutants. The following list shows these estimated damage valuations and
their sources.
• eCO2 -- $36 per ton based on greenhouse gas offset valuation used by Seattle City
Light.
• ePM2.5 -- $10,000 per ton based on Eastern Research Group (2006).
• eToluene -- $118 per ton based on Morris and Bagby (2008).
• eBenzene -- $3,030 per ton based on Eastern Research Group (2006).
• eN -- $4 per ton based on Morris and Bagby (2008).
• eSO2 -- $661 per ton based on average of 2005 ($690), 2006 ($860) and 2007 ($433)
spot prices in EPA's annual acid rain allowance auction.
• e2,4-D -- $3,280 per ton based on Morris and Bagby (2008).
The next section of this report discusses in more detail the monetization of pollution
reductions. The following section explains the estimates of pollution emissions impacts from
recycling and composting that we developed for the environmental costs and benefits model.
References cited in this report, as well as the models and websites listed above, provide the
interested reader with access to the considerable body of literature that we used in
developing the model.
2. The Economic Value of Pollution Reductions
The final step in estimating an economic value for the environmental benefits of recycling and composting is to determine a dollar value for the damages to public health and ecosystems from pollution. The introduction listed an economic cost for each of the seven types of environmental damages that we have included in our analysis of the environmental costs and benefits of recycling and composting. In this section we explain the estimates for five of the impacts.
Materials Management Options for MA Solid Waste Master Plan Review Final Report
6
2.a. The value of greenhouse gas (i.e., eCO2) emissions reductions
There is a very wide range of costs for greenhouse gas emissions and valuations for the benefits of reductions in those emissions. The low end for valuations is the trading price for voluntary greenhouse gas emission reductions. Operating much as the markets in sulfur dioxide emissions permits do, several markets are available for trading voluntary greenhouse gas emissions reduction pledges. One of these is the Chicago Climate Exchange (CCX). Trading values on the CCX for CO2 reductions have been between $1 and $4 per ton of carbon dioxide over the past several years. Values on European carbon markets have been ten times higher than trading prices on the CCX due to the mandatory CO2 emissions caps imposed on European greenhouse gas generators.
The upper end of the range for estimated costs of climate change is found in recent studies such as the review of the economics of climate change conducted by Nicholas Stern (2007). That study determined that a reasonable estimate for the cost of current greenhouse gas emissions was $85 per metric ton, based on the risk of catastrophic environmental impacts in the future if substantial reductions in greenhouse gas emissions are not implemented today.
We used $36 per ton for the cost of greenhouse gas emissions in this analysis because it is in the middle of the range between carbon dioxide market values for voluntary emissions reductions and estimated costs of severe climate change impacts if today’s emissions levels are not substantially reduced. This also is the estimate used by Seattle City Light to reflect the potential costs of CO2 emissions from electricity production.
2.b. The value of human toxics (i.e., eToulene) reductions
As with the valuation of the costs of greenhouse gas emissions, there is a wide range in the estimated costs for emissions of pollutants that are toxic to humans. Eastern Research Group (2006) found estimates ranging up to $2,700 per ton of eToluene for the human health costs of toxic air pollutant emissions. Our very conservative estimate of monetary costs for toxic air emissions is based on a peer-reviewed study on the health effects of atmospheric emissions of mercury. That study was sponsored by the Northeast States for Coordinated Air Use Management (NESCAUM) and conducted by scientists at the Harvard Center for Risk Analysis (Rice and Hammitt 2005). The study evaluated neurological and possible cardiovascular health impacts from exposure to methyl mercury through fish consumption, where atmospheric releases of mercury result in depositions of mercury in water bodies within and bordering the U.S. These depositions lead to increases in methyl mercury concentrations in fish.
The NESCAUM study evaluated three main health effects from methyl mercury exposure – neurological decrements associated with intrauterine exposure, myocardial effects associated with adult exposure, and elevated childhood blood pressure and cardiac rhythm effects associated with In Utero exposure. We used the economic cost estimated in the study for only the first effect. The decrease in cognitive ability as a result of intrauterine exposure to methyl mercury is well documented and understood, whereas research on the other two health effects is not yet as extensive or thoroughly peer-reviewed.
Materials Management Options for MA Solid Waste Master Plan Review Final Report
7
The NESCAUM study’s neurotoxicity health cost estimate for exposure to methyl mercury from consumption of fish that have bioaccumulated that toxin as a result of mercury air pollution is $10.5 million in year 2000 dollars per ton of mercury emitted to the atmosphere. Inflating that estimate to current dollars and converting the cost to toluene emissions, the indicator substance for human toxicity, yields $118 per ton of eToluene for the cost of pollutant emissions that are toxic to human health. This is the value we have attributed to reductions in human toxicity that are caused by diverting material resources from disposal to recycling and composting.
2.c. The value of ecosystem toxics (i.e., e2,4-D) reductions
We estimated the toxicity cost to plants and wildlife from application of a pound of 2,4-D herbicide at $1.64. This is an updated estimate from Joe Kovach, Integrated Pest Management Program at Ohio State University, based on his research originally reported in Kovach et al (1992) on putting an environmental price to pesticide use.9 The estimate includes costs for impacts on fish, birds, bees and beneficial arthropods, but not the estimated costs developed by Kovach for impacts on human health as a result of groundwater contamination. That human health cost is captured in the human toxicity potential impact category.
2.d. The value of reductions in eutrophying emissions (i.e., eN)
In soil or waterways, the addition of large quantities of mineral nutrients, such as nitrogen and phosphorous, results in generally undesirable shifts in the number of species in ecosystems and a reduction in ecological diversity. In water, it tends to increase algae growth, which can lead to lack of oxygen and therefore death of species such as fish. Our estimate of the impact cost of releases of nutrifying compounds is based on EPA’s cost-effectiveness analysis for the NPDES regulation on effluent discharges from concentrated animal feeding operations. That analysis estimated that costs up to $4.41 per Mg of nitrogen removed from wastewater effluents were economically advantageous (US EPA 2002, p. E-9).
2.e. The value of reductions in acidifying emissions (i.e., eSO2)
We base the value of acidification reductions at $661 per ton. This is the average of 2005 ($690), 2006 ($860) and 2007 ($433) spot prices in EPA's annual acid rain sulfur dioxide emissions permit allowances auction under the Clean Air Act.
3. Emissions Impacts of Recycling and Composting
This section details the impact of recycling and composting on pollutant emissions. First, we discuss the upstream environmental benefits of recycling. Next we outline the upstream and use phase benefits of composting. Then this section of our report covers the greenhouse gas
9 Pesticide wash-off may be higher in a hilly urban environment than in a flat agricultural field. To the extent that Kovach
relied on agricultural crop studies, his estimate of the cost to non-target plants and wildlife may underestimate the cost of
pesticide applications in an urban environment.
Materials Management Options for MA Solid Waste Master Plan Review Final Report
8
impacts of recycling, composting, and disposal collection, hauling and facility operations. Last, we cover the other pollution impacts besides climate change of recycling, composting and disposal facility operations.
Upstream recycling emissions estimates come from the Decision Support Tool (DST) developed for assessing the cost and environmental burdens of integrated solid waste management strategies by North Carolina State University (NCSU) in conjunction with Research Triangle Institute (RTI) and the US Environmental Protection Agency (US EPA).10 The Municipal Solid Waste Life-Cycle Database (Database), prepared by RTI with the support of US EPA during DST model development, provides estimates for environmental emissions from solid waste management practices.11 Upstream and use phase emissions estimates for composting are based on analyses and data discussed in Morris and Bagby (2008) and Morris et al (2007).
Waste material specific greenhouse gas emissions estimates for waste management activities are based on US EPA’s latest WARM (WAste Reduction Model) software and report.12 Estimates of other pollutant emissions are from the RTI/EPA/NCSU DST. The methodology for aggregating numerous emissions into impact categories is discussed in Morris (2005) and Morris and Bagby (2008).
3.a. The upstream pollution prevention benefits of recycling
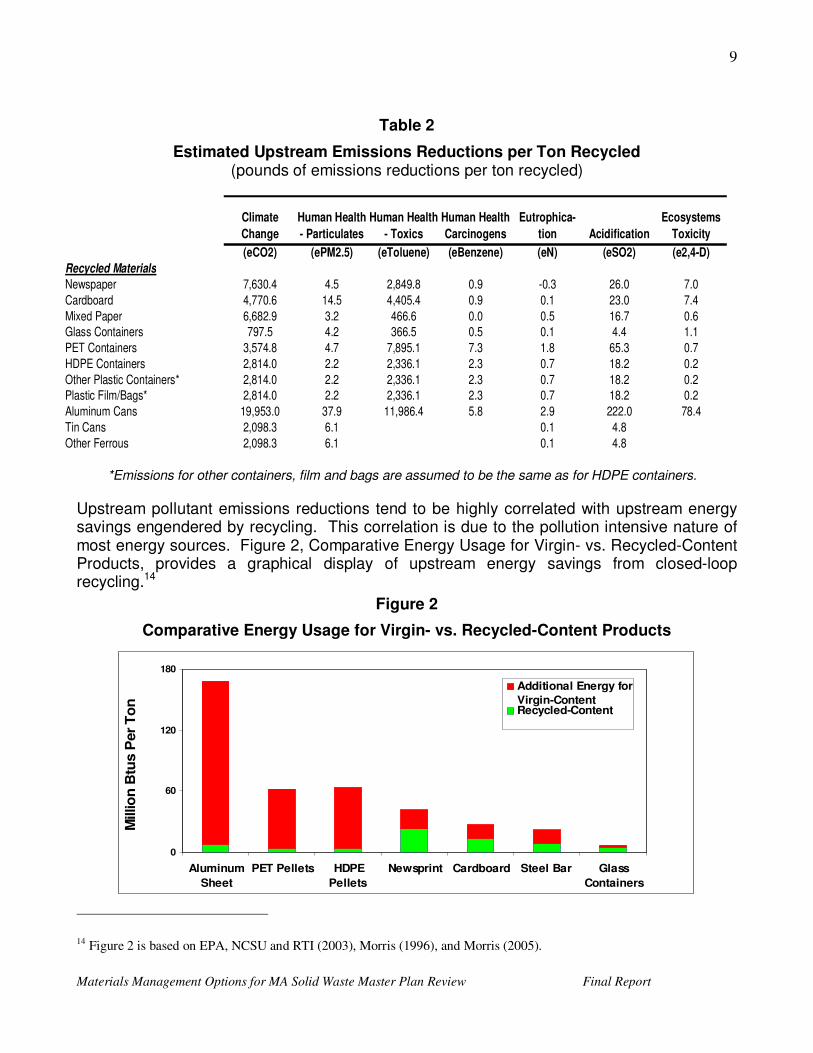
Table 2, Estimated Upstream Emissions Reductions per Ton Recycled, shows the upstream emissions reductions that result when recycled materials are used in place of virgin raw materials to produce new products. For example, upstream reductions in greenhouse gases, shown as carbon dioxide equivalents (eCO2), range from 798 pounds per ton of glass recycled into new glass containers to 19,953 pounds per ton of aluminum cans recycled into new aluminum can sheet. As a second example, upstream reductions in emissions toxic to human health, shown as Toluene equivalents (eToluene), range from 367 pounds per ton of glass to 11,986 pounds per ton of aluminum cans.13
10 (RTI 1999a), (RTI 1999b), (Barlaz 2003a), and (Barlaz 2003b).
11 Both the DST and its Database are intended to be available for sale to the public by RTI. Contact Keith Weitz at
[email protected] for further information on public release dates for the DST and the Database.
12 See EPA (2006) for a detailed description of the data and methods that support the WARM model.
13 Upstream emissions estimates for human toxics and carcinogens and ecosystems toxics that are available for virgin- and
recycled-content steel production are limited to just three specific pollutants. This compares with scores of toxics and
carcinogenic pollutant emissions reported for other recycled materials. For this reason, we do not estimate upstream
impacts for tin can and ferrous scrap recycling.
Materials Management Options for MA Solid Waste Master Plan Review Final Report
9
Table 2
Estimated Upstream Emissions Reductions per Ton Recycled (pounds of emissions reductions per ton recycled)
*Emissions for other containers, film and bags are assumed to be the same as for HDPE containers.
Upstream pollutant emissions reductions tend to be highly correlated with upstream energy savings engendered by recycling. This correlation is due to the pollution intensive nature of most energy sources. Figure 2, Comparative Energy Usage for Virgin- vs. Recycled-Content Products, provides a graphical display of upstream energy savings from closed-loop recycling.14
Figure 2
Comparative Energy Usage for Virgin- vs. Recycled-Content Products
0
60
120
180
Aluminum
Sheet
PET Pellets HDPE
Pellets
Newsprint Cardboard Steel Bar Glass
Containers
Millio
n B
tus P
er
To
n . Additional Energy for
Virgin-ContentRecycled-Content
14 Figure 2 is based on EPA, NCSU and RTI (2003), Morris (1996), and Morris (2005).
Materials Management Options for MA Solid Waste Master Plan Review Final Report
10
We can use the close correlation between upstream energy usage and upstream environmental impacts to provide perspective on the positive upstream environmental benefits of recycling compared with recycling’s collection, processing and hauling impacts.
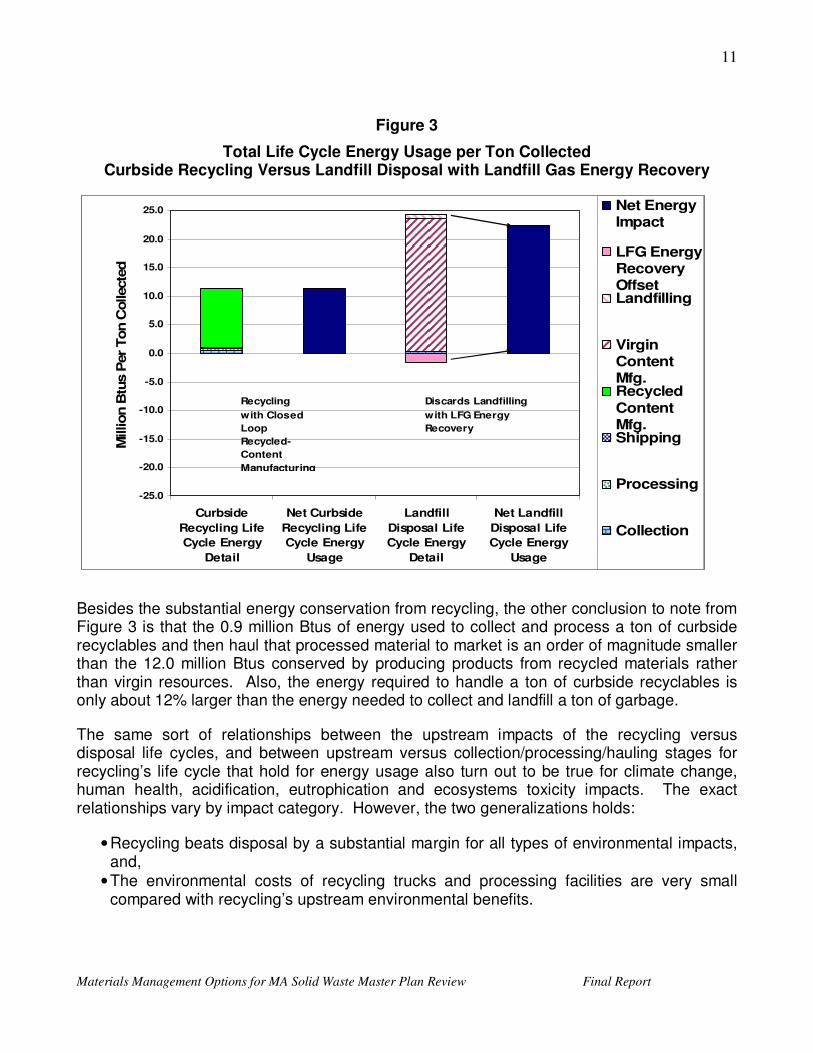
Figure 3, Total Life Cycle Energy Usage per Ton Collected – Curbside Recycling Versus Landfill Disposal with Landfill Gas Energy Recovery, shows energy usage over the life cycle of the typical ton of materials collected curbside for recycling. The bars in the graph compare energy usage for recycling a ton of curbside materials against energy usage when a ton of curbside recyclables is thrown in the garbage and sent to a landfill where landfill gases are collected and used to generate electricity.15
Figure 3 shows that manufacturing products using a ton of curbside recycled materials requires 10.4 million Btus. Collecting, processing and hauling those recycled materials to the manufacturers requires an additional 0.9 million Btus. Total energy used is 11.3 million Btus per ton recycled.
By contrast, manufacturing products using virgin raw materials uses 23.3 million Btus to extract raw materials, refine those resources into manufacturing feedstocks, and use the feedstocks to produce the same basket of goods that the recycled materials produce. Garbage collection, transfer and landfilling uses 0.8 million Btus, while the energy recovered from the landfill gases produced when the ton of recyclables decomposes anaerobically is 1.7 million Btus. This is a net usage of 22.4 million Btus per ton collected for the landfill disposal life cycle, nearly double the energy usage of the recycling life cycle.
15 See Morris (2005) for derivation of this figure.
Materials Management Options for MA Solid Waste Master Plan Review Final Report
11
Figure 3
Total Life Cycle Energy Usage per Ton Collected Curbside Recycling Versus Landfill Disposal with Landfill Gas Energy Recovery
Besides the substantial energy conservation from recycling, the other conclusion to note from Figure 3 is that the 0.9 million Btus of energy used to collect and process a ton of curbside recyclables and then haul that processed material to market is an order of magnitude smaller than the 12.0 million Btus conserved by producing products from recycled materials rather than virgin resources. Also, the energy required to handle a ton of curbside recyclables is only about 12% larger than the energy needed to collect and landfill a ton of garbage.
The same sort of relationships between the upstream impacts of the recycling versus disposal life cycles, and between upstream versus collection/processing/hauling stages for recycling’s life cycle that hold for energy usage also turn out to be true for climate change, human health, acidification, eutrophication and ecosystems toxicity impacts. The exact relationships vary by impact category. However, the two generalizations holds:
• Recycling beats disposal by a substantial margin for all types of environmental impacts, and,
• The environmental costs of recycling trucks and processing facilities are very small compared with recycling’s upstream environmental benefits.
-25.0
-20.0
-15.0
-10.0
-5.0
0.0
5.0
10.0
15.0
20.0
25.0
Curbside
Recycling Life
Cycle Energy
Detail
Net Curbside
Recycling Life
Cycle Energy
Usage
Landfill
Disposal Life
Cycle Energy
Detail
Net Landfill
Disposal Life
Cycle Energy
Usage
Million B
tus P
er
Ton C
ollecte
d .
Net EnergyImpact
LFG EnergyRecoveryOffsetLandfilling
VirginContentMfg.Recycled
ContentMfg.Shipping
Processing
Collection
Recycling
with Closed
Loop
Recycled-
Content
Manufacturing
Discards Landfilling
with LFG Energy
Recovery
Materials Management Options for MA Solid Waste Master Plan Review Final Report
12
For example, recycled-content manufacturing produces 0.8 tons of carbon dioxide equivalents, while virgin-content manufacturing releases 3.3 tons, over four times as much eCO2. Recycling collection, processing, and hauling operations release 0.2 tons eCO2 per ton. In comparison, garbage collection and disposal operations release just over 1.0 tons eCO2 per ton.
3.b. Upstream and use phase pollution prevention benefits for composting
According to Morris and Bagby (2008) and other studies referenced there, compost produced from yard debris, food scraps and compostable paper and cardboard can substantially reduce use of pesticides and synthetic fertilizers on lawns and gardens. There are as yet no systematic empirical data on the average amount of pesticide and fertilizer use reductions associated with home lawn and garden compost applications. However, one can make a reasonable argument that compost use on lawns and gardens may be associated with a 50% or more reduction in pesticides and synthetic fertilizer use. For example, the home owner who purchases compost for application on his lawn or garden presumably makes that purchase as a substitute for synthetic fertilizers and synthetic fertilizer-herbicide products.
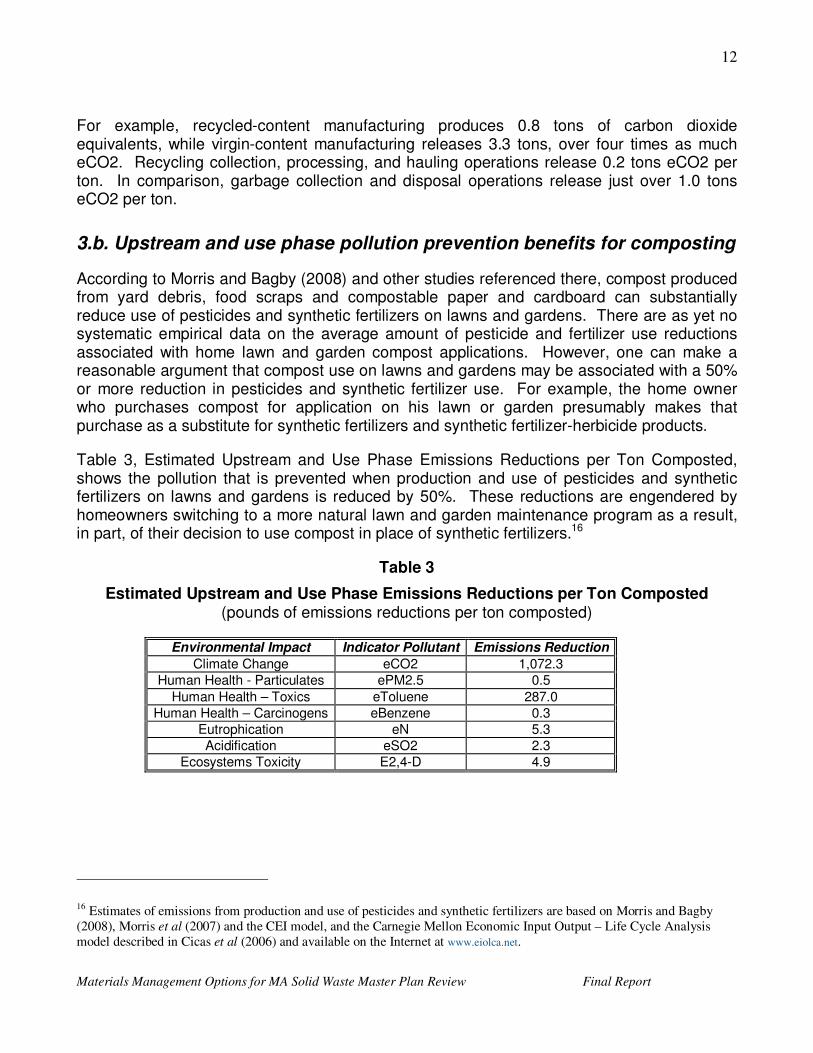
Table 3, Estimated Upstream and Use Phase Emissions Reductions per Ton Composted, shows the pollution that is prevented when production and use of pesticides and synthetic fertilizers on lawns and gardens is reduced by 50%. These reductions are engendered by homeowners switching to a more natural lawn and garden maintenance program as a result, in part, of their decision to use compost in place of synthetic fertilizers.16
Table 3
Estimated Upstream and Use Phase Emissions Reductions per Ton Composted (pounds of emissions reductions per ton composted)
Climate Change eCO2 1,072.3 Human Health - Particulates ePM2.5 0.5
Human Health – Toxics eToluene 287.0 Human Health – Carcinogens eBenzene 0.3
Eutrophication eN 5.3 Acidification eSO2 2.3
Ecosystems Toxicity E2,4-D 4.9
16 Estimates of emissions from production and use of pesticides and synthetic fertilizers are based on Morris and Bagby
(2008), Morris et al (2007) and the CEI model, and the Carnegie Mellon Economic Input Output – Life Cycle Analysis
model described in Cicas et al (2006) and available on the Internet at www.eiolca.net.
Materials Management Options for MA Solid Waste Master Plan Review Final Report
13
3.c. Greenhouse gas(GHG) emissions from discards management
Table 4, Estimated Greenhouse Gas Emissions from Discards Management, shows the carbon dioxide equivalent emissions from collection, transfer, and landfill disposal of recyclable and compostable materials, as well as from collection and recycling or composting of those materials. Collection trucks and transfer, disposal, recycling and composting facility operations result in differing amounts of GHG emissions, depending on the types and energy intensity of equipment used for these different components of a solid waste management system. But the handling of different types of waste material on a collection truck or by equipment at a given type of facility tends to yield the same amount of greenhouse gas (GHG) emissions irrespective of material type.17 This is why the estimates for GHG emissions from recycling systems are the same across all recycled material types shown in Table 4. Also, as shown in Table 4, compostable materials all have the same GHG emissions when composted, and their GHG emissions are different than the GHG emissions for materials that are recycled.
However, materials have different decomposition characteristics in the landfill, causing differing amounts of carbon sequestration, methane generation, and energy recovery potential. This accounts for the differences in GHG emissions shown in the Disposal eCO2 Emissions column of Table 4. For example, disposal of yard debris and compostable paper/cardboard in a landfill that collects 75% of generated landfill gases and uses those gases to generate electricity actually decreases GHG emissions.18 For those materials the carbon sequestered in the landfill plus the electrical energy grid offset from the collected methane outweigh the climate change impact of the methane that is not captured by the landfill’s gas collection system.
Food scraps, on the other hand, generate more GHGs in the form of methane than the portion of their carbon sequestered in a landfill plus the greenhouse gas emissions avoided from energy generated by the collected methane. This makes food scraps a net GHG generator, even in landfills that are highly efficient at recovering energy from landfill gases.
Energy generated from landfill gases provides a GHG credit as a result of the emissions avoided that would otherwise be generated in electrical power plants that feed the electricity grid in the Northwest. Natural gas is the source of incremental energy on the Northwest grid, and the GHG emissions from this fossil fuel are avoided when electricity is generated from collected landfill gases.19
17 See EPA/NCSU/RTI (2003), EPA (2006), and RW Beck (2007) for data used to calculate the estimates shown in Table 4. 18 There is some disagreement regarding the efficiency of the typical landfill gas collection system and of the theoretical
limit to landfill gas capture possibilities. For example, see Anderson (2007). This comparison of carbon sequestration
versus fugitive methane emissions is based on 75% methane capture efficiency, the default value in EPA’s WARM model
for calculating GHG emissions from waste management systems. 19 RW Beck (2007).
Materials Management Options for MA Solid Waste Master Plan Review Final Report
14
The emissions from composting facility operations include a credit for carbon sequestered in soils where the compost is used. The estimate of soil carbon sequestration is from EPA’s WARM model, as discussed in EPA (2006). The carbon sequestration credit is larger than the CO2 emissions from collection and compost facility operations. This accounts for the negative values for composting emissions in the Composting eCO2 Emissions column of Table 4.
Table 4
Estimated Greenhouse Gas Emissions from Discards Management (pounds of carbon dioxide emissions per ton collected)
Disposal eCO2
Emissions
Recycling eCO2
Emissions
Composting eCO2
Emissions
Recycled Materials
Newspaper -2,482.4 210.5
Cardboard -736.3 210.5
Mixed Paper -914.2 210.5
Glass Containers 88.2 210.5
PET Plastic Containers 88.2 210.5
HDPE Plastic Containers 88.2 210.5
Other Plastic Containers 88.2 210.5
Plastic Film & Bags 88.2 210.5
Aluminum Cans 88.2 210.5
Tin-plated Steel Cans 88.2 210.5
Ferrous Scrap 88.2 210.5
Composted Materials
Yard Debris -1,083.9 -440.8
Food Scraps 540.9 -440.8
Paper & Cardboard -914.2 -440.8
3.d. Emissions other than GHGs from discards management
Table 5, Estimated Emissions Other Than GHGs from Discards Management, shows emissions for the other six environmental impact categories from collection, transfer, and landfill disposal of recyclable and compostable materials, as well as from collection and recycling or composting of those materials. Collection, transfer, and recycling or composting facility operations result in the same amount of emissions irrespective of material type. At this point in time available research does not distinguish emissions by material type for collection, transfer, recycling and composting facility operations.20
However, there are emissions associated with use of internal combustion engines to generate electricity from collected landfill gas. Table 5 includes these emissions in the
20 See EPA/NCSU/RTI (2003) for data used to calculate the estimates shown in Table 5.
Materials Management Options for MA Solid Waste Master Plan Review Final Report
15
column Disposal Emissions – Degradables, where degradables include paper, cardboard, yard debris and food scraps. These are the materials that generate landfill gases. The other column for disposal emissions in Table 5 reflects garbage collection, transfer and landfill operations for glass, metals and plastics – i.e., materials that do not degrade in the landfill.
Table 5
Estimated Emissions Other Than GHGs from Discards Management (pounds of emissions per ton managed)
Environmental Impact Indicator Pollutant
Disposal Emissions - Degradables
Disposal Emissions –
Non-Degradables
Recycling Emissions
Composting Emissions
Human Health – Particulates
ePM2.5 0.9 0.04 0.4 0.06
Human Health – Toxics eToluene 455.7 3.3 19.6 48.9 Human Health –
3.e. Summary of pollution prevention estimates for recycling and composting
Table 6 summarizes emissions reductions per ton recycled or composted by material type and impact category. The table indicates that aluminum can recycling has the highest environmental benefits across all environmental impact categories, except for carcinogenic impacts on human health where PET plastics recycling provides the top environmental benefit.
Rankings below the top spot vary depending on impact category. For example, mixed paper recycling has the second best climate change benefits, due to the high GHG reductions associated with recycling the high grade papers that are included in mixed paper collected from households. Cardboard is in second place for particulate and ecosystem toxics emissions reductions. Plastic PET containers are in second place for human toxics, eutrophication and acidification emissions reductions.
Among the composted materials shown in Table 6, food scraps provide the greatest climate change emissions reductions benefits. Neither the upstream emissions reduction benefits of composting, nor the non-GHG emissions from discards management for the composted materials, vary by material type. Thus, the emissions reductions for environmental impacts other than climate change are the same for all three composted materials.
Materials Management Options for MA Solid Waste Master Plan Review Final Report
16
Table 6
Estimated Emissions Reductions per Ton Recycled or Composted (pounds of emissions reductions per ton recycled or composted)
Pounds of Emissions Reductions/(Increase) Per Ton Recycled/Composted
*Emissions for other containers, film and bags are assumed to be the same as for HDPE containers.
Materials Management Options for MA Solid Waste Master Plan Review Final Report
17
4. References
Anderson, Peter N. (2007), Comments to the California Air Resources Board on Landfills’ Responsibility for Anthropogenic Greenhouse Gases and the Appropriate Response to Thos Facts. Center for a Competitive Waste Industry, St. Paul, MN.
Bare, Jane C. (2002), Developing a Consistent Decision-Making Framework by Using the U.S. EPA's TRACI, U.S. Environmental Protection Agency, Cincinnati, OH.
Bare, Jane C., Gregory A. Norris, David W. Pennington and Thomas McKone (2003), TRACI: The Tool for the Reduction and Assessment of Chemical and Other Environmental Impacts. Journal of Industrial Ecology 6(3-4): 49-78.
Barlaz M et al (2003a): Comparing Recycling, Composting and Landfills. BioCycle 44, 9, 60-66.
Barlaz M et al (2003b): Evaluating Environmental Impacts of Solid Waste Management Alternatives. BioCycle 44, 10, 52-56.
Cicas, Gyorgyi, H.S. Matthews, and C. Hendrickson (2006), The 1997 Benchmark Version of the Economic Input-Output Life Cycle Assessment (EIO-LCA) Model, Green Design Institute, Carnegie Mellon University, Pittsburgh, PA.
Eastern Research Group (2006), Draft Report: Cost Benefit Analysis for Six "Pure" Methods for Managing Leftover Latex Paint - Data, Assumptions and Methods. Prepared for the Paint Product Stewardship Initiative.
EPA, North Carolina State University, and Research Triangle Institute (2003). Municipal Solid Waste Life-Cycle Database for the Decision Support Tool on Municipal Solid Waste Management. Research Triangle Park, NC.
EPA (2006), Solid Waste Management and Greenhouse Gases – A Life-Cycle Assessment of Emissions and Sinks, 3rd edition, Environmental Protection Agency, Washington, D.C.
Kovach J, Petzoldt C, Degni J, Tette J (1992): A Method to Measure the Environmental Impact of Pesticides. Integrated Pest Management Program Cornell University, New York State Agricultural Experimentation Station, Geneva, NY (Available through Online Publications of the New York State IPM Program at http://www.nysipm.cornell.edu/publications ).
Morawski, Clarissa, The New “Eco-Currency”: New model monetizes environmental benefits and reveals new cost savings in waste diversion, Solid Waste & Recycling, December/January 2008.
Morris, Jeffrey (1996), Recycling versus incineration: an energy conservation analysis. Journal of Hazardous Materials 47 277-293.
Materials Management Options for MA Solid Waste Master Plan Review Final Report
18
Morris, Jeffrey (2005), Comparative LCAs for Curbside Recycling Versus Either Landfilling or Incineration with Energy Recovery. International Journal of Life Cycle Assessment 10(4) 273-284.
Morris, Jeffrey, H. Scott Matthews, Frank Ackerman, Michelle Morris and Rock Hlavka (2007), The Washington State Consumer Environmental Index (CEI) – A Summary of the Development of a Tool to Understand and Support Consumer Choices That Have Preferable Environmental Outcomes. Prepared for the Washington State Department of Ecology, July 31, 2007.
Morris, Jeffrey, and Jennifer Bagby (2008). Measuring Environmental Value for Natural Lawn and Garden Care Practices. International Journal of Life Cycle Assessment, 13(3) 226-234.
Research Triangle Institute (1999a), A Decision Support Tool for Assessing the Cost and Environmental Performance of Integrated Municipal Solid Waste Management Strategies: Users Manual, Draft EPA/xxx-R-99-xxx.
Research Triangle Institute (1999b), Application of Life-Cycle Management to Evaluate Integrated Municipal Solid Waste Management Strategies, Draft EPA/xxx-R-99-xxx.
Rice, Glenn, and James K. Hammitt (2005): Economic Valuation of Human Health Benefits of Controlling Mercury Emissions from U.S. Coal-Fired Power Plants. Prepared for Northeast States Coordinated Air Use Management (NESCAUM) by the Harvard Center for Risk Analysis, Boston, MA
RW Beck (2007), Comparative Evaluation of Waste Export and Conversion Technologies Disposal Options – Internal Draft. Prepared for King County Department of Natural Resources and Parks Solid Waste Division, May 2007.
Stern, Nicholas (2007). The Economics of Climate Change: The Stern Review, Cambridge University Press, Cambridge, England and New York, NY.
US Environmental Protection Agency, Office of Research and Development (2002): Economic Analysis of the Final Revisions to the National Pollutant Discharge Elimination System Regulation and the Effluent Guidelines for Concentrated Animal Feeding Operations. EPA-812-R-03-002, December 2002, Washington, DC.
Weber, Christopher L., and H. Scott Matthews (2007). Embodied environmental emissions in U.S. international trade. Environmental Science and Technology, forthcoming.
Materials Management Options for MA Solid Waste Master Plan Review Final Report
APPENDIX 3
Detailed Modeling Results
Materials Management Options for MA Solid Waste Master Plan Review Final Report
1
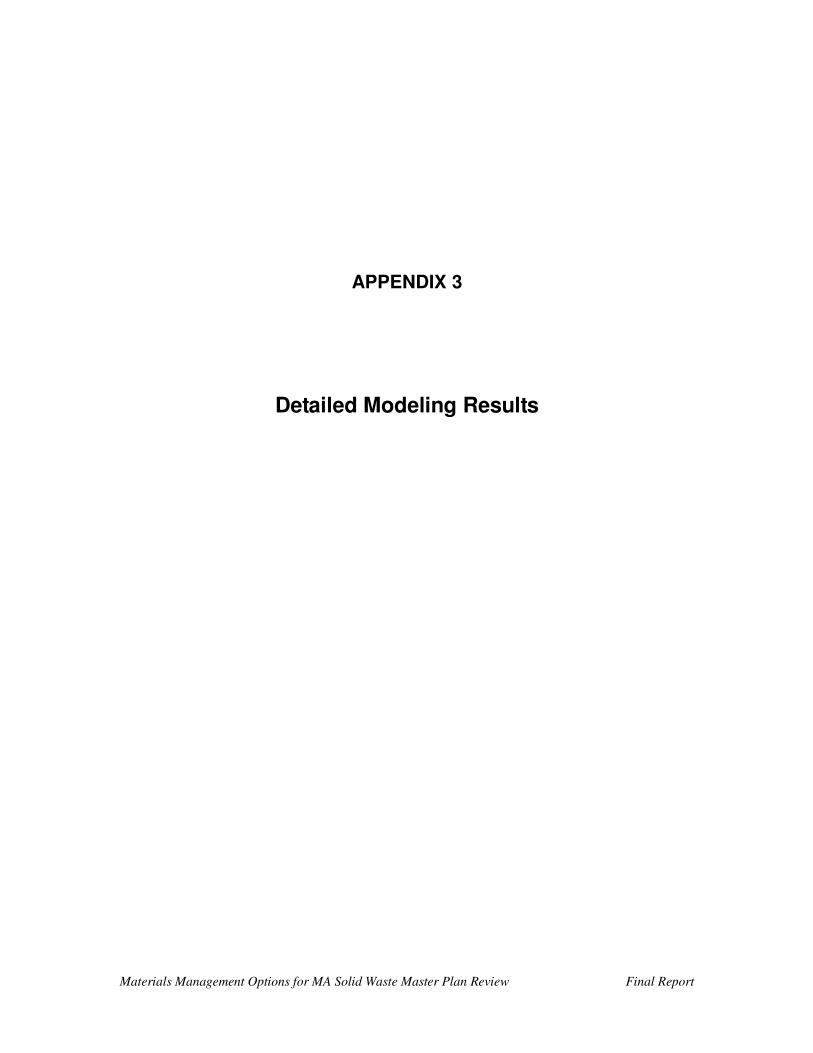
Figure A-1
Figure A-2
Materials Management Options for MA Solid Waste Master Plan Review Final Report
2
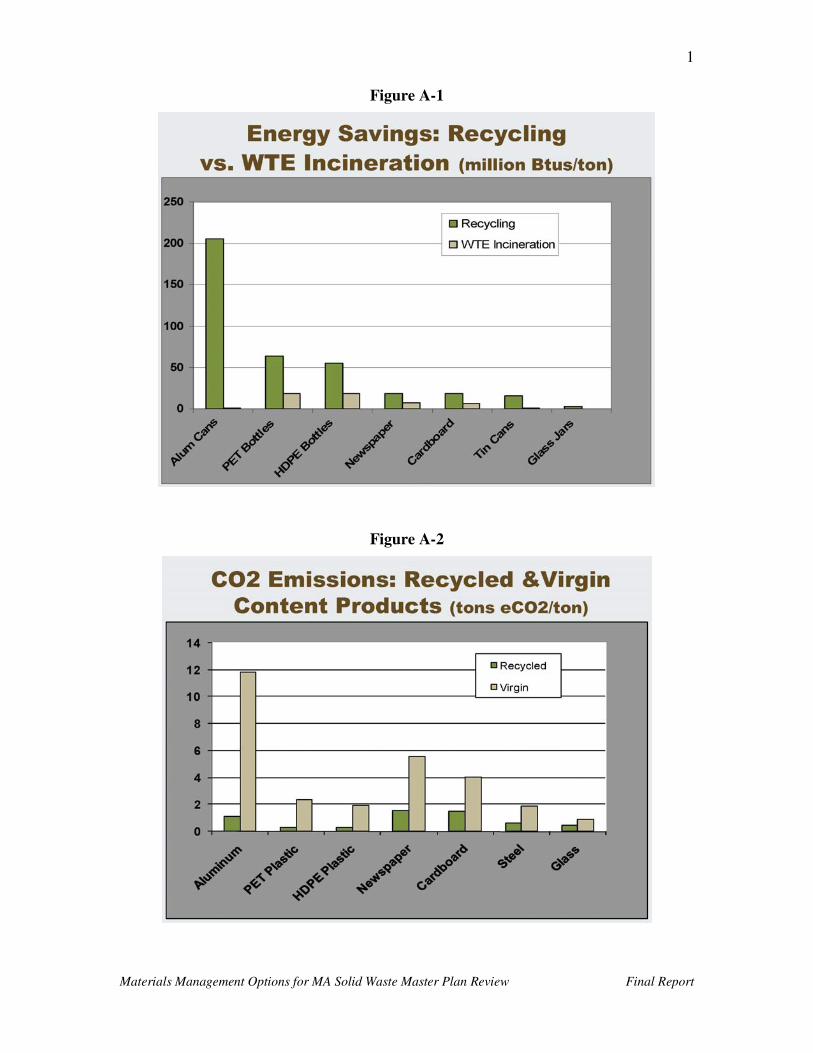
Figure A-3
Figure A-4
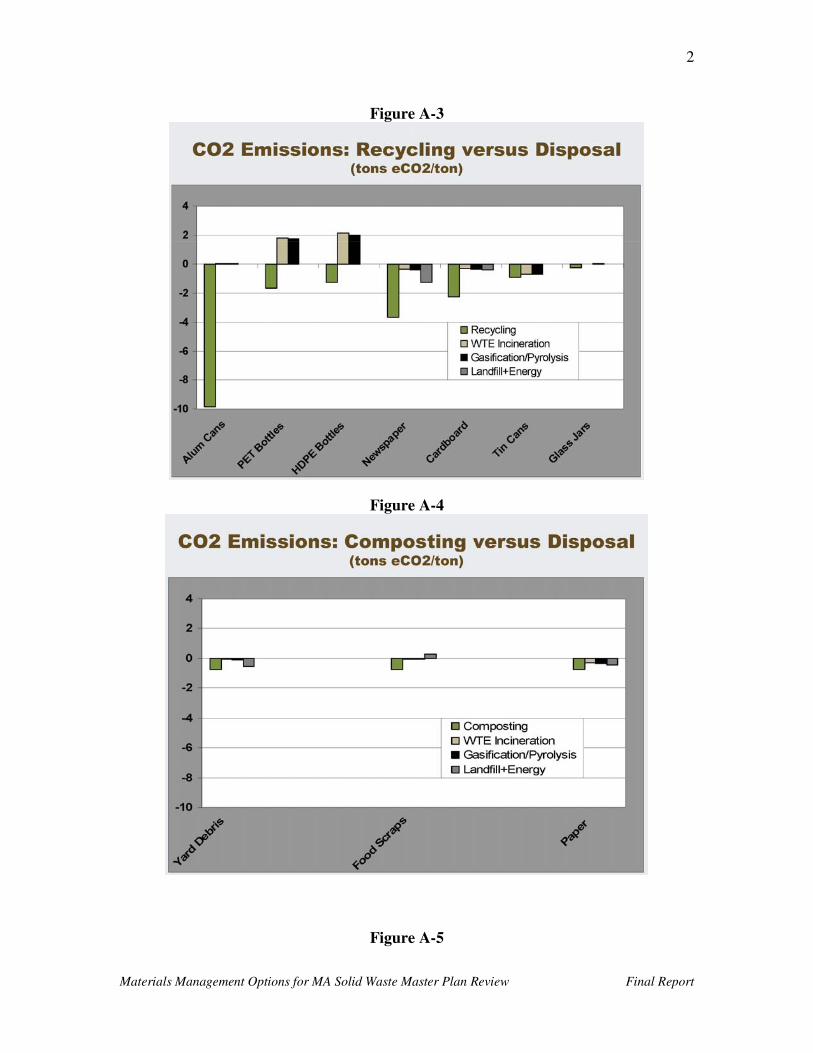
Figure A-5
Materials Management Options for MA Solid Waste Master Plan Review Final Report
3
Figure A-6
Figure A-7
Materials Management Options for MA Solid Waste Master Plan Review Final Report
4
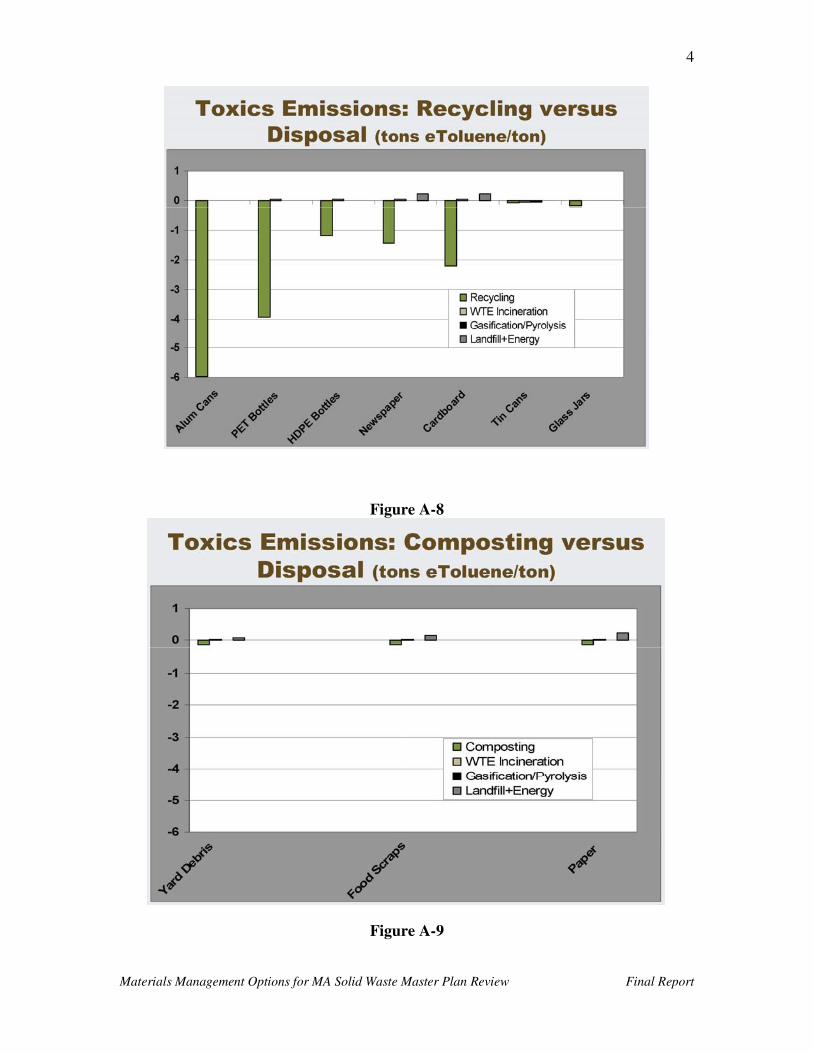
Figure A-8
Figure A-9
Materials Management Options for MA Solid Waste Master Plan Review Final Report
5
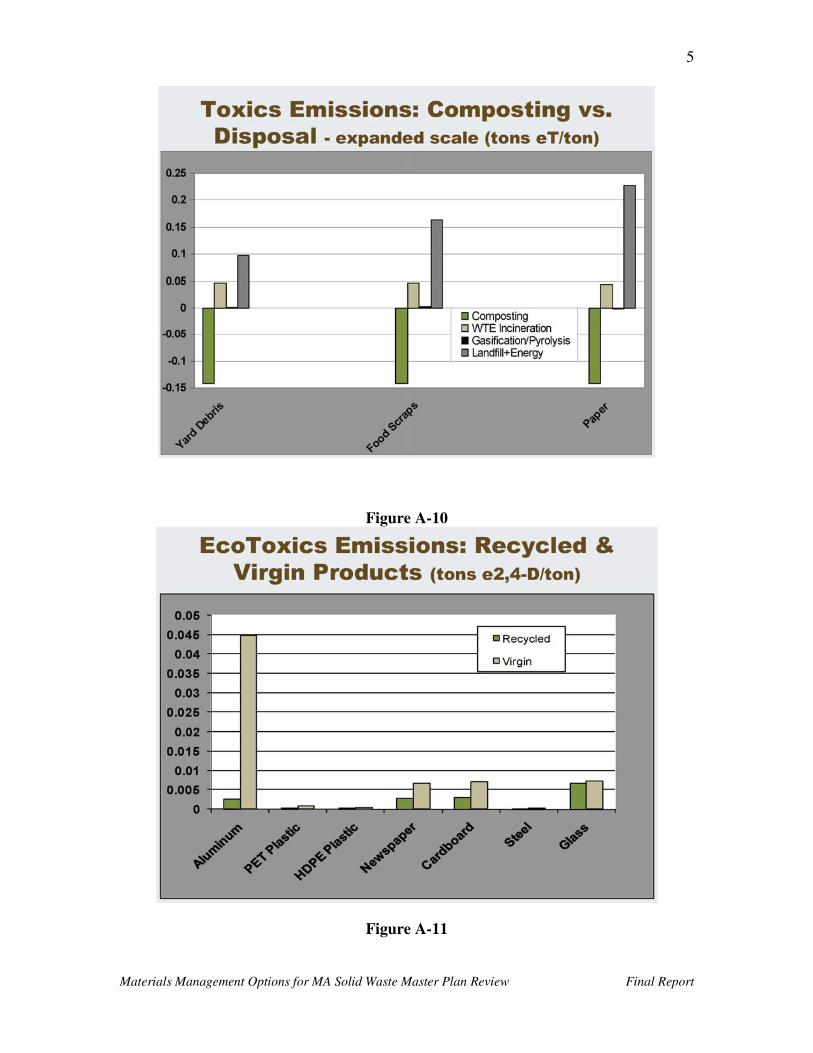
Figure A-10
Figure A-11
Materials Management Options for MA Solid Waste Master Plan Review Final Report
6
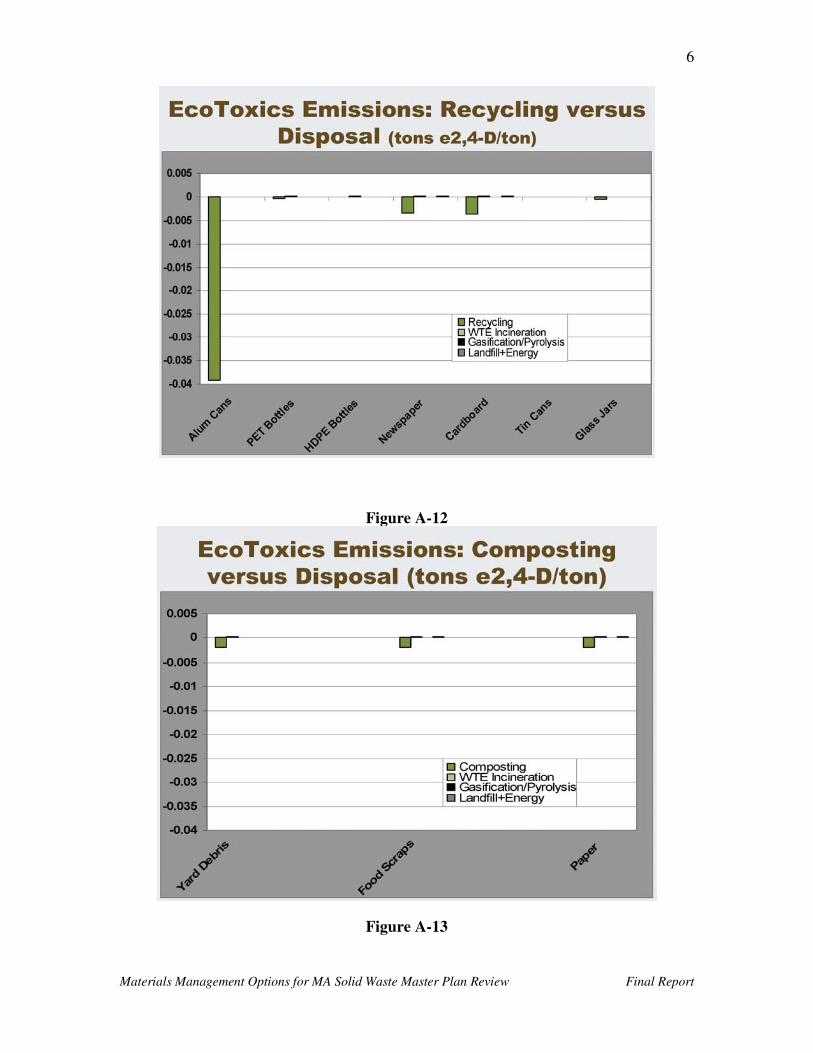
Figure A-12
Figure A-13
Materials Management Options for MA Solid Waste Master Plan Review Final Report
7
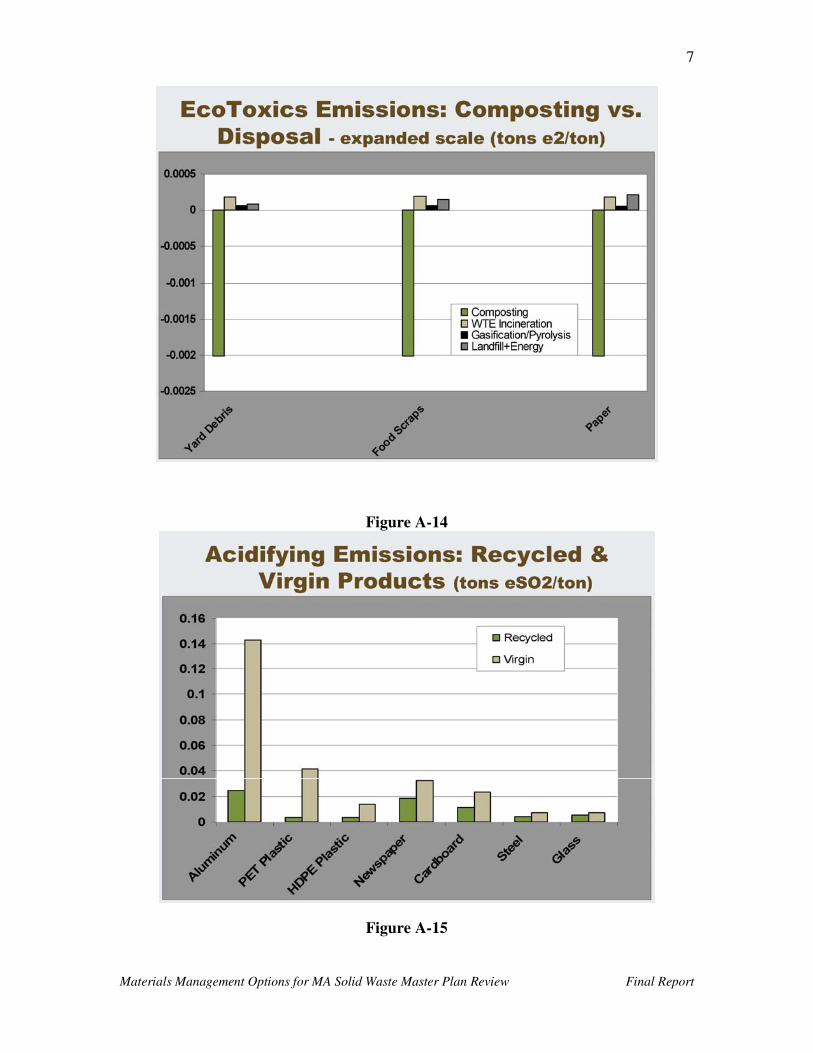
Figure A-14
Figure A-15
Materials Management Options for MA Solid Waste Master Plan Review Final Report
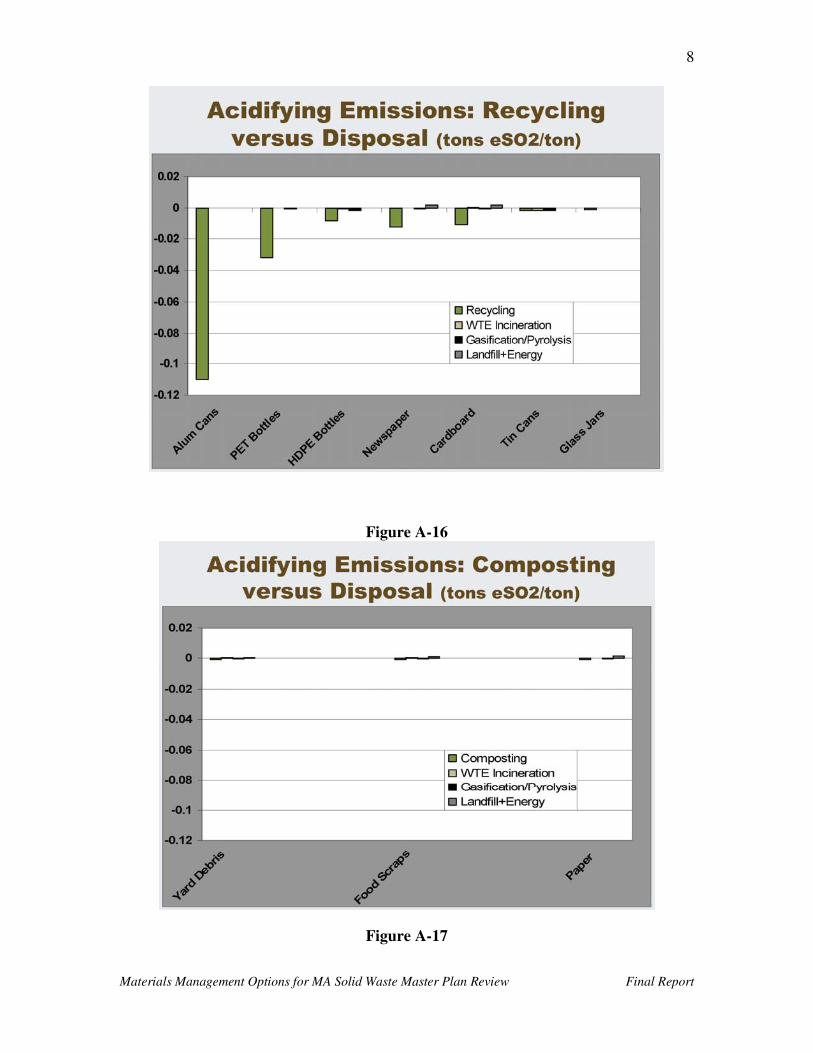
8
Figure A-16
Figure A-17
Materials Management Options for MA Solid Waste Master Plan Review Final Report
9
Figure A-18
Materials Management Options for MA Solid Waste Master Plan Review Final Report
10
Figure A-19
Figure A-20
Materials Management Options for MA Solid Waste Master Plan Review Final Report
11
Figure A-21
Figure A-22
Materials Management Options for MA Solid Waste Master Plan Review Final Report
12
Figure A-23
Figure A-24
Figure A-25
Materials Management Options for MA Solid Waste Master Plan Review Final Report
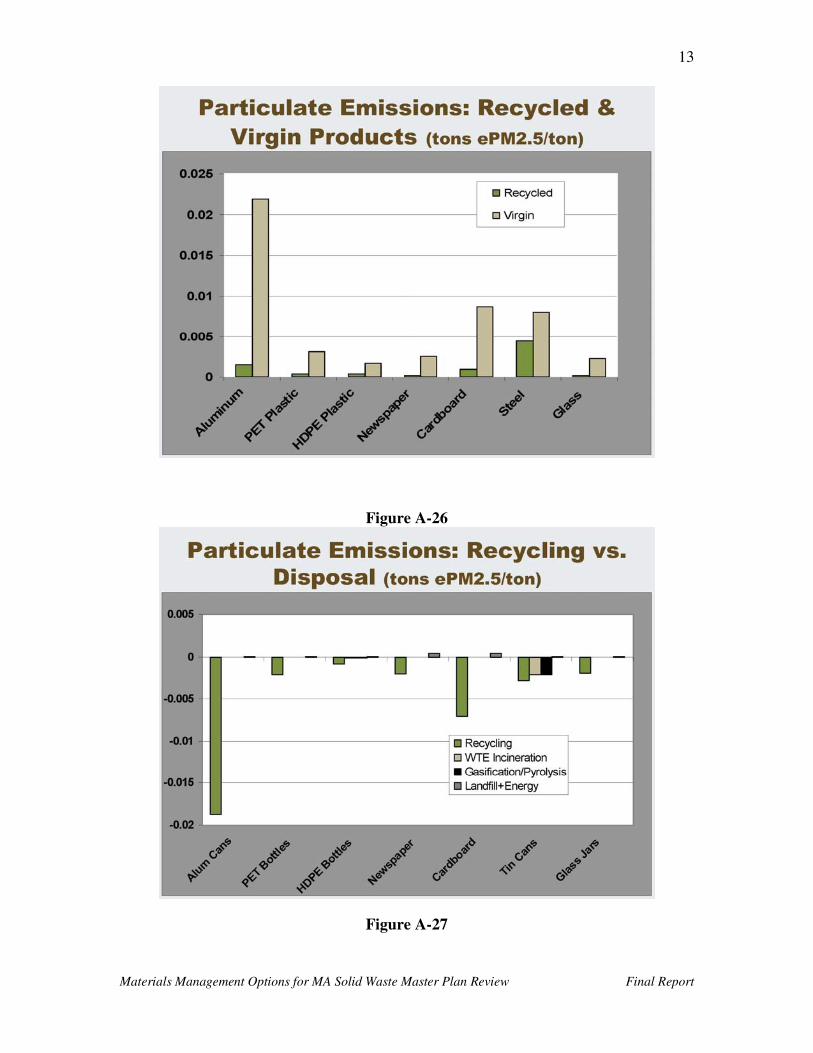
13
Figure A-26
Figure A-27
Materials Management Options for MA Solid Waste Master Plan Review Final Report
14
Figure A-28
Figure A-29
Materials Management Options for MA Solid Waste Master Plan Review Final Report
15
Figure A-30
Materials Management Options for MA Solid Waste Master Plan Review Final Repor
APPENDIX 4
References
Materials Management Options for MA Solid Waste Master Plan Review Final Report
1
Works Cited in Literature Review
AEA Technology. Waste Management Options and Climate Change: Final Report to the
European Commission. 2000.
Alternative Resources, Inc., conducted for Los Angeles County. Conversion Technology
Evaluation Report, Phase II Assessments. Concord, Mass.: October 2007.
California Integrated Waste Management Board. Draft Conversion Technologies Report
Alternative Resources, Inc., “Air Emissions from Existing Massachusetts Waste-to-
Energy Facilities Compared to Air Emissions from Advanced Thermal Conversion
Technologies,” memorandum dated January 14, 2008.
Bare, Jane C., Gregory A. Norris, David W. Pennington and Thomas McKone, TRACI:
The Tool for the Reduction and Assessment of Chemical and Other Environmental
Impacts. Journal of Industrial Ecology 6(3-4): 49-78. 2003
Bare, Jane C., Developing a Consistent Decision-Making Framework by Using the U.S.
EPA's TRACI, U.S. Environmental Protection Agency, Cincinnati, OH. 2002.
Binder, James, Alternative Resources, Inc., and Steven Torres, City of Taunton, MA,
“Evaluating Innovative Technology for Municipal Waste Management,” presented to the
NorthEast Waste Management Officials’ Association (NEWMOA), November 27, 2007. http://www.newmoa.org/solidwaste/cwm/webtraining/EvaluatingInnovativeTechnologyTaunton.
pdf
Blue Ridge Environmental Defense League (NC). Waste Gasification: Impacts on the
Environment and Public Health. 2002. http://www.bredl.org/wastegasification.pdf
California Department of Toxics Substances Control. CalTOX model description and