Journal of Taibah University for Science xxx (2015) xxx–xxx
Available online at www.sciencedirect.com
ScienceDirect
Assessment of natural radioactivity and radiological hazards inbuilding materials used in the Tiruvannamalai District, Tamilnadu,
India, using a statistical approach
Y. Raghu a, R. Ravisankar b,∗, A. Chandrasekaran c, P. Vijayagopal d, B. Venkatraman d
a Department of Physics, Aarupadai Veedu Institute of Technology, Paiyanoor, 603 104 Chennai, Tamilnadu, Indiab Post Graduate and Research Department of Physics, Government Arts College, Tiruvanamalai 606603, Tamilnadu, India
c Department of Physics, SSN College of Engineering, Kalavakkam, Chennai 603110, Tamilnadu, Indiad Radiological Safety Division, Indira Gandhi Centre for Atomic Research, Kalpakkam, 603102, Tamilnadu, India
Received 24 June 2015; received in revised form 30 July 2015; accepted 7 August 2015
bstract
One-hundred-fifty-one samples of six types of building materials were collected from different locations of the Tiruvannamalaiistrict, Tamilnadu, and were analyzed using a gamma ray spectroscopy system. From the results, the highest values observed in
he specific activities of 226Ra, 232Th and 40K were 116.1 (soil) 106.67 (sand) and 527.533 (tiles) in Bq kg−1, while the lowest valuesbserved in the specific activities of the same radionuclides were 35.73, 37.75 and 159.83 for cement in Bq kg−1, respectively. Theotential radiological hazards were assessed by calculating the radium equivalent activity (Raeq), the indoor absorbed gamma doseate (DR), the annual effective dose rate (HR), the activity utilization index (I), the alpha index (I�), the gamma index (I�), and thexternal hazard (Hex) and internal hazard (Hin) indices. The estimated mean value of the absorbed dose rate of 148.35 nGy h−1 islightly higher than the world average value of 84 nGy h−1, and the annual effective dose in the studied samples is 0.1824 mSv y−1,hich is lower than the recommended limit. Multivariate statistical methods are applied to determine the existing relationshipetween radionuclides and radiological health hazard parameters and to identify the maximum contribution of radionuclide inadioactivity. The values of the hazard indices were below the recommended levels; therefore, it is concluded that the buildings
onstructed from such materials are safe for the inhabitants. The findings from this research will be useful to assess the radiationazards of building materials in humans.
2015 The Authors. Production and hosting by Elsevier B.V. on behalf of Taibah University. This is an open access article underhe CC BY-NC-ND license (http://creativecommons.org/licenses/by-nc-nd/4.0/).
ex; Mul
eywords: Gamma ray spectroscopy; Building Materials; Hazard ind
Please cite this article in press as: Y. Raghu, et al.. Assessment
ing materials used in the Tiruvannamalai District, Tamilnadu, Indhttp://dx.doi.org/10.1016/j.jtusci.2015.08.004
C BY-NC-ND license (http://creativecommons.org/licenses/by-nc-nd/4.0/).
tivariate statistical methods
1. Introduction
Humans are continuously exposed to ionizing radi-ation from naturally occurring radioactive materials(NORM). Although the origin of these materials is
of natural radioactivity and radiological hazards in build-ia, using a statistical approach, J. Taibah Univ. Sci. (2015),
behalf of Taibah University. This is an open access article under the
the Earth’s crust, they find their way into buildingmaterials, air, water, food, and the human body itself.Measuring the activity concentrations of radionuclidesin building materials is important for the assessment of
population exposures, as most individuals spend 80% oftheir time indoors. Knowledge of the natural radioactiv-ity in humans and the human environment is importantbecause naturally occurring radionuclides are the majorsource of radiation exposure to humans. It is an estab-lished fact that all of the construction materials containtrace amounts of natural radioactivity.
Natural radioactivity is a major source of externaland internal radiation exposure to the occupants of thedwelling. The natural radioactivity in soil and build-ing materials mainly comes from uranium (238U) series,thorium (232Th) series and a radioactive isotope of potas-sium (40K). All of these natural sources of radioactivitycan be sources of both internal and external radiationexposure. Internal exposure occurs through the inhala-tion of radon gas, and external exposure occurs throughthe emission of penetrating gamma rays from radioac-tive sources. Therefore, it is important to measure theradioactivity levels in the built-up areas to assess theradiological consequences. Even more important is theknowledge of the amount of natural activity present in thematerials that are used in the construction of dwellings.The amount of activity present in building materials willdetermine their use in the construction of dwellings. Theknowledge of the natural radioactivity level is useful toset the standards and national guidelines used for pro-viding recommendations.
Due to increasing social concerns, a large number ofresearch groups are engaged in the measurement of natu-ral radioactivity in building materials at the national andworldwide levels [1–10]. The knowledge of the radioac-tivity present in construction materials helps to (a) assessthe possible radiological hazards to human health and(b) develop the standards and guidelines for the use andmanagement of these materials.
In this work, the concentrations of natural radionu-clides were measured in 151 samples of six types ofbuilding materials that are commonly used in the Tiru-vannamalai District of Tamilnadu, India, by means ofgamma-ray spectrometry, with the aim of assessing theradiological hazards due to external gamma ray expo-sure in dwellings. The potential radiological hazardsassociated with these materials were assessed by calcu-lating the radium equivalent activity (Raeq), the indoorabsorbed gamma dose rate (DR), the annual effectivedose rate (HR), the activity utilization index, the alphaindex (I�), the gamma index (I�), and the external haz-ard (Hex) and internal hazard (Hin) indices. The obtained
Please cite this article in press as: Y. Raghu, et al.. Assessment
ing materials used in the Tiruvannamalai District, Tamilnadu, Indhttp://dx.doi.org/10.1016/j.jtusci.2015.08.004
results were compared to the recommended values toassess the radiation hazards to humans resulting frombuilding materials and to compare the obtained values tothe corresponding values of the building materials from
PRESSity for Science xxx (2015) xxx–xxx
different countries. The radionuclide and radiologicalparameter data are analyzed by multivariate statisticalanalysis.
2. Materials and methods
2.1. Sampling
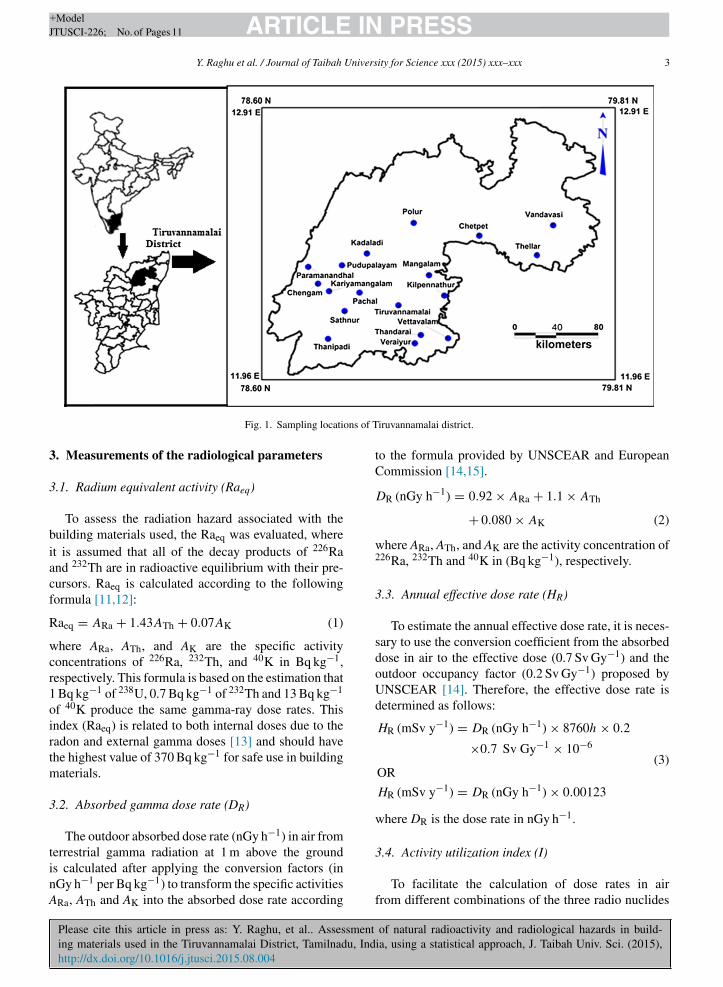
A total of 151 samples of common building materi-als, i.e., brick, clay, soil, sand, cement and tiles, werecollected from eighteen different locations of the Tiru-vannamalai District, Tamilnadu, India. The location mapis shown in Fig. 1. The sampling locations were cho-sen according to their population and the amount ofbuilding material used in the study area. Eighteen loca-tions in the district were chosen for this investigation,i.e., Vandawasi, Thellar, Chetpet, Polur, Kadaladi, Para-mananthal, Pudupalayam, Mangalam, Kariyamangalam,Chengam, Pachal, Kilpennathur, Tiruvannamalai, Satha-nur, Thandarai, Vettavalam, Veraiyur and Thanipadi.
The building material samples were directly takenfrom the manufacturer in these provinces, and the mate-rials were studied in their natural form. Each samplewas properly catalogued, marked and coded accord-ing to its origin and the location of the sampling site.After crushing, powdering, coning and quartering, therepresentative samples with a maximum grain size of1 mm were dried in an oven at approximately 110 ◦Cuntil the sample weight became constant. These sampleswere sealed in radon impermeable plastic containers.The samples were then stored for more than 30 daysto bring 222Rn and its short-lived daughter products intoequilibrium with 226Ra [9].
2.2. Radiometric analysis
Measurements of the activity concentrations of 238U,232Th and 40K in Bq kg−1 dry weight of the col-lected samples were performed with a counting timeof 20,000 secs using gamma-ray spectrometry. A 3′ × 3′NaI(Tl) detector was employed with adequate leadshielding, which reduced the background by a factorof approximately 95%. The concentrations of variousradionuclides of interest were determined in Bq kg−1
using the count spectra. The gamma-ray photo peakscorresponding to 1.46 MeV (40K), 1.76 MeV (214Bi)and 2.614 MeV (208Tl) were considered to correspondto the activities of 40K, 238U and 232Th, respectively,
of natural radioactivity and radiological hazards in build-ia, using a statistical approach, J. Taibah Univ. Sci. (2015),
in the samples. The detection limit of the NaI(Tl)detector system for 40K, 238U and 232Th is 8.50, 2.21and 2.11 Bq kg−1, respectively, for a counting time of20,000 secs.
Y. Raghu et al. / Journal of Taibah University for Science xxx (2015) xxx–xxx 3
ons of T
3
3
biacf
R
wcr1oirtm
3
tinA
Fig. 1. Sampling locati
. Measurements of the radiological parameters
.1. Radium equivalent activity (Raeq)
To assess the radiation hazard associated with theuilding materials used, the Raeq was evaluated, wheret is assumed that all of the decay products of 226Rand 232Th are in radioactive equilibrium with their pre-ursors. Raeq is calculated according to the followingormula [11,12]:
aeq = ARa + 1.43ATh + 0.07AK (1)
here ARa, ATh, and AK are the specific activityoncentrations of 226Ra, 232Th, and 40K in Bq kg−1,espectively. This formula is based on the estimation that
Bq kg−1 of 238U, 0.7 Bq kg−1 of 232Th and 13 Bq kg−1
f 40K produce the same gamma-ray dose rates. Thisndex (Raeq) is related to both internal doses due to theadon and external gamma doses [13] and should havehe highest value of 370 Bq kg−1 for safe use in buildingaterials.
.2. Absorbed gamma dose rate (DR)
The outdoor absorbed dose rate (nGy h−1) in air from
Please cite this article in press as: Y. Raghu, et al.. Assessment
ing materials used in the Tiruvannamalai District, Tamilnadu, Indhttp://dx.doi.org/10.1016/j.jtusci.2015.08.004
errestrial gamma radiation at 1 m above the grounds calculated after applying the conversion factors (inGy h−1 per Bq kg−1) to transform the specific activitiesRa, ATh and AK into the absorbed dose rate according
iruvannamalai district.
to the formula provided by UNSCEAR and EuropeanCommission [14,15].
DR (nGy h−1) = 0.92 × ARa + 1.1 × ATh
+ 0.080 × AK (2)
where ARa, ATh, and AK are the activity concentration of226Ra, 232Th and 40K in (Bq kg−1), respectively.
3.3. Annual effective dose rate (HR)
To estimate the annual effective dose rate, it is neces-sary to use the conversion coefficient from the absorbeddose in air to the effective dose (0.7 Sv Gy−1) and theoutdoor occupancy factor (0.2 Sv Gy−1) proposed byUNSCEAR [14]. Therefore, the effective dose rate isdetermined as follows:
HR (mSv y−1) = DR (nGy h−1) × 8760h × 0.2
×0.7 Sv Gy−1 × 10⁻⁶
OR
HR (mSv y−1) = DR (nGy h−1) × 0.00123
(3)
where DR is the dose rate in nGy h−1.
of natural radioactivity and radiological hazards in build-ia, using a statistical approach, J. Taibah Univ. Sci. (2015),
3.4. Activity utilization index (I)
To facilitate the calculation of dose rates in airfrom different combinations of the three radio nuclides
in building materials and by applying the appropriateconversion factors, an activity utilization index (I) isintroduced that is given by the following expression [10]:
I =(
ARa
50 Bq kg−1
)fRa +
(ATh
50 Bq kg−1
)fTh
+(
AK
50 Bq kg−1
)fK (4)
where ARa, ATh and AK are the actual values of theactivities per unit mass (Bq kg−1) of 226Ra, 232Th, and40K in the soils considered, respectively; fRa (0.462),fTh (0.604), and fK (0.041) are the fractional contrib-utions to the total dose rate in air due to gamma radiationfrom the actual concentrations of 226Ra, 232Th, and 40K,respectively.
3.5. Hazard indices
3.5.1. Hazard indices for external gamma radiation(Hex & Iγ )
For the assessment of excess gamma radiation fromthe building materials to ensure of the safety of thebuilding materials, two indices were used in this paper.Beretka and Mathew introduced a hazard index for theexternal gamma radiation dose from building materialsas given below [11]:
Hex = ARa
370 Bq kg−1 + ATh
259 Bq kg−1
+ AK
4810 Bq kg−1 (5)
The value of Hex should be below 1 to ensure the safeuse of building materials, which corresponds to the upperlimit of Raeq (370 Bq kg−1). The European Commission(EC) proposed an index called the gamma index (I�) toverify whether the guidelines of EC for building mate-rial usage are met. I� is calculated using the followingformula [15]:
I� = ARa
300+ ATh
200+ AK
3000≤ 1 (6)
The European Commission (EC) introduced a twodose criteria for the gamma dose of building materi-als: an exemption criterion of 0.3 mSv y−1 and an upperlimit of 1 mSv y−1. Most of the countries apply their
−1
Please cite this article in press as: Y. Raghu, et al.. Assessment
ing materials used in the Tiruvannamalai District, Tamilnadu, Indhttp://dx.doi.org/10.1016/j.jtusci.2015.08.004
control on the upper limit (1 mSv y ). If the exemptionlevel of 0.3 mSv y−1 is considered, then the values of I�
should be below 0.5 for materials used in bulk (i.e., brickand cement); however, if the upper level of 1 mSv y−1 is
PRESSity for Science xxx (2015) xxx–xxx
considered, then the values of I� should be below 1 forsuch materials. For superficial building materials withrestricted use (i.e., tiles and board), I� should be below2 and 6, supposing control values of 0.3 and 1 mSv y−1,respectively.
3.5.2. Hazard indices for internal alpha radiation(Hin & Iα)
The assessment of the excess � radiation due to radongas from the building materials can be calculated bysome indices. Two indices, called the internal hazardindex (Hin) and the alpha index (I�), were studied in thispaper. Hin can be used for considering the excess inter-nal radiation due to the inhalation of 222Rn and its shortlived decay products from building materials, which isdefined as [1]:
Hin = ARa
185 Bq kg−1 + ATh
259 Bq kg−1
+ AK
4810 Bq kg−1 (7)
This quantity should be less than unity for the safe useof materials in the construction of buildings. The quantityI� has been proposed by Krieger [16] and Stoulos [17]and is given below:
I� = ARa
200(8)
The recommended values of I� and I� are below 0.5and 1, respectively [15].
3.6. Multivariate statistical methods
Multivariate statistical analyses were performedusing the software SPSS version 16. Descriptive statis-tics, histograms, Pearson correlation analysis, factoranalysis and cluster analysis were performed betweennatural radionuclides and the calculated radiologicalhazard parameters of building materials.
4. Results and discussions
4.1. The concentration of natural radionuclides
Table 1 list the ranges and the mean values of the activ-ity concentrations of 226Ra, 232Th and 40K for six types
of natural radioactivity and radiological hazards in build-ia, using a statistical approach, J. Taibah Univ. Sci. (2015),
of building materials in the Tiruvannamalai District,Tamilnadu, India. From Table 1, the highest mean valueof each of 226Ra, 232Th, and 40K was 116.12, 101.67,and 527.533 Bq kg−1 in soil, sand and tiles, respectively.
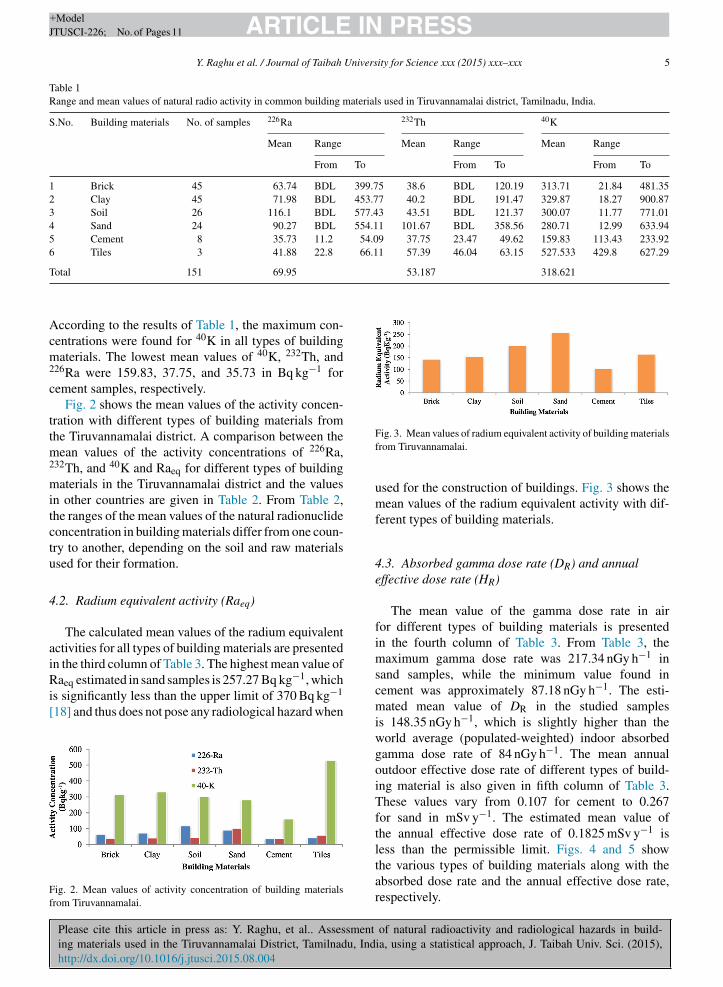
ccording to the results of Table 1, the maximum con-entrations were found for 40K in all types of buildingaterials. The lowest mean values of 40K, 232Th, and
26Ra were 159.83, 37.75, and 35.73 in Bq kg−1 forement samples, respectively.
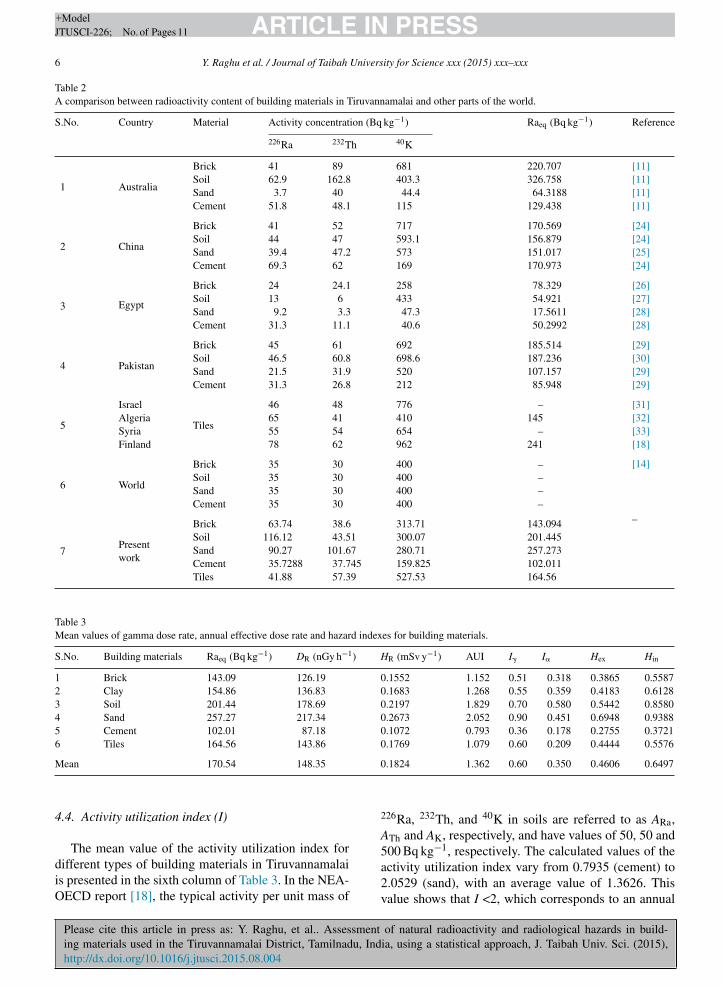
Fig. 2 shows the mean values of the activity concen-ration with different types of building materials fromhe Tiruvannamalai district. A comparison between the
ean values of the activity concentrations of 226Ra,32Th, and 40K and Raeq for different types of buildingaterials in the Tiruvannamalai district and the values
n other countries are given in Table 2. From Table 2,he ranges of the mean values of the natural radionuclideoncentration in building materials differ from one coun-ry to another, depending on the soil and raw materialssed for their formation.
.2. Radium equivalent activity (Raeq)
The calculated mean values of the radium equivalentctivities for all types of building materials are presentedn the third column of Table 3. The highest mean value of
Please cite this article in press as: Y. Raghu, et al.. Assessment
ing materials used in the Tiruvannamalai District, Tamilnadu, Indhttp://dx.doi.org/10.1016/j.jtusci.2015.08.004
aeq estimated in sand samples is 257.27 Bq kg−1, whichs significantly less than the upper limit of 370 Bq kg−1
18] and thus does not pose any radiological hazard when
ig. 2. Mean values of activity concentration of building materialsrom Tiruvannamalai.
Fig. 3. Mean values of radium equivalent activity of building materialsfrom Tiruvannamalai.
used for the construction of buildings. Fig. 3 shows themean values of the radium equivalent activity with dif-ferent types of building materials.
The mean value of the gamma dose rate in airfor different types of building materials is presentedin the fourth column of Table 3. From Table 3, themaximum gamma dose rate was 217.34 nGy h−1 insand samples, while the minimum value found incement was approximately 87.18 nGy h−1. The esti-mated mean value of DR in the studied samplesis 148.35 nGy h−1, which is slightly higher than theworld average (populated-weighted) indoor absorbedgamma dose rate of 84 nGy h−1. The mean annualoutdoor effective dose rate of different types of build-ing material is also given in fifth column of Table 3.These values vary from 0.107 for cement to 0.267for sand in mSv y−1. The estimated mean value ofthe annual effective dose rate of 0.1825 mSv y−1 isless than the permissible limit. Figs. 4 and 5 showthe various types of building materials along with the
of natural radioactivity and radiological hazards in build-ia, using a statistical approach, J. Taibah Univ. Sci. (2015),
absorbed dose rate and the annual effective dose rate,respectively.
Please cite this article in press as: Y. Raghu, et al.. Assessment
ing materials used in the Tiruvannamalai District, Tamilnadu, Indhttp://dx.doi.org/10.1016/j.jtusci.2015.08.004
The mean value of the activity utilization index fordifferent types of building materials in Tiruvannamalaiis presented in the sixth column of Table 3. In the NEA-OECD report [18], the typical activity per unit mass of
0.1824 1.362 0.60 0.350 0.4606 0.6497
226Ra, 232Th, and 40K in soils are referred to as ARa,ATh and AK, respectively, and have values of 50, 50 and
−1
of natural radioactivity and radiological hazards in build-ia, using a statistical approach, J. Taibah Univ. Sci. (2015),
500 Bq kg , respectively. The calculated values of theactivity utilization index vary from 0.7935 (cement) to2.0529 (sand), with an average value of 1.3626. Thisvalue shows that I <2, which corresponds to an annual
Y. Raghu et al. / Journal of Taibah University for Science xxx (2015) xxx–xxx 7
Fig. 4. Mean values of absorbed dose rate of building materials fromTiruvannamalai.
Ff
etafA
4
(HT0rto
tittf
Ff
symmetrically distributed about the mean. The normaldistribution has a skewness of zero. However, in reality,the data points may not be perfectly symmetric [10].
ig. 5. Mean values of annual effective dose rate of building materialsrom Tiruvannamalai.
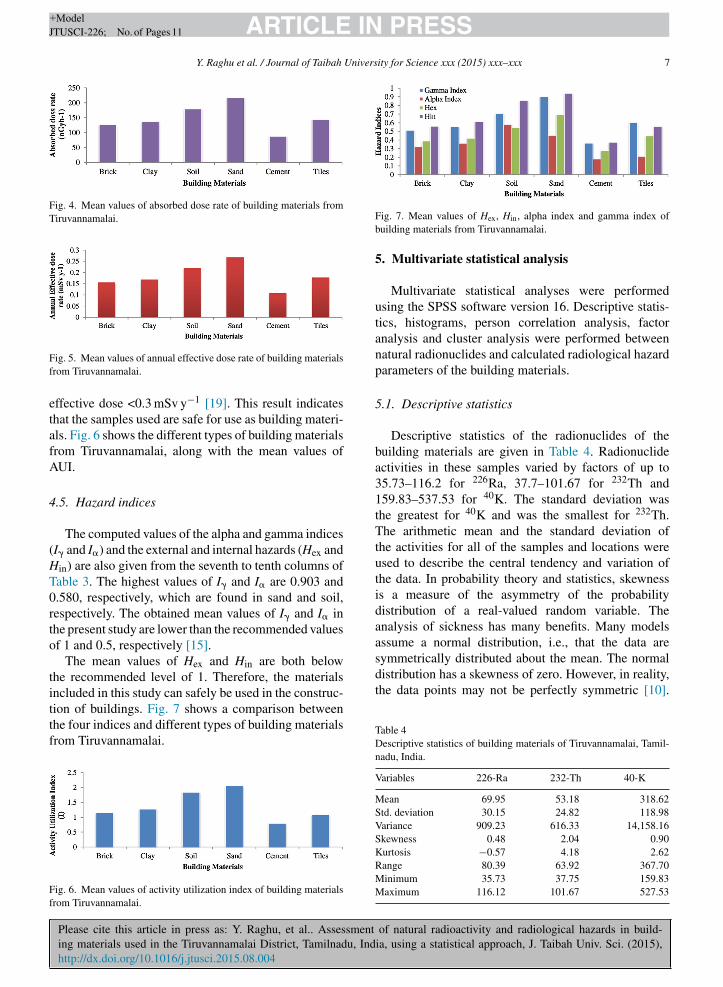
ffective dose <0.3 mSv y−1 [19]. This result indicateshat the samples used are safe for use as building materi-ls. Fig. 6 shows the different types of building materialsrom Tiruvannamalai, along with the mean values ofUI.
.5. Hazard indices
The computed values of the alpha and gamma indicesI� and I�) and the external and internal hazards (Hex and
in) are also given from the seventh to tenth columns ofable 3. The highest values of I� and I� are 0.903 and.580, respectively, which are found in sand and soil,espectively. The obtained mean values of I� and I� inhe present study are lower than the recommended valuesf 1 and 0.5, respectively [15].
The mean values of Hex and Hin are both belowhe recommended level of 1. Therefore, the materialsncluded in this study can safely be used in the construc-
Please cite this article in press as: Y. Raghu, et al.. Assessment
ing materials used in the Tiruvannamalai District, Tamilnadu, Indhttp://dx.doi.org/10.1016/j.jtusci.2015.08.004
ion of buildings. Fig. 7 shows a comparison betweenhe four indices and different types of building materialsrom Tiruvannamalai.
ig. 6. Mean values of activity utilization index of building materialsrom Tiruvannamalai.
Fig. 7. Mean values of Hex, Hin, alpha index and gamma index ofbuilding materials from Tiruvannamalai.
5. Multivariate statistical analysis
Multivariate statistical analyses were performedusing the SPSS software version 16. Descriptive statis-tics, histograms, person correlation analysis, factoranalysis and cluster analysis were performed betweennatural radionuclides and calculated radiological hazardparameters of the building materials.
5.1. Descriptive statistics
Descriptive statistics of the radionuclides of thebuilding materials are given in Table 4. Radionuclideactivities in these samples varied by factors of up to35.73–116.2 for 226Ra, 37.7–101.67 for 232Th and159.83–537.53 for 40K. The standard deviation wasthe greatest for 40K and was the smallest for 232Th.The arithmetic mean and the standard deviation ofthe activities for all of the samples and locations wereused to describe the central tendency and variation ofthe data. In probability theory and statistics, skewnessis a measure of the asymmetry of the probabilitydistribution of a real-valued random variable. Theanalysis of sickness has many benefits. Many modelsassume a normal distribution, i.e., that the data are
of natural radioactivity and radiological hazards in build-ia, using a statistical approach, J. Taibah Univ. Sci. (2015),
Table 4Descriptive statistics of building materials of Tiruvannamalai, Tamil-nadu, India.
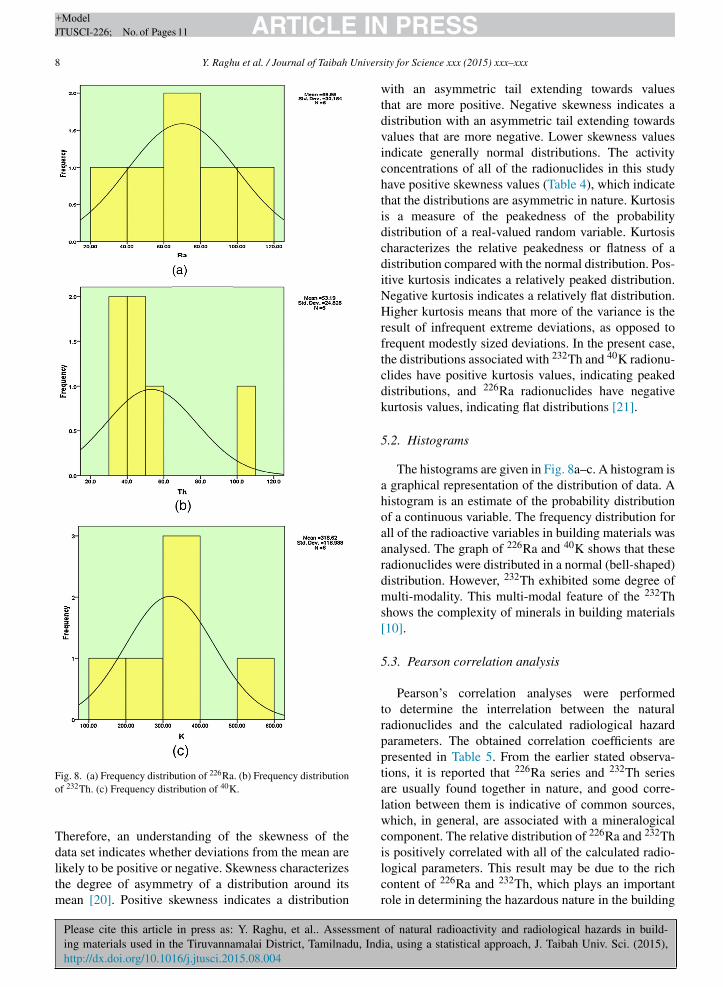
Fig. 8. (a) Frequency distribution of 226Ra. (b) Frequency distribution
is positively correlated with all of the calculated radio-
of 232Th. (c) Frequency distribution of 40K.
Therefore, an understanding of the skewness of thedata set indicates whether deviations from the mean are
Please cite this article in press as: Y. Raghu, et al.. Assessment
ing materials used in the Tiruvannamalai District, Tamilnadu, Indhttp://dx.doi.org/10.1016/j.jtusci.2015.08.004
likely to be positive or negative. Skewness characterizesthe degree of asymmetry of a distribution around itsmean [20]. Positive skewness indicates a distribution
PRESSity for Science xxx (2015) xxx–xxx
with an asymmetric tail extending towards valuesthat are more positive. Negative skewness indicates adistribution with an asymmetric tail extending towardsvalues that are more negative. Lower skewness valuesindicate generally normal distributions. The activityconcentrations of all of the radionuclides in this studyhave positive skewness values (Table 4), which indicatethat the distributions are asymmetric in nature. Kurtosisis a measure of the peakedness of the probabilitydistribution of a real-valued random variable. Kurtosischaracterizes the relative peakedness or flatness of adistribution compared with the normal distribution. Pos-itive kurtosis indicates a relatively peaked distribution.Negative kurtosis indicates a relatively flat distribution.Higher kurtosis means that more of the variance is theresult of infrequent extreme deviations, as opposed tofrequent modestly sized deviations. In the present case,the distributions associated with 232Th and 40K radionu-clides have positive kurtosis values, indicating peakeddistributions, and 226Ra radionuclides have negativekurtosis values, indicating flat distributions [21].
5.2. Histograms
The histograms are given in Fig. 8a–c. A histogram isa graphical representation of the distribution of data. Ahistogram is an estimate of the probability distributionof a continuous variable. The frequency distribution forall of the radioactive variables in building materials wasanalysed. The graph of 226Ra and 40K shows that theseradionuclides were distributed in a normal (bell-shaped)distribution. However, 232Th exhibited some degree ofmulti-modality. This multi-modal feature of the 232Thshows the complexity of minerals in building materials[10].
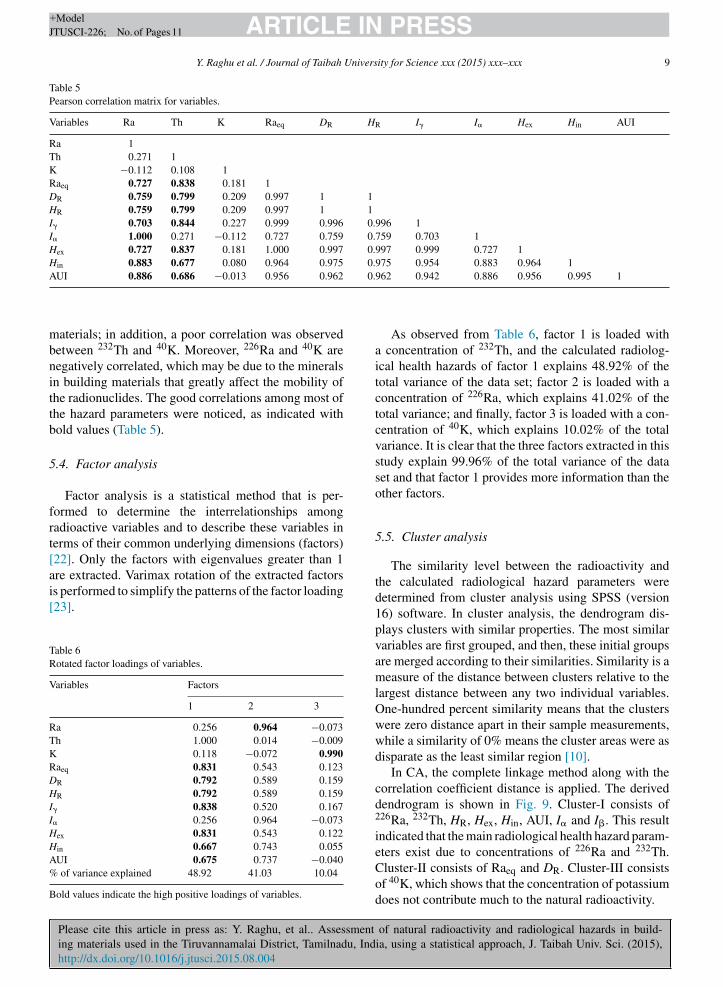
5.3. Pearson correlation analysis
Pearson’s correlation analyses were performedto determine the interrelation between the naturalradionuclides and the calculated radiological hazardparameters. The obtained correlation coefficients arepresented in Table 5. From the earlier stated observa-tions, it is reported that 226Ra series and 232Th seriesare usually found together in nature, and good corre-lation between them is indicative of common sources,which, in general, are associated with a mineralogicalcomponent. The relative distribution of 226Ra and 232Th
of natural radioactivity and radiological hazards in build-ia, using a statistical approach, J. Taibah Univ. Sci. (2015),
logical parameters. This result may be due to the richcontent of 226Ra and 232Th, which plays an importantrole in determining the hazardous nature in the building
aterials; in addition, a poor correlation was observedetween 232Th and 40K. Moreover, 226Ra and 40K areegatively correlated, which may be due to the mineralsn building materials that greatly affect the mobility ofhe radionuclides. The good correlations among most ofhe hazard parameters were noticed, as indicated withold values (Table 5).
.4. Factor analysis
Factor analysis is a statistical method that is per-ormed to determine the interrelationships amongadioactive variables and to describe these variables inerms of their common underlying dimensions (factors)22]. Only the factors with eigenvalues greater than 1
Please cite this article in press as: Y. Raghu, et al.. Assessment
ing materials used in the Tiruvannamalai District, Tamilnadu, Indhttp://dx.doi.org/10.1016/j.jtusci.2015.08.004
re extracted. Varimax rotation of the extracted factorss performed to simplify the patterns of the factor loading23].
able 6otated factor loadings of variables.
ariables Factors
1 2 3
a 0.256 0.964 −0.073h 1.000 0.014 −0.009
0.118 −0.072 0.990aeq 0.831 0.543 0.123
R 0.792 0.589 0.159
R 0.792 0.589 0.159
� 0.838 0.520 0.167
� 0.256 0.964 −0.073
ex 0.831 0.543 0.122
in 0.667 0.743 0.055UI 0.675 0.737 −0.040
of variance explained 48.92 41.03 10.04
old values indicate the high positive loadings of variables.
962 0.942 0.886 0.956 0.995 1
As observed from Table 6, factor 1 is loaded witha concentration of 232Th, and the calculated radiolog-ical health hazards of factor 1 explains 48.92% of thetotal variance of the data set; factor 2 is loaded with aconcentration of 226Ra, which explains 41.02% of thetotal variance; and finally, factor 3 is loaded with a con-centration of 40K, which explains 10.02% of the totalvariance. It is clear that the three factors extracted in thisstudy explain 99.96% of the total variance of the dataset and that factor 1 provides more information than theother factors.
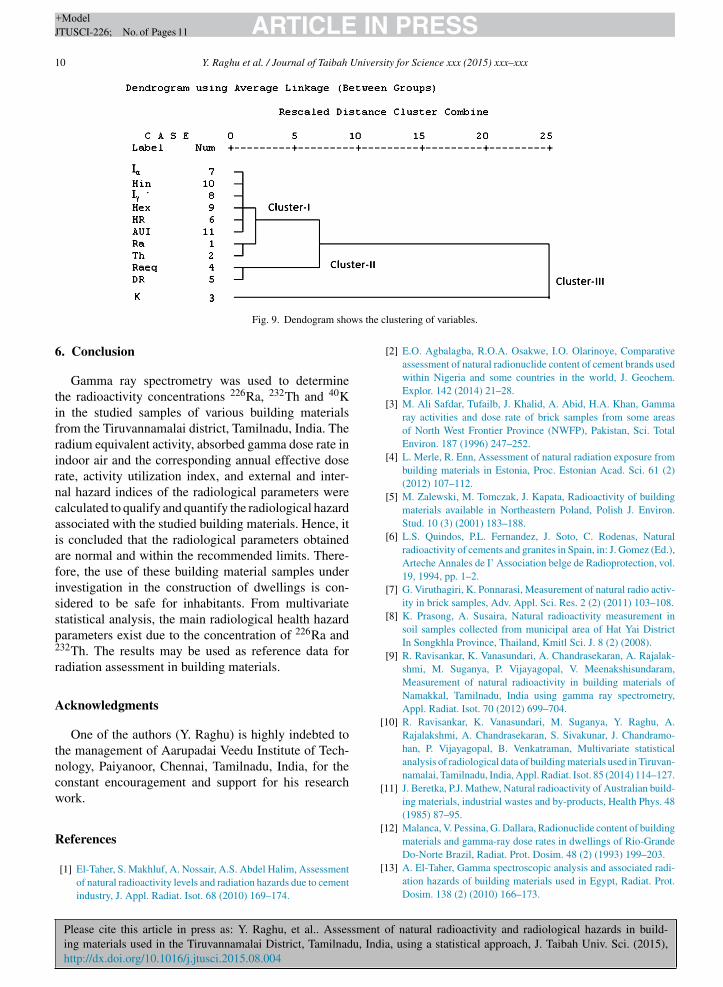
5.5. Cluster analysis
The similarity level between the radioactivity andthe calculated radiological hazard parameters weredetermined from cluster analysis using SPSS (version16) software. In cluster analysis, the dendrogram dis-plays clusters with similar properties. The most similarvariables are first grouped, and then, these initial groupsare merged according to their similarities. Similarity is ameasure of the distance between clusters relative to thelargest distance between any two individual variables.One-hundred percent similarity means that the clusterswere zero distance apart in their sample measurements,while a similarity of 0% means the cluster areas were asdisparate as the least similar region [10].
In CA, the complete linkage method along with thecorrelation coefficient distance is applied. The deriveddendrogram is shown in Fig. 9. Cluster-I consists of226Ra, 232Th, HR, Hex, Hin, AUI, I� and I�. This resultindicated that the main radiological health hazard param-
226 232
of natural radioactivity and radiological hazards in build-ia, using a statistical approach, J. Taibah Univ. Sci. (2015),
eters exist due to concentrations of Ra and Th.Cluster-II consists of Raeq and DR. Cluster-III consistsof 40K, which shows that the concentration of potassiumdoes not contribute much to the natural radioactivity.
10 Y. Raghu et al. / Journal of Taibah University for Science xxx (2015) xxx–xxx
ws the
[
[
[
Fig. 9. Dendogram sho
6. Conclusion
Gamma ray spectrometry was used to determinethe radioactivity concentrations 226Ra, 232Th and 40Kin the studied samples of various building materialsfrom the Tiruvannamalai district, Tamilnadu, India. Theradium equivalent activity, absorbed gamma dose rate inindoor air and the corresponding annual effective doserate, activity utilization index, and external and inter-nal hazard indices of the radiological parameters werecalculated to qualify and quantify the radiological hazardassociated with the studied building materials. Hence, itis concluded that the radiological parameters obtainedare normal and within the recommended limits. There-fore, the use of these building material samples underinvestigation in the construction of dwellings is con-sidered to be safe for inhabitants. From multivariatestatistical analysis, the main radiological health hazardparameters exist due to the concentration of 226Ra and232Th. The results may be used as reference data forradiation assessment in building materials.
Acknowledgments
One of the authors (Y. Raghu) is highly indebted tothe management of Aarupadai Veedu Institute of Tech-nology, Paiyanoor, Chennai, Tamilnadu, India, for theconstant encouragement and support for his researchwork.
References
Please cite this article in press as: Y. Raghu, et al.. Assessment
ing materials used in the Tiruvannamalai District, Tamilnadu, Indhttp://dx.doi.org/10.1016/j.jtusci.2015.08.004
[1] El-Taher, S. Makhluf, A. Nossair, A.S. Abdel Halim, Assessmentof natural radioactivity levels and radiation hazards due to cementindustry, J. Appl. Radiat. Isot. 68 (2010) 169–174.
[
clustering of variables.
[2] E.O. Agbalagba, R.O.A. Osakwe, I.O. Olarinoye, Comparativeassessment of natural radionuclide content of cement brands usedwithin Nigeria and some countries in the world, J. Geochem.Explor. 142 (2014) 21–28.
[3] M. Ali Safdar, Tufailb, J. Khalid, A. Abid, H.A. Khan, Gammaray activities and dose rate of brick samples from some areasof North West Frontier Province (NWFP), Pakistan, Sci. TotalEnviron. 187 (1996) 247–252.
[4] L. Merle, R. Enn, Assessment of natural radiation exposure frombuilding materials in Estonia, Proc. Estonian Acad. Sci. 61 (2)(2012) 107–112.
[5] M. Zalewski, M. Tomczak, J. Kapata, Radioactivity of buildingmaterials available in Northeastern Poland, Polish J. Environ.Stud. 10 (3) (2001) 183–188.
[6] L.S. Quindos, P.L. Fernandez, J. Soto, C. Rodenas, Naturalradioactivity of cements and granites in Spain, in: J. Gomez (Ed.),Arteche Annales de I’ Association belge de Radioprotection, vol.19, 1994, pp. 1–2.
[7] G. Viruthagiri, K. Ponnarasi, Measurement of natural radio activ-ity in brick samples, Adv. Appl. Sci. Res. 2 (2) (2011) 103–108.
[8] K. Prasong, A. Susaira, Natural radioactivity measurement insoil samples collected from municipal area of Hat Yai DistrictIn Songkhla Province, Thailand, Kmitl Sci. J. 8 (2) (2008).
[9] R. Ravisankar, K. Vanasundari, A. Chandrasekaran, A. Rajalak-shmi, M. Suganya, P. Vijayagopal, V. Meenakshisundaram,Measurement of natural radioactivity in building materials ofNamakkal, Tamilnadu, India using gamma ray spectrometry,Appl. Radiat. Isot. 70 (2012) 699–704.
10] R. Ravisankar, K. Vanasundari, M. Suganya, Y. Raghu, A.Rajalakshmi, A. Chandrasekaran, S. Sivakunar, J. Chandramo-han, P. Vijayagopal, B. Venkatraman, Multivariate statisticalanalysis of radiological data of building materials used in Tiruvan-namalai, Tamilnadu, India, Appl. Radiat. Isot. 85 (2014) 114–127.
11] J. Beretka, P.J. Mathew, Natural radioactivity of Australian build-ing materials, industrial wastes and by-products, Health Phys. 48(1985) 87–95.
12] Malanca, V. Pessina, G. Dallara, Radionuclide content of buildingmaterials and gamma-ray dose rates in dwellings of Rio-Grande
of natural radioactivity and radiological hazards in build-ia, using a statistical approach, J. Taibah Univ. Sci. (2015),
Do-Norte Brazil, Radiat. Prot. Dosim. 48 (2) (1993) 199–203.13] A. El-Taher, Gamma spectroscopic analysis and associated radi-
ation hazards of building materials used in Egypt, Radiat. Prot.Dosim. 138 (2) (2010) 166–173.
14] UNSCEAR United National Scientific Committee on the Effectsof Atomic Radiation Sources and Risks of Ionizing Radiation,Report to the General Assembly with Annexes, United Nations,New York, 2000.
15] EC (European Commission), Radiation Protection, 112 –Radiological Protection Principles Concerning the NaturalRadioactivity of Building Materials, Directorate – General Envi-ronment. Nuclear Safety and Civil Protection, 1999.
16] V.R. Krieger, Radioactivity of construction materials, BetonwerkFertigteil Technol. 47 (1981) 468–473.
17] S. Stoulos, M. Manolopoulou, C. Papastefanou, Assessment ofnatural radiation exposure and radon exhalation from buildingmaterials in Greece, J. Environ. Radioact. 69 (2003) 225–240.
18] NEA-OECD, Nuclear Energy Agency. Exposure to Radiationfrom Natural Radioactivity in Building Materials. Report by NEAGroup of Experts, OECD, Paris, 1979.
19] El-Gamal, S. Nasr, El-Taher, Study of the spatial distributionof natural radioactivity in upper Egypt, Nile River Sediments,Radiat. Meas. 42 (2007) 457–465.
20] R.A. Groeneveld, G. Meeden, Measuring skewness and kurtosis,Statistician 33 (4) (1984) 391–399.
21] A.A. Adam, M.A.H. Eltayeb, Multivariate statistical analysis ofradioactive variables in two phosphate ores from Sudan, J. Envi-ron. Radioact. 107 (2012) 23–43.
Please cite this article in press as: Y. Raghu, et al.. Assessment
ing materials used in the Tiruvannamalai District, Tamilnadu, Indhttp://dx.doi.org/10.1016/j.jtusci.2015.08.004
22] J.C. Davis, Statistics and Data Analysis in Geology, Wiley, NewYork, 1986, pp. 17.
23] H.F. Kaiser, The varimax criteria for analytical rotation in factoranalysis, Psychometrika 23 (1958) 187–200.
[
[
PRESSity for Science xxx (2015) xxx–xxx 11
24] P. Ziqiang, Y. Yin, G. Mingqiang, Natural radiation and radioac-tivity in China, Radiat. Prot. Dosim. 24 (1988) 88–99.
25] K.N. Yu, Z.J. Guan, M.J. Stokes, E.C.M. Young, The assessmentof the natural radiation dose committed to the Hong Kong people,J. Environ. Radioact. 17 (1992) 31–48.
26] M.S. El-Tahawy, R.H. Higgy, Natural radioactivity in differenttypes of bricks fabricated and used in Cario region, Appl. Radiat.Isot. 46 (12) (1995) 1401–1406.
27] Sroor, S.M. El-Bahi, F. Ahmad, A.S. Abdul-Halim, Naturalradioactivity and radon exhalation rate of soil in southern Egypt,Appl. Radiat. Isot. 55 (2001) 873–879.
28] M. Sharaf, M. Mansy, A. El-Sayed, E. Abbas, Natural radioactiv-ity and radon exhalation rates in building materials used in Egypt,Radiat. Meas. 31 (1999) 491–495.
29] M. Tufail, Nasim-Akhtar, Sabiha-Javied, Tehsin-Hamid, Naturalradioactivity hazards of building bricks fabricated from salinesoil of two districts of Pakistan, J. Radiat. Prot. 27 (2007)481–492.
30] M. Tufail, N. Ahmad, N.M. Mirza, S.M. Mirza, Activity Con-centration in Building Materials. Report No. CNS-25, Centre forNuclear Studies, Islamabad, Pakistan, 1992.
31] Akkurt, Natural radioactivity and radiation hazards in some build-ing materials used in Isparta, Turkey, Radiat. Phys. Chem. 79(2010) 933–937.
of natural radioactivity and radiological hazards in build-ia, using a statistical approach, J. Taibah Univ. Sci. (2015),
32] D. Amrani, M. Tahtat, Natural radioactivity in Algerian buildingmaterials, Appl. Radiat. Isot. 54 (2001) 687–689.
33] R. Shweikani, Radon exhalation from some finishing materialsfrequently used in Syria, Radiat. Meas. 44 (2009) 1019–1023.
![Harnessing the power of radioactivity · The discoveries of radioactivity, both natural and artificial, have evolved to cure and create problems in human life [Figure 1]. When radioactivity](https://static.documents.pub/doc/80x56/5e9dab3ce24dbc500363b835/harnessing-the-power-of-radioactivity-the-discoveries-of-radioactivity-both-natural.jpg)


