Page 1
RESEARCH ARTICLE
Assessment of patient perception of
glaucomatous visual field loss and its
association with disease severity using Amsler
grid
Kenji Fujitani1, Daniel Su1, Mark P. Ghassibi1, Joseph L. Simonson1, Jeffrey
M. Liebmann2, Robert Ritch1, Sung Chul Park3,4*
1 Moise and Chella Safra Advanced Ocular Imaging Laboratory, Einhorn Clinical Research Center, New York
Eye and Ear Infirmary of Mount Sinai, New York, NY, United States of America, 2 Bernard and Shirlee Brown
Glaucoma Research Laboratory, Harkness Eye Institute, Columbia University Medical Center, New York, NY,
United States of America, 3 Department of Ophthalmology, Manhattan Eye, Ear and Throat Hospital, New
York, NY, United States of America, 4 Department of Ophthalmology, Zucker School of Medicine at Hofstra/
Northwell, Hempstead, NY, United States of America
* [email protected]
Abstract
Purpose
To investigate patients’ perception of glaucomatous VF loss and its association with glau-
coma severity using the Amsler grid test.
Methods
In this prospective cross-sectional study, glaucoma patients with abnormal 10–2 Humphrey
Swedish Interactive Threshold Algorithm-standard VF tests were enrolled consecutively. All
patients underwent a black-on-white Amsler grid test for each eligible eye. They were asked
to outline any perceived scotomas (areas with abnormal grid lines) on the grid and then
describe verbally their perception of the scotomas. Examiners asked patients to clarify their
descriptions. All descriptions used by patients were recorded in their own words, which were
then sorted into descriptor categories according to similar themes. The number of descriptor
categories was counted for each eye. 10–2 VF mean deviation (MD) was compared among
eyes that reported different number of descriptor categories. The mean 10–2 VF MD values
were compared among different descriptor categories.
Results
Fifty glaucoma patients (88 eyes) were included. Patients used a total of 44 different
descriptors for their scotomas. Patients’ descriptors were classified into categories that
incorporated similar themes, resulting in 4 overarching descriptor categories: Missing/
White, Blurry/Gray, Black, and Not Aware. Fifty-two eyes reported one descriptor category
and 19 eyes reported two descriptor categories (mean number of descriptor categories =
1.27±0.45). Eyes that reported two descriptor categories had worse VF MD than those that
PLOS ONE | https://doi.org/10.1371/journal.pone.0184230 September 26, 2017 1 / 10
a1111111111
a1111111111
a1111111111
a1111111111
a1111111111
OPENACCESS
Citation: Fujitani K, Su D, Ghassibi MP, Simonson
JL, Liebmann JM, Ritch R, et al. (2017)
Assessment of patient perception of glaucomatous
visual field loss and its association with disease
severity using Amsler grid. PLoS ONE 12(9):
e0184230. https://doi.org/10.1371/journal.
pone.0184230
Editor: Andrew Anderson, The University of
Melbourne, AUSTRALIA
Received: April 2, 2017
Accepted: August 21, 2017
Published: September 26, 2017
Copyright: © 2017 Fujitani et al. This is an open
access article distributed under the terms of the
Creative Commons Attribution License, which
permits unrestricted use, distribution, and
reproduction in any medium, provided the original
author and source are credited.
Data Availability Statement: All relevant data are
within the paper and its Supporting Information
files.
Funding: Supported by the Corrine Graber and
Jonathan Reynolds Research Funds of the New
York Glaucoma Research Institute, New York, NY,
the Glaucoma Education and Research Fund of the
Manhattan Eye, Ear and Throat Hospital (#591601),
New York, NY, and the Sy & Felicia Jacobs
Charitable Fund of The Schwab Charitable. The
Page 2
reported one (-17.86±10.31 dB vs. -12.08±7.53 dB; p = 0.012). When eyes were organized
according to its combination of descriptor categories, each eye naturally sorted into one of
the following 5 groups, in frequency order: Missing/White (27 eyes; 31%), Blurry/Gray (21
eyes; 24%), combined Missing/White and Blurry/Gray (19 eyes; 21%), Not Aware (17 eyes;
19%), and Black (4 eyes; 5%). The mean 10–2 VF MD severity order was Black (-21.18
±10.59 dB), combined Missing/White and Blurry/Gray (-17.86±10.31 dB), Missing/White
(-11.92±6.76 dB), Blurry/Gray (-10.55±7.03 dB), and Not Aware (-3.91±4.05 dB) (p<0.001).
Conclusion
Paracentral vision loss in glaucoma is perceived by patients. As the perception of scotomas
and the variety of terms to describe scotomas are related to glaucoma severity, clinicians
should pay attention to patients’ subjective descriptions of their glaucomatous VF loss. The
historical notion that glaucoma patients lose their peripheral vision first and eventually look
through a black tunnel needs to be updated to reflect the true perception of glaucoma.
Introduction
Glaucoma is the second leading cause of blindness worldwide[1] and is estimated to affect 80
million people by the year 2020 [2]. While automated perimetry is widely used in research and
clinical practice as the main measure of glaucoma patients’ visual deficits [3–5], much is
unknown about what they actually see [6]. The NIH website [7] describes that at first, open-
angle glaucoma has normal vision with no symptoms but with glaucoma progression, patients
lose their vision over time. It continues that people with glaucoma slowly lose their peripheral
vision and eventually seem to be looking through a tunnel [7]. However, with advancements
in understanding glaucoma, the description of glaucomatous visual loss as black tunnel vision
has come into question.
Crabb et al [8] found that glaucoma patients frequently opted for terms such as “missing”
and “blur” rather than “black” to describe their visual field (VF) loss. Some patients were
unaware of their VF loss [8]. Hu et al [9] reported that most of the time, vision loss in glau-
coma was characterized by blurry vision and needing more light. Accurate understanding of
patients’ perception of glaucomatous VF loss and how it affects them in their daily lives are
helpful to diagnose, monitor, and increase adherence to treatment for glaucoma [10]. An
improved understanding of the relationship between patient-reported visual dysfunction and
glaucoma severity is also helpful to glaucoma management.
We have described the utility of the Amsler grid in glaucoma and found that it could iden-
tify VF defects within the central 10 degrees with an overall specificity of 92% and positive pre-
dictive value of 97% [11]. In the present study, we used the Amsler grid to better understand
patients’ perception of glaucomatous visual loss and sought to describe the association between
patients’ perception of scotomas and glaucoma severity.
Materials and methods
This prospective, cross-sectional study was approved by the Institutional Review Board for
Human Research of the New York Eye and Ear Infirmary. Written informed consent was
obtained from all subjects and the study adhered to Health Insurance Portability and Account-
ability Act and the tenets of the Declaration of Helsinki.
Patient perception of glaucomatous visual field loss
PLOS ONE | https://doi.org/10.1371/journal.pone.0184230 September 26, 2017 2 / 10
funders had no role in study design, data collection
and analysis, decision to publish, or preparation of
the manuscript.
Competing interests: The authors have declared
that no competing interests exist.
Page 3
Consecutive glaucoma patients with a range of optic disc and VF abnormalities represent-
ing various stages of glaucomatous damage were prospectively recruited from August 1, 2011
to December 31, 2011. Glaucoma was defined by the presence of characteristic glaucomatous
optic disc and/or retina changes (localized or diffuse neuroretinal rim thinning or retinal
nerve fiber layer defect) associated with corresponding reproducible VF defects on 24–2 Swed-
ish Interactive Threshold Algorithm (SITA) standard VF test (Humphrey Field Analyzer II;
Carl Zeiss Meditec, Inc., Dublin, CA). A glaucomatous VF defect was defined as a glaucoma
hemifield test result outside normal limits on two consecutive VF tests and the presence of at
least 3 contiguous test points within the same hemifield on pattern deviation plot at p<0.01,
with at least 1 point at p<0.005. These tests required reliability indices better than 15%.
Among these patients, those with abnormal 10–2 SITA standard VF test (Humphrey Field
Analyzer II) on the date of enrollment or within the previous 3 months were enrolled for the
Amsler grid test. An abnormal 10–2 VF was defined as the presence of at least 3 contiguous
test points within the same hemifield on the pattern deviation plot at p<0.01, with at least 1
point at p<0.005. The VF tests required reliability indices better than 15%. Patients were
excluded from the study if they had ocular or systemic conditions other than glaucoma known
to affect the VF, inability to perform reliable perimetry, posterior segment intraocular surgery,
or any ocular surgery between the 10–2 VF and Amsler grid tests.
Baseline demographic characteristics were recorded and the Amsler grid test was adminis-
tered for the right eye and then the left eye of enrolled subjects. The procedure for administer-
ing the Amsler grid tests was identical to that used in our previous study [11]. After correcting
for near refractive error, a black-on-white Amsler grid test was administered for each eligible
eye at a distance of 30 cm, the distance at which each box on the grid corresponds to 1 degree
of VF [12]. The same examination room with the same lighting conditions was used for all
patients to standardize testing conditions. An eye patch occluded the eye not being tested, and
the patients were instructed to fixate on the central point of the grid at all times. For those
patients who had difficulty of fixation due to a moderate to severe central VF defect, a grid
with two diagonal lines connecting the corners of the grid was utilized to assist in extrapolating
the central location. Patients were asked to outline any perceived scotomas (areas with abnor-
mal grid lines) on the grid with a pencil and then describe verbally their perception of the sco-
tomas in detail. Each patient was asked the open-ended question: “please describe what you
see.” Examiners asked patients to clarify their descriptions. All descriptions used by patients
were recorded in their own words, which were then sorted into descriptor categories according
to similar themes.
The number of descriptor categories was counted for each eye. If an eye used multiple
descriptors that fit in the same descriptor category, it was considered to have mentioned only 1
category. Next, 10–2 VF mean deviation (MD) was compared among eyes that reported differ-
ent number of descriptor categories, using analysis of variance with post-hoc (Least Significant
Difference) or independent t-test. Finally, mean 10–2 VF MD values were compared among
different descriptor categories using analysis of variance with post-hoc (Least Significant Dif-
ference). Microsoft Office Excel for Windows (Microsoft, Redmond, WA) and SPSS version
20.0 for Windows (SPSS Inc., Chicago, IL) were used for statistical analysis. Tukey’s hinges
percentiles were used for box-and-whisker plots. A p value<0.05 (two-tailed) was considered
significant.
Results
A total of 50 patients with abnormal 10–2 SITA standard VF test on the date of enrollment or
within the previous 3 months were approached and all of them agreed to participate in the
Patient perception of glaucomatous visual field loss
PLOS ONE | https://doi.org/10.1371/journal.pone.0184230 September 26, 2017 3 / 10
Page 4
Amsler grid test. We included 88 eyes of 50 glaucoma patients (mean 10–2 VF MD, -11.75
±8.86 dB; mean age, 67±11 [range, 34 to 89] years; 17 males and 33 females). The remaining 12
eyes had no glaucomatous VF loss on 10–2 SITA standard VF test. It took approximately 3
minutes to perform the Amsler grid test on one eye including outlining perceived scotomas
and describing verbally their perception of the scotomas. Patients’ perception of glaucomatous
VF loss within the central 10 degrees varied considerably. Patients used a total of 44 different
descriptors to explain their perception of scotomas. After reviewing each patient’s descriptions
of his or her perceived scotomas, we classified 40 of the 44 descriptors into categories that
incorporated similar themes together. This resulted in 6 overarching categories: Blurry, Gray,
Missing, White, Black, and Not Aware (Table 1). Some categories contained more descriptors
than others. The remaining 4 descriptors did not fit in the above 6 categories: ‘areas with rip-
ples like raindrops in a puddle,’ ‘clear areas looks like a flashlight,’ ‘something funny or wrong,’
and ‘looks like lines are shiny and reflecting light.’ These 4 descriptors were used by 4 different
subjects, and were always reported alongside one or more of the 40 other descriptors in
Table 1. We believed that these 4 descriptors may be supplementary expansions of the 40
descriptors in Table 1, so they were not used in the analysis.
Amsler grid scotomas (areas with abnormal grid lines) were noted in 71 of 88 eyes (81%)
but absent in 17 eyes (19%; ‘Not Aware’ category). For each of the 71 eyes with Amsler grid
scotomas, one to three descriptor categories were used to describe the perception of its scoto-
mas and the mean number of descriptor categories per eye was 1.59±0.75 (range, 1–3). Eyes
with greater number of descriptor categories had worse VF MD (10–2 VF MD = -21.26±9.37
dB in eyes with three descriptor categories, -13.21±8.06 dB in eyes with two descriptor catego-
ries, and -11.74±7.80 dB in eyes with one descriptor category; p = 0.004 by analysis of variance;
Fig 1A).
In order to analyze which perceptions were more prevalent than others and to determine
how they related to glaucoma severity, eyes were organized into groups according to its combi-
nation of descriptor categories. For instance, an eye with one descriptor in the ‘Blurry’ category
and another descriptor in the ‘Missing’ category would be counted as ‘Blurry+Missing’ to sig-
nal a combination of ‘Blurry’ and ‘Missing’ categories. This eye would not be counted in either
‘Blurry’ or ‘Missing’ category. Based on the 6 descriptor categories in Table 1, each eye natu-
rally sorted into one of the following 15 groups, in frequency order: Not Aware (17 eyes, 19%),
Blurry (11 eyes, 13%), Missing+White (10 eyes, 11%), Missing (10 eyes, 11%), Gray (8 eyes,
9%), White (7 eyes, 8%), Blurry+Gray+Missing (6 eyes, 7%), Black (4 eyes, 5%), Blurry
Table 1. Categorization of verbal responses used by glaucoma patients to describe their visual field
loss.
4 Descriptor
Categories
6 Descriptor
Categories
Words/Phrases Used by Patients to Describe Visual Field
Loss (Descriptors)
Blurry/Gray Blurry blurry, general blurriness, hazy, very hazy, foggy, cloud
covering, smog, faded, watery, less clear, less crisp, not as crisp,
not as sharp, fuzzier than surrounding, not as defined, opaque
glass with some light visible
Gray gray, gray-out, light gray, gray shadow, shadow
Missing/White Missing missing, missing areas, just missing, almost missing, disappears
sometimes, washed-out, not much there, lines are gone, “I know
it is there but I cannot see it”
White white, white-out, a little white, white area, bone white
Black Black more black, black-out, big black blur, dark
Not Aware Not Aware not aware
https://doi.org/10.1371/journal.pone.0184230.t001
Patient perception of glaucomatous visual field loss
PLOS ONE | https://doi.org/10.1371/journal.pone.0184230 September 26, 2017 4 / 10
Page 5
+Missing (4 eyes, 5%), Blurry+Gray+White (2 eyes, 2%), Blurry+Missing+White (2 eyes, 2%),
Gray+Missing (2 eyes, 2%), Blurry+White (2 eyes, 2%), Blurry+Gray (2 eyes, 2%), and Gray+-
Missing+White (1 eye, 1%) (Fig 2A).
Fig 1. Box-and-whisker plots of 10–2 visual field mean deviation (MD) according to the number of descriptor categories per eye (a total of 71
eyes with Amsler grid scotomas). (Left) For 6 descriptor category classification in Table 1, and (Right) for 4 descriptor category classification in
Table 1. The horizontal line within the box indicates the median, upper and lower boundaries of the box indicate the 75th and 25th percentiles,
respectively, and the whiskers indicate the maximum and minimum values. The black squares in the boxes indicate the mean. Asterisks indicate p values
<0.05.
https://doi.org/10.1371/journal.pone.0184230.g001
Fig 2. Number of eyes for each combination of descriptor categories. The number above the bar graphs represents the number of eyes in that
combination (a total of 88 eyes). (Left) For 6 descriptor category classification in Table 1, and (Right) for 4 descriptor category classification in Table 1. A
‘+’ mark represents a combination of descriptor categories. B = Blurry, and G = Gray, M = Missing, W = White.
https://doi.org/10.1371/journal.pone.0184230.g002
Patient perception of glaucomatous visual field loss
PLOS ONE | https://doi.org/10.1371/journal.pone.0184230 September 26, 2017 5 / 10
Page 6
However, with 15 different groups, analyzing and interpreting the data with regard to glau-
coma severity (VF MD) was complex and did not appear to be clinically helpful. Therefore, we
merged descriptor categories that could be combined based on their similarities. For instance,
because the Amsler grid was administered on a white background, ‘Missing’ and ‘White’ could
represent the same phenomena, and thus combined to generate a new category, ‘Missing/
White.’ Likewise, when black grid lines on the Amsler grid become blurry, they may appear
gray, so ‘Blurry’ and ‘Gray’ were consolidated into the same category ‘Blurry/Gray.’ In conse-
quence, the aforementioned 6 descriptor categories were consolidated into 4 new categories:
Missing/White, Blurry/Gray, Black, and Not Aware (Table 1).
In the 71 eyes with Amsler grid scotomas (excluding the 17 eyes in the ‘Not Aware’ cate-
gory), the mean number of new descriptor categories per eye was 1.27±0.45 (range, 1–2). Eyes
that reported two descriptor categories had worse VF MD than those that reported one (10–2
VF MD = -17.86±10.31 dB vs. -12.08±7.53 dB; p = 0.012 by independent t-test; Fig 1B). When
eyes were organized into groups according to their combination of new descriptor categories,
each eye naturally sorted into one of the following 5 groups, in frequency order: Missing/
White (27 eyes; 31%), Blurry/Gray (21 eyes; 24%), combined Missing/White and Blurry/Gray
(19 eyes; 21%), Not Aware (17 eyes; 19%), and Black (4 eyes; 5%) (Fig 2B).
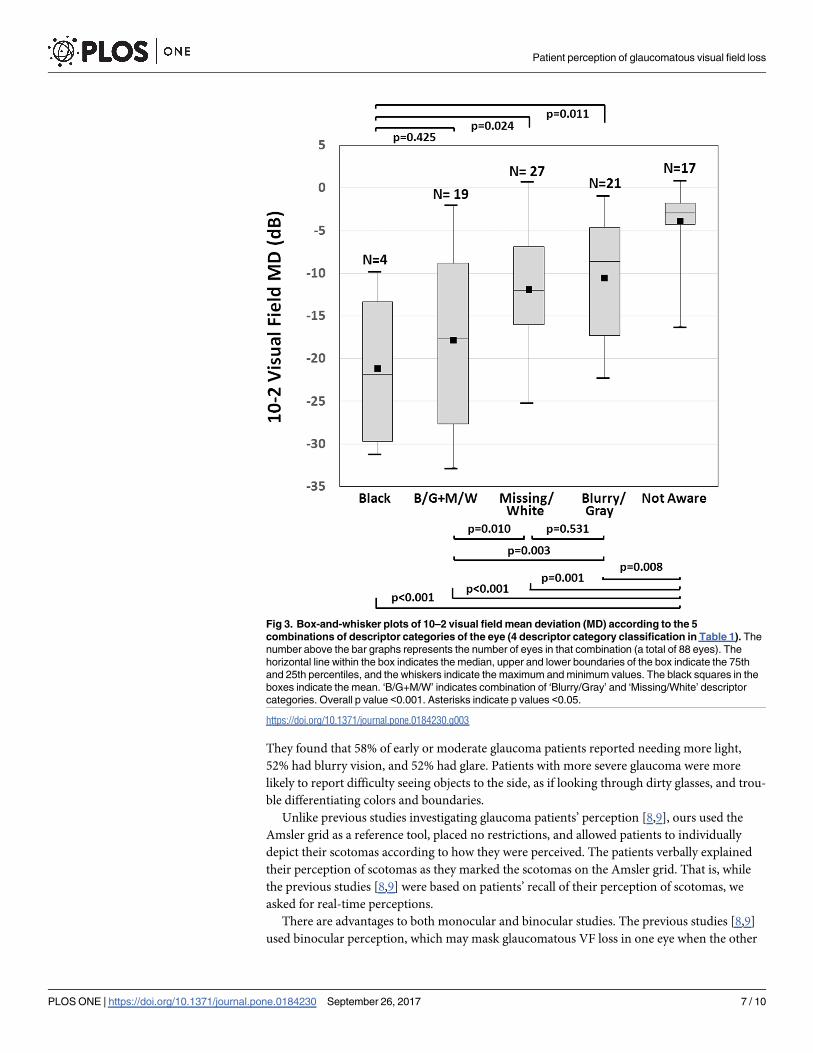
Mean 10–2 VF MD values among the 5 groups were significantly different (p<0.001 by
analysis of variance, Fig 3). The 10–2 VF MD severity order was Black (-21.18±10.59 dB), com-
bined Missing/White and Blurry/Gray (-17.86±10.31 dB), Missing/White (-11.92±6.76 dB),
Blurry/Gray (-10.55±7.03 dB), and Not Aware (-3.91±4.05 dB). The ‘Not Aware’ group had
significantly better 10–2 VF MD than the other groups (all p<0.009, Fig 3). The ‘Black’ group
had significantly worse 10–2 VF MD than the other groups (all p<0.025), except that the dif-
ference between the ‘Black’ group and the ‘combined Missing/White and Blurry/Gray’ group
was not statistically significant (p = 0.425) (Fig 3).
Discussion
In our previous study [11], we showed that the Amsler grid could detect glaucomatous central
VF loss with high specificity (92%) and high positive predictive value (97%). The test’s sensitiv-
ity increased as glaucoma advanced: 40% in eyes with 10–2 VF MD better than -6 dB, 58% in
eyes with 10–2 VF MD between -12 and -6 dB, and 92% in eyes with 10–2 VF MD worse than
-12 dB [11]. This suggests that the Amsler grid may be a simple yet useful tool for evaluating
central VF loss in glaucoma. Using the Amsler grid, the present study shed light on how
patients perceive their glaucomatous VF loss. We demonstrated that patients’ perception of
glaucomatous VF loss within the central 10 degrees varied considerably (Table 1), and that
patients who used a greater variety of terms to describe their scotomas had more advanced
glaucoma (Fig 1). Patients frequently opted for descriptors such as blurry and missing (Fig
2B). Approximately 1 of 5 eyes did not recognize their scotomas and approximately 1 of 20
eyes perceived scotomas as black or dark areas (Fig 2B). In general, patients unaware of their
glaucomatous VF defects had milder glaucoma than others, and those perceiving black or dark
scotomas had more advanced glaucoma than others (Fig 3).
Similar studies have evaluated patients’ perception of glaucomatous VF loss. Crabb et al [8]
recorded interviews and placed patients in a forced-choice experiment in which patients chose
one figure that best represented their glaucoma perception among 6 predetermined figures.
They found glaucoma patients did not perceive their vision loss as either “black patches” or
“black tunnels,” but rather found 54% of patients with “blurred parts,” 26% with “not aware,”
and 16% with “missing parts.” Hu et al [9] administered one questionnaire twice with 25 yes
or no visual symptom questions and 3 open ended questions about vision changes over time.
Patient perception of glaucomatous visual field loss
PLOS ONE | https://doi.org/10.1371/journal.pone.0184230 September 26, 2017 6 / 10
Page 7
They found that 58% of early or moderate glaucoma patients reported needing more light,
52% had blurry vision, and 52% had glare. Patients with more severe glaucoma were more
likely to report difficulty seeing objects to the side, as if looking through dirty glasses, and trou-
ble differentiating colors and boundaries.
Unlike previous studies investigating glaucoma patients’ perception [8,9], ours used the
Amsler grid as a reference tool, placed no restrictions, and allowed patients to individually
depict their scotomas according to how they were perceived. The patients verbally explained
their perception of scotomas as they marked the scotomas on the Amsler grid. That is, while
the previous studies [8,9] were based on patients’ recall of their perception of scotomas, we
asked for real-time perceptions.
There are advantages to both monocular and binocular studies. The previous studies [8,9]
used binocular perception, which may mask glaucomatous VF loss in one eye when the other
Fig 3. Box-and-whisker plots of 10–2 visual field mean deviation (MD) according to the 5
combinations of descriptor categories of the eye (4 descriptor category classification in Table 1). The
number above the bar graphs represents the number of eyes in that combination (a total of 88 eyes). The
horizontal line within the box indicates the median, upper and lower boundaries of the box indicate the 75th
and 25th percentiles, and the whiskers indicate the maximum and minimum values. The black squares in the
boxes indicate the mean. ‘B/G+M/W’ indicates combination of ‘Blurry/Gray’ and ‘Missing/White’ descriptor
categories. Overall p value <0.001. Asterisks indicate p values <0.05.
https://doi.org/10.1371/journal.pone.0184230.g003
Patient perception of glaucomatous visual field loss
PLOS ONE | https://doi.org/10.1371/journal.pone.0184230 September 26, 2017 7 / 10
Page 8
eye is compensating. Because patients use both eyes in their real life, however, the results of
binocular studies can easily be generalized. In the current study, patients’ perceptions were
obtained from each eye to avoid the confounding effect of the fellow eye. However, our results
may be less able to be generalized into real life than the results of binocular studies.
There was a trend for eyes with more descriptor categories to have worse VF MD. That is,
diverse perception problems generally meant more advanced glaucoma. This suggests that an
addition of a new descriptor category could signal glaucoma progression. Therefore, when
glaucoma patients are explaining their VF loss, it may be important for clinicians to notice
whether they use synonyms of an already mentioned descriptor or a new descriptor that fits
into a different category.
Classic glaucoma perception has long been described as a black tunnel or patch [7], but
Crabb et al [8] found that none of the patients chose the two black images in a forced choice
experiment and Hu et al [9] found no patient to report tunnel vision. As reported in these
previous studies [8,9], we found Missing/White and/or Blurry/Gray to be the predominating
perception of glaucomatous VF defects. Therefore, the current depiction of glaucoma as
explained in government and mass public information documents and websites such as the
NIH [7] needs to be updated to reflect the true perception of glaucoma. In our study, 4 of 88
eyes (5%) recognized their scotomas as black or dark. We believe that perception of black still
exists in some patients with advanced glaucoma, albeit uncommonly. The most likely explana-
tion for different results regarding the presence of black perception between our study and the
previous study [8] may lie in methodology. In the previous study [8], glaucoma patients were
told to choose one of six images that best represented their perception of VF loss. Two of the
six images contained black areas but patients’ black perception may not have been depicted
accurately by the two images. The restriction-free methodology using the Amsler grid in our
study may have enabled patients to recognize their black perception.
Consistent with previous studies [8,9], patients who were unaware of their VF loss had sig-
nificantly better 10–2 VF MD values than others. This is probably because patients do not rec-
ognize early glaucomatous VF defects since the brain fills in the defects [6]. Conventional
concept of glaucomatous VF defects hypothesized that patients develop peripheral VF defects
first, which then progress to more central VF defects. This initial development of VF defects in
the periphery has been considered as the reason for patients’ inability to recognize visual dis-
turbances or VF defects until glaucoma advances to later stages. However, based on our results,
glaucomatous VF defects may not be recognized in the early stages of the disease even if they
are present within the central 10 degrees.
Based on Fig 3, 10–2 VF MD tended to worsen in the following order: Not Aware, Blurry/
Gray, Missing/White, combined Blurry/Gray and Missing/White, and Black. Intuitively, loss
of retinal ganglion cells in glaucoma leads to loss of visual perception. Initially, the loss of
visual perception may not be sufficient for the patient to detect, leading to unawareness. With
increasing loss of retinal ganglion cells, the decrease in visual signals reaching brain can be rec-
ognized as Blurry/Gray perception. More loss of retinal ganglion cells may cause deepening of
pre-existing scotomas and create a Missing/White perception. More extensive glaucoma pro-
gression may lead to a combination of Missing/White and Blurry/Gray perception as the
increasing loss of retinal ganglion cells affects a larger area and becomes more concentrated in
some localized areas. In some patients, severe loss of retinal ganglion cells could be recognized
as black or dark, but its mechanism is unclear.
This study is not without limitations. First, the classification of patients’ verbal responses is
subjective, so one could argue that the descriptors could be differentiated into different catego-
ries besides the one we presented. Second, the 4 descriptors that did not fit in the 6 categories
in Table 1 were excluded from analysis (‘areas with ripples like raindrops in a puddle,’ ‘clear
Patient perception of glaucomatous visual field loss
PLOS ONE | https://doi.org/10.1371/journal.pone.0184230 September 26, 2017 8 / 10
Page 9
areas looks like a flashlight,’ ‘something funny or wrong,’ and ‘looks like lines are shiny and
reflecting light’). We believed that these 4 descriptors may be supplementary expansions of the
40 descriptors in Table 1, but we cannot rule out the possibility of another descriptor category
that only a small subset of glaucoma patients perceive. Third, our results depend on the use
of Amsler grid. The glaucoma severity tendency of Black> ‘combined Missing/White and
Blurry/Gray’ > Missing/White > Blurry/Gray > Not Aware may not change, but the propor-
tion of eyes in each descriptor category is subject to change depending on the type of test
administered. Fourth, the Amsler grid test was administered for the right eye and then the left
eye of enrolled subjects. The responses for the first eye tested could influence those for the sec-
ond eye, which could introduce a bias. Finally, part of our results obtained from the two eyes
of the same patient may be correlated, because a patient may use similar descriptions for his or
her VF defects in both eyes. However, it was difficult to perform a statistical adjustment to
account for this correlation appropriately because most patients have a different severity of VF
defects in one eye from the other. It should be noted that our p values are likely overestimated
due to this correlation [13].
In conclusion, patient perception of glaucomatous VF loss within the central 10 degrees
varied considerably. Based on our results, predominant perception of glaucoma patients is
Blurry/Gray and/or Missing/White areas, differing from the traditional concept. This result
will be helpful for clinicians to explain whether patients’ visual symptoms are related to glau-
coma or other conditions. Patients who used a greater variety of terms to describe their sco-
tomas had more advanced glaucoma, and patients’ perception of scotomas was related to
glaucoma severity. Healthcare providers should explain glaucoma perception correctly, so that
patients can be more aware of what to expect for development or progression of glaucoma.
When glaucoma patients are explaining their VF defects, it is important for clinicians to notice
whether they are saying synonyms of an already mentioned descriptor or a new descriptor that
fits into a different category. Amsler grid test can provide patients an opportunity to under-
stand the impact of their glaucomatous VF loss, and this may improve their adherence to med-
ications. Future research could determine if any associations exist between patient perception
and VF defect extent, depth, or location.
Supporting information
S1 File. Data underlying the findings described in the manuscript.
(XLSX)
Author Contributions
Conceptualization: Kenji Fujitani, Daniel Su, Joseph L. Simonson, Sung Chul Park.
Data curation: Kenji Fujitani, Daniel Su, Joseph L. Simonson, Sung Chul Park.
Formal analysis: Kenji Fujitani, Daniel Su, Mark P. Ghassibi, Joseph L. Simonson, Sung Chul
Park.
Funding acquisition: Jeffrey M. Liebmann, Robert Ritch.
Investigation: Kenji Fujitani, Daniel Su, Mark P. Ghassibi, Joseph L. Simonson, Sung Chul
Park.
Methodology: Kenji Fujitani, Daniel Su, Mark P. Ghassibi, Sung Chul Park.
Project administration: Sung Chul Park.
Resources: Jeffrey M. Liebmann, Robert Ritch, Sung Chul Park.
Patient perception of glaucomatous visual field loss
PLOS ONE | https://doi.org/10.1371/journal.pone.0184230 September 26, 2017 9 / 10
Page 10
Software: Sung Chul Park.
Supervision: Jeffrey M. Liebmann, Robert Ritch, Sung Chul Park.
Validation: Kenji Fujitani, Jeffrey M. Liebmann, Robert Ritch, Sung Chul Park.
Visualization: Kenji Fujitani, Sung Chul Park.
Writing – original draft: Kenji Fujitani, Sung Chul Park.
Writing – review & editing: Kenji Fujitani, Jeffrey M. Liebmann, Robert Ritch, Sung Chul
Park.
References1. Pascolini D, Mariotti SP. Global estimates of visual impairment: 2010. Br J Ophthalmol. 2012; 96
(5):614–618. https://doi.org/10.1136/bjophthalmol-2011-300539 PMID: 22133988
2. Quigley HA, Broman AT. The number of people with glaucoma worldwide in 2010 and 2020. Br J
Ophthalmol. 2006; 90(3):262–267. https://doi.org/10.1136/bjo.2005.081224 PMID: 16488940
3. Kim J, Dally LG, Ederer F, Gaasterland DE, VanVeldhuisen PC, Blackwell B, et al. The Advanced Glau-
coma Intervention Study (AGIS): 14. Distinguishing progression of glaucoma from visual field fluctua-
tions. Ophthalmology. 2004; 111(11):2109–2116. https://doi.org/10.1016/j.ophtha.2004.06.029 PMID:
15522379
4. Nouri-Mahdavi K, Hoffman D, Ralli M, Caprioli J. Comparison of methods to predict visual field progres-
sion in glaucoma. Arch Ophthalmol. 2007; 125(9):1176–1181. https://doi.org/10.1001/archopht.125.9.
1176 PMID: 17846355
5. Sakata LM, DeLeon-Ortega J, Girkin CA. Selective perimetry in glaucoma diagnosis. Curr Opin
Ophthalmol. 2007; 18(2):115–121. https://doi.org/10.1097/ICU.0b013e3280555096 PMID: 17301612
6. Hoste AM. New insights into the subjective perception of visual field defects. Bull Soc Belge Ophtalmol.
2003;( 287):65–71.
7. Facts About Glaucoma. National Eye Institute/National Institute of Health. Available from: https://nei.
nih.gov/health/glaucoma/glaucoma_facts. Accessed April 2, 2017.
8. Crabb DP, Smith ND, Glen FC, Burton R, Garway-Heath DF. How does glaucoma look?: patient per-
ception of visual field loss. Ophthalmology. 2013; 120(6):1120–1126. https://doi.org/10.1016/j.ophtha.
2012.11.043 PMID: 23415421
9. Hu CX, Zangalli C, Hsieh M, Gupta L, Williams AL, Richman J, et al. What Do Patients With Glaucoma
See? Visual Symptoms Reported by Patients With Glaucoma. Am J Med Sci. 2014; 348(5):403–409.
https://doi.org/10.1097/MAJ.0000000000000319 PMID: 24992392
10. Friedman DS, Hahn SR, Gelb L, Tan J, Shah SN, Kim EE, et al. Doctor-patient communication, health-
related beliefs, and adherence in glaucoma: results from the Glaucoma Adherence and Persistency
Study. Ophthalmology. 2008; 115(8):1320–1327. https://doi.org/10.1016/j.ophtha.2007.11.023 PMID:
18321582
11. Su D, Greenberg A, Simonson JL, Teng CC, Liebmann JM, Ritch R, et al. Efficacy of the Amsler grid
test in evaluating glaucomatous central visual field defects. Ophthalmology. 2016; 123(4):737–743.
https://doi.org/10.1016/j.ophtha.2015.12.003 PMID: 26783097
12. Amsler M. Earliest symptoms of diseases of the macula. Br J Ophthalmol. 1953; 37(9):521–537. PMID:
13081950
13. Sainani K. The importance of accounting for correlated observations. PM R. 2010; 2(9):858–861.
https://doi.org/10.1016/j.pmrj.2010.07.482 PMID: 20869686
Patient perception of glaucomatous visual field loss
PLOS ONE | https://doi.org/10.1371/journal.pone.0184230 September 26, 2017 10 / 10