Author version of paper published as: Dawes, Les, Goonetilleke, Ashantha and Cox, Malcolm (2006) Assessment of physical and chemical properties of sub-tropical soil to predict long term effluent treatment potential. Soil and Sediment Contamination 14(3): pp. 211-230 Copyright 2005 Taylor and Francis Journals ASSESSMENT OF PHYSICAL AND CHEMICAL PROPERTIES OF SUB-TROPICAL SOIL TO PREDICT LONG TERM EFFLUENT TREATMENT POTENTIAL LES DAWES a , ASHANTHA GOONETILLEKE a AND MALCOLM COX b a School of Civil Engineering, b School of Natural Resource Sciences Queensland University of Technology 1
Transcript
Author version of paper published as: Dawes, Les, Goonetilleke, Ashantha and Cox, Malcolm (2006) Assessment of physical and chemical properties of sub-tropical soil to predict long term effluent treatment potential. Soil and Sediment Contamination 14(3): pp. 211-230 Copyright 2005 Taylor and Francis Journals
ASSESSMENT OF PHYSICAL AND CHEMICAL PROPERTIES OF SUB-TROPICAL SOIL TO PREDICT LONG TERM EFFLUENT
TREATMENT POTENTIAL
LES DAWESa, ASHANTHA GOONETILLEKEa AND MALCOLM COXb
aSchool of Civil Engineering, bSchool of Natural Resource Sciences Queensland University of Technology
1
Abstract
On-site wastewater treatment systems aim to assimilate domestic effluent into the
environment. Unfortunately failure of such systems is common and inadequate
effluent treatment can have serious environmental implications. A research project
was undertaken to determine the role of physical and chemical soil properties in the
treatment performance of subsurface effluent disposal areas. Monitoring changes in
these properties permit improved prediction of the treatment potential of a soil. The
changes within soil properties of the disposal area due to effluent application were
found to be directly related to the subsurface drainage characteristics including
permeability, clay content and clay type. The major controlling soil physical and
chemical attributes were found to be moderate drainage, significant soil cation
exchange capacity and dominance of exchangeable Ca or exchangeable Mg over
exchangeable Na, low exchangeable Na, clay type and a minimum depth of 0.4m of
potential unsaturated soil before encountering a restrictive horizon. The study
confirmed that both the physical properties and chemistry of the soil can be valuable
predictive tools for evaluating the long term operation of sewage effluent disposal
Introduction Approximately 13% of the Australian population, or more than two million people,
are not serviced by reticulated sewerage facilities (Whitehead and Geary 2000) and
rely wholly on on-site systems for the treatment and disposal of domestic
wastewater. In the United States, this percentage is over 25% (Siegrist 2001). Septic
tanks are by far the most common form of on-site wastewater treatment and the
associated sub-surface effluent disposal area is a crucial part of the treatment train.
The efficiency of this disposal area and the adjoining buffer zones are essential to
prevent the contamination of surface and groundwater resources by sewage effluent.
This is especially of concern in areas where there is a high density of such systems.
Despite the seemingly low technology of septic systems, failure is common. In many
cases, this can lead to adverse public health and environmental impacts (DeWalle
and Schaff 1980, Scandura and Sobsey 1997, DeBorde et al 1998, Paul et al 2000,
Lipp et al 2001). A primary factor that contributes to failure is the inadequate
consideration of site and soil characteristics in the design of the sub-surface effluent
disposal area (Martens and Geary 1999, Siegrist et al 2000, Whitehead and Geary
2000).
On-site domestic wastewater treatment systems have traditionally relied on soil
properties to remove contaminants as effluent percolates through the soil. Soil can be
an excellent treatment medium provided the duration of effluent/soil contact is
sufficient. However, the ability of the soil to purify effluent is not completely
understood. The capacity of a particular soil to treat wastewater will change over
time. The physical properties influence the rate of effluent movement through the
soil and its chemical properties dictate the ability to renovate effluent. Numerous
researchers (for example Brouwer and Bugeja 1983, Schipper et al 1996, Whitehead
and Geary 2000, Siegrist 2001, Van Cuyk et al 2001) have noted the current lack of
in-depth knowledge of the processes taking place within the soil matrix. These
studies have been carried out on soils from colder climates than the subtropical soils
found in Queensland.
3
Very few studies have been carried out in sub-tropical soils. Carroll et al (2004) in a
study on subtropical soils in Gold Coast, Queensland found that Ferrosol and
Dermosol soils provided the most evidence of suitability for locating on-site systems
due to their high renovation capability. This relates to their high cation exchange
capacity values and clay content providing greater cation exchange and therefore
contaminant adsorption characteristics. Khalil et al (2004) found that a high cation
exchange capacity can enhance the renovation of sewage effluent. These studies
presented detailed soil characteristics on control soils. This paper presents the
outcomes of research at established subsurface effluent disposal systems undertaken
to identify the influential sub-tropical soil properties and their use as predictive tools
for evaluating the effective long-term operation of sewage effluent disposal systems.
Materials and Methods
Research Project
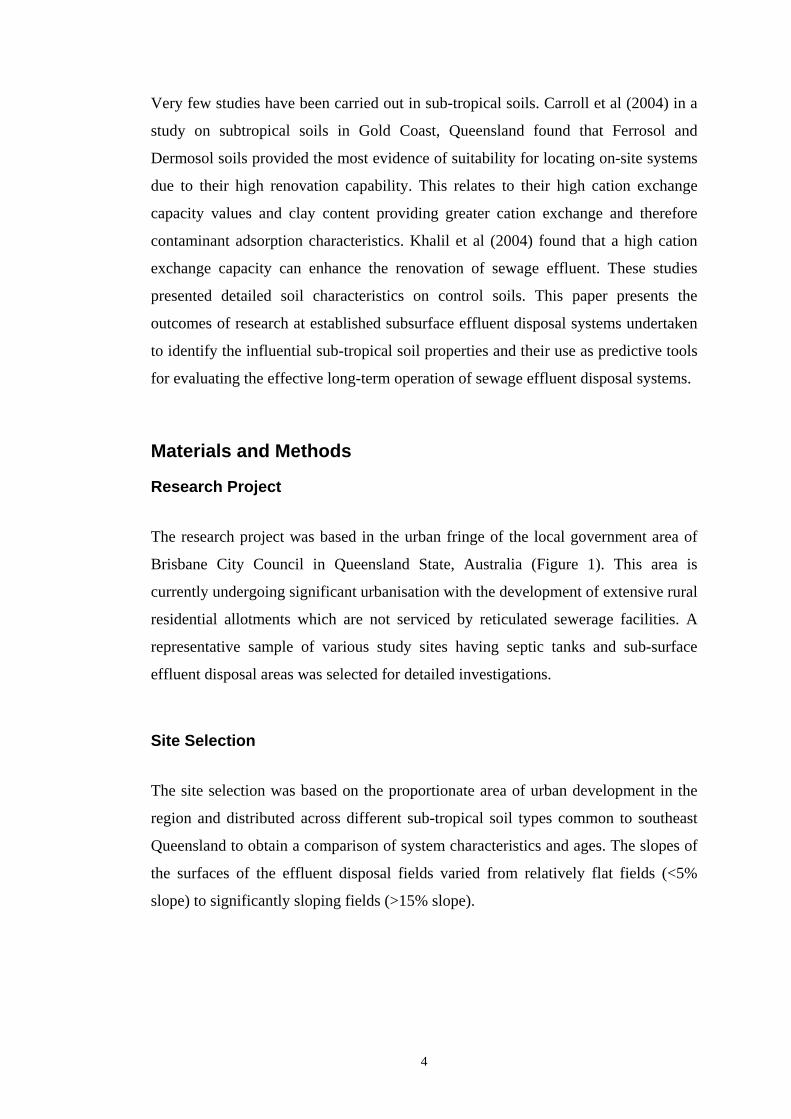
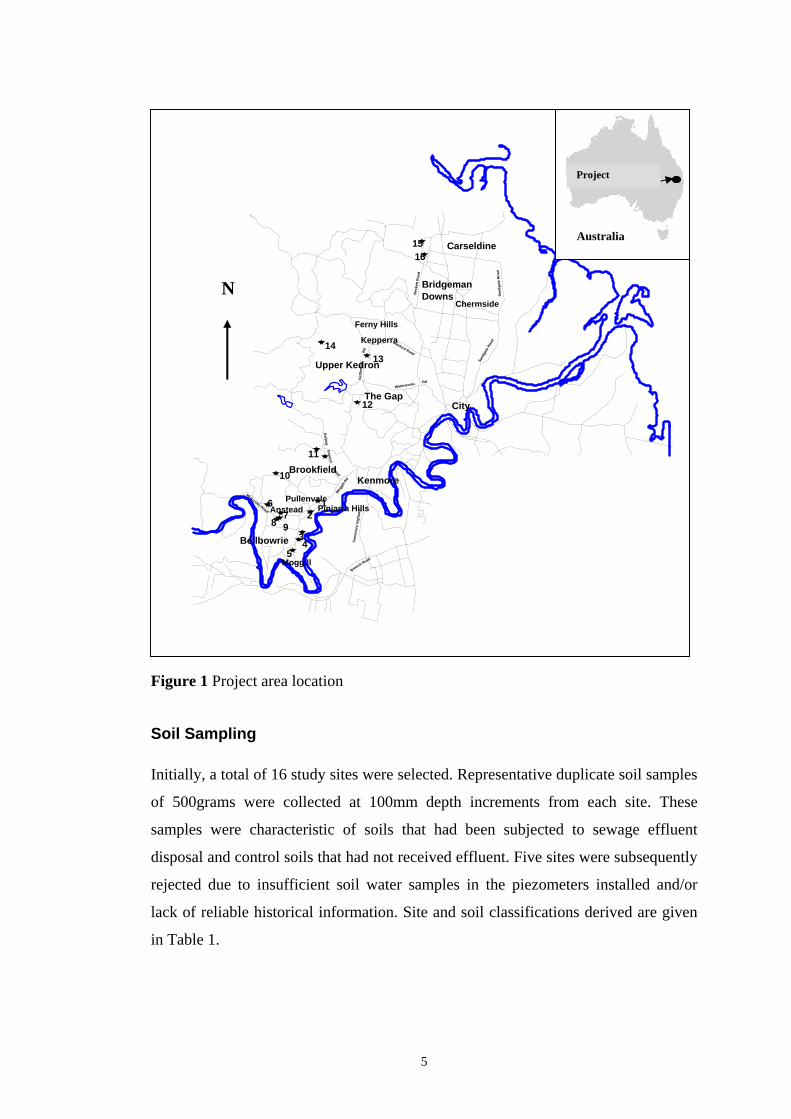
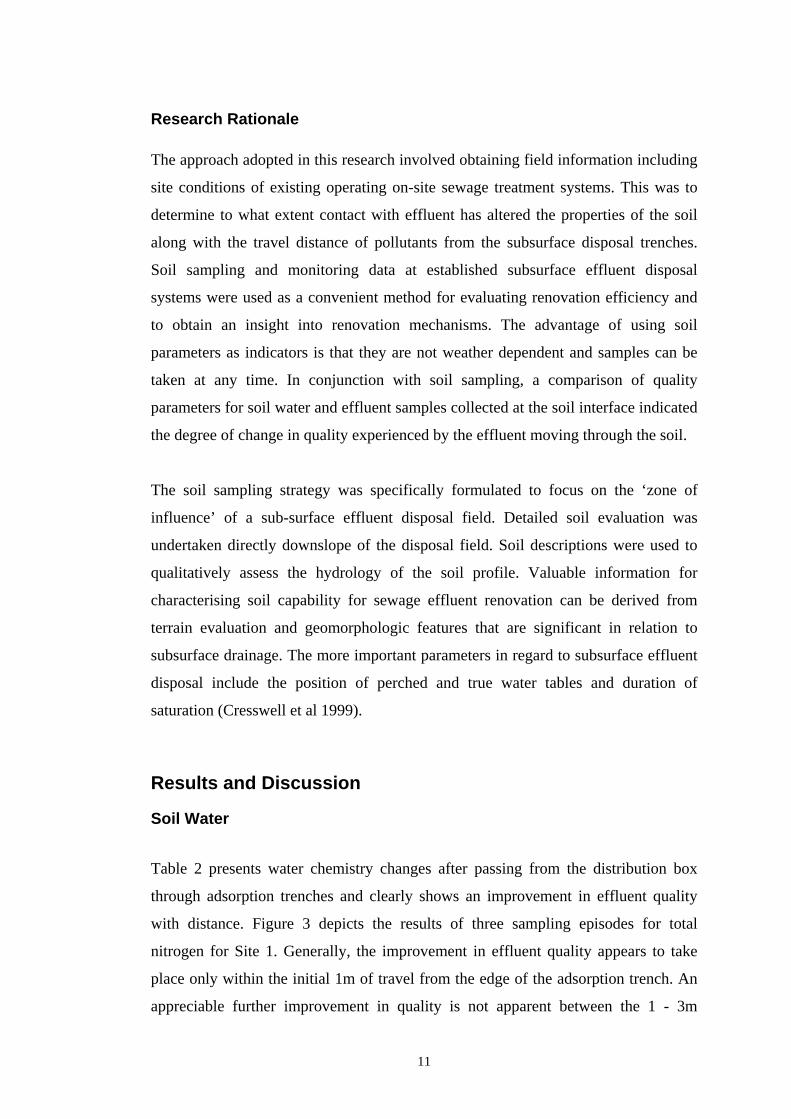
The research project was based in the urban fringe of the local government area of
Brisbane City Council in Queensland State, Australia (Figure 1). This area is
currently undergoing significant urbanisation with the development of extensive rural
residential allotments which are not serviced by reticulated sewerage facilities. A
representative sample of various study sites having septic tanks and sub-surface
effluent disposal areas was selected for detailed investigations.
Site Selection
The site selection was based on the proportionate area of urban development in the
region and distributed across different sub-tropical soil types common to southeast
Queensland to obtain a comparison of system characteristics and ages. The slopes of
the surfaces of the effluent disposal fields varied from relatively flat fields (<5%
slope) to significantly sloping fields (>15% slope).
4
8
1Anstead
Bellbowrie
Moggill
PullenvalePinjarra Hills
KenmoreBrookfield
11
3
The Gap
Upper Kedron
Kepperra
Ferny Hills
14
City
Chermside
Bridgeman Downs
Carseldine16
Cen
tena
ry H
ighw
ay
Moggi
ll Rd
Mt Crosby Road
Ipswich Road
Rafting
Ground
Road
Waterworks Rd
Settl
emen
t Rd
Samford Road
Bec
kett
Roa
d
Sand
gate
Roa
d
Sand
gate
Roa
d
∗
97
45
12
13
15
26
10
Project
N
Australia
Figure 1 Project area location
Soil Sampling Initially, a total of 16 study sites were selected. Representative duplicate soil samples
of 500grams were collected at 100mm depth increments from each site. These
samples were characteristic of soils that had been subjected to sewage effluent
disposal and control soils that had not received effluent. Five sites were subsequently
rejected due to insufficient soil water samples in the piezometers installed and/or
lack of reliable historical information. Site and soil classifications derived are given
in Table 1.
5
Table 1 Sewage effluent disposal area soil classification Site No. System
age (yr) Australian Soil Classificationa
Soil Textureb
A – A horizon B – B horizon
Soil Drainagec
Slope (deg.)
A – Sandy loam 1 4 Red Chromosol B – Clay loam Moderately well drained
>15
2d 8 Red Chromosol Sandy clay loam Moderately well drained >10
A - Sandy loam 3 5 Brown Chromosol B – Light Clay Imperfectly drained
<10
A - Sandy loam 4 3 Brown Chromosol B- Clay loam Imperfectly drained
<5
5d 1 Brown Chromosol Sandy clay loam Imperfectly drained <5
6d 11 Red Dermosol Sandy clay Poorly drained <5
A - Sandy loam 7 2.5 Red Chromosol B – Sandy clay loam Moderately well drained
>10
A - Clay loam 8 4 Red Sodosol B – Heavy clay Poorly drained
<5
A – Clay loam 9 17 Grey Sodosol B – Heavy clay Poorly drained
<5
10d 14 Red Kandosol Sandy loam Moderately well drained >10
A - Sandy loam 11 4.5 Red Kandosol B – Sandy clay loam Well drained
>15
A -Loamy sand 12 19 Brown Kurosol B – Sandy clay loam Moderately well drained
>10
13d 16 Brown Kurosol Loamy sand Imperfectly drained <10
A - Loam 14 14 Brown Chromosol B – Medium clay Moderately well drained
>15
A - Sandy loam 15 3 Red Ferrosol B- Light clay Moderately well drained
>5
A - Clay loam 16 4 Red Ferrosol B- Medium clay Poorly drained
<5
a Australian Soil Classification after Isbell (1996) b soil texture based on McDonald et al. (1998) c the classification used complies with AS/NZS 1547:2000 (Standards Australia, 2000), McDonald et al. (1998). d sites abandoned due to insufficient soil water sample and unreliable historical site information
Initial soil samples collected by hand auger were classified, noting features such as
parent material and profile description. Undisturbed soil core samples were also
collected from each site to characterise the permeability of each soil using laboratory
methods. Soil profile descriptions including colour, texture, structure and biological
activity were recorded in depth increments of 100mm as described by McDonald et
al (1998). The dominant soils were Red and Brown Chromosols, which generally
exhibit a strong texture and contrast between the A and B horizons (Isbell 1996).
Site conditions such as topography, slope and drainage characteristics were described
in detail at the soil sampling points. In-situ drainage information that was collected
included the presence of preferential flow paths and redoximorphic features.
Laboratory testing included hydraulic conductivity using methods described in
AS/NZS 1547:2000. Additionally, in-situ information on water table depth, presence
of effluent flows, depth of soil horizons and depth to the impermeable soil layer were
6
recorded. This information was utilised in establishing boundary failures based on
USEPA On-site Wastewater Treatment Manual (2002), Section 5.8. The position of
each site within a landscape pattern or catena was identified as described by White
(1997).
Analytical Program Soil The soil samples were air dried within 24 hours of collection. Each sample was then
ground to pass a 2mm sieve and sub-sampled for the following tests: (i) Electrical
Conductivity (EC) and pH in a 1:5 soil:water suspension; (ii) Exchangeable cations
were measured using displacement with NH4Cl and analysed by Inductively Coupled
Plasma (ICP-ES); Methods described in Australian Laboratory Handbook of Soil and
Water Chemical Methods, Rayment and Higginson (1992) and (iii) Soil particle
fractions. The sand size particle sizes were determined by sieve analysis and the silt
and clay contents were measured by hydrometer analysis.
Parameters such as exchangeable sodium percentage (ESP), Ca:Mg ratio, cation
exchange capacity (CEC) or effective cation exchange capacity (ECEC) and Sodium
Adsorption Ratio (SAR) were derived from the data obtained. In the case of acidic
soils which cover a significant area of South East Queensland, it is ECEC that is
relevant where the summation also includes exchangeable acidity (Peverill et al
1999). Particle size analysis was measured by hydrometer analysis including sample
pre-treatment for removal of organic matter where necessary. The type of clay was
interpreted using published values of CEC and clay activity ratio (CCR = CEC/clay
%) (Shaw et al 1997) and random samples were validated using X-Ray Diffraction.
Soil Water Sampling Before selecting the final location of piezometers, a thorough site investigation using
a dynamic cone penetrometer was undertaken. This helped to locate where the
effluent was flowing in the soil subsurface and generally allowed the use of only two
piezometers downslope of the trenches as well as maximising sample collection.
Depths of trenches were measured with a dynamic cone penetrometer, with all
trenches being between 300 and 400mm deep. Soil water samples were collected
7
from the piezometers installed 1 and 3m downslope from the edge of the subsurface
effluent disposal area (i.e. the adsorption trenches) to establish the effluent treatment
capacity of the different soil types. The chemical results were compared with the
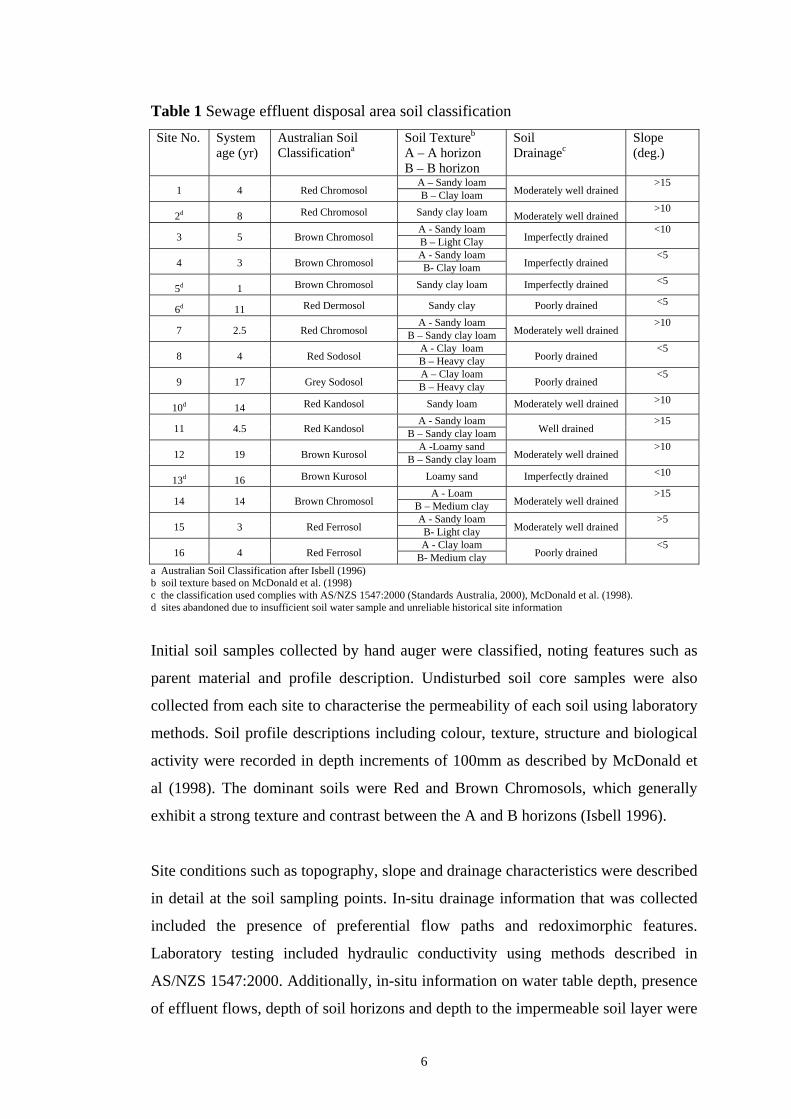
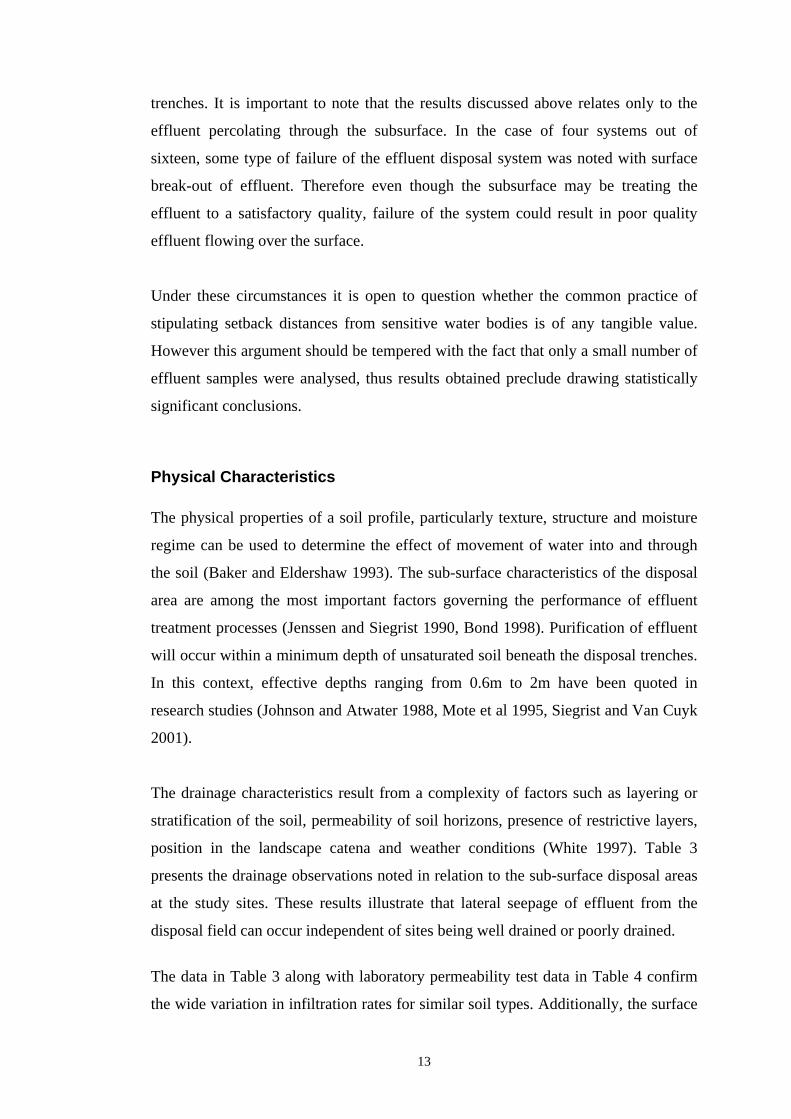
chemistry of the distribution box water samples. A typical piezometer installation is
shown in Figure 2. The piezometers were installed to a maximum depth of 1.5m or to
a clay layer of low permeability. Piezometers were purged using a converted hand
bailer before sampling commenced. Three to four separate sampling episodes took
place from July through to October, 1999. Comparison with meteorological records
confirmed that the 150mm clay plug at the top of each piezometer allowed only
minor seepage from rainfall through the soil profile.
150 mmclay plug
100 mm
Clay
Gravel (2mm)
Geofabric (Bidum A12)
90 mm dia.Slotted PVCtubing
Cap
Gravelin-fill
Cap
Figure 2 A typical piezometer installation
Analytical Program Soil Water Standard wastewater analysis for pH, Electrical Conductivity (EC), Total Nitrogen
(APHA-4500), Total Organic Carbon (Combustion-Infrared Method 5310D.
Rosemount Dohrmann TOC Analyser DC190) and Faecal Coliforms (Membrane
Filtration Method 9222D) were performed according to the methods described in
APHA (1995). Water soluble cations calcium (Ca), magnesium (Mg) and sodium
(Na) ion concentrations were measured using inductively coupled plasma (ICP)
spectroscopy. pH and EC are useful surrogates for evaluating the chemical quality of
8
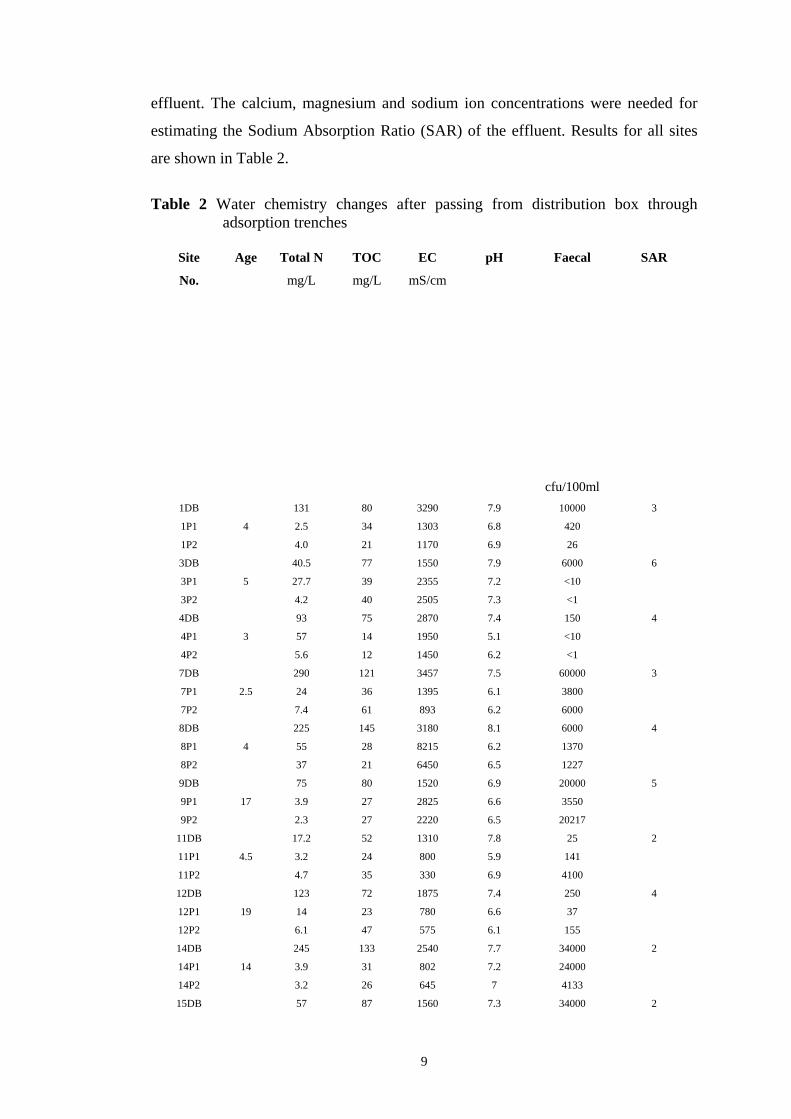
effluent. The calcium, magnesium and sodium ion concentrations were needed for
estimating the Sodium Absorption Ratio (SAR) of the effluent. Results for all sites
are shown in Table 2.
Table 2 Water chemistry changes after passing from distribution box through
adsorption trenches
Site
No.
Age Total N
mg/L
TOC
mg/L
EC
mS/cm
pH Faecal
cfu/100ml
SAR
1DB 131 80 3290 7.9 10000 3
1P1 2.5 34 1303 6.8 420
1P2
4
4.0 21 1170 6.9 26
3DB 40.5 77 1550 7.9 6000 6
3P1 27.7 39 2355 7.2 <10
3P2
5
4.2 40 2505 7.3 <1
4DB 93 75 2870 7.4 150 4
4P1 57 14 1950 5.1 <10
4P2
3
5.6 12 1450 6.2 <1
7DB 290 121 3457 7.5 60000 3
7P1 24 36 1395 6.1 3800
7P2
2.5
7.4 61 893 6.2 6000
8DB 225 145 3180 8.1 6000 4
8P1 55 28 8215 6.2 1370
8P2
4
37 21 6450 6.5 1227
9DB 75 80 1520 6.9 20000 5
9P1 3.9 27 2825 6.6 3550
9P2
17
2.3 27 2220 6.5 20217
11DB 17.2 52 1310 7.8 25 2
11P1 3.2 24 800 5.9 141
11P2
4.5
4.7 35 330 6.9 4100
12DB 123 72 1875 7.4 250 4
12P1 14 23 780 6.6 37
12P2
19
6.1 47 575 6.1 155
14DB 245 133 2540 7.7 34000 2
14P1 3.9 31 802 7.2 24000
14P2
14
3.2 26 645 7 4133
15DB 57 87 1560 7.3 34000 2
9
15P1 31 7 900 5.5 15
15P2
3
26 6 1029 5.7 14
16DB 190 113 3443 7.1 34000 8
16P1 26 20 1837 5.9 1879
16P2
4
4.4 6.7 1468 5.3 570
Composite sampling average of 3 separate sampling episodes DB – Distribution Box prior to flowing through trenches P1,P2 – Piezometers in direction of effluent flow, 1m and 3m from edge of trenches
10
Research Rationale The approach adopted in this research involved obtaining field information including
site conditions of existing operating on-site sewage treatment systems. This was to
determine to what extent contact with effluent has altered the properties of the soil
along with the travel distance of pollutants from the subsurface disposal trenches.
Soil sampling and monitoring data at established subsurface effluent disposal
systems were used as a convenient method for evaluating renovation efficiency and
to obtain an insight into renovation mechanisms. The advantage of using soil
parameters as indicators is that they are not weather dependent and samples can be
taken at any time. In conjunction with soil sampling, a comparison of quality
parameters for soil water and effluent samples collected at the soil interface indicated
the degree of change in quality experienced by the effluent moving through the soil.
The soil sampling strategy was specifically formulated to focus on the ‘zone of
influence’ of a sub-surface effluent disposal field. Detailed soil evaluation was
undertaken directly downslope of the disposal field. Soil descriptions were used to
qualitatively assess the hydrology of the soil profile. Valuable information for
characterising soil capability for sewage effluent renovation can be derived from
terrain evaluation and geomorphologic features that are significant in relation to
subsurface drainage. The more important parameters in regard to subsurface effluent
disposal include the position of perched and true water tables and duration of
saturation (Cresswell et al 1999).
Results and Discussion
Soil Water
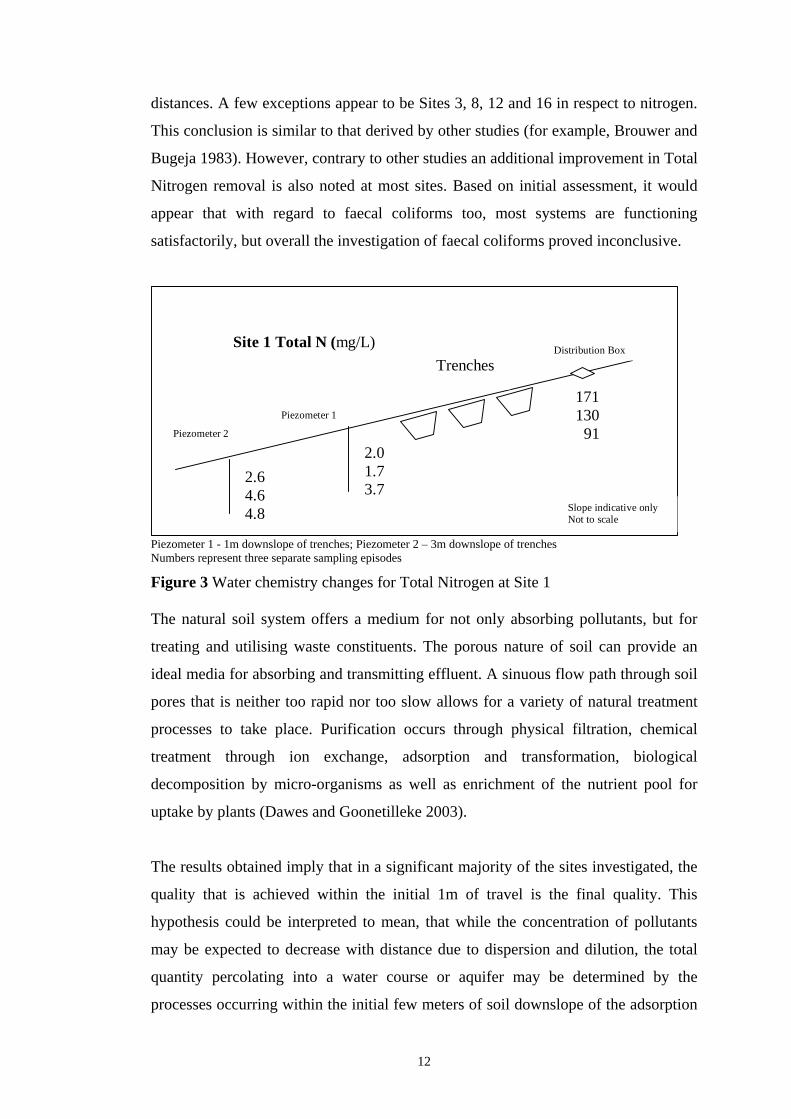
Table 2 presents water chemistry changes after passing from the distribution box
through adsorption trenches and clearly shows an improvement in effluent quality
with distance. Figure 3 depicts the results of three sampling episodes for total
nitrogen for Site 1. Generally, the improvement in effluent quality appears to take
place only within the initial 1m of travel from the edge of the adsorption trench. An
appreciable further improvement in quality is not apparent between the 1 - 3m
11
distances. A few exceptions appear to be Sites 3, 8, 12 and 16 in respect to nitrogen.
This conclusion is similar to that derived by other studies (for example, Brouwer and
Bugeja 1983). However, contrary to other studies an additional improvement in Total
Nitrogen removal is also noted at most sites. Based on initial assessment, it would
appear that with regard to faecal coliforms too, most systems are functioning
satisfactorily, but overall the investigation of faecal coliforms proved inconclusive.
Trenches Distribution Box
Piezometer 1 171 130 91
Site 1 Total N (mg/L)
2.0 1.7 3.7
2.6 4.6 4.8
Piezometer 2
Slope indicative only Not to scale
Piezometer 1 - 1m downslope of trenches; Piezometer 2 – 3m downslope of trenches Numbers represent three separate sampling episodes
Figure 3 Water chemistry changes for Total Nitrogen at Site 1 The natural soil system offers a medium for not only absorbing pollutants, but for
treating and utilising waste constituents. The porous nature of soil can provide an
ideal media for absorbing and transmitting effluent. A sinuous flow path through soil
pores that is neither too rapid nor too slow allows for a variety of natural treatment
processes to take place. Purification occurs through physical filtration, chemical
treatment through ion exchange, adsorption and transformation, biological
decomposition by micro-organisms as well as enrichment of the nutrient pool for
uptake by plants (Dawes and Goonetilleke 2003).
The results obtained imply that in a significant majority of the sites investigated, the
quality that is achieved within the initial 1m of travel is the final quality. This
hypothesis could be interpreted to mean, that while the concentration of pollutants
may be expected to decrease with distance due to dispersion and dilution, the total
quantity percolating into a water course or aquifer may be determined by the
processes occurring within the initial few meters of soil downslope of the adsorption
12
trenches. It is important to note that the results discussed above relates only to the
effluent percolating through the subsurface. In the case of four systems out of
sixteen, some type of failure of the effluent disposal system was noted with surface
break-out of effluent. Therefore even though the subsurface may be treating the
effluent to a satisfactory quality, failure of the system could result in poor quality
effluent flowing over the surface.
Under these circumstances it is open to question whether the common practice of
stipulating setback distances from sensitive water bodies is of any tangible value.
However this argument should be tempered with the fact that only a small number of
effluent samples were analysed, thus results obtained preclude drawing statistically
significant conclusions.
Physical Characteristics The physical properties of a soil profile, particularly texture, structure and moisture
regime can be used to determine the effect of movement of water into and through
the soil (Baker and Eldershaw 1993). The sub-surface characteristics of the disposal
area are among the most important factors governing the performance of effluent
treatment processes (Jenssen and Siegrist 1990, Bond 1998). Purification of effluent
will occur within a minimum depth of unsaturated soil beneath the disposal trenches.
In this context, effective depths ranging from 0.6m to 2m have been quoted in
research studies (Johnson and Atwater 1988, Mote et al 1995, Siegrist and Van Cuyk
2001).
The drainage characteristics result from a complexity of factors such as layering or
stratification of the soil, permeability of soil horizons, presence of restrictive layers,
position in the landscape catena and weather conditions (White 1997). Table 3
presents the drainage observations noted in relation to the sub-surface disposal areas
at the study sites. These results illustrate that lateral seepage of effluent from the
disposal field can occur independent of sites being well drained or poorly drained.
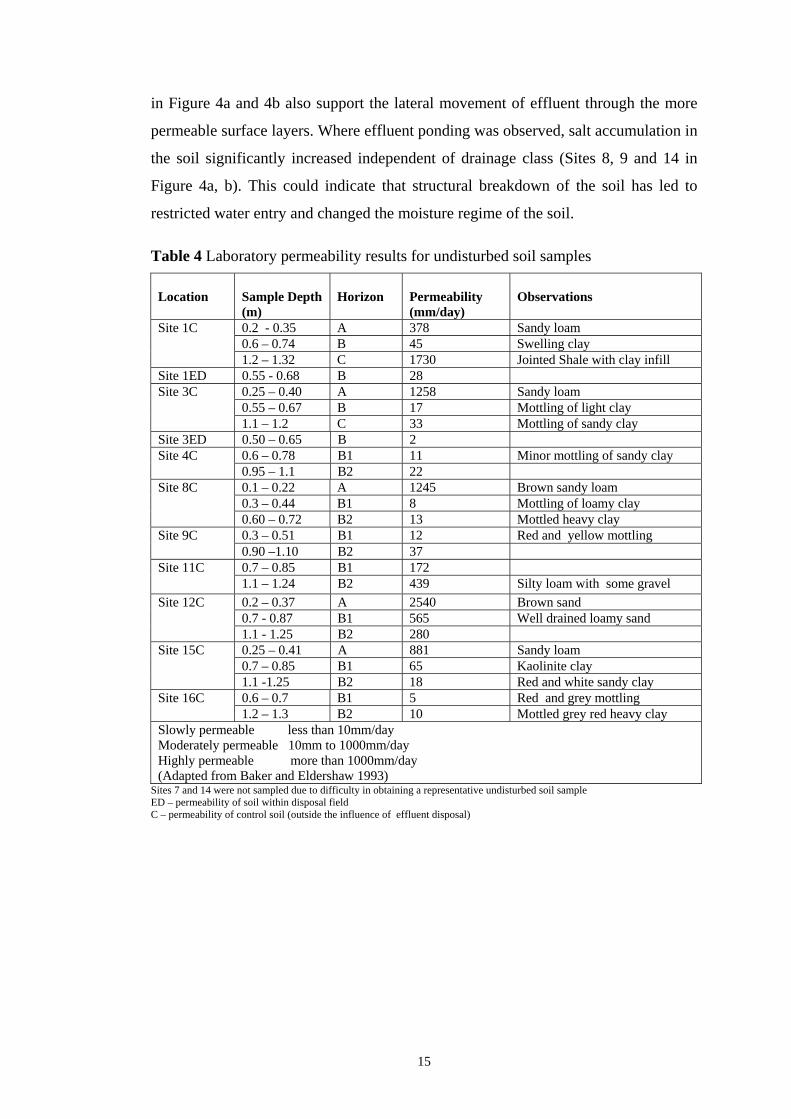
The data in Table 3 along with laboratory permeability test data in Table 4 confirm
the wide variation in infiltration rates for similar soil types. Additionally, the surface
13
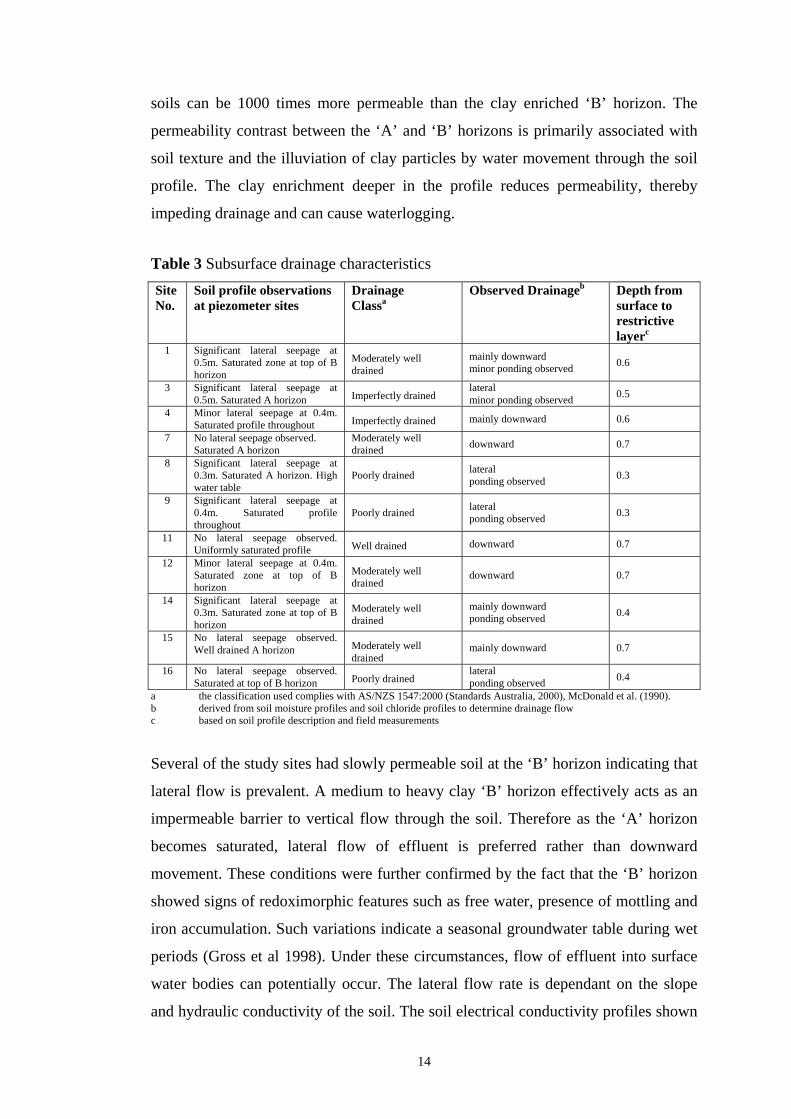
soils can be 1000 times more permeable than the clay enriched ‘B’ horizon. The
permeability contrast between the ‘A’ and ‘B’ horizons is primarily associated with
soil texture and the illuviation of clay particles by water movement through the soil
profile. The clay enrichment deeper in the profile reduces permeability, thereby
impeding drainage and can cause waterlogging.
Table 3 Subsurface drainage characteristics Site No.
Soil profile observations at piezometer sites
Drainage Classa
Observed Drainageb Depth from surface to restrictive layerc
1 Significant lateral seepage at 0.5m. Saturated zone at top of B horizon
Moderately well drained
mainly downward minor ponding observed 0.6
3 Significant lateral seepage at 0.5m. Saturated A horizon Imperfectly drained
lateral minor ponding observed 0.5
4 Minor lateral seepage at 0.4m. Saturated profile throughout Imperfectly drained mainly downward 0.6
7 No lateral seepage observed. Saturated A horizon
Moderately well drained downward 0.7
8 Significant lateral seepage at 0.3m. Saturated A horizon. High water table
Poorly drained lateral
ponding observed 0.3
9 Significant lateral seepage at 0.4m. Saturated profile throughout
Poorly drained lateral
ponding observed 0.3
11 No lateral seepage observed. Uniformly saturated profile Well drained downward 0.7
12 Minor lateral seepage at 0.4m. Saturated zone at top of B horizon
Moderately well drained
downward 0.7
14 Significant lateral seepage at 0.3m. Saturated zone at top of B horizon
Moderately well drained
mainly downward ponding observed 0.4
15 No lateral seepage observed. Well drained A horizon Moderately well
drained mainly downward 0.7
16 No lateral seepage observed. Saturated at top of B horizon Poorly drained
lateral ponding observed 0.4
a the classification used complies with AS/NZS 1547:2000 (Standards Australia, 2000), McDonald et al. (1990). b derived from soil moisture profiles and soil chloride profiles to determine drainage flow c based on soil profile description and field measurements
Several of the study sites had slowly permeable soil at the ‘B’ horizon indicating that
lateral flow is prevalent. A medium to heavy clay ‘B’ horizon effectively acts as an
impermeable barrier to vertical flow through the soil. Therefore as the ‘A’ horizon
becomes saturated, lateral flow of effluent is preferred rather than downward
movement. These conditions were further confirmed by the fact that the ‘B’ horizon
showed signs of redoximorphic features such as free water, presence of mottling and
iron accumulation. Such variations indicate a seasonal groundwater table during wet
periods (Gross et al 1998). Under these circumstances, flow of effluent into surface
water bodies can potentially occur. The lateral flow rate is dependant on the slope
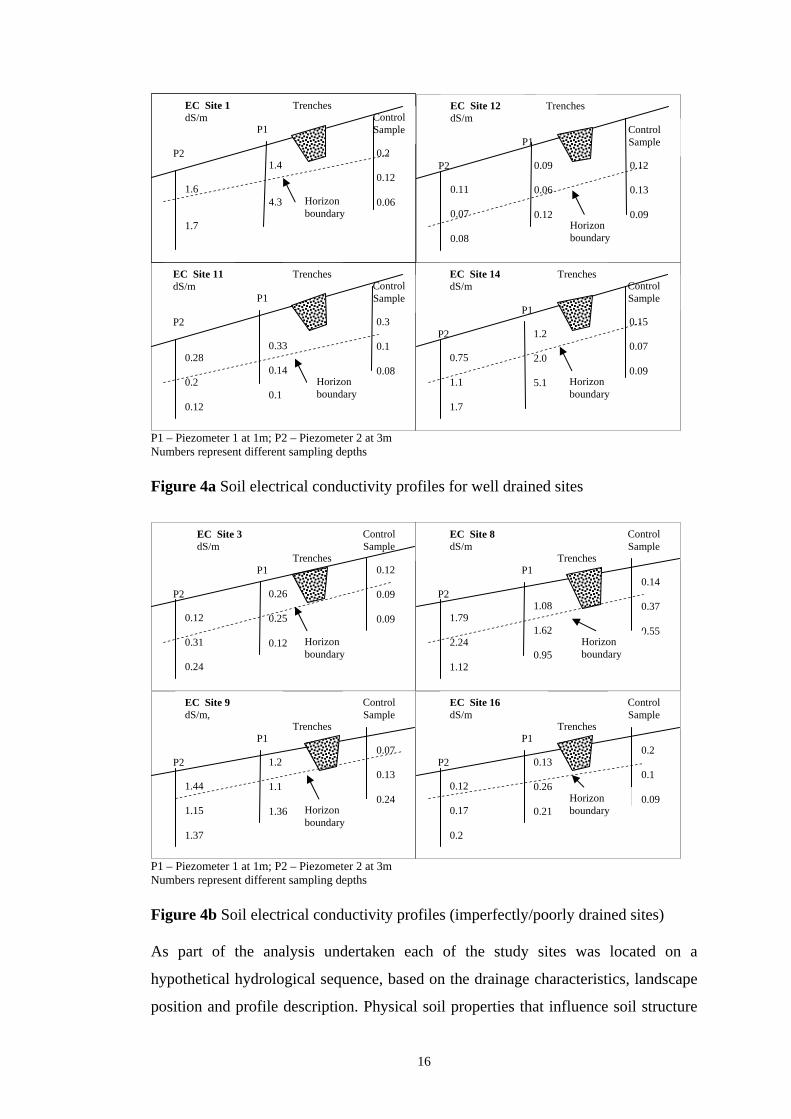
and hydraulic conductivity of the soil. The soil electrical conductivity profiles shown
14
in Figure 4a and 4b also support the lateral movement of effluent through the more
permeable surface layers. Where effluent ponding was observed, salt accumulation in
the soil significantly increased independent of drainage class (Sites 8, 9 and 14 in
Figure 4a, b). This could indicate that structural breakdown of the soil has led to
restricted water entry and changed the moisture regime of the soil. Table 4 Laboratory permeability results for undisturbed soil samples
Location
Sample Depth (m)
Horizon
Permeability (mm/day)
Observations
0.2 - 0.35 A 378 Sandy loam 0.6 – 0.74 B 45 Swelling clay
Site 1C
1.2 – 1.32 C 1730 Jointed Shale with clay infill Site 1ED 0.55 - 0.68 B 28
0.25 – 0.40 A 1258 Sandy loam 0.55 – 0.67 B 17 Mottling of light clay
Site 3C
1.1 – 1.2 C 33 Mottling of sandy clay Site 3ED 0.50 – 0.65 B 2
0.6 – 0.78 B1 11 Minor mottling of sandy clay Site 4C 0.95 – 1.1 B2 22 0.1 – 0.22 A 1245 Brown sandy loam 0.3 – 0.44 B1 8 Mottling of loamy clay
Site 8C
0.60 – 0.72 B2 13 Mottled heavy clay 0.3 – 0.51 B1 12 Red and yellow mottling Site 9C 0.90 –1.10 B2 37 0.7 – 0.85 B1 172 Site 11C 1.1 – 1.24 B2 439 Silty loam with some gravel 0.2 – 0.37 A 2540 Brown sand 0.7 - 0.87 B1 565 Well drained loamy sand
1.1 -1.25 B2 18 Red and white sandy clay 0.6 – 0.7 B1 5 Red and grey mottling Site 16C 1.2 – 1.3 B2 10 Mottled grey red heavy clay
Slowly permeable less than 10mm/day Moderately permeable 10mm to 1000mm/day Highly permeable more than 1000mm/day (Adapted from Baker and Eldershaw 1993)
Sites 7 and 14 were not sampled due to difficulty in obtaining a representative undisturbed soil sample ED – permeability of soil within disposal field C – permeability of control soil (outside the influence of effluent disposal)
15
0.2 0.12 0.06
Control Sample P1
P2 1.4 4.3
1.6 1.7
EC Site 1 dS/m
Horizon boundary
Trenches
0.12 0.13 0.09
Control Sample
Trenches
P1
P2 0.09 0.06 0.12
0.11 0.07 0.08
EC Site 12 dS/m
Horizon boundary
0.15 0.07 0.09
Control Sample
Trenches
P1
P2 1.2 2.0 5.1
0.75 1.1 1.7
EC Site 14 dS/m
Horizon boundary
0.3 0.1 0.08
Control Sample
Trenches
P1
P2
0.33 0.14 0.1
0.28 0.2 0.12
EC Site 11 dS/m
Horizon boundary
P1 – Piezometer 1 at 1m; P2 – Piezometer 2 at 3m Numbers represent different sampling depths
Figure 4a Soil electrical conductivity profiles for well drained sites
0.14 0.37 0.55
Control Sample
Trenches P1
P2 1.08 1.62 0.95
1.79 2.24 1.12
EC Site 8 dS/m
Horizon boundary
0.12 0.09 0.09
Control Sample
Trenches P1
P2 0.26 0.25 0.12
0.12 0.31 0.24
EC Site 3 dS/m
Horizon boundary
0.2 0.1 0.09
Control Sample
Trenches P1
P2 0.13 0.26 0.21
0.12 0.17 0.2
EC Site 16 dS/m
Horizon boundary
0.07 0.13 0.24
Control Sample
Trenches P1
P2 1.2 1.1 1.36
1.44 1.15 1.37
EC Site 9 dS/m,
Horizon boundary
P1 – Piezometer 1 at 1m; P2 – Piezometer 2 at 3m Numbers represent different sampling depths
Figure 4b Soil electrical conductivity profiles (imperfectly/poorly drained sites) As part of the analysis undertaken each of the study sites was located on a
hypothetical hydrological sequence, based on the drainage characteristics, landscape
position and profile description. Physical soil properties that influence soil structure
16
and stability including soil permeability, clay content and clay type were compared at
each site with observed treatment performance. Shaw et al (1994) found that soils
with mixed mineralogies are the most sensitive to sodium variations and will form
the least permeable matrix if the clay content is around 40 to 50%. Sites 3, 8 and 9
(Figure 5 and Table 5) exhibit these characteristics. Subsurface effluent disposal
involves a series of wetting and drying cycles which would align the clay and
restructure the soil. In soils with minimal shrink swell characteristics (kaolinite and
illite clay), a dense soil matrix will form, whereas in soils with appreciable shrink
swell properties (smectite clay), some regeneration of soil properties and porosity
would result. Thus soils with a predominance of smectite clays have the ability to
efficiently renovate effluent even with moderately high exchangeable sodium.
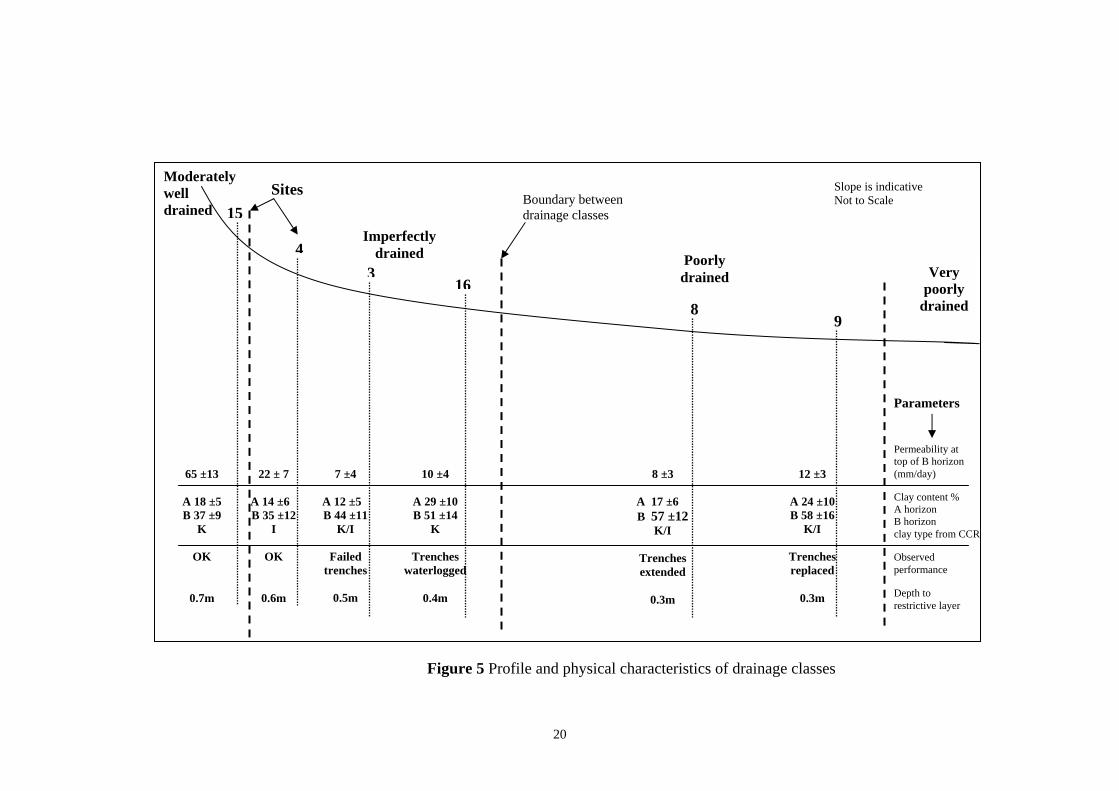
A strong correlation (r2 = 0.83) between the depth to the restrictive horizon measured
at a site, and observed treatment performance was noted from the study results.
Observed performance was defined by field observations, soil water sampling
results, detailed site history obtained from the householder and surface and sub-
surface site conditions noted during the study. In cases where the restrictive horizon
shown in Table 3 was less than 0.4m from the surface, inadequate purification of
effluent was the general outcome. Figures 5 and 6 which show a standard depiction
of soil drainage (White 1997) for sites in imperfectly to poorly drained landscapes
illustrate these conclusions. All moderately to well drained sites have restrictive
horizons greater than 0.5m from the surface and are not shown in these figures.
17
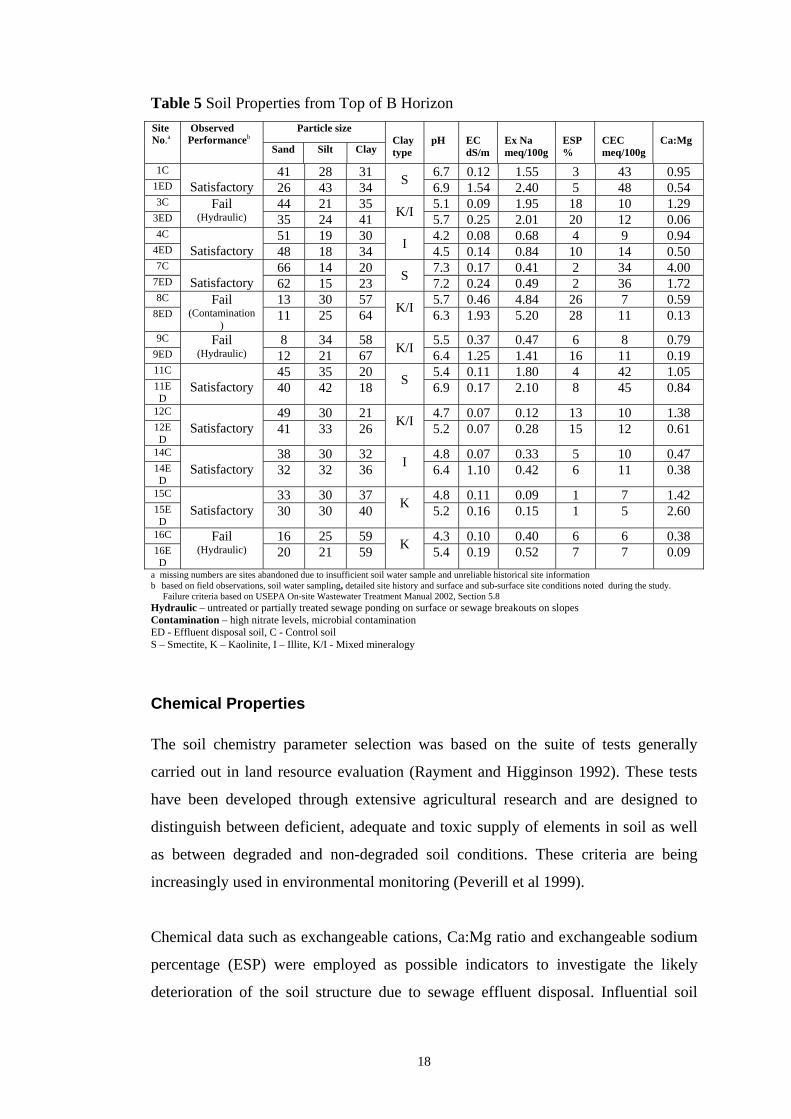
Table 5 Soil Properties from Top of B Horizon Particle size Site
a missing numbers are sites abandoned due to insufficient soil water sample and unreliable historical site information b based on field observations, soil water sampling, detailed site history and surface and sub-surface site conditions noted during the study.
Failure criteria based on USEPA On-site Wastewater Treatment Manual 2002, Section 5.8 Hydraulic – untreated or partially treated sewage ponding on surface or sewage breakouts on slopes Contamination – high nitrate levels, microbial contamination ED - Effluent disposal soil, C - Control soil S – Smectite, K – Kaolinite, I – Illite, K/I - Mixed mineralogy
Chemical Properties The soil chemistry parameter selection was based on the suite of tests generally
carried out in land resource evaluation (Rayment and Higginson 1992). These tests
have been developed through extensive agricultural research and are designed to
distinguish between deficient, adequate and toxic supply of elements in soil as well
as between degraded and non-degraded soil conditions. These criteria are being
increasingly used in environmental monitoring (Peverill et al 1999).
Chemical data such as exchangeable cations, Ca:Mg ratio and exchangeable sodium
percentage (ESP) were employed as possible indicators to investigate the likely
deterioration of the soil structure due to sewage effluent disposal. Influential soil
18
parameters were identified and correlations and linkages between these parameters
and drainage factors were investigated. These parameters included cation exchange
capacity (CEC) or Effective Cation Exchange Capacity (ECEC), dominance of
exchangeable Ca or exchangeable Mg over exchangeable Na concentration, Ca:Mg
ratio and dispersiveness (ESP or Emerson test).
19
Observed performance
Moderately well drained
Imperfectly drained Poorly
drained Very poorly
drained
15
43
168
9
Sites
Depth to restrictive layer
Boundary between drainage classes
Slope is indicative Not to Scale
Permeability at top of B horizon (mm/day) 12 ±3
A 24 ±10 B 58 ±16
K/I
Trenches replaced
0.3m
8 ±3
A 17 ±6 B 57 ±12
K/I
Trenches extended
0.3m
10 ±4
A 29 ±10 B 51 ±14
K
Trenches waterlogged
0.4m
7 ±4
A 12 ±5 B 44 ±11
K/I
Failed trenches
0.5m
22 ± 7
A 14 ±6 B 35 ±12
I
OK
0.6m
65 ±13
A 18 ±5 B 37 ±9
K
OK
0.7m
Clay content % A horizon B horizon clay type from CCR
Parameters
Figure 5 Profile and physical characteristics of drainage classes
20
21
Moderately well drained
Imperfectly drained
Very poorly
drained
Parameters
15
43
168
9
Sites
Depth to restrictive layer
Observed performance
Exchangeable Na content meq/100g
Depth to Ca:Mg<0.5
Boundary between drainage classes
0.4m
A 0.2
B 1.2
Trench replac
0.3m
0.1m
A 0.3
B 5.2
Trenches extended
0.3m
0.2m
A 0.19
B 1.5
Trenches waterlogged
0.4m
0.4m
A 0.06
B 3.5
Failed trenches
0.5m
0.7m
A 0.1
B 0.9
OK
0.6m
1.2m
A 0.6
B 0.12
OK
0.7m
esed
Poorly Drained
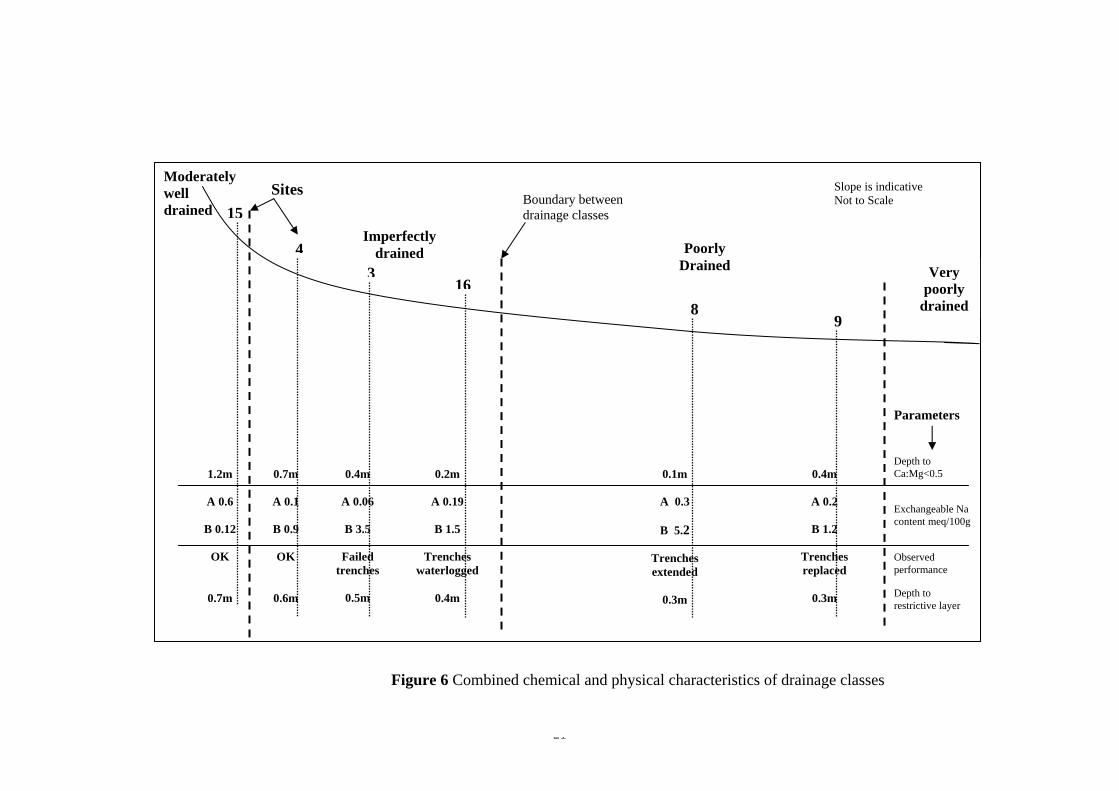
Figure 6 Combined chemical and physical characteristics of drainage classes
Slope is indicative Not to Scale
The results from the sampling and testing program found appreciable changes in
exchangeable cations such as Ca, Mg and Na as well as in parameters such as pH,
EC and CEC (or ECEC) compared to control sites due to the sub-surface application
of sewage effluent (Table 5). Suarez et al (1984) found that altering soil pH can
strongly influence the dispersibility of kaolinite. These chemical parameter changes
were comparable with other findings relating to New Zealand and Southern
Australian soils (Stewart et al 1990, Falkiner and Smith 1997, Speir et al 1999,
Menneer et al 2001,).
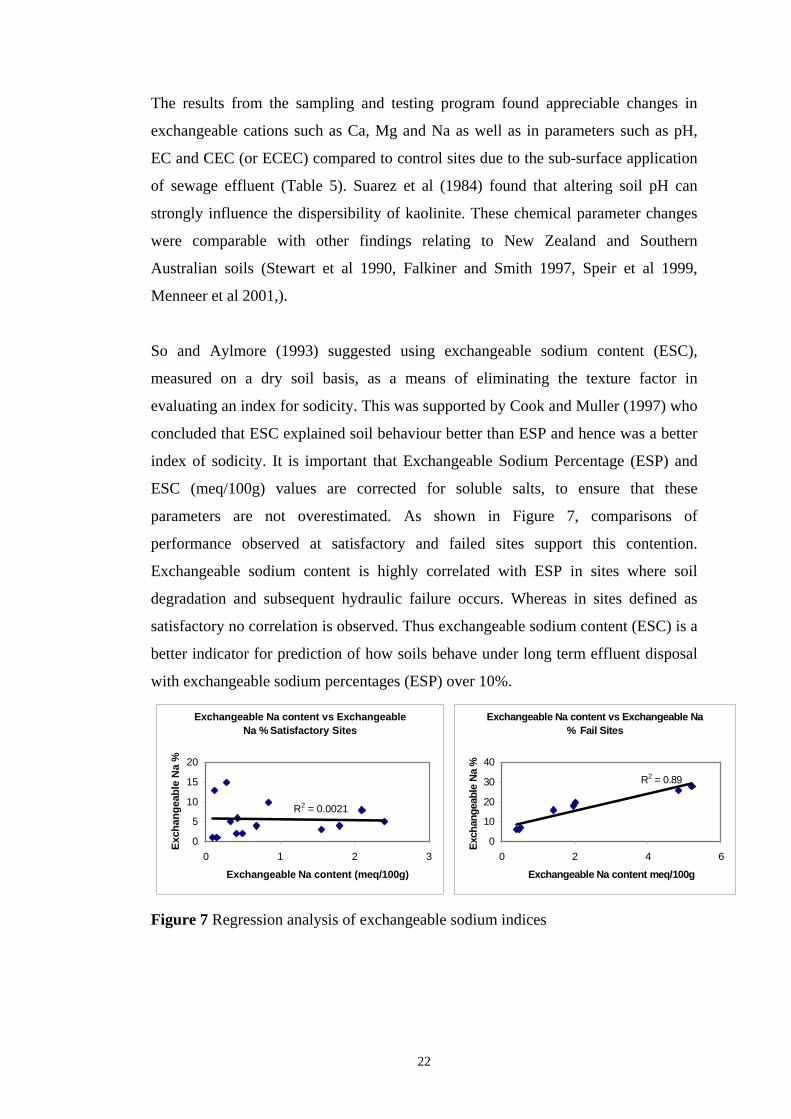
So and Aylmore (1993) suggested using exchangeable sodium content (ESC),
measured on a dry soil basis, as a means of eliminating the texture factor in
evaluating an index for sodicity. This was supported by Cook and Muller (1997) who
concluded that ESC explained soil behaviour better than ESP and hence was a better
index of sodicity. It is important that Exchangeable Sodium Percentage (ESP) and
ESC (meq/100g) values are corrected for soluble salts, to ensure that these
parameters are not overestimated. As shown in Figure 7, comparisons of
performance observed at satisfactory and failed sites support this contention.
Exchangeable sodium content is highly correlated with ESP in sites where soil
degradation and subsequent hydraulic failure occurs. Whereas in sites defined as
satisfactory no correlation is observed. Thus exchangeable sodium content (ESC) is a
better indicator for prediction of how soils behave under long term effluent disposal
with exchangeable sodium percentages (ESP) over 10%.
Exchangeable Na content vs Exchangeable Na % Satisfactory Sites
R2 = 0.0021
0
5
10
15
20
0 1 2 3
Exchangeable Na content (meq/100g)
Exch
ange
able
Na
%
Exchangeable Na content vs Exchangeable Na % Fail Sites
R2 = 0.89
0
10
20
30
40
0 2 4 6
Exchangeable Na content meq/100g
Exch
ange
able
Na
%
Figure 7 Regression analysis of exchangeable sodium indices
22
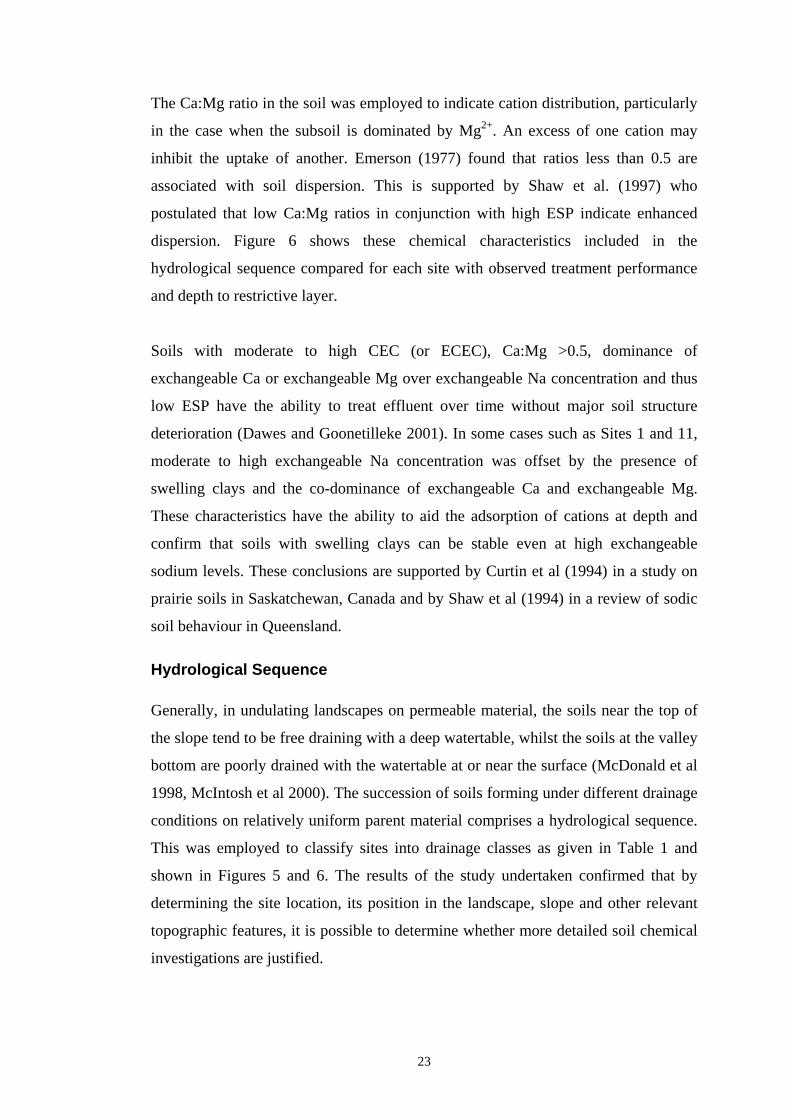
The Ca:Mg ratio in the soil was employed to indicate cation distribution, particularly
in the case when the subsoil is dominated by Mg2+. An excess of one cation may
inhibit the uptake of another. Emerson (1977) found that ratios less than 0.5 are
associated with soil dispersion. This is supported by Shaw et al. (1997) who
postulated that low Ca:Mg ratios in conjunction with high ESP indicate enhanced
dispersion. Figure 6 shows these chemical characteristics included in the
hydrological sequence compared for each site with observed treatment performance
and depth to restrictive layer.
Soils with moderate to high CEC (or ECEC), Ca:Mg >0.5, dominance of
exchangeable Ca or exchangeable Mg over exchangeable Na concentration and thus
low ESP have the ability to treat effluent over time without major soil structure
deterioration (Dawes and Goonetilleke 2001). In some cases such as Sites 1 and 11,
moderate to high exchangeable Na concentration was offset by the presence of
swelling clays and the co-dominance of exchangeable Ca and exchangeable Mg.
These characteristics have the ability to aid the adsorption of cations at depth and
confirm that soils with swelling clays can be stable even at high exchangeable
sodium levels. These conclusions are supported by Curtin et al (1994) in a study on
prairie soils in Saskatchewan, Canada and by Shaw et al (1994) in a review of sodic
soil behaviour in Queensland.
Hydrological Sequence Generally, in undulating landscapes on permeable material, the soils near the top of
the slope tend to be free draining with a deep watertable, whilst the soils at the valley
bottom are poorly drained with the watertable at or near the surface (McDonald et al
1998, McIntosh et al 2000). The succession of soils forming under different drainage
conditions on relatively uniform parent material comprises a hydrological sequence.
This was employed to classify sites into drainage classes as given in Table 1 and
shown in Figures 5 and 6. The results of the study undertaken confirmed that by
determining the site location, its position in the landscape, slope and other relevant
topographic features, it is possible to determine whether more detailed soil chemical
investigations are justified.
23
During the study, sites were initially categorised by their landscape position along
with subsurface drainage characteristics. Where the soil profile evaluation confirmed
favourable drainage characteristics, no further detailed chemical analysis was found
to be warranted. In the case of poor drainage, knowledge of detailed soil chemistry
was found to be a valuable tool in predicting site suitability for effective long term
effluent disposal. Very poorly drained sites can be deemed unsuitable for on-site
wastewater treatment especially in small lot developments even without further
investigations.
An example was a ‘duplex’ soil at Site 3, which was thought to be imperfectly to
moderately drained based on its position on the landscape. However, the detailed soil
profile evaluation at the control site revealed the presence of a clay-enriched zone at
the top of the ‘B’ horizon at a depth of 0.5m. Subsequent soil chemistry revealed low
Ca:Mg ratio and high exchangeable Na and thus a high ESP, low ECEC) and the
exchange capacity being dominated by exchangeable Mg. These results indicated
that poor soil conditions exist for effective effluent treatment. Conclusions of this
nature could only have been derived from soil chemical analysis. It was subsequently
confirmed that the householder had replaced a failed septic system due to constant
overflowing and waterlogging of the disposal trenches. This highlights the
importance of detailed subsurface soil evaluation and confirms the strong site
specific nature of effluent treatment.
Conclusions
The physical and chemical properties of a soil which can be used to predict
suitability for long term effluent disposal include:
1. Moderate to slow drainage (permeability) to assist the movement of effluent
(percolation) through the soil profile and allow adequate time for treatment to
occur. With longer percolation times, the opportunity for exchange and
transport processes increases.
2. Significant soil cation exchange capacity and dominance of exchangeable Ca
or exchangeable Mg over exchangeable Na. Although a soil dominated by
Mg is found to promote dispersion of soil particles to some extent, its impact
is far less than that of Na. A stable soil would have a Ca: Mg ratio > 0.5.
24
3. Low exchangeable Na content to maintain soil stability.
4. Minimum depth of 0.4m of potentially unsaturated soil before encountering a
restrictive horizon to permit adequate purification to take place.
5. Clay type having appreciable shrink swell properties causing some
regeneration of soil properties and thus increased porosity.
Suitability of sites for effluent disposal depends on whether the soil exhibits the
above characteristics. Suitability also depends on the position of the site within the
hydrological sequence. By determining the site location, its position in the landscape,
slope and other relevant topographic features, it is possible to determine whether
more detailed investigations should be undertaken. As an example, if a soil lies in the
upper section of the landscape and is well drained, soil chemistry as a predictive tool
adds less value than where the soils lie in lower positions in the landscape where
drainage is poor. Soils in the lower landscape position need soil chemical
investigations to assist in characterisation and prediction.
An in-depth knowledge of the local soil characteristics and associated soil hydrology
is essential for a better prediction of long-term treatment potential of subsurface
effluent disposal systems. It is important to be aware of the need to integrate the
factors described above in understanding soil structure stability and predicting long-
term sustainability of effluent disposal areas.
References
APHA, 1995, Standard Methods for the examination of water and wastewater, 19th
Edition, American Public Health Association, American Water and Wastewater
Association and Water Environment Federation.
Baker, D.E. and Eldershaw, V.J., 1993. Interpreting soil analysis for agricultural land
use in Queensland, Division of Land Use & Fisheries, Report Series Q093014,
Department of Primary Industries.
Bond, W.J., 1998. Effluent irrigation – an environmental challenge for soil science.
Australian Journal of Soil Research 36, 543-555
Brouwer, J. and Bugeja, R.M., 1983. Land capability for septic tank effluent
25
absorption fields. Australian Water Resources Council Technical Paper No. 80.
Carroll, S., Goonetilleke, A. and Dawes, L., 2004. Framework for soil suitability
evaluation for sewage effluent renovation. Journal of Environmental Geology, 46,
(2): 195-208
Cook, G.D. and Muller, W.J., 1997. Is Exchangeable Sodium Content a better index
of Soil Sodicity than Exchangeable Sodium Percentage?: A Reassessment of
published data. Soil Science 162(5), 343-349
Cresswell, H.P., McKenzie, N.J. and Paydar, Z., 1999. Strategy for determining
hydraulic properties of Australian soils using direct measurements and pedotransfer
functions. International Workshop on Characterization and Measurement of the
Hydraulic Properties of soil, Riverside University of California, pp.1143-1159
Curtin, D., Steppuhn, H. and Selles, F.,1994. Effects of magnesium on Cation
Selectivity and Structural Stability of Sodic Soils. Soil Science Society of America
58, 730-737.
Dawes, L. and Goonetilleke, A., 2001. The importance of site assessment in
designing effluent disposal areas. Proceedings of 2nd Australia and New Zealand
Conference on Environmental Geotechnics, Newcastle, Australia, 28-30th November
2001, pp. 287-294.
Dawes, L. and Goonetilleke, A., 2003, An Investigation into the Role of Site and Soil
Characteristics in On-site Sewage Treatment, Journal of Environmental Geology, 44,
(4): 467 - 477
DeBorde, D.C., Woessner, W.W., Lauerman, B. and Ball, P.N., 1998. Virus
occurrence and transport in a school septic system and unconfined aquifer. Ground
Water 36, 825-834.
DeWalle, F.B. and Schaff, R.M., 1980. Ground-water pollution by septic tank
drainfields. Journal of the Environmental Engineering Division, ASCE 106, 631-646.
Emerson, W.W., 1977. Determination of the contents of clay sized particles in soil.
Journal of Soil Sciences 22, 50-59.
Falkiner, R.A. and Smith, C.J., 1997. Changes in Soil chemistry in effluent irrigated
Pinus radiata and Eucalyptus grandis plantations. Australian Journal of Soil Research
35, 131-147.
Gross, M.A., Owens, P.R., Dennis, N.D., Robinson, A.K. and Rutledge, E.M., 1998.
Sizing On-site Wastewater Treatment Systems using Soil Characteristics as
compared to the Percolation Test. Proceedings of the 8th National Symposium on
26
Individual and Small Community Sewage Systems, St Joseph, MI, ASAE, pp. 52-59.
Isbell, R.F., 1996. A classification system for Australian soils. CSIRO Publishing,
Victoria, Australia.
Jenssen, P.D. and Siegrist, R.L., 1990. Technology Assessment of Wastewater
treatment by soil infiltration systems. Water Science Technology 22(3/4), 83-92.
Johnson, K.R. and Atwater, J.W., 1988. Role of saturated and unsaturated zone in
soil disposal of septic tank effluent. Canadian Journal of Civil Engineering 15, 709-
716.
Khalil, W.A., Goonetilleke, A., Kokot, S. and Carroll, S., 2004. Use of chemometric
methods and multicriteria decision-making for the site selection for sustainable on-
site sewage effluent disposal. Analytica Chimica Acta 506, 41-56.
Lipp, E.K., Farrah, S.A. and Rose, J.B., 2001. Assessment and impact of microbial
faecal pollution and human enteric pathogens in a coastal community. Marine
Pollution Bulletin 42, 286-293.
Martens, D.M. and Geary. P.M., 1999. Australian On-site Wastewater Strategies: A
case study of Scotland Island, Sydney, Australia, Proceedings of On-site 99
Conference: Making on-site wastewater systems work. University of New England,
Armidale, 13-15 July 1999, pp. 255-263.
McIntosh, P.D., Lynn, I.H. and Johnstone, P.D., 2000. Creating and testing a
geometric soil landscape model in dry steeplands using a very low sampling density.
Australian Journal of Soil Research 38, 101-112
McDonald, R.C., Isbell, R.F. Speight, J.G. Walker, J. and Hopkins, M.S., 1998.
Australian Soil and Land Survey Field Handbook (Second Edition). CSIRO
Publishing, Australia.
Menneer, J.C., McLay, C.D.A. and Lee, R., 2001. Effects of sodium contaminated
wastewater on soil permeability of two New Zealand soils. Australian Journal of Soil
Research 39, 877-891
Mote, C.R., Buchanan, J.R. and Ammons, J.T., 1995. Performance of on-site
domestic wastewater renovation systems specified for sites with shallow soils.
Applied Engineering in Agriculture 11(3), 437-447.
Paul, J.H., McLaughlin, M.R. Griffin, D.W. Lipp, E.K. Stokes, R. and Rose, J.B.,
2000. Rapid movement of wastewater from on-site disposal systems into surface
waters in the Lower Florida Keys. Estuaries 23, 662-668.
Peverill, K.I., Sparrow, L.A. and Reuter D.J. (editors), 1999. Soil Analysis: An