14
Assessment of satellite altimetry data in the Arctic Ocean Yongcun Cheng & Ole Baltazar Andersen DTU Space National Space Institute Copenhagen, Denmark
Assessment of satellite altimetry data in the Arctic Ocean
Yongcun Cheng & Ole Baltazar Andersen DTU Space National Space Institute Copenhagen, Denmark
2 DTU Space, Technical University of Denmark Coastal Altimetry workshop 17/10/2011
Outline
1. Introduction Ø Problems of altimeter range measurements in the Arctic Ocean Ø SSALTO/DUACS (weekly gridded SLA: DT-MSLA "Upd" V3.0.0) Ø MyOcean Arctic V2p (weekly gridded data - preliminary) Ø RADS (Radar Altimeter Database System), along track data.
2.Assessment of sea level products (65ºN-82ºN) Ø Data Coverage Ø Sea level variances Ø Temporal correlation with weekly tide gauge data Ø Amplitude of annual signal (monthly tide gauge data, SODA, DTU10ANN) Ø Linear sea level trend (monthly tide gauge, RADS, SODA)
3.Summary
3 DTU Space, Technical University of Denmark Coastal Altimetry workshop 17/10/2011
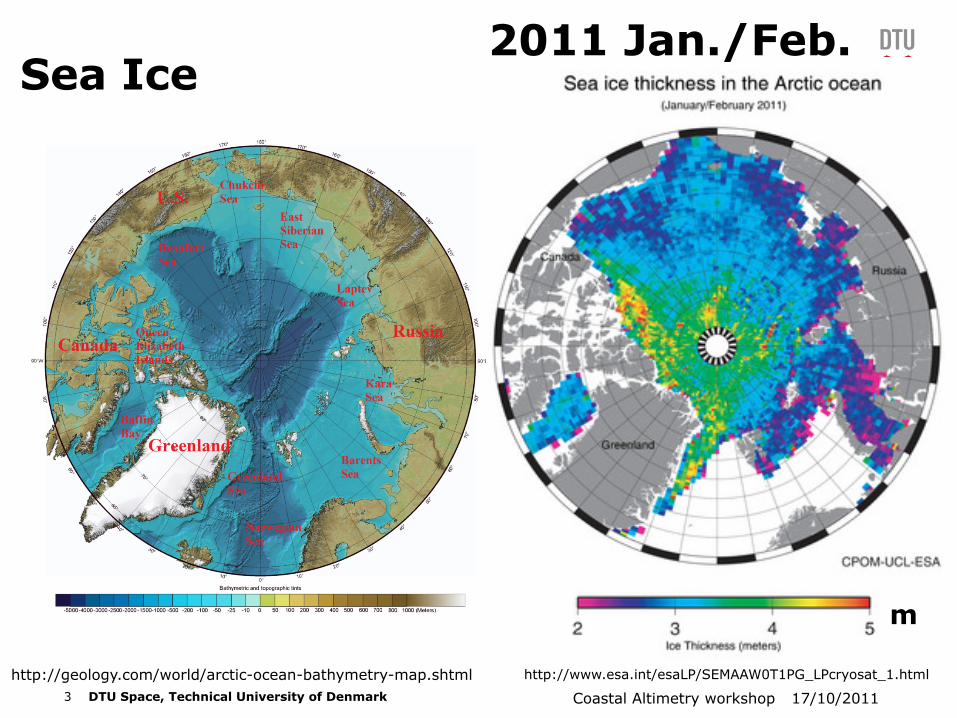
Sea Ice
http://geology.com/world/arctic-ocean-bathymetry-map.shtml http://www.esa.int/esaLP/SEMAAW0T1PG_LPcryosat_1.html
m
2011 Jan./Feb.
4 DTU Space, Technical University of Denmark Coastal Altimetry workshop 17/10/2011
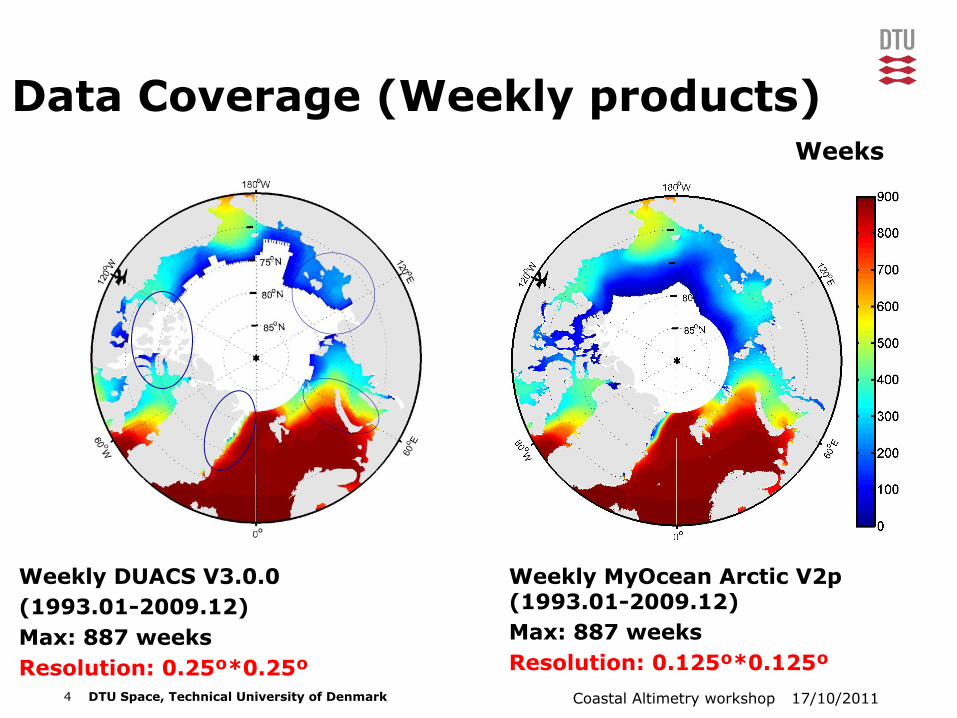
Data Coverage (Weekly products) Weeks
Weekly DUACS V3.0.0 (1993.01-2009.12) Max: 887 weeks Resolution: 0.25º*0.25º
Weekly MyOcean Arctic V2p (1993.01-2009.12) Max: 887 weeks Resolution: 0.125º*0.125º
5 DTU Space, Technical University of Denmark Coastal Altimetry workshop 17/10/2011
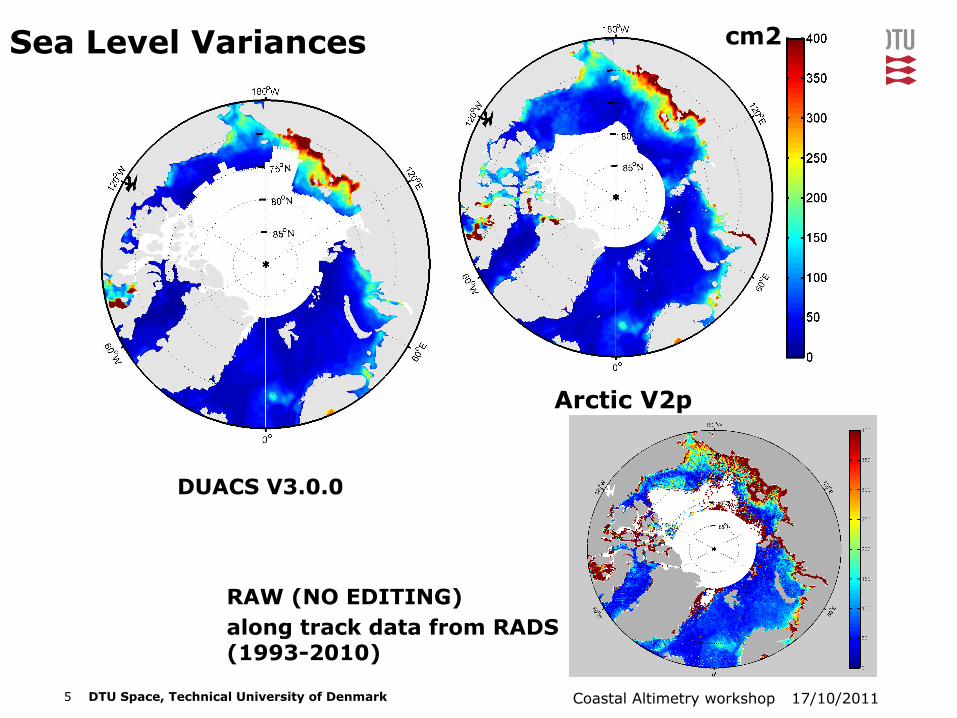
Sea Level Variances
DUACS V3.0.0
Arctic V2p
cm2
RAW (NO EDITING) along track data from RADS (1993-2010)
6 DTU Space, Technical University of Denmark Coastal Altimetry workshop 17/10/2011
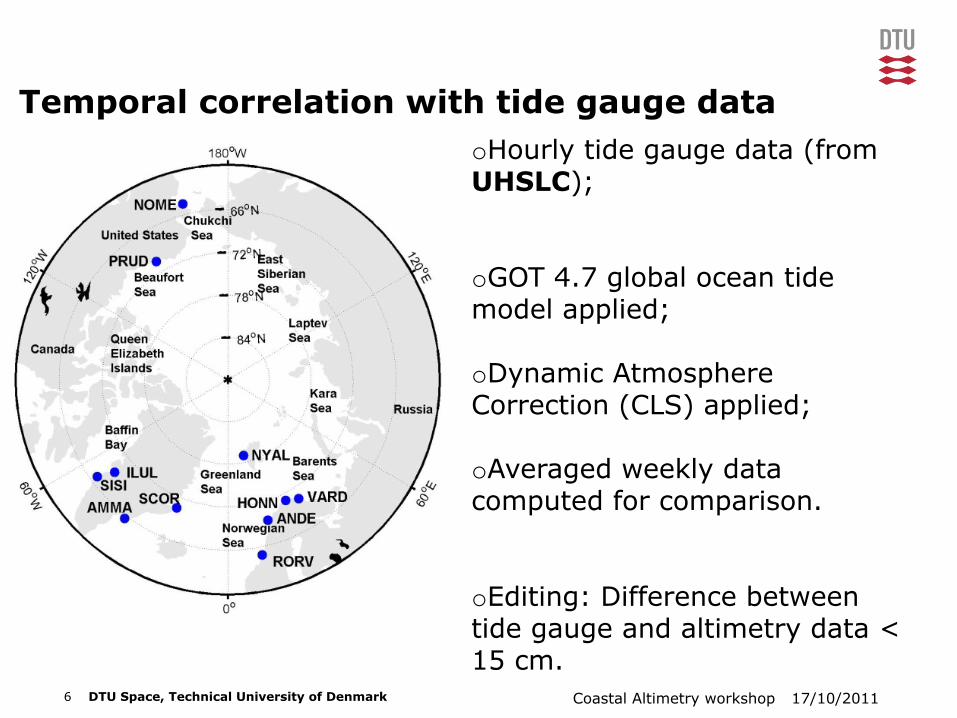
Temporal correlation with tide gauge data o Hourly tide gauge data (from UHSLC); o GOT 4.7 global ocean tide model applied;
o Dynamic Atmosphere Correction (CLS) applied;
o Averaged weekly data computed for comparison.
o Editing: Difference between tide gauge and altimetry data < 15 cm.
7 DTU Space, Technical University of Denmark Coastal Altimetry workshop 17/10/2011
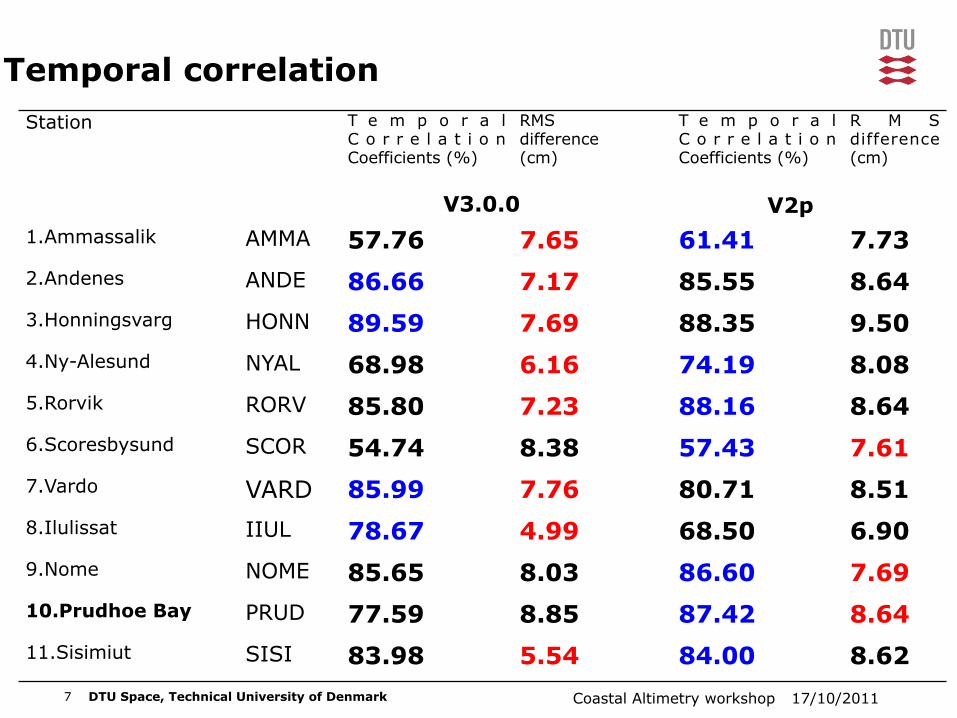
Temporal correlation Station T e m p o r a l
C o r r e l a t i o n Coefficients (%)
RMS difference (cm)
T e m p o r a l C o r r e l a t i o n Coefficients (%)
R M S difference (cm)
1.Ammassalik AMMA 57.76 7.65 61.41 7.73 2.Andenes ANDE 86.66 7.17 85.55 8.64 3.Honningsvarg HONN 89.59 7.69 88.35 9.50 4.Ny-Alesund NYAL 68.98 6.16 74.19 8.08 5.Rorvik RORV 85.80 7.23 88.16 8.64 6.Scoresbysund SCOR 54.74 8.38 57.43 7.61 7.Vardo VARD 85.99 7.76 80.71 8.51 8.Ilulissat IIUL 78.67 4.99 68.50 6.90 9.Nome NOME 85.65 8.03 86.60 7.69 10.Prudhoe Bay PRUD 77.59 8.85 87.42 8.64 11.Sisimiut SISI 83.98 5.54 84.00 8.62
V3.0.0 V2p
8 DTU Space, Technical University of Denmark Coastal Altimetry workshop 17/10/2011
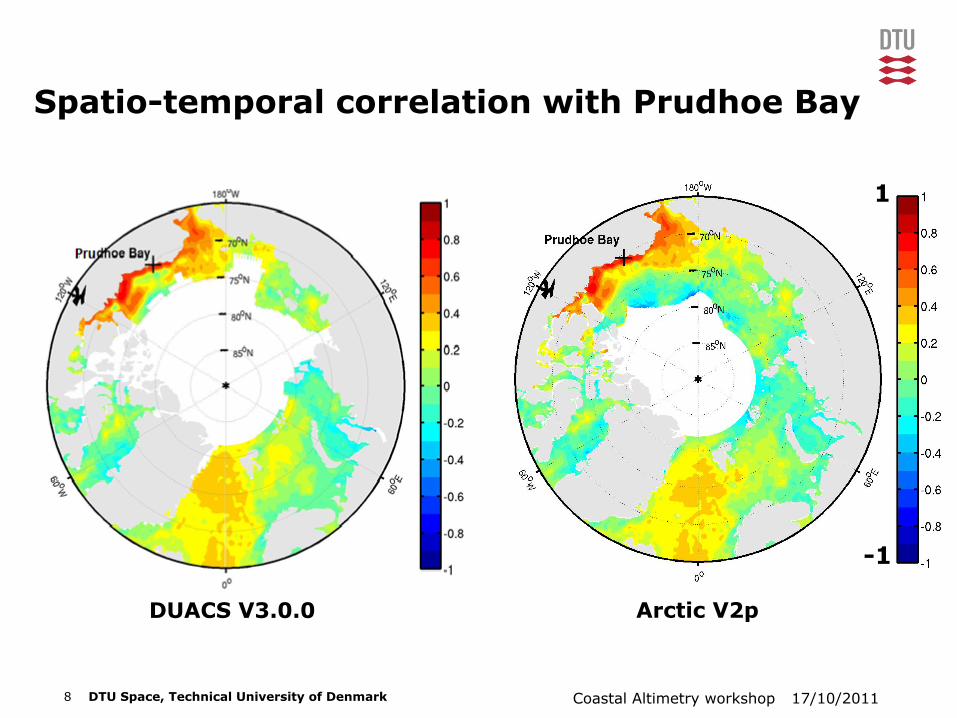
Spatio-temporal correlation with Prudhoe Bay
DUACS V3.0.0 Arctic V2p
1
-1
9 DTU Space, Technical University of Denmark Coastal Altimetry workshop 17/10/2011
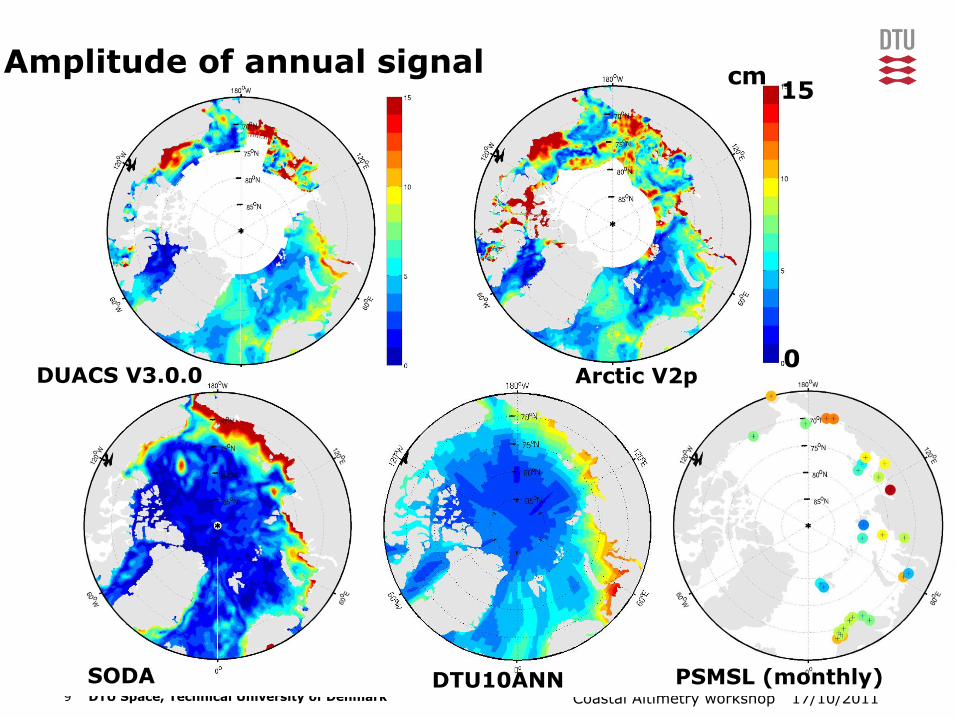
DUACS V3.0.0 Arctic V2p
DTU10ANN
cm 15
0
SODA
DUACS V3.0.0
PSMSL (monthly)
Amplitude of annual signal
10 DTU Space, Technical University of Denmark Coastal Altimetry workshop 17/10/2011
10
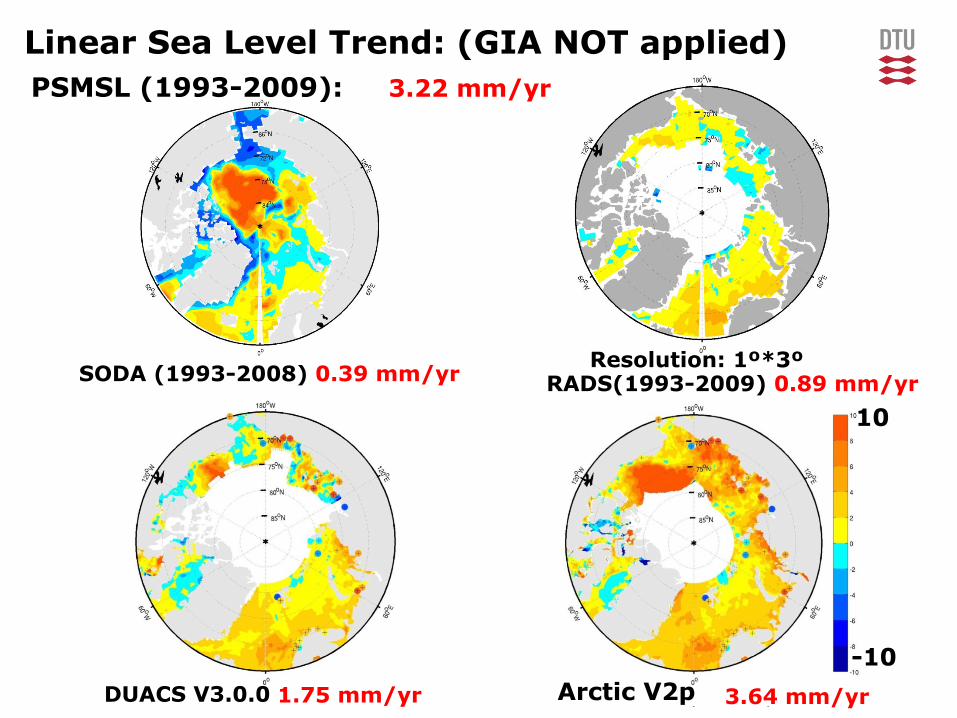
-10 DUACS V3.0.0 Arctic V2p 1.75 mm/yr 3.64 mm/yr
SODA (1993-2008) 0.39 mm/yr
PSMSL (1993-2009): 3.22 mm/yr
RADS(1993-2009) 0.89 mm/yr
Linear Sea Level Trend: (GIA NOT applied)
Resolution: 1º*3º
11 DTU Space, Technical University of Denmark Coastal Altimetry workshop 17/10/2011
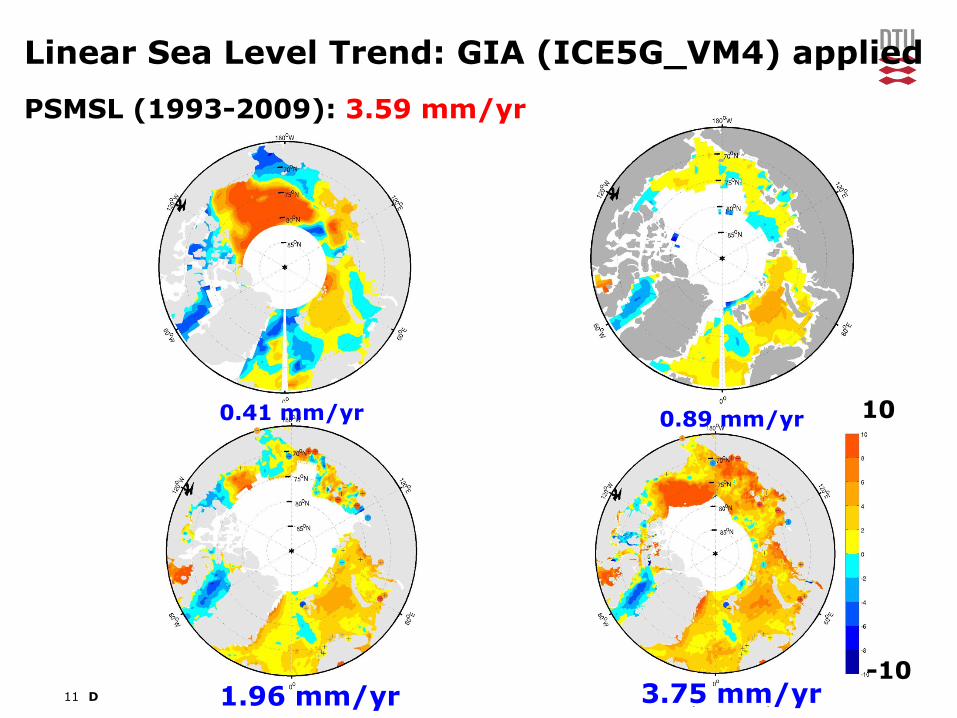
Linear Sea Level Trend: GIA (ICE5G_VM4) applied
0.89 mm/yr
3.75 mm/yr 1.96 mm/yr
0.41 mm/yr
PSMSL (1993-2009): 3.59 mm/yr
10
-10
12 DTU Space, Technical University of Denmark Coastal Altimetry workshop 17/10/2011
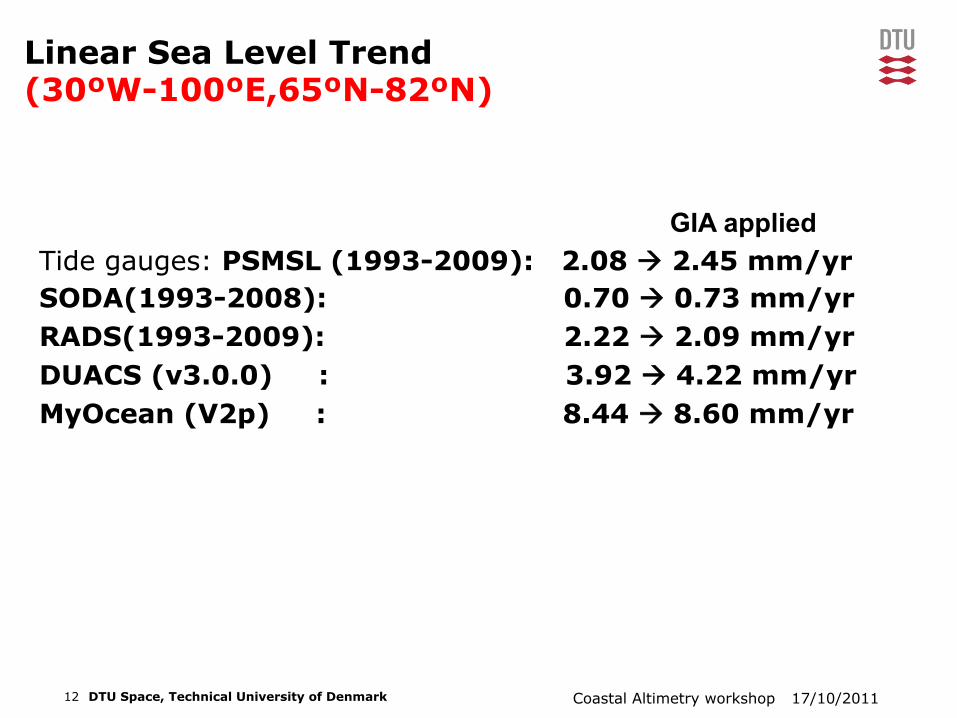
Linear Sea Level Trend (30ºW-100ºE,65ºN-82ºN)
GIA applied Tide gauges: PSMSL (1993-2009): 2.08 à 2.45 mm/yr SODA(1993-2008): 0.70 à 0.73 mm/yr RADS(1993-2009): 2.22 à 2.09 mm/yr DUACS (v3.0.0) : 3.92 à 4.22 mm/yr MyOcean (V2p) : 8.44 à 8.60 mm/yr
13 DTU Space, Technical University of Denmark Coastal Altimetry workshop 17/10/2011
Summary Improved data coverage in newer Arctic V2p with: v Poor accuracy in the Beaufort Sea v Improved agreement with tide gauge data (higher
temporal correlation) v Higher amplitude of annual signal than that from tide
gauges. v Higher sea level trend than that from other data sources
(DUACS, SODA, RADS, tide gauges). v Magnitude of 4 difference in linear sea level trend
between products is huge and requires further study and data improvement.
Acknowledgement o Work is a Contribution to
o EU 7’th Framework MyOcean project
14 DTU Space, Technical University of Denmark Coastal Altimetry workshop 17/10/2011
Thanks for your attention [email protected] [email protected]


![Service Charters [Nome del progetto] [Nome del relatore]](https://static.documents.pub/doc/80x56/56649e2f5503460f94b1fe07/service-charters-nome-del-progetto-nome-del-relatore.jpg)


![[Nome completo do autor] [Habilitações Académicas] [Nome ... · Diogo Rodrigues Francisco Sabino [Nome completo do autor] [Nome completo do autor] [Nome completo do autor] Hydrogels](https://static.documents.pub/doc/80x56/60e4508f8c055874545babee/nome-completo-do-autor-habilitaes-acadmicas-nome-diogo-rodrigues.jpg)


