ASSESSMENT OF SILTATION PROCESSES AND IMPLEMENTATION OF NAUTICAL DEPTH IN THE PORT OF COCHIN, INDIA B. Ferket 1 , M. Heredia Gomez 1 , I. Rocabado 1 , R. De Sutter 1 , T. Van Hoestenberghe 2 , J. Kwee 3 , C. Werner 3 , J. Verwilligen 4 , S. Vos 4 , M. Vantorre 4 , P. Nair 5 , P. Lamba 5 , S. Sharma 5 , S. Marthi 5 and F. Manso 1 Abstract: The port of Cochin has the largest siltation rate among Indian ports: +20 million m³/year. Local dynamics are controlled by the two rivers discharging into the port system and the ocean. Siltation occurs mostly during the Monsoon (June-September) when dynamics are high (Naik et al., 1983). The Cochin Port Trust (COPT) has tried to optimize the dredging efforts, i.e. allowing ships to partially penetrate the fluid mud. This project is a comprehensive attempt to tackle this problem by understanding the siltation processes in detail and by determining a minimum water depth, draft and under-keel-clearance at which navigation of ships through fluid mud is “safe” (nautical depth). The project was structured in different stages: 1. Desktop study to understand the existing situation and to determine the required acquisition efforts for the development of a numerical 2D model (TELEMAC 6 ). 2. Data acquisition and fieldwork to gather the key variables to set up and calibrate the numerical model and undertake the navigation studies. 3. Numerical modeling to understand in detail the siltation processes that occur in the area by simulating the hydrodynamics conditions (waves, tides and currents) as well as sediment transport, erosion and siltation processes. After calibration and validation, the model was used for scenario analysis. 4. Navigation studies to determine a nautical depth. Firstly, the navigation conditions were modeled physically by replicating (1) natural conditions under laboratory environment, (2) selecting a number of maneuvers with chosen design ships with different under keel clearance (UKC) levels and (3) determining mud rheology at the towing tank from the Flanders Hydraulics Research (FHR). Secondly, the results obtained in the physical model were compared against the expert judgement of pilots from the Port of Cochin. For this, tests in the 3D navigation simulator from the FHR, replicating Cochin’s hydrodynamic and environmental conditions, were developed. For this project, the nautical depth criterion was defined with a conservative mindset, by assessing “safe navigation” in terms of maneuverability of vessels. Recommendations to support the implementation of this criterion were provided to the client. The combination of all achieved results allowed the COPT to optimize their maintenance dredging strategy, while keeping sufficient nautical depth. In order to reach greater economic success, the nautical depth criterion needs to be fine-tuned in future works. Keywords: Siltation, rheology, ship maneuvering, modeling, nautical depth 1 Antea Group, Belgium, [email protected]2 Fluves, Belgium, [email protected]3 Stema Systems, the Netherlands, [email protected]4 Flanders Hydraulics Research, Belgium, [email protected]5 IIC Technologies, India, [email protected]6 http://www.opentelemac.org/ brought to you by CORE View metadata, citation and similar papers at core.ac.uk provided by Ghent University Academic Bibliography
Transcript
ASSESSMENT OF SILTATION PROCESSES AND IMPLEMENTATION OF
NAUTICAL DEPTH IN THE PORT OF COCHIN, INDIA
B. Ferket1, M. Heredia Gomez1, I. Rocabado1, R. De Sutter1, T. Van Hoestenberghe2, J. Kwee3, C. Werner3,
J. Verwilligen4, S. Vos4, M. Vantorre4, P. Nair5, P. Lamba5, S. Sharma5, S. Marthi5 and F. Manso1
Abstract: The port of Cochin has the largest siltation rate among Indian ports: +20 million m³/year. Local dynamics
are controlled by the two rivers discharging into the port system and the ocean. Siltation occurs mostly during the
Monsoon (June-September) when dynamics are high (Naik et al., 1983).
The Cochin Port Trust (COPT) has tried to optimize the dredging efforts, i.e. allowing ships to partially penetrate the fluid mud. This project is a comprehensive attempt to tackle this problem by understanding the siltation processes in
detail and by determining a minimum water depth, draft and under-keel-clearance at which navigation of ships through
fluid mud is “safe” (nautical depth).
The project was structured in different stages:
1. Desktop study to understand the existing situation and to determine the required acquisition efforts for the
development of a numerical 2D model (TELEMAC6).
2. Data acquisition and fieldwork to gather the key variables to set up and calibrate the numerical model and
undertake the navigation studies. 3. Numerical modeling to understand in detail the siltation processes that occur in the area by simulating the
hydrodynamics conditions (waves, tides and currents) as well as sediment transport, erosion and siltation
processes. After calibration and validation, the model was used for scenario analysis.
4. Navigation studies to determine a nautical depth. Firstly, the navigation conditions were modeled physically
by replicating (1) natural conditions under laboratory environment, (2) selecting a number of maneuvers with
chosen design ships with different under keel clearance (UKC) levels and (3) determining mud rheology at
the towing tank from the Flanders Hydraulics Research (FHR). Secondly, the results obtained in the physical
model were compared against the expert judgement of pilots from the Port of Cochin. For this, tests in the 3D
navigation simulator from the FHR, replicating Cochin’s hydrodynamic and environmental conditions, were
developed.
For this project, the nautical depth criterion was defined with a conservative mindset, by assessing “safe navigation”
in terms of maneuverability of vessels. Recommendations to support the implementation of this criterion were provided
to the client.
The combination of all achieved results allowed the COPT to optimize their maintenance dredging strategy, while
keeping sufficient nautical depth. In order to reach greater economic success, the nautical depth criterion needs to be fine-tuned in future works.
Cochin is located in the state of Kerala, in South-West India, close to the busiest international sea routes. The port is
situated in the Cochin lagoon and has natural protection from the sea by two headlands. Between the latter, the “Cochin
Gut” connects the Arabian Sea with the Periyar river system and Kerala’s backwaters (local network of canals both
manmade and natural). The main port facilities are the approach channel, the liquefied natural gas (LNG) and the
International Container Transshipment (ICT) terminals (both for vessels with a maximum draft of 14.5 m) and the
shallower Ernakulam and Matancherry channels (Figure 1).
Figure 1. Location of Cochin Harbour (left lower corner) together with a drawing showing the main geographical
references and the port facilities. C1 to C8, T1 and T2, stations for data acquisition.
The nearshore area outside the Cochin Gut is relatively shallow, reaching a water depth of 5 m at a distance of about
2 km from the shore and gradually deepening to 10 m at 6 km outside the gut. The temperature varies from 23°C to
32.5°C with limited seasonal variation; humidity is high throughout the year. The predominant wind direction during
the Monsoon period (June-September) is W to SW, while during the rest of the year mostly NE winds occur during
morning and W during the evening. The annual rainfall varies from 2500 to 3500 mm which is concentrated during
the Monsoon and induces high river discharges. Tides are semi-diurnal with a maximum amplitude of around 1m. The
wave climate is linked to the Monsoon when wave action can be strong and with prevailing wave directions from NW
to SW. Inside the harbour, wave action is insignificant.
Cochin harbor bottom is muddy; in contrast to most of India’s large ports that haves a rocky bottom. The Suspended
Sediment Concentration (SSC) is high during the Monsoon due to both increased wave action and river discharge, and
the sedimentary input from southward littoral drift. As a consequence, more than 20 million m³ of siltation occurs
annually in the area. Sediment needs to be removed by maintenance dredging. These dredging activities represent a
significant cost to COPT. COPT commissioned the presented study in order to determine means for optimizing the
management of the high siltation rates in the harbor.
The major components of this comprehensive study are:
Desktop study to understand the local situation in detail (discussion lies beyond the scope of this paper).
Information was collected from literature sources (e.g. CWPRS reports), open source databases (e.g. ERA-
INTERIM) and other sources (COPT, DCI, etc.). All information was validated and processed to be usable
for the following stages of the project.
Field data acquisition, data processing and interpretation to understand the system and support the
development of a numerical model. The monitoring strategy was based on the knowledge of the system gained
from the previous desktop study applied to Antea Group’s broad experience on numerical modeling and the
requirements to set them up. Hydrodynamic parameters (wind, waves, currents, tide, discharge), sediment
transport, morphology, rheology and salinity, were collected during an entire year to account for seasonal
variations.
Development of a numerical model to simulate the hydrodynamic conditions (waves, tides and currents) as
well as sediment transport, erosion and siltation processes.
Calibration and validation of the numerical model to subsequently simulate potential scenarios. The scenarios
provided information on the evolution of dredged material after disposal, sediment trapping and siltation
occurrence; they gave a quantitative description of causes and remedies.
Study of the effect of fluid mud on navigation, determining a local nautical depth. For this study nautical
depth was defined from a safety navigation perspective, based on the effect of fluid mud on vessels’
maneuverability in terms of controllability: minimum water depth, draft and under-keel-clearance at which
navigation of ships in existing fluid mud conditions is safe. This conservative approach is part of the classical
definition: ‘the level where physical characteristics of the bottom reach a critical limit beyond which contact
with a ship’s keel causes either damage or unacceptable effects on controllability and manoeuvrability’
(Pianc, 1997). To account for the complex structure, temporal variations of mud layer’s characteristics and
the difficulty to determine a physical limit (Delefortrie and Vantorre, 2016) a dual approach was followed:
The subjective approach was based on more than 50 tests undertaken by senior pilots from Cochin harbour at
the ship simulator from FHR each with different hydrodynamics, fluid mud thickness and rheology hereby
replicating both conditions observed in the field as well as simulating extreme conditions. The approach was based on the results from physical modelling of vessel maneuvering with different UKC levels and from tests
on mud rheology in the towing tank at FHR.
Advise the COPT on how to optimize their maintenance dredging strategy. The findings of all above-
mentioned tasks were applied to refine the existing procedures and gain cost effectivity.
2 DATA ACQUISISION
The project required an in depth knowledge of local environmental conditions. A monitoring campaign was set up to
understand the local hydrologic, meteorological and geological conditions. The outlines of this campaign were
designed during a desk study to identify the optimal (accounting for practical and physical constraints) monitoring techniques and locations. This resulted in a cost-efficient one year long (April 2015 - April 2016) monitoring campaign
where sufficient data in terms of quantity and quality was acquired. The in situ measurements were combined with
remote sensed information, hereby linking the local conditions with regional variations. Monitoring stations were
located in strategic places (offshore, inner estuary as well as upstream in the major fluvial branches) to measure all
boundary conditions and to be able to handle the study area as a closed system.
Current data (velocity and direction) was acquired with bottom mounted Acoustic Doppler Current Profilers (ADCP,
locations C1 to C8 in Figure 1) and validated against public available datasets (ERA-Interim, model of the ECMWF).
Stations C1 to C6 allow gathering information from the main sources of in- and outflow, so the system could be treated like a closed box. Data from stations C7 and C8 represent the offshore conditions. During each of the three seasons
(pre-monsoon, monsoon and post-monsoon) ADCP data was recorded for a minimum of one month.
In tributaries (stations C1 to C5) the instrument (SeaWatch 1200 kHz, Rowe Technologies Inc.) was set to operate
with a higher vertical resolution (0.25 m) which facilitated the calculation of a vertical velocity profile. Velocities were
transformed into discharges by taking the tide-depending wet cross section area into account. This was computed with
the support of data from vessel mounted ADCP’s (SeaProfiler 600 kHz, Rowe Technologies Inc.), gathered as
continuous transects during an entire tidal cycle (once during spring tide and once during neap tide per season, for each
season). At the Cochin Gut (C6) a horizontal ADCP’s (RDI Channelmaster 300 kHz, Teledyne) were mounted on each
shoreline to measure the velocity profile perpendicular to the channel. MATLAB and R scripts were developed to
automatize the processing and validation of the large current measurement datasets (NMEA-string conversion, vector
In the offshore locations (C7 and C8) wave data (height and direction) was acquired as well (SeaWave 600 kHz, Rowe
Technologies Inc.). An analysis of the wave spectrum helped determining the characteristics of the wave climate.
Water level values were logged with tide gauges at stations T1 and T2 (Figure 1).
Meteorological conditions were registered locally from a wind-buoy and a meteorological station and linked with
satellite data to assess the regional situation. A MetPak station (GILL Instruments) was installed at location T2,
measuring wind speed and direction continuously together with air temperature, pressure and humidity. An ultrasonic
wind sensor was mounted at station C7 (on a buoy) to measure the offshore wind conditions.
Bathymetric data was acquired monthly within the harbor with a dual frequency single beam echo sounder (210 kHz
and 33 kHz). In the port of Cochin dual frequency echosounders were used to verify if channel depths match the
requirements for the draft of entering ships. High frequency (200kHz) determines the top of the fluid mud layer, while
low frequencies (33 kHz) are able to penetrate the fluid mud layer partially. It is assumed that the last one reflects on the “hard” bottom. However, the strength of a particular fluid mud and its effects on safe navigation (understood as
possibility of navigating through it) cannot be determined by this procedure. For this study the assessment of fluid mud
(Stema Systems) in combination with rheological monitoring (Figure 2). SILAS software records the full raw signal
received by the echosounder transducer and processes it, providing vertical layering. Fluid mud density was deduced
from the measurements that were undertaken every two months in the harbor with RheoTune® (Stema Systems).
RheoTune is a probe that gravitationally penetrates the fluid mud layer allowing to deduce values of density and yield
stress (depth profiles) by means of a tuning fork. During SILAS surveys, a RheoTune profile was acquired at regular
intervals. SILAR software was fed with the density computed by RheoTune to improve the accuracy of the fluid mud
layer thickness assessment.
Seawards from the harbor, elevation changes were studied with a dual frequency single beam echo sounder (210 kHz
and 33 kHz) for the nearshore and beach profiles for the foreshore and backshore. In order to assess the longshore
sediment transport in this area, two bathymetric beach profiles were measured monthly during spring high tide; each
north and south of the Cochin Gut.
Water samples at surface, mid water column and near bottom were collected by means of Niskin bottles at locations C1 to C8. A sample was obtained for each season at high, mid- and low tide during one neap and one spring tidal cycle.
Simultaneously, an optical back scatter (OBS) probe (OBS3A Campbell Scientific) was used to measure the
conductivity, turbidity and temperature of the sea water. The water samples were analyzed in a laboratory for
conductivity (salinity) and suspended sediment concertation (SSC).
Figure 2. SILAS profile from the middle of the outer channel (left): blue line shows the top of the mud layer, green
line is 1150 gr/L isopic and yellow line is the bottom of the mud layer. Rheotune (right): density (g/L) in blue and yield stress (Pa) in red on the X axis vs Depth (Y axis). Density level oscillate between 1030 and 1200 g/L. The fluid
mud layer presents a thickness of about 5m and yields low reflection energy, indicating a low level of consolidation.
Sediment bed samples were taken from 70 locations (35 within the harbor area and 35 offshore) before and after the
Monsoon by means of a Van Veen grab. Samples were analyzed for grainsize distribution (sieve and hydrometer
analysis).
3 RESULTS AND DISCUSSION
Sea bed sampling campaigns undertaken in the harbour showed that the major component of Cochin harbour’s seabed
is fines (silty material). Right after the Monsoon of 2015, a shift towards sandy material was observed. This effect
could have been enhanced by the limitation of the sampling technique (the Van Veen grab sampler doesn’t sample the
fluid mud layer, but the underlying, sandier material). During the pre-monsoon season, the mud layer is consolidated
and therefore the grab sampler does catch this fraction, which consists of fines. Afterwards, the composition evolved
back towards silty material as a consequence of dredging (removing coarser sediments) and consolidation of suspended particles.
It was observed that siltation is mainly restricted to the Monsoon season. During the pre-monsoon season, nearly no
fluid mud occurs on the inner channel, while merely a reduced amount was observed in the outer channel and LNG
and ICT terminals basins. Within the first weeks of the Monsoon (June), siltation starts in the outer channel where a
fluid mud layer appears. During this season, the thickness of this layer can reach up to 6 - 7 m, observed around 2 km
from Cochin’s harbour gut. Next, siltation starts also in the inner harbour, especially in the ICT terminal basin. In the
inner harbour and both LNG and ICT terminals the fluid mud layer reached around 5 meters thickness. In the
Ernakulam and Mattancherry channels, siltation is significantly lower than in other parts of the harbour. In both areas a thinner layer of fluid mud was observed (1 – 3 m).
Rheological data showed that during the Monsoon, both density and yield stress (resistivity) are lower compared to
the rest of the year. During this period, the yield stress was almost constant over the fluid mud column; in contrast to
locations where a “hard bottom” could be identified. In these places, both density and yield stress increased rapidly.
After the Monsoon, the fluid mud starts consolidating: the thickness of the layer decreases (top side gets deeper) and
its density and yield stress start to increase.
COPT provided a monthly dredged volume value slightly below 2 million m³. Since dredgers operated at a constant
pace, this results in a yearly dredged volume of around 24 million m³ during the studied period of 1.2 year. However,
the effort was not applied equally on the different sections of the area (Figure 3). The dredged volume was highest,
nearly one third of the total (6.6 million m³), in the Approach channel 2 area. This is also the zone were most of the
fluid mud (linked to siltation) was observed and where captains have been reporting significant speed drops (source:
communication with COPT). The second largest dredged volume was taken from the LNG basin (4.4 million m³),
followed by the ICTT terminal and the Approach channel area 1 (3.2 million m³ each). In the inner channel the volume
was 2.4 million m³. Volumes dredged in the outermost part of the channel and the Mattancherry and Ernakulam
channels are around 1 to 1.5 million m³; the smallest of all.
Figure 3. Section in which the study area was divided (above) and cumulative monthly dredged volumes (below)
during the monitoring period, from April 2015 to June 2016 based on bathymetric and dredged data
3.1 Numerical modelling
3.1.1 Hydrodynamics
The TELEMAC-MASCARET suite in combination with DELWAQ (part of the D3D suite) was used for the numerical
modelling. Three components of the TELEMAC-MASCARET suite were coupled for the simulations: TELEMAC 2D
module (Hervouet and Bates, 2000) for hydrodynamic calculations, the TOMAWAC module (Benoit et al., 1996) for
calculating the wave propagation and the SISYPHE for sediment transport and morphology. DELWAQ (Kopmann
and Goll, 2013) was used to model sediment transport and morphology under influence of dredging and disposal works.
The goal was to reproduce the surveyed morphological changes, associated to siltation, through numerical modelling.
The application of finite elements allowed focusing the model in the most relevant areas. After the first iterations,
conditions related to higher siltation (Monsoon) were studied in detail.
Wave modelling was executed in two steps: the simulation of a Regional Model (200x500km) and the Local Model
(25km radius, Figure 4). The objective of the regional model was to determine the boundary conditions for the local
model. After calibration, the local model reproduced, both qualitatively and quantitatively, the observed wave activity,
water levels and flow currents.
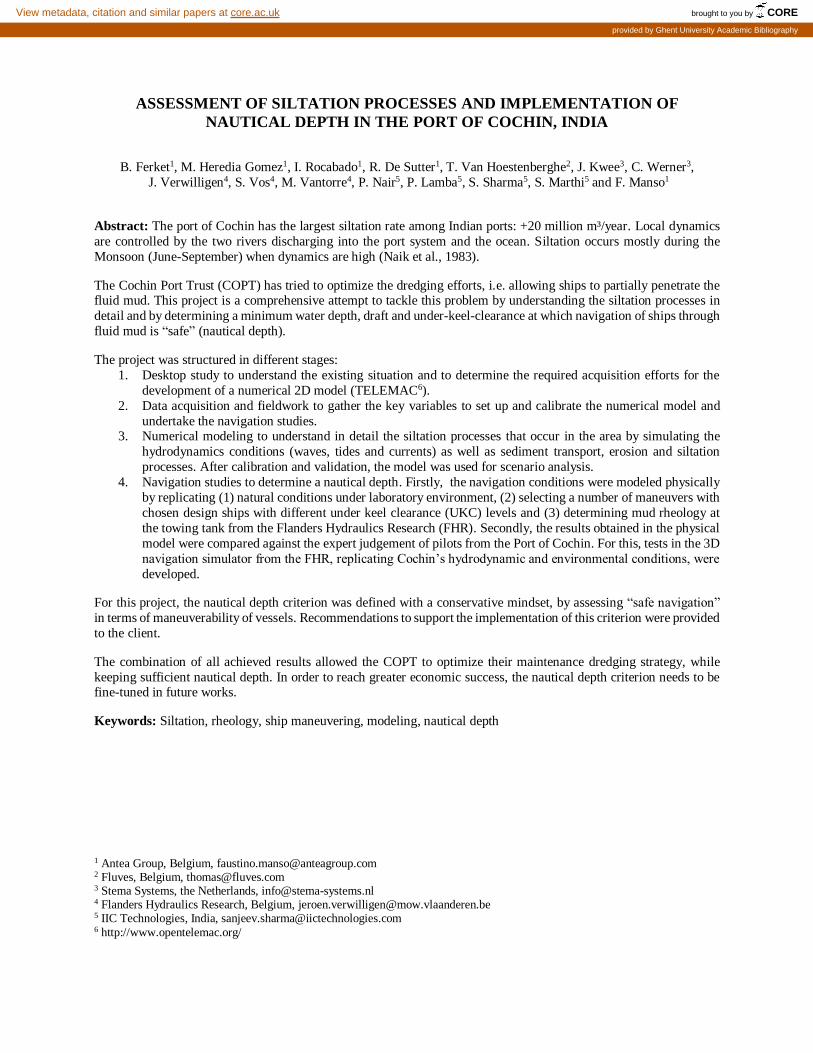
In the harbour area, the model provided information on the direction and magnitude of flow currents (Figure 5). These
currents are dominated by the tidal activity and, to a lesser extent, by the upstream river discharge. High currents were
observed at the gut (harbour entrance) during flood and ebb phases. Eddy circulation, result from the interaction
between currents and waves, was observed in the area close to the port entrance and navigation channel. Horizontal
eddies were also observed in the inner harbour, close to the ICT and LNG terminals. In the offshore area, the model
reproduced the tidal dominated north-south flow patterns, along the coastline; south during ebb and north during flood.
Figure 4. Mesh applied for hydro and sediment transport (left) computations of the local model together Bathymetry (right). A and B Regional Model, C and D Local Model. E is a zoom of Cochin system bathymetry
Figure 5. simulated currents during Spring tide maximum flood flow
(max current velocity around 0,9 m/s -1.75 kts- in the inner channel)
3.1.2 Sediment transport and disposed sediment
The calculated flow patterns were applied to model the sediment transport. The model was able to reproduce
qualitatively the observed sedimentation patterns and confirmed the hypotheses based on the hydrodynamic modelling:
Areas with low flow velocities present high sedimentation. These areas correspond to the ICT and LNG terminals and
the navigation channel. Other areas in the inner harbor also presented sedimentation, but in smaller proportion.
Quantitatively speaking, the modeled sedimentation was of the same order of magnitude as the measured one, both for
suspended sediment concentrations and bed load transport. Regarding the origin of the sediment, material is entrained
in the offshore area and transported towards the navigation channels and inside the harbor.
From the three possible siltation management strategies “Keeping Sediment Navigable”, by means of the nautical
depth criterion and optimizing management operations, was selected as preferable option from a return on investment
point of view. The other options were: “Keeping Sediment Out” (i.e. sediment traps along the outer channel or Placing
a current deflection wall - CDW ) and “Keeping Sediment Moving” (between the ICT terminal and Cochin Gut).
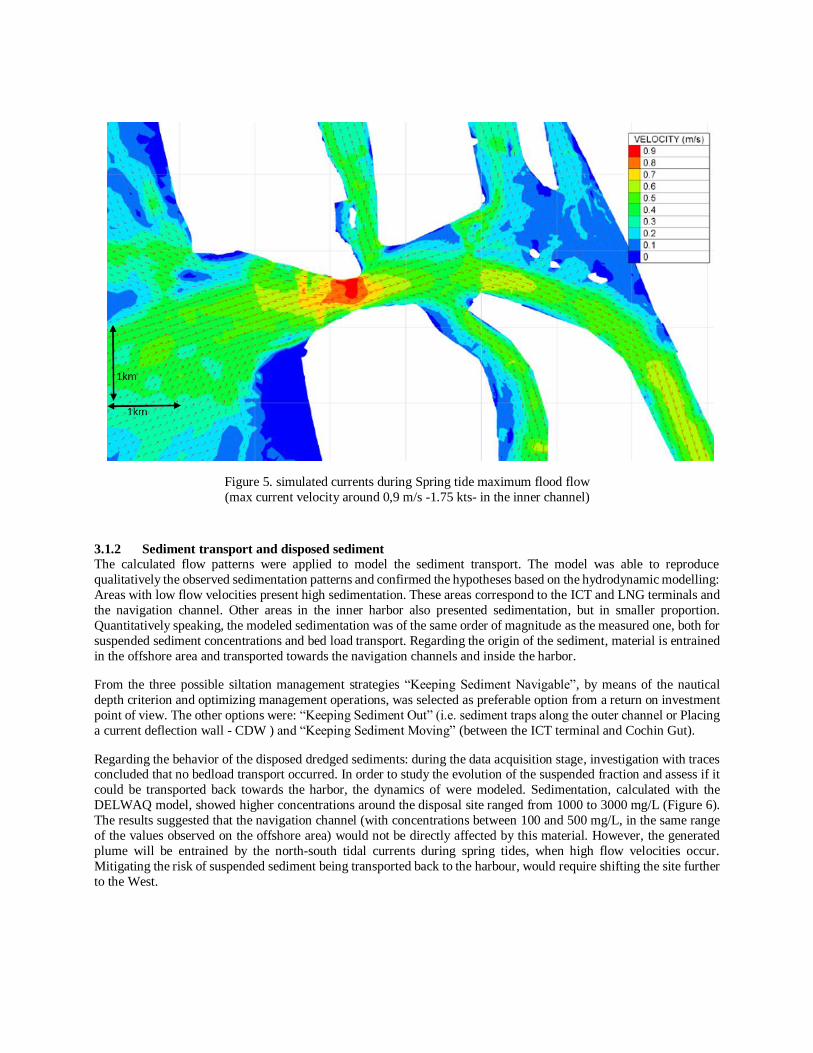
Regarding the behavior of the disposed dredged sediments: during the data acquisition stage, investigation with traces concluded that no bedload transport occurred. In order to study the evolution of the suspended fraction and assess if it
could be transported back towards the harbor, the dynamics of were modeled. Sedimentation, calculated with the
DELWAQ model, showed higher concentrations around the disposal site ranged from 1000 to 3000 mg/L (Figure 6).
The results suggested that the navigation channel (with concentrations between 100 and 500 mg/L, in the same range
of the values observed on the offshore area) would not be directly affected by this material. However, the generated
plume will be entrained by the north-south tidal currents during spring tides, when high flow velocities occur.
Mitigating the risk of suspended sediment being transported back to the harbour, would require shifting the site further
to the West.
Figure 6. Example of modelled sediment plume caused by dredge disposal (above) for a neap. tide (below) when
flow currents moves towards west direction. The highest SSC are constrained in the ‘elliptical’ zone that does not
grow further, indicating that sediment in suspension from the disposal of sediments moves according to the tidal
activity of the offshore area
3.2 Navigation modelling
Fluid mud layer thickness and UKC had an important influence on vessel’s speed, particularly in case of mud
penetration. The smaller the UKC, the lower the speed at constant rpm-values. The behavior of deep-drafted vessels
navigating Cochin’s muddy waters was physically investigated at FHR’s towing tank (Figure 7). The bottom of the
tank was covered with simulated mud layers with different characteristics: density between 1100 and 1260 kg/m³;
viscosity between 0.03 and 0.46 Pa.s; layer thickness between 0.75 and 3.0 m. Based on these tests mathematical
maneuvering models were derived for slender hull forms (e.g. container ships, general cargo) and full hull forms (e.g.
bulk carriers, tankers).
The mathematical maneuvering models were implemented in the real time simulator from FHR (Figure 7) to determine
practical the operational limits for navigation under such conditions. Critical navigation maneuvers types were carried
out with selected ship by local Cochin pilots. The selected vessels are presented in Table 1. The bridge simulator was
programed with a 3D visualization model of the Cochin harbor containing the port infrastructure, signalization and the
most important landmarks. A recent bathymetry of the solid bottom was also uploaded.
Representative observed fluid mud conditions (density, viscosity and layer thickness) were selected for simulation
analyses. Twelve combinations of layer thickness, density, viscosity and water depth (in function of tide) were applied. Four current vector fields deduced from the numerical model (TELEMAC) were also implemented. The prevailing
wind conditions were taken into account applying a uniform wind field. During the simulation runs, a ship could only
be assisted by maximum six tug boats, which were controlled by an operator, allowing to perform push-pull operations.
The tug types (ASD and Voith-Schneider) and bollard pull was selected in agreement with COPT.
Table 1. Ship models used for the navigation simulations
Boat type Length (m) draft (m)
container carrier 335 14,5
Tanker 250 12,5
cargo vessel 250 10,7
cargo vessel 180 9,1
The simulation program consisted of six simulation days divided in two sessions of three days with at least three weeks
between the end of the first and the start of the second session. This period allowed FHR to define the simulation
program for the second session and to make minor changes to the simulated environment if necessary. The simulations
were performed by at least two pilots experienced with the design vessels in the port of Cochin. In order to assess the acceptability of the simulations, the simulations have been analyzed based on trajectory plots, application of rudder,
propeller, bow thruster and tug boats and on comments of pilots during the simulation. The following results were
observed in these tests:
In case of important mud penetrations (7% of draft and deeper), the difficulty of the manoeuvre increased for
higher viscosities and densities of the mud layer
Increasing viscosity and density of the mud layer required applying higher rpm values to reach an acceptable
speed for each manoeuvre. Limit conditions, when it was not possible reaching or maintaining a required
speed, were achieved. This limit condition was observed in the outer channel by inbound tanker sailing through the heaviest mud at a keel penetration of 9% of draft. Reduced sailing speed was never a safety issue,
but pilots stated that “both shipping company and vessel’s captain did not tolerate large decelerations”. Slow
sailing represents also an operational problem for the harbour.
Regarding specific harbour conditions, none of the simulations led to an unacceptable outbound manoeuvring
behaviour if tug assistance was available; with the exception of manoeuvres from the container terminal at
flood tide. For these, a customised manoeuvring protocol had to be developed.
Figure 7. FHR set ups used in this study. A) Towing channel with a detail image of a model vessel and the sensors
used for the measurements; B) bridge simulator resembling Cochin’s conditions
3.3 Nautical depth
Based on the nautical modelling described in the previous paragraph, having safety of navigation as top priority, the
nautical depth was defined as the shallowest depth with the following safety limits:
1- Maximum penetration of the keel in the mud-water interface: 12% of the ship’s draft.
2- Minimal UKC: 10% of the ship’s draft above the solid bottom.
3- Maximum density of the fluid mud: 1170 kg/m³ (corresponding to acceptable level of mud yield strength
and to the maximum mud strength tested during the simulations).
Condition 1 and 2 can be assessed with the use of a high resolution sub bottom profiler. Condition 3 can be assessed
with the use of a mud density probe, similar to the one used for this study.
The determined nautical depth criterion requires fine tuning by further research, including more field experiments.
Possible further studies proposed to COPT were:
Detailed analysis of space and time variations of the mud strength;
Determination of the mud-water interface based on alternative methods to determine an alternative criterion
based on ship navigability in the outer channel
Detailed study of timing for optimizing mud conditioning activities
4 RECOMMENDATIONS
The combination of all results from the study allowed the elaboration of recommendations for COPT to optimize their
dredging maintenance efforts. It was also mentioned that the real impact on “the bottom line” will be the result of fine tuning the nautical depth criterion.
The top recommendation is the application of a nautical depth criterion as part of the existing management practices
for safe accessibility to the port. This will determine:
In the offshore part of the outer channel: Additional dredging would be required for container vessels.
In the nearshore part of the outer channel: Additional dredging would be required for container vessels
tanker/cargo vessels during the Monsoon.
In the inner channel: Additional dredging would be required for container and tanker/cargo vessels during the
Monsoon. The northern part of the sand bar in the Cochin Gut should be dredged a bit deeper.
In the LNG terminal: Less dredging effort is required.
In the ICT terminal: Small reduction in dredging effort could be applied. The nautical depth criteria were
fulfilled in the access channel and near the berth.
In the Ernakulam and Mattancherry channels: Additional dredging would be required.
Scheduling certain critical manoeuvres during high tide windows would alleviated the need for additional
dredging.
The areas with higher siltation (the outer channel, especially the nearshore part with shallow surrounding coastal area
and both the LNG and ICT terminals basins) act as sediment traps. Due to being slightly over-dredged, their sediment
trapping efficiency is maintained. Bearing in mind the seasonally controlled dynamics of the area, dredging procedures
can be optimised; especially for these areas. This will reduce the maintenance cost and their sediment trapping
potential:
During Pre-Monsoon: Trailing suction hopper dredging (TSHD) near the hard bottom to remove the
consolidated mud.
During Monsoon and post-Monsoon: TSHD to remove the denser part of the fluid mud combined with water
injection dredging (WID) below the nautical depth to support navigability and allow the current to flush the
sediment out of the harbour.
Regarding the dredged material: shifting the disposal site to the West mitigates the risk of suspended sediment being
transported back to the harbour, is not recommended. Results prove that due to the low concentrations and deposition
of the disposed material that reaches the port, the relocation of the disposal site will not compensate the increase of
operational cost due to added sailing time.
5 CONCLUSIONS
After understanding the local conditions and acquiring the right data, it is possible to develop numerical models for
sediment transport and morphology from harbours with very high siltation problems. Qualitatively, these models are
an all-in-one tool to tackle all issues at once: source and causes of siltation, evolution of disposed material as well as
evaluation of scenarios to assess the viability of potential solutions. Quantitatively, the modeled results are acceptable
within the intrinsic uncertainty of the empirical formulations for sediment transport modelling.
The high siltation rates occurring in Cochin harbour is related with sediment coming from the sea-side. 95% of the
siltation in the port of Cochin are marine originated. During the Monsoon, sediment is entrained by currents and waves
and transported to the channels, which act as sediment traps. Through the Cochin Gut, sediment is transported towards
the inner harbour along with the flood currents, causing again siltation of the channels, ICT and LNG terminals. The
capacity to understand the physical processes of siltation allowed for recommending a remediation.
From all possible strategies to tackle this issue, “Keeping Sediment Navigable” is the most suitable one. Assessing for
a nautical depth for the Port of Cochin, monitoring and maintenance methods were investigated, as well as the
implications for dredging.
Having the right set ups, nautical depth can be determined both subjective (simulation with a human operator) and
objective (towing tank with laboratory controlled conditions). Fine tuning of the initial result is critical to reach the
outmost possible optimization. For Cochin, nautical depth was determined by:
1- Maximum penetration of the mud-water interface: 12% of the ship’s draft.
2- Minimal UKC: 10% of the ship’s draft above the solid bottom.
3- Maximum density of the fluid mud: 1170 kg/m.
For implementing a nautical depth criterion, fluid mud monitoring requires using a sub bottom profiler in combination
of a mud density probe instead of the broadly applied dual frequency echo sounder approach. Proceeding on this way,
variations in mud strength are taken into consideration.
As a result of the comprehensive study, recommendations on optimizing the harbor dredging strategy, while still
maintaining a safe nautical depth, can be listed. The need for dredging can be determined based on the nautical depth criteria in combination with a mix of dredging techniques strategy. For the case of Cochin, combining mud
conditioning, which is a relatively cheap method, and removal of higher density material near the solid bottom.
ACKNOWLEDGEMENTS
IIC Technologies, Antea Group, Stema Systems and Flanders Hydraulics Research would like to acknowledge COPT
for this interesting and challenging job opportunity and their cooperation throughout the project.
REFERENCES
Benoit M., Marcos F. and Berq F. (1996). Development of a third generation shallow-water wave model with
Delefortrie G. and Vantorre M. (2016). Ship Manoeuvring behaviour in muddy navigation areas: State of the art. 4th MASHCON, Hamburg, Germany.
Hervouet J. and Bates P. (2000). The TELEMAC modeling system. Hydrological Processes, Special issue, 14 (13),
2207-2208.
Kopmann R. and Goll A. (2013). Interactive Coupling of TELEMAC with the Open Source Water Quality Model DELWAQ. Proceedings XXth TELEMAC-MASCARET User Conference 2013, BAW, Karlsruhe, Germany, 143-148.
Naik A.S., Kanhere V.N. and Vaidyaraman, P.P. (1983). Effect of salinity on siltation in the Cochin port. Int. Conf.
on Coastal and Port Engineering in Developing Countries, Colombo, Sri Lanka, p. 1148-1162
PIANC (1997). Approach channels – A guide for design. Final report of the joint Working Group PIANC and IAPH,
in cooperation with IMPA and IALA. Supplement to PIANC Bulletin 95. 108p.