N.º 28 - Diciembre 2007 87 Revista de Teledetección.ISSN: 1133-0953. 2007. 28: 87-96 Assessment of TERRA-ASTER and RADARSAT imagery for discrimination of dunes in the Valdes peninsula: an object oriented approach P. D. Blanco 1 , G. I. Metternicht 1 , H. F. del Valle 2 y W. Sione 3,4 [email protected](1) Centro Nacional Patagónico-CONICET, Boulevard Brown 2825, U9120ACF, Pto Madryn, Argentina (2) School of Natural and Built Environments, University of South Australia, 5095, Mawson Lakes, SA (3) CEREGeo-FCyT/UADER, Ruta 11 Km 10, 3100, Oro Verde, Entre Ríos,Argentina (4) PRODITEL-Universidad Nacional de Luján, Cruce rutas ex. 5 y 7, 6700, Luján, Bs As, Argentina Recibido el 4 de diciembre de 2007, aceptado el 15 de enero de 2008 RESUMEN Areas como Península Valdés (Patagonia Argentina), Patrimonio de la Humanidad desde 1999, están sujetas a degradación del suelo por acción eólica y sobrepas- toreo. La cartografía de indicadores de degradación del paisaje, como dunas activas activas y estabiliza- das, es crucial para mejorar la predicción, monitoreo y manejo de suelos afectados. Este trabajo compara clasificaciones basadas en el objeto y en el píxel para la discriminación de dunas activas y estabilizadas, y evalúa las diferencias en la fiabilidad de la clasifica- ción al usar la sinergía de ASTER y Radarsat. PALABRAS CLAVE: segmentación multi-resolu- ción, clasificación orientada al objeto, Terra-ASTER, Radarsat-ASAR, Patagonia. ABSTRACT Areas like the Peninsula Valdes (Patagonia Argen- tina), declared a World Heritage site in 1999, are sub- ject to soil degradation by wind and overgrazing. Mapping landscape degradation indicators such as sta- bilized and active dunes is critical to improve predic- tion, monitoring and planning of areas threatened by sand encroachment. To this end, this paper investigates the contribution of optical sensors like the Terra- ASTER and the microwave Radarsat ASAR to the dis- crimination of these land degradation features. KEY WORDS: multi-resolution segmentation, object- oriented classification, Terra-ASTER, Radarsat- ASAR, Patagonia. INTRODUCTION Arid and semiarid drylands compose nearly a one- third of the land surface of the world (OIES, 1991). It is estimated that 50% to more than 70% of these areas are degraded as a result of overgrazing, aggra- vated by the characteristics of dryland climates (Wa- rren & Agnew, 1988). Areas like Península Valdés (southern Argentina), declared a UNESCO World Heritage site in 1999, are subject to soil degradation by wind and overgrazing. Mapping and monitoring the presence of landscape degradation indicators such as stabilized and active dunes is crucial to im- prove prediction, and for monitoring and planning of areas threatened by sand encroachment. Satellite remote sensing is an effective tool for map- ping landforms in a rapid and accurate manner. Vi- sible-infrared (VIR) data can be used to discriminate active and stabilized dunes based on the distinctive reflectance values of light-colored sands (proper of active dune areas) and dark-colored vegetation, which produce significant tonal differences in the re-
Transcript
N.º 28 - Diciembre 2007 87
Revista de Teledetección.ISSN: 1133-0953. 2007. 28: 87-96
Assessment of TERRA-ASTER and RADARSATimagery for discrimination of dunes in the Valdespeninsula: an object oriented approach
P. D. Blanco1 , G. I. Metternicht1, H. F. del Valle2 y W. Sione3,4
(1) Centro Nacional Patagónico-CONICET, Boulevard Brown 2825, U9120ACF, PtoMadryn, Argentina
(2) School of Natural and Built Environments, University of South Australia, 5095,Mawson Lakes, SA
(3) CEREGeo-FCyT/UADER, Ruta 11 Km 10, 3100, Oro Verde, Entre Ríos, Argentina(4) PRODITEL-Universidad Nacional de Luján, Cruce rutas ex. 5 y 7, 6700, Luján, Bs
As, Argentina
Recibido el 4 de diciembre de 2007, aceptado el 15 de enero de 2008
RESUMEN
Areas como Península Valdés (PatagoniaArgentina),
Patrimonio de la Humanidad desde 1999, están sujetas
a degradación del suelo por acción eólica y sobrepas-
toreo. La cartografía de indicadores de degradación
del paisaje, como dunas activas activas y estabiliza-
das, es crucial para mejorar la predicción, monitoreo
y manejo de suelos afectados. Este trabajo compara
clasificaciones basadas en el objeto y en el píxel para
la discriminación de dunas activas y estabilizadas, y
evalúa las diferencias en la fiabilidad de la clasifica-
ción al usar la sinergía de ASTER y Radarsat.
PALABRAS CLAVE: segmentación multi-resolu-
ción, clasificación orientada al objeto, Terra-ASTER,
Radarsat-ASAR, Patagonia.
ABSTRACT
Areas like the Peninsula Valdes (Patagonia Argen-
tina), declared a World Heritage site in 1999, are sub-
ject to soil degradation by wind and overgrazing.
Mapping landscape degradation indicators such as sta-
bilized and active dunes is critical to improve predic-
tion, monitoring and planning of areas threatened by
sand encroachment. To this end, this paper investigates
the contribution of optical sensors like the Terra-
ASTER and the microwave RadarsatASAR to the dis-
crimination of these land degradation features.
KEYWORDS: multi-resolution segmentation, object-
oriented classification, Terra-ASTER, Radarsat-
ASAR, Patagonia.
INTRODUCTION
Arid and semiarid drylands compose nearly a one-
third of the land surface of the world (OIES, 1991).
It is estimated that 50% to more than 70% of these
areas are degraded as a result of overgrazing, aggra-
vated by the characteristics of dryland climates (Wa-
rren & Agnew, 1988). Areas like Península Valdés
(southern Argentina), declared a UNESCO World
Heritage site in 1999, are subject to soil degradation
by wind and overgrazing. Mapping and monitoring
the presence of landscape degradation indicators
such as stabilized and active dunes is crucial to im-
prove prediction, and for monitoring and planning
of areas threatened by sand encroachment.
Satellite remote sensing is an effective tool for map-
ping landforms in a rapid and accurate manner. Vi-
sible-infrared (VIR) data can be used to discriminate
active and stabilized dunes based on the distinctive
reflectance values of light-colored sands (proper of
active dune areas) and dark-colored vegetation,
which produce significant tonal differences in the re-
N.º 28 - Diciembre 200788
mote sensing imagery (e.g., Paisley et al., 1991).
SyntheticAperture Radar (SAR), in contrast to VIR,
is an active form of remote sensing. Radar images
have the potential to provide information on the ge-
ometry of sand dunes and other aeolian features be-
cause of the radar sensitivity to changes in the
structure of surficial features (Blumberg, 1998).
Thus, by merging optical and radar data, an additio-
nal portion of the spectrum is available, which may
improve classification.
Classification based on individual pixels is gene-
rally unsatisfactory for arid landforms that often
consist of highly variable mixtures of scattering ob-
jects, and are largely distinguished by their spatial,
besides their spectral, characteristics. Hence, much
information is contained in the relationship between
adjacent pixels, including shape, texture, relational
and contextual information, which allows for iden-
tification of individual objects as opposed to single
pixels (Thomas et al., 2003). Pixels are aggregated
into image objects by segmentation, which is defi-
ned as the division of remotely sensed images into
discrete regions or objects that are homogenous with
regard to spatial or spectral characteristics (Ryherd
& Woodcock, 1996). Object-based segmentation and
image classification techniques are receiving incre-
asing attention for widespread application to the
classification of visible, infrared and microwave data
(e.g., Laliberte et al., 2007). To this end, in this rese-
arch we aimed to:
(1) Map active and inactive dunes by using
visible/infrared sensors like the Advanced Space-
borne Thermal Emission and Reflection Radiometer
(ASTER) on-board the Terra platform;
(2) Assess accuracy improvements in the detection
of dunes by incorporating microwave Radarsat SAR
data; and
(3) Compare the results of a per pixel classification
against an object-oriented approach for the mapping
of active and stabilized dunes.
METHODOLOGY
Study area
Our study was conducted in Península Valdés (lat
42º32’S, 63º54’W), Patagonia Argentina (Fig. 1).
The climate is semiarid, with an annual mean tempe-
rature of 13ºC, and average annual rainfall of 231 m.
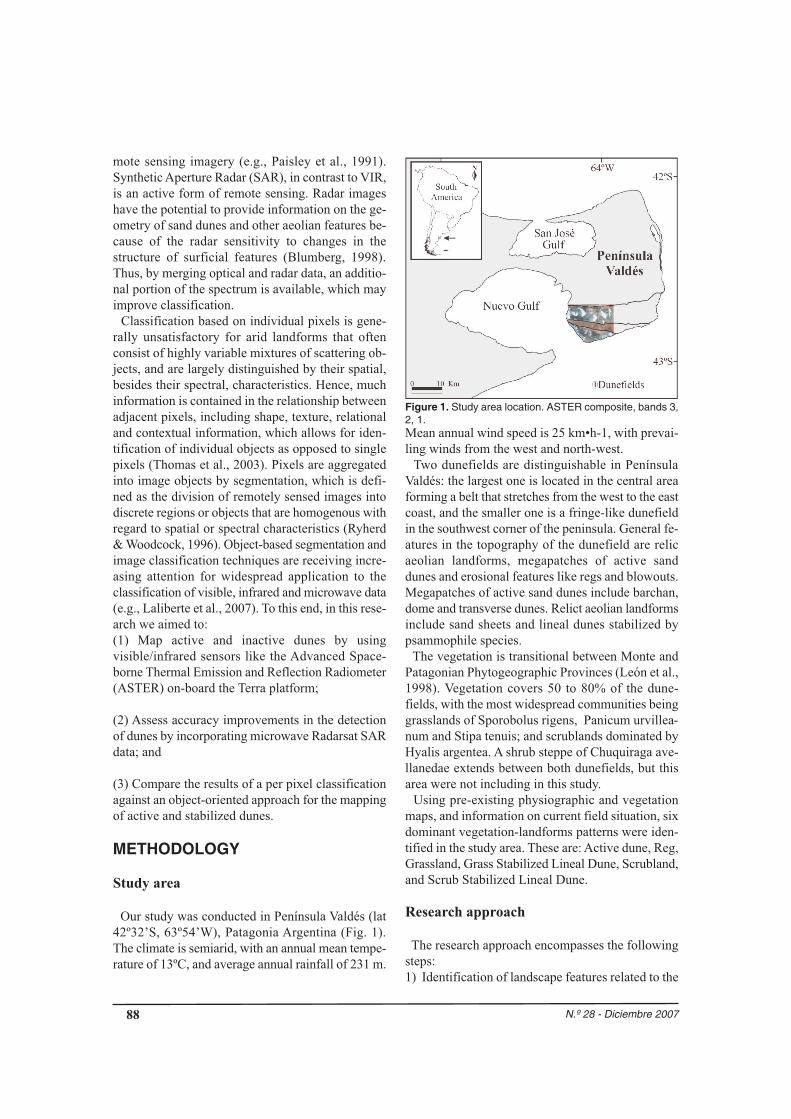
Figure 1. Study area location. ASTER composite, bands 3,2, 1.Mean annual wind speed is 25 km•h-1, with prevai-
ling winds from the west and north-west.
Two dunefields are distinguishable in Península
Valdés: the largest one is located in the central area
forming a belt that stretches from the west to the east
coast, and the smaller one is a fringe-like dunefield
in the southwest corner of the peninsula. General fe-
atures in the topography of the dunefield are relic
aeolian landforms, megapatches of active sand
dunes and erosional features like regs and blowouts.
Megapatches of active sand dunes include barchan,
dome and transverse dunes. Relict aeolian landforms
include sand sheets and lineal dunes stabilized by
psammophile species.
The vegetation is transitional between Monte and
Patagonian Phytogeographic Provinces (León et al.,
1998). Vegetation covers 50 to 80% of the dune-
fields, with the most widespread communities being
grasslands of Sporobolus rigens, Panicum urvillea-
num and Stipa tenuis; and scrublands dominated by
Hyalis argentea. A shrub steppe of Chuquiraga ave-
llanedae extends between both dunefields, but this
area were not including in this study.
Using pre-existing physiographic and vegetation
maps, and information on current field situation, six
dominant vegetation-landforms patterns were iden-
tified in the study area. These are:Active dune, Reg,
1) Identification of landscape features related to the
N.º 28 - Diciembre 2007 89
presence of active and stabilized dunes. Two vege-
tation types are considered as dune stabilizers: scrub
and grass;
2) Calibration and georeferencing of the Terra-
ASTER imagery, including the computation of spec-
tral indices and principal component analysis for the
removal of redundant spectral information;
3) Despeckle and georeferencing of a precision
mode Radarsat imagery;
4) Creation of a geo-spatial soil database to store
field observations and spectral characteristics of
wind-erosion related features in the optical and mi-
crowave regions of the spectrum;
5) Extraction of Radarsat derived textural measu-
res;
6) Classification of the selected imagery using a per-
pixel maximum likelihood algorithm in ERDAS
Imagine software;
7) Segmentation and object-oriented classification
using eCognition software;
8) Accuracy evaluation of the resulting classifica-
tions using error matrices and Kappa sta-tistics.
Image pre-processing
The ASTER level 1B scene was acquired on 27th
November 2004, georeferenced to a UTM projec-
tion, WGS-84 ellipsoid, and converted to radiance
values. ASTER acquires data in 3 separate subs-
ystems: VNIR (bands 1, 2, 3, SR=15 m), SWIR
(bands 4-9, SR=30 m), and TIR (bands 10-14,
SR=90 m). Given the high correlation between
bands (above 0.9) a PCA was applied to remove re-
dundant information. The first two components ex-
plained 98% of the image variability, and thus they
were selected for further analysis. The ASTER
VNIR and SWIR band 4 showed the highest contri-
bution to these first two components, and thus were
selected as the raw bands to be included in the clas-
sification process. The Soil Adjusted Vegetation
Index (SAVI), designed to minimize the effect of the
soil background (Huete 1988), was computed as a
means to gather information on vegetation cover.
SAVI was applied to the ASTER data set using the
following equation:
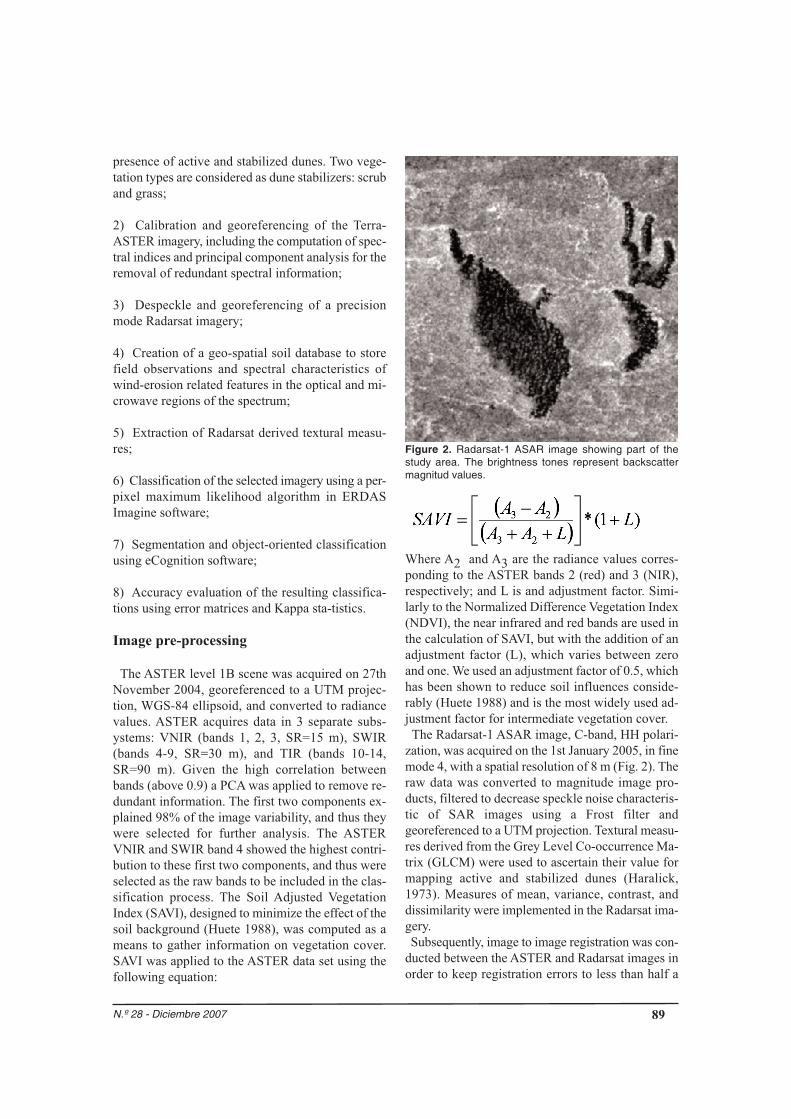
Figure 2. Radarsat-1 ASAR image showing part of thestudy area. The brightness tones represent backscattermagnitud values.
Where A2 and A3 are the radiance values corres-
ponding to the ASTER bands 2 (red) and 3 (NIR),
respectively; and L is and adjustment factor. Simi-
larly to the Normalized Difference Vegetation Index
(NDVI), the near infrared and red bands are used in
the calculation of SAVI, but with the addition of an
adjustment factor (L), which varies between zero
and one. We used an adjustment factor of 0.5, which
has been shown to reduce soil influences conside-
rably (Huete 1988) and is the most widely used ad-
justment factor for intermediate vegetation cover.
The Radarsat-1 ASAR image, C-band, HH polari-
zation, was acquired on the 1st January 2005, in fine
mode 4, with a spatial resolution of 8 m (Fig. 2). The
raw data was converted to magnitude image pro-
ducts, filtered to decrease speckle noise characteris-
tic of SAR images using a Frost filter and
georeferenced to a UTM projection. Textural measu-
res derived from the Grey Level Co-occurrence Ma-
trix (GLCM) were used to ascertain their value for
mapping active and stabilized dunes (Haralick,
1973). Measures of mean, variance, contrast, and
dissimilarity were implemented in the Radarsat ima-
gery.
Subsequently, image to image registration was con-
ducted between the ASTER and Radarsat images in
order to keep registration errors to less than half a
N.º 28 - Diciembre 200790
pixel. To this end, a nearest neighbour resampling
algorithm and output pixel size of 8 m were used.
Bands 1 to 4 from the ASTER and the selected Ra-
darsat-derived texture measures were stacked into
one single image for a multi-sensor analysis
(ERDAS, 2003).
Pixel based classification
For the pixel based classification, a standard maxi-
mum likelihood classifier as featured in the software
Erdas Imagine was used. The functionality of the
pixel-based classification is not explained here in de-
tail, but it can be found in standard image processing
textbooks like Chuvieco (2002). The number of trai-
ning pixels was 486 for Active Dunes, 279 for Reg,
243 for Grassland, 252 for Scrubland, and 558 and
531 for Lineal Dunes Stabilized by Grass and Scrub,
respectively.
Object-oriented approach
The procedure outlined in Figure 3 can be divided
into two major parts. First, the multi-segmentation
of the input data is performed. This procedure gene-
rates highly homogeneous segments in a selectable
resolution and of a comparable size. Classification is
then performed using those objects rather than single
pixels. The classification of the image objects can
be performed by using nearest neighbour classifiers
based on user selected samples or by using fuzzy
membership functions (Zadeh, 1965), with user-de-
fined rules. A fuzzy membership ranges from 0 to 1
for each object’s feature values with regard to the
object’s assigned class. Spectral, shape, and statisti-
cal characteristics as well as relationships between
linked levels of the image objects can be used in the
rule base to combine objects into meaningful classes
(Benz et al. 2004).
Two image segmentation trials were implemented
using different input data sets (Table 1).The first trial
used the four raw ASTER bands (1 to 4); whereas
the second integrated spectral and texture informa-
tion (i.e. mean, variance, contrast and dissimilarity
co-occurrence texture images) derived from Radar-
sat data. The object oriented approach considers
three parameters for image segmentation, namely
scale, colour/shape ratio, and smoothness/compact-
ness ratio. The weights for colour and shape were
established after several iterations to a ratio of
0.8:0.2 for the relative importance of colour versus
shape, and 0.1:0.9 for compactness versus smooth-
ness.
The image classification followed a three-levels ap-
proach (Figure 4), whereby the third level, segmen-
ted on the coarse scale, used a SAVI threshold for
the separation of broader land covers (e.g. objects
with a SAVI of less than 0.74 were considered to be
dune fields; whereas objects with digital numbers
above 0.74 were classed as Shrub Steppe).A separa-
tion amongst the classes Grassland, Scrubland and
Areas Not-Vegetated was achieved using a nearest
neighbour classification, based on the training cho-
sen in the SAVI feature space. The second level
aimed at identifying active dunes by defining fuzzy
membership functions for mean brightness values,
related to the input data of each trial (Table 1). Two
subclasses of the Active Dune, namely AD-1 and
AD-border, were defined. Then, an object fusion
was applied to group the objects of these classes
under the general class, active dunes. The Reg class
was considered complementary to actives dunes.
Lastly, the first level was designed to extract areas
of stabilized dunes. To this end, we discriminated
between dunes stabilized by grass and dunes fixed
by scrub, defining the classes GSD-1 and SSD-1
based on membership functions for mean brightness
values. Because these classes had similar brightness
values and could be confused with other classes, we
established a restriction on the shape of the seg-
ments: the length/width ratio should be bigger than
four. In order to integrate wrongly excluded objects
two new subclasses were defined, GSD-border and
SSD-border, which had the brightness feature space
broader but with the constraint that the relative bor-
der length to GSD-1 and SSD-1, respectively, was
greater than one. The Grassland and Scrubland clas-
ses were defined as complementary of those classes,
respectively.
Accuracy assessment
The accuracy assessment was done by means of an
error matrix based on stratified and randomly selec-
ted sites across the study area. The ground truthing
was carried out by field survey in the summer of
2005 visiting as many sites as possible, and confir-
ming the vegetation-landform type in situ with aTable 1. Input datasets used in the trials.
N.º 28 - Diciembre 2007 91
Figure 3. Conceptual model of the object oriented approach adopted in this study.
Figure 4. Fuzzy membership functions for all the classes. BR denotes brightness, L to W means the ratio Length/Widthand RB is the relation of border to a certain class.
N.º 28 - Diciembre 200792
Global Positioning System (GPS) unit. At each va-
lidation site, an area of 45 by 45 m was examined, to
account for location errors caused by positional in-
accuracies of the GPS and/or the geometric correc-
tion of the satellite imagery. The number of
validation pixels was 729 for Active Dune, 414 for
Reg, 369 for Grassland, 360 for Scrubland, and 837
and 792 for Lineal Dunes Stabilized by Grass and
Scrub, respectively.
Error matrices were used as the basis for calcula-
ting the overall accuracy, individual class user’s and
producer’s accuracy, KHAT statistic and its variance
(an estimate of the kappa coefficient) (Congalton,
1991). The efficiency of the synergistic approach
was evaluated with a kappa analysis. KHAT statistic
and its variance were used to construct a hypothesis
test for statistically significant difference between
error matrices (Cohen, 1960), being the null hypo-
thesis that there is no disagreement between the
KHAT values.
DISCUSSION OF RESULTS
Per pixel classification of the ASTER data
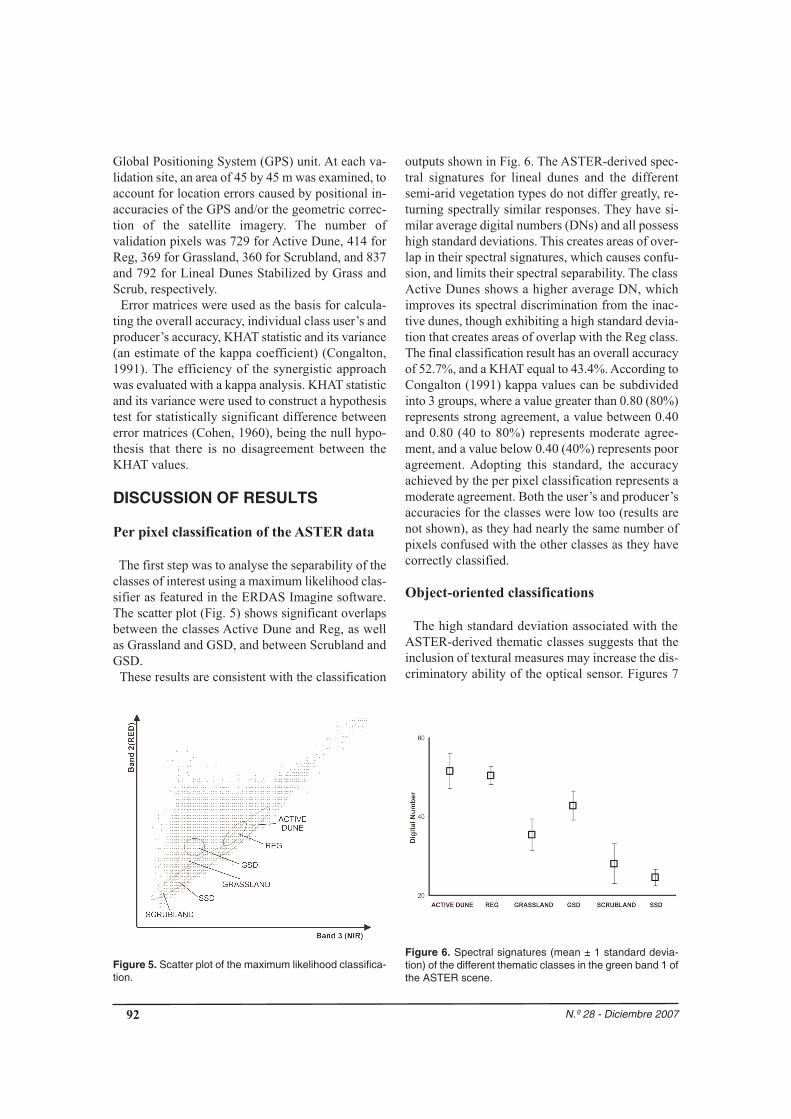
The first step was to analyse the separability of the
classes of interest using a maximum likelihood clas-
sifier as featured in the ERDAS Imagine software.
The scatter plot (Fig. 5) shows significant overlaps
between the classes Active Dune and Reg, as well
as Grassland and GSD, and between Scrubland and
GSD.
These results are consistent with the classification
Figure 5. Scatter plot of the maximum likelihood classifica-tion.
Figure 6. Spectral signatures (mean ± 1 standard devia-tion) of the different thematic classes in the green band 1 ofthe ASTER scene.
outputs shown in Fig. 6. The ASTER-derived spec-
tral signatures for lineal dunes and the different
semi-arid vegetation types do not differ greatly, re-
turning spectrally similar responses. They have si-
milar average digital numbers (DNs) and all possess
high standard deviations. This creates areas of over-
lap in their spectral signatures, which causes confu-
sion, and limits their spectral separability. The class
Active Dunes shows a higher average DN, which
improves its spectral discrimination from the inac-
tive dunes, though exhibiting a high standard devia-
tion that creates areas of overlap with the Reg class.
The final classification result has an overall accuracy
of 52.7%, and a KHAT equal to 43.4%.According to
Congalton (1991) kappa values can be subdivided
into 3 groups, where a value greater than 0.80 (80%)
represents strong agreement, a value between 0.40
and 0.80 (40 to 80%) represents moderate agree-
ment, and a value below 0.40 (40%) represents poor
agreement. Adopting this standard, the accuracy
achieved by the per pixel classification represents a
moderate agreement. Both the user’s and producer’s
accuracies for the classes were low too (results are
not shown), as they had nearly the same number of
pixels confused with the other classes as they have
correctly classified.
Object-oriented classifications
The high standard deviation associated with the
ASTER-derived thematic classes suggests that the
inclusion of textural measures may increase the dis-
criminatory ability of the optical sensor. Figures 7
N.º 28 - Diciembre 2007 93
and 8 show the results of using an object-oriented
classification on the visible/infrared data from the
Terra-ASTER, and integrated spectral and textural
image information (as derived from the Radarsat
ASAR data), respectively.
Accuracy assessments for theASTER data set clas-
sified alone, and the integrated ASTER and Radar-
sat-derived texture data are presented in tables 2 and
3, respectively. The KAPPA analysis result for the
pairwise comparison between the ASTER and inte-
grated ASTER and textural information shows a re-
sult of 5.96, which is superior to 1.96 (the critical
value at the 95% confidence level), revealing that
the two error matrices are significantly different.
Kappa statistics above 80%, with 3 classes showing
above 90% accuracy of discrimination, are achieved
when mapping the six classes of interest using the
synergy of spectral and textural data derived from
ASTER and Radarsat imagery (Table 3). A compa-
rison of the classification accuracies obtained with
the different layer combinations revealed that the in-
tegrated ASTER and Radarsat-derived textural data
produced better overall accuracy and a higher KHAT
statistic value than the classifications resulting from
theASTER data alone, implying that the synergistic
approach enabled better discrimination of the land
degradation features in the study area.
These results suggest an improvement in the clas-
sification of active dunes and stabilized dunes (vege-
tated by either scrub or grass) is achieved by using
an object-oriented classification that integrates tex-
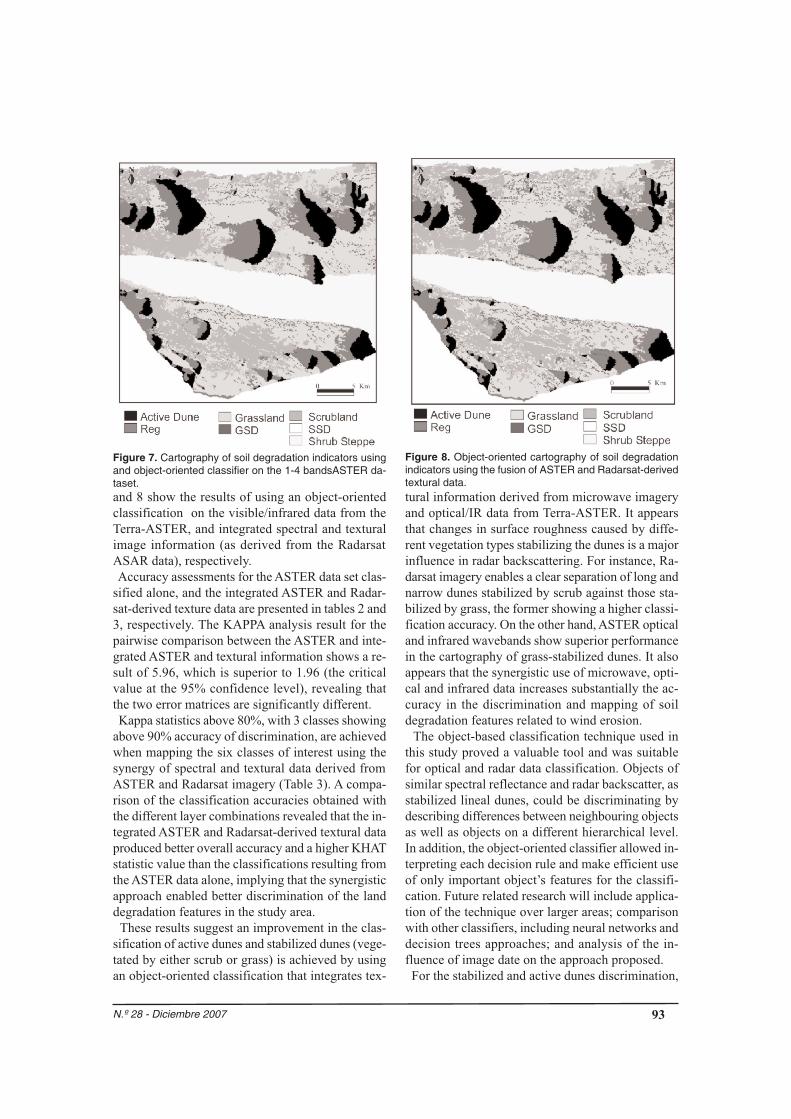
Figure 7. Cartography of soil degradation indicators usingand object-oriented classifier on the 1-4 bandsASTER da-taset.
Figure 8. Object-oriented cartography of soil degradationindicators using the fusion of ASTER and Radarsat-derivedtextural data.tural information derived from microwave imagery
and optical/IR data from Terra-ASTER. It appears
that changes in surface roughness caused by diffe-
rent vegetation types stabilizing the dunes is a major
influence in radar backscattering. For instance, Ra-
darsat imagery enables a clear separation of long and
narrow dunes stabilized by scrub against those sta-
bilized by grass, the former showing a higher classi-
fication accuracy. On the other hand,ASTER optical
and infrared wavebands show superior performance
in the cartography of grass-stabilized dunes. It also
appears that the synergistic use of microwave, opti-
cal and infrared data increases substantially the ac-
curacy in the discrimination and mapping of soil
degradation features related to wind erosion.
The object-based classification technique used in
this study proved a valuable tool and was suitable
for optical and radar data classification. Objects of
similar spectral reflectance and radar backscatter, as
stabilized lineal dunes, could be discriminating by
describing differences between neighbouring objects
as well as objects on a different hierarchical level.
In addition, the object-oriented classifier allowed in-
terpreting each decision rule and make efficient use
of only important object’s features for the classifi-
cation. Future related research will include applica-
tion of the technique over larger areas; comparison
with other classifiers, including neural networks and
decision trees approaches; and analysis of the in-
fluence of image date on the approach proposed.
For the stabilized and active dunes discrimination,