12
Assessment of the Economic Impacts of Recreational Boating in Virginia omas J. Murray VIMS Marine Resource Report No. 2012-12 December 2012 Photo by Cheryl Harvey Teagle

Assessment of the Economic Impacts of Recreational Boating in Virginia
Thomas J. Murray
VIMS Marine Resource Report No. 2012-12
December 2012
Photo by Cheryl Harvey Teagle

Report completed by:
Thomas J. MurrayMarine Advisory Services
Virginia Institute of Marine ScienceCollege of William & Mary
P.O. Box 1346Gloucester Point, VA 23062

Virginia Institute of Marine Science, College of William & Mary (VMRR 2012-12) - page
IntroductionVirginia is home to more than 200,000 recreational boats, providing a gateway to marine recreation in Chesapeake Bay and offshore waters. Virginia’s importance to boating access carries with it an expanding economy related to boating and boating related industries.
In addition to the large group of boater-citizens who reside in Virginia, local marine businesses such as marinas also provide access and berthing to many non-locally owned watercraft. While watercraft regis-trations provide a partial and useful estimate of the stock of boats in a region, the true economic impact arising from recreational boating primarily depends upon the type of boats as well as the frequency and nature of use.
The survey research completed and described in this report produces in-depth information regarding the economic activity and fiscal impacts of recreational boating to the Commonwealth of Virginia. Surveys of non-resident boat owners were completed during 2008. The surveys provided details on the amount and types of spending associated with watercraft use in Virginia.
Objectives and MethodsThe primary objective of this analysis was to estimate the level of economic activity arising from recre-ational boating and related marine industry in Virginia. Boating survey research was used to character-ize the direct expenditures related to resident and non-resident recreational boat ownership and use in the Commonwealth. To complete an overall picture of boating related economic activity, resident boat-ing expenditure information obtained from prior boater surveys conducted by the author was compared to boater survey data collections conducted by institutions such Michigan State University, as well as periodic assessment completed by the University of Maryland for determining the economic impacts of recreational boating in that State.
Based upon ranges of total recreational boat spending estimated, projections of the total economic impact were derived using standard regional industry input-output methods. The economic impacts of boater spending on the Commonwealth economy are defined in terms of income, employment, and total output. While a range ($1.1-1.3 billion) of total boating expenditures was developed using different sur-vey findings the economic impacts developed herein utilized the lowest end of the range for the purpose of economic impact expansion.
Objective 1. Evaluation of Economic Activity- Boater Expenditure Estimates
The Virginia Department of Game and Inland Fisheries (VDGIF) boater registration database served as the stratification (by boat length) frame for the Virginia boating expenditure estimates. The aver-age resident boater expenditure information was obtained from prior research completed by the author and compared with other similar studies in Maryland, New York and other states as well as by a national boater survey conducted annually by Michigan State University.1
1
1 Recreational Marine Research Center (RMRC). Michigan State University; 2007 and 2010. (5)
Assessment of the Economic Impacts of Recreational Boating in Virginia
page - Assessment of the Economic Impacts Related to Recreational Boating in Virginia2
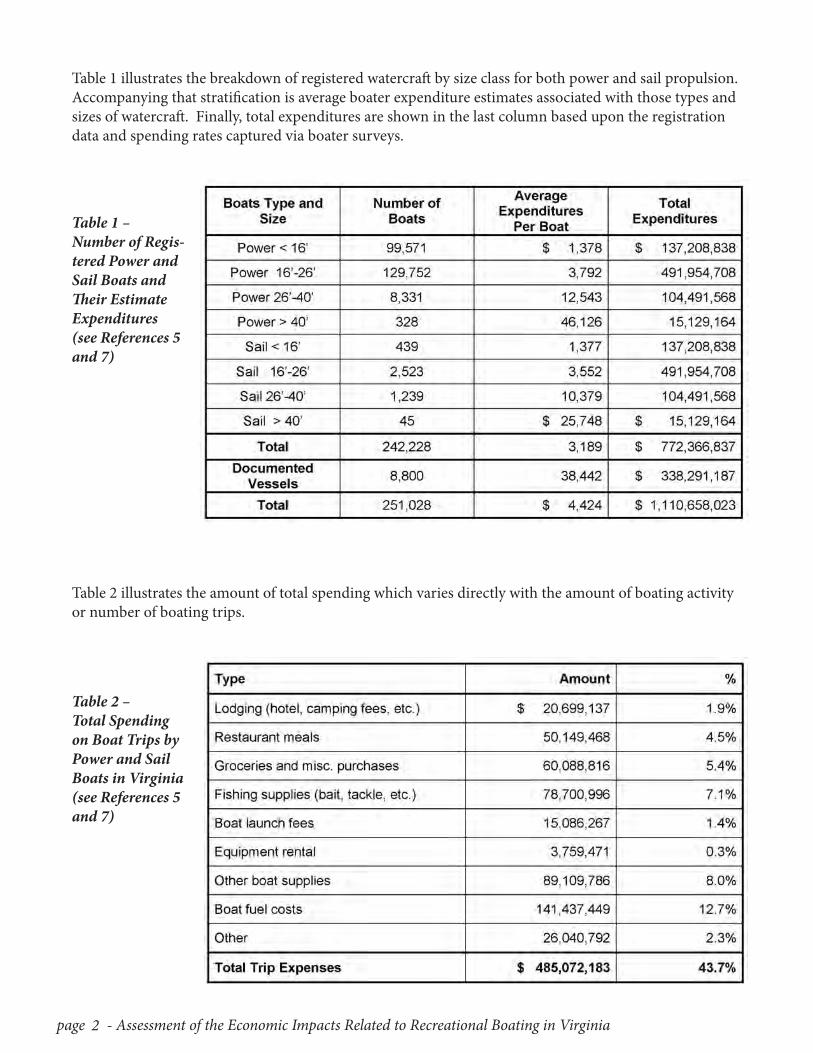
Table 1 illustrates the breakdown of registered watercraft by size class for both power and sail propulsion. Accompanying that stratification is average boater expenditure estimates associated with those types and sizes of watercraft. Finally, total expenditures are shown in the last column based upon the registration data and spending rates captured via boater surveys.
Table 2 illustrates the amount of total spending which varies directly with the amount of boating activity or number of boating trips.
Table 1 – Number of Regis-tered Power and Sail Boats and Their Estimate Expenditures (see References 5 and 7)
Table 2 – Total Spending on Boat Trips by Power and Sail Boats in Virginia (see References 5 and 7)
Virginia Institute of Marine Science, College of William & Mary (VMRR 2012-12) - page 3
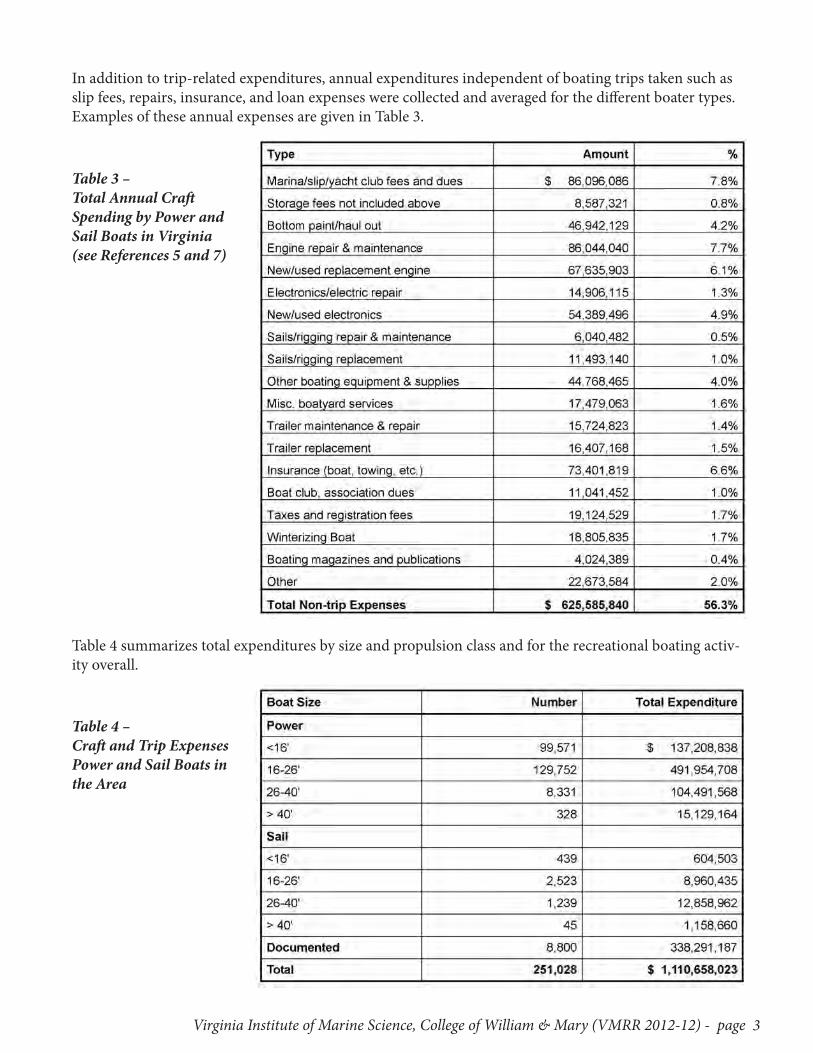
In addition to trip-related expenditures, annual expenditures independent of boating trips taken such as slip fees, repairs, insurance, and loan expenses were collected and averaged for the different boater types. Examples of these annual expenses are given in Table 3.
Table 4 summarizes total expenditures by size and propulsion class and for the recreational boating activ-ity overall.
Table 3 – Total Annual Craft Spending by Power and Sail Boats in Virginia (see References 5 and 7)
Table 4 – Craft and Trip Expenses Power and Sail Boats in the Area
page - Assessment of the Economic Impacts Related to Recreational Boating in Virginia4
Objective 2. Economic Impact Modeling
Economic Impact Analysis
Economic impact analysis begins with introducing a change in the output of goods and services using the multiplier model to analyze the effects on a region’s economic base. Most regional input-output studies attempt to characterize either, the economic impacts of specified changes in final demand for a given set of products, services, and industries, or the economic significance of specific industries in a regional and national economy. The research described herein accomplishes the latter task. It assesses the economic significance of recreational boating activity on Virginia’s economy.
The standard input-output model estimates the direct, indirect, and induced economic implications of some basic economic activity. The secondary effects (the indirect and induced impacts), along with the basic economic activity estimates, provide an estimate of the “multiplier” effects from the basic activity (direct impact).2
In the standard input-output model, measures of aggregate economic activity are used as a basis for esti-mating the total economic impact of the subject activity. For example, measures of direct employment or total sales in an industry are obtained, and these are then used as a basis for evaluating the total impact. In this report, estimates of the primary sales by category were obtained from both primary and secondary sources and used as the base measure of the “direct impact” of the industry.
Given this measure of the direct purchases of the boat-related industry, an estimate is made of the indi-rect impacts using information on the interactions between these industry sectors and other economic sectors which, are to varying extent, dependent upon such boat-related industry.
For example, suppliers of materials in the boat-related products manufacturing, transportation, storage, marketing and distribution are also dependent upon the sales of boat-related goods and services. These added sales or impacts are referred to as the “indirect impacts.” Such “indirectly” dependent sectors in-clude hundreds of other types of manufacturing and trade, for which industrial classifications range from “Boat Building and Repairing” to “Veneer and Plywood.”
Ultimately, the direct sales activity, and the resulting indirect activity, generates some increases in the general level of employment and income in the study area. The extra income generated from this way leads to a third “wave” of economic impact through greater household expenditures on goods and ser-vices. Much of this additional re-spending will also occur within the study area, further expanding eco-nomic activity. These effects are referred to as the “induced impacts” of the industry.
To summarize, because of the interrelationships among the many sectors of the State’s economy, new sales of goods and services to resident and non-resident boaters generates additional waves of economic impact. Expenditures by out-of-region boating visitors are in fact “exports” from Virginia’s economic base and these transactions initiate multiple rounds of economic impact among the Commonwealth’s businesses and households.
2 A Glossary of economic impact definitions is contained in Attachment 1.
Virginia Institute of Marine Science, College of William & Mary (VMRR 2012-12) - page 5
Economic Input-Output Model Application - IMPLAN Many economic impact studies use information from a regional inter-industry impact (input-output) model such as Impact Planning for Analysis (IMPLAN). IMPLAN is a nationally recognized economic model used for community/regional economic impact analysis across the country. The model uses input-output analysis in tandem with regional social accounting matrices and multipliers. IMPLAN divides the total national economy into 440 sectors corresponding to North American Industry Classification System (NAICS) codes related to agriculture, extraction, manufacturing, transportation, wholesale trade, retail trade, services and government. Data on these 440 industry sectors is based on national input/output or industry transaction tables (Minnesota IMPLAN Group, 2007). The IMPLAN model used herein was regionalized for this study to reflect Middlesex County. In addition to the modeling software, individual state data must be purchased from IMPLAN to use in the model. Running the basic IMPLAN model yields the necessary employment, income and output multipliers to apply to the expenditure data.
In order to estimate economic activity, each category of expenditure by the recreational boater was first matched to one or more of the IMPLAN sectors. In most instances, this matching is straightforward. For example, boater expenditures for lodging expenses can be matched to the IMPLAN Hotel and Lodg-ing sector and boat repair and maintenance expenditures accrue to the Boat Building and Repair sector.
Boater retail expenditures must be allocated by the proportion of the expenditure attributed to the value added by the retail, wholesale, transportation and producing sectors before applying the IMPLAN mul-tipliers. Each of those sectors will have their own set of impacts on the Virginia economy. Allocation of the expenses is done through national averages of the margins for these expenditure categories as sup-plied in the IMPLAN data. If the expenditures are for services such as at a marina, it is not necessary to calculate margins, as the full expenditure is applied to the service sector and matched to an IMPLAN multiplier.
After expenditures are broken down using margins into the various IMPLAN sectors, they are then multiplied by a regional purchase coefficient (RPC) before applying the economic activity multipliers. The RPC indicates the extent to which the demand for a good or service can be met by a Virginia-based industry. RPCs, expressed as percentages, are provided by IMPLAN for all sectors in, Virginia.
The final components of the economic impact analysis are the economic activity multipliers. The multi-pliers estimate the amount of employment, income or output that a given level of expenditure generates, after it has been adjusted by the RPC. Employment multipliers provide impacts in terms of jobs (full-time, part-time and seasonal). IMPLAN includes several income multipliers. For this project, personal or labor income is calculated. Personal income includes employee compensation (wages and salaries), while total income includes personal income plus proprietor (self-employment) income and other prop-erty income (e.g., rent). For output impacts, IMPLAN utilizes a Type I and modified Type III multiplier. The Type I output multiplier provides the relationship between the Virginia expenditures and the direct output or sales in the state. The Type III multiplier includes the additional indirect and induced effects created by the initial expenditure amount.
An ongoing issue in the professional literature on economic impact and input-output analysis is the true value of the costly “survey approach.” It is reasonable to assume that without major structural shifts and technological change within the overall economy, multipliers do not change greatly from year-to-year.3
3 In an update of an earlier recreational boating economic impact study (Milon and Adams, 1987), the authors concluded: “These results suggest that repeating detailed survey methods such as those employed in the original Milon et. al. (1983) study of the Florida recreational boating industry adds limited additional information in relation to the extra time and cost required (italics added).”(see Reference 5)

page - Assessment of the Economic Impacts Related to Recreational Boating in Virginia6
Thus, in terms of simple analysis of the aggregate impacts of activity on the regional economy, for the purpose of this study, it is appropriate that estimates of the multiplier are used. Further, if spending by industry sector does not change greatly from year-to-year, then it is deemed sufficient for aggregate esti-mates such as these to update these expenditures on an annual basis − specific in this study, based on the change in the number and types of boats.
Economic Impact Result/Tables
Table 5 – Economic Impacts of Trip & Non-Trip Spending by Registered Power and Sail Boats Kept in Virginia (Output $Mil-lions)
Table 6 – Summary of Total Economic Impact of Boating in Virginia Using 5 Measures ($Millions & Jobs)
Virginia Institute of Marine Science, College of William & Mary (VMRR 2012-12) - page 7
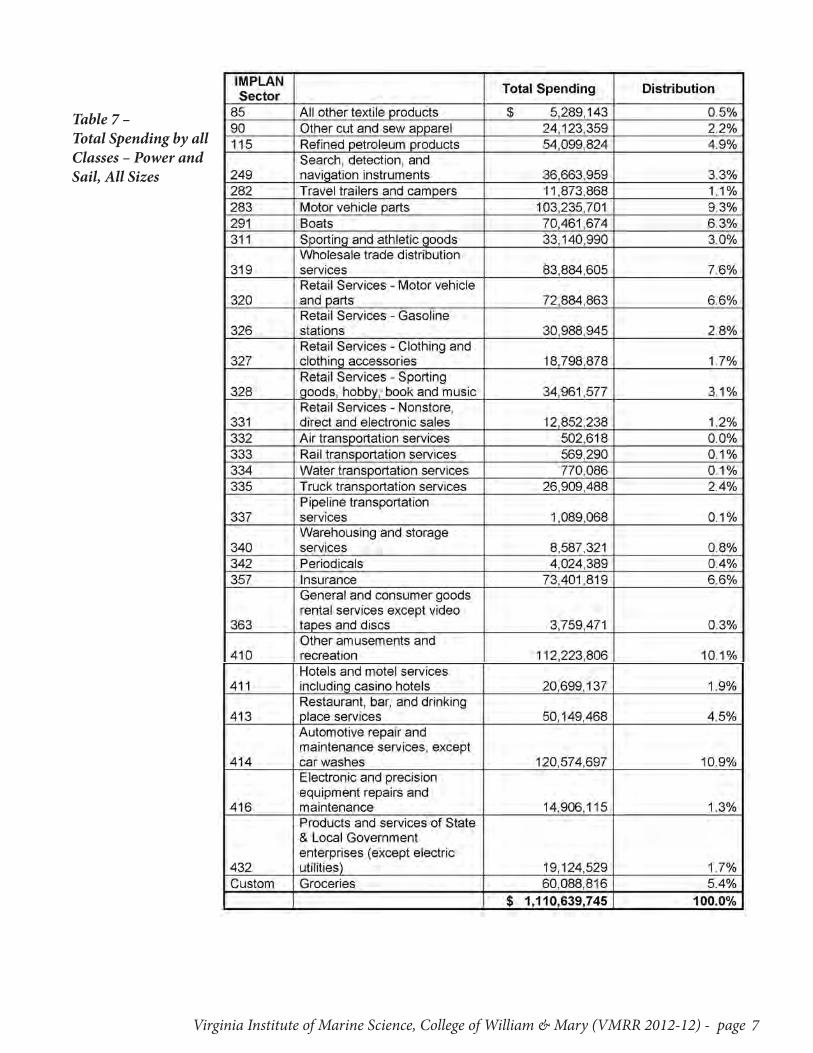
Table 7 – Total Spending by all Classes – Power and Sail, All Sizes
page - Assessment of the Economic Impacts Related to Recreational Boating in Virginia8
References1. Minnesota IMPLAN Group, Inc., 2008, “IMPLAN Professional 3.0, Economic Impact and Social
Accounting Software and Data,” IMPLAN State Package for Virginia. Stillwater, MN. http://im-plan.com
2. “Number of Active Watercraft Registrations by Locality by Year 1997-2011.” Virginia Department of Game and Inland Fisheries.
3. “Merchant Vessels of the United States,” U.S. Coast Guard Information Resources. Data through May 31, 2011.
4. Mahoney, E. “On-line Boating Economic Impact Model.” Recreation Marine Research Center, Michigan State University; 2007.
5. Murray, T., J. Kirkley and D. Lipton. “Assessment of the Economic Impacts of Recreational Boat-ing in the City of Hampton.” VIMS Marine Resource Report No. 2009-02. VSG-09-02. January 2009. http://web.vims.edu/library/GreyLit/VIMS/mrr09-02.pdf
6. Lipton, D. “Survey of Boater Spending in Maryland.” A report to the Maryland Department of Natural Resources. University of Maryland. Maryland Sea Grant Extension Publication UMD-SG-SGEP-2001-03. 2001.
7. Murray, T. “Assessment of the Economic Impacts of Recreational Boating in Middlesex County, Virginia.” VIMS Marine Resource Report No. 2011-03. VSG-11-02. March 2011. http://www.vims.edu/GreyLit/VIMS/mrr11-03.pdf
8. Murray, T. Economic Activity Associated With the Inaugural Virginia In-Water Boat Expo Sep-tember 9-11, 2005. VIMS Marine Resource Report No. 2006-01. VSG-06-02. April 2006. http://www.vims.edu/GreyLit/VIMS/mrr06-1.pdf
9. N. Connelly, T. Brown, D. Kay. New York Sea Grant. “Recreational Boating Expenditures in 2003 in New York State and Their Economic Impacts.” A Joint Program of the State University of New York and Cornell University. NYSGI-S-04-001. September 2004.
10. Milon, J. Walter and Chuck Adams. “The Economic Impact of Florida’s Recreational Boating Industry in 1985.” Florida Sea Grant Technical Paper 50. April 1987.
11. Milon, J. Walter, W. David Mulkey, Pamela H. Riddle and Gary H. Wilkowske. “The Economic Impact of Marine Recreational Boating on the Florida Economy.” Florida Sea Grant Report Number 54. March 1983.
Virginia Institute of Marine Science, College of William & Mary (VMRR 2012-12) - page 9
Attachment 1. Glossary of Input-Output TermsDirect effects/impacts: Direct impacts represent the revenues, value-added, income, or jobs that result directly from an economic activity within the study area or a regional economy.
Employment or Jobs: Represents the total numbers of wage and salaried employees as well as self-em-ployed jobs. This includes full-time, part-time and seasonal workers measured in annual average jobs.
Indirect Business Taxes: Include sales, excise, and property taxes as well as fees and licenses paid by businesses during normal operations. It does not include taxes on profits or income.
Indirect effects/impacts: Indirect effects occur when businesses use revenues originating from outside the region, or study area, to purchase inputs (goods and services) from local suppliers. This secondary, or indirect business, generates additional revenues, income, jobs and taxes for the area economy.
Induced effects/impacts: Induced effects or impacts occur when new dollars, originating from outside the study area, are introduced into the local economy. Induced economic impacts occur as the house-holds of business owners and employees spend their earnings from these enterprises to purchase con-sumer goods and services from other businesses within the region. This induced effect generates addi-tional revenues, income, jobs and taxes for the area economy.
Input-Output Analysis: The use of input-output models to estimate how revenues or employment for one or more particular industries, businesses or activities in a regional economy impact other businesses and institutions in that region, and the regional as a whole.
Input-Output Models: A mathematical representation of economic activity within a defined region using inter-industry transaction tables or matrices where the outputs of various industries are used as inputs by those same industries and other industries as well.
Labor Income: All forms of employment compensation, including employee wages and salaries, and proprietor income or profits.
Local/ Resident revenues/expenditures: Local revenues or spending represent simple transfers between individuals or businesses within a regional economy. These transactions do not generate economic spin-off or multiplier (indirect and induced) effects.
Margins: Represent the differences between retail, wholesale, distributor and producers prices.
Non-resident /Non-local revenues/expenditures: When outside or new revenues flow into a local econ-omy either from the sale of locally produced goods and services to points outside the study area, or from expenditures by non-local visitors to the study area, additional economic repercussions occur through indirect and induced (multiplier) effects.
Other Property Type Income: Income in the form of rents, royalties, interest, dividends, and corporate profits.
Output: Revenues or sales associated with an industry or economic activity.
Total Impacts: The sum of direct, indirect and induced effects or economic impacts.
Value-added: Includes wages and salaries, interest, rent, profits, and indirect taxes paid by businesses. In the IMPLAN results tables, Value-added equals the sum of Labor Income, Other Property Type Income, and Indirect Business Taxes.


