VOICE: Voluntary Organization in Interest of Consumer Education E-34, Ground Floor, East of Kailash, Delhi – 110065 Phone- 011 4733 1000 http://www.consumer-voice.org Email- [email protected]Draft Final Report Volume I (October 2017) Prof. Sri Ram Khanna Paramjeet Singh And VOICE Research Team Arvinder Kaur Disha Negi Malvika Garg Yukti Arora Assessment of the Impact of Quality of Internet Service (QoIS) on Internet Users: Concept, Scope and Dimensions
Transcript
VOICE: Voluntary Organization in Interest of Consumer Education E-34, Ground Floor, East of Kailash, Delhi – 110065 Phone- 011 4733 1000 http://www.consumer-voice.org Email- [email protected]
Draft Final Report Volume I (October 2017)
Prof. Sri Ram Khanna Paramjeet Singh And VOICE Research Team Arvinder Kaur Disha Negi Malvika Garg Yukti Arora
Assessment of the Impact of Quality of Internet Service (QoIS) on Internet Users:
Assessment of Impact of Quality of Internet in India and its Impact on Users October 2017
E-34, East of Kailash, New Delhi – 110065, India
URL: www.consumer-voice.org
LIST OF ABBREVIATIONS
Ads Advertisements ANOVA Analysis of Variance App Applications ASSOCHAM Associated Chambers of Commerce of India BHQ Block Headquarter B-O-P Balance of Payments BTS Base Transceiver Station BSNL Bharat Sanchar Nigam Limited CATI Computer Assisted Telephone Interviewing CCE Customer Care Executive CCG Centre for Communication Governance CCS Customer Care Services CD Consumer Detriment CEO Chief Executive Officer CMTS Cellular Mobile Telephone Services CSCs Common Service Centres CSS Customer Satisfaction Surveys CUTS Consumer Unity & Trust Society DHQ District Headquarter DIETY Department of Electronics and Information technology DISNIC District Information System of the National Informatics Centre DoT Department of Telecommunications E-KYC E- Know Your Customer E-WoM E- Word of Mouth FCC Federal Communications Commission FDI Foreign Direct Investment FICCI Federation of Indian Chambers of Commerce & Industry F2F Face to Face FTS Fixed Telephone Services FUP Fair Usage Policy GDP Gross Domestic Product Govt. Government GTPL Gujarat Telelink Private Limited HD High Definition HSC Higher Secondary (10th standard) ICRIER Indian Council for Research on International Economic Relations ICT Information & Communications Technology IDI ICT Development Index IIM Importance Influence Matrix IoT Internet of Things IRCTC Indian Railway Catering and Tourism Corporation ISP Internet Service Provider IT Information Technology ITU International telecommunications Union MGNREGA Mahatma Gandhi National Rural Employment Guarantee Act
Assessment of Impact of Quality of Internet in India and its Impact on Users October 2017
E-34, East of Kailash, New Delhi – 110065, India
URL: www.consumer-voice.org
Mins Minutes MMP Mission Mode Projects MNO Mobile Network Operator MOOCs Massive Open Online Courses MTNL Mahanagar Telephone Nigam Limited NCR National Capital Region NeGP National E-Governance Plan NGO Non Governmental Organization NICNET National Informatics Centre Net OHD Open House Discussion OOH Out Of Home PCI Per Capita Income QoIS Quality of Internet Service QoS Quality of Service Rel Comm Reliance Communications RTO Regional Transport Authority SEC Socio- Economic Classification SEM Structural Equation Modelling SHQ State Headquarter SIM Subscriber Identity Module SMEs Small & Medium Enterprises SP Service Providers SRW Standard Regression Weights SSC Senior Secondary (12th standard) TRAI Telecom Regulatory Authority of India TSP Telecom Service Providers UIDAI Unique Identification Authority of India UK United Kingdom US United States (of America) VOICE Voluntary Organization in Interest of Consumer Education VoIP Voice over Internet Protocol Y-o-Y Year-on-Year
Assessment of Impact of Quality of Internet in India and its Impact on Users October 2017
E-34, East of Kailash, New Delhi – 110065, India
URL: www.consumer-voice.org
FOREWORD
VOICE is a not for profit body dedicated to consumer education and empowerment. Most of the studies it takes up are either for guidance of consumers or for policy advocacy. This study was conceived to focus on the poor impact of quality of service of internet on usage of internet. It was designed to bring forth all the evidence in regard to the importance of Quality of Internet Service so that Regulators and Government could get a comprehensive appreciation of all factors that are concerned with quality of Internet service.
This study was initiated in September 2016 by the Consumer VOICE Research Team. Stakeholder’s consultations were held to elicit comments on different aspects of literature review as well as methodology before the field work for primary data collection commenced. An interim report was circulated to four experts in August 2017 to elicit their views and comments on the interim results based on a sample of about 20,000 respondents. I am grateful to Prof Gurjeet Kaur of Jammu University, Prof H.K. Dangi of Dept of Commerce, Delhi School of Economics, Delhi University, Dr Priyanka Joshi of Narsee Monjee School of Business, Mumbai and Mr S C Saxena formerly of TRAI who have taken the trouble of reading the bulky report and writing their comments which we have tried our best to incorporate. After the fieldwork concluded w e have completed the analysis on the data collected from a national sample of 52,000 respondents. Care has been taken to include many of the comments received from the experts who reviewed the interim report.
This final report is being subjected to a 2nd round of comments by experts. It has been divided in to three volumes due to its bulky nature. The executive summary explains the division in three parts. The research Team hopes to present the findings and conclusion of this report to Government and TRAI with a view to improving quality of service of internet in the country.
I am grateful to the Management of VOICE as well as members of the Research Team Shri Paramjeet Singh, an old associate of mine who has worked with me on several studies over the last two decades, for organizing the field work and to give his guidance for the detailed analysis that this study has undertaken. I am particularly grateful to Malvika Garg, Yukti Arora and Disha Negi who have also been my students at the Delhi University and agreed to join this team for the research study, after their master’s degree at Delhi School of Economics. I wish them a prosperous future. I am also indebted to Dr Arvinder Kaur who was also a part of our Research Team. I’d also like to express my gratefulness to Prof H.K,Dangi of Delhi School of Economics who found time to guide our team on intricacies of data analysis of such a large data set. Prof Gurjeet Kaur of Jammu University took the trouble of sparing her time to guide the Team on several problems associated with analysis of data. I am grateful to her for being a big help to our team.
VOICE management and our entire Research Team is indeed indebted to Ford Foundation for sponsoring this study. This study would have not been possible without their financial support. It took a long time for the project to start after sanction. However, we are glad to present this report to the Ford Foundation and interested stakeholders. We hope you will find it useful.
(Prof Sri Ram Khanna) New Delhi , 23 Oct 2017 Principal Author
Assessment of Impact of Quality of Internet in India and its Impact on Users October 2017
E-34, East of Kailash, New Delhi – 110065, India
URL: www.consumer-voice.org
TABLE OF CONTENTS VOLUME I : Concept, Scope and Dimensions
A Executive Summary i B Executive Tables xi C Recommendations xxxv 1 Introduction, Objectives And Scope 1
2.1 Impact of Internet 10 2.2 Quality of Internet Services 65 3 Methodology 79
3.1 Introduction and Background of the study 80 3.2 Sampling and Data Collection 85 3.3 Data Analysis 94
ANNEXURE A. Guidelines for Situational Analysis B. List of Factors Generated from Situational Analysis C. List of Factors treated in IIM D. Final Version of Questionnaire E. Criterion for Speed Testing F. Guidelines for Qualitative Study (E-Governance)
97 98 103 110 117 124 125
BIBLIOGRAPHY 127
VOLUME II : Assessment of Quality of Internet Service Executive Summary I Executive Tables Vii 1 Introduction, Objectives and Scope 1
1.1 Introduction 2 1.2 Objectives of the study 5 1.3 Scope of the study 5 2 Literature Review 7
2.1 State of Internet 8 2.2 Business & Supply 12 2.3 Quality of Internet Services 23 3 Methodology 37
Assessment of Impact of Quality of Internet in India and its Impact on Users October 2017
E-34, East of Kailash, New Delhi – 110065, India
URL: www.consumer-voice.org
3.1 Introduction and Background of the study 38 3.2 Sampling and Data Collection 41 3.3 Data Analysis 49 4 Sample and Sample Characteristics 51 5 Time and Money spent on Internet 89 6 Assessment of Quality of Internet Service 105
6.1 Parameters of Quality of Service 106 6.2 Overall Quality of Service 128 6.3 Analytical Comparisons 133 6.4 Impact of parameters and constituent aspects on overall QoIS 144 7 Internet Speed Test Audit 171
7.1 Introduction & Objectives 172 7.2 Analysis 173 7.3 Findings and Conclusions 182 8 Problems, Grievance and Redressal 185
A.Final Version of Questionnaire B.Criterion for Speed Testing C.Complete List of ISPs found during fieldwork D.ANOVA Tables E.Post Hoc Tables
203 204 211 212 217 221
BIBLIOGRAPHY 247
VOLUME III: Impact of Quality of Internet on Internet Users Executive Summary i
Executive Table vii 1 Introduction, Objectives and Scope 1
1.1 Introduction 2 1.2 Objectives of the study 5 1.3 Scope and Coverage 5
2 Literature Review 9 2.1 Impact of Internet 10 2.2 Quality of Internet Services 56 2.3 State of Internet in India 59
3 Methodology 61 3.1 Introduction and Background of the study 62 3.2 Sampling and Data Collection 67
Assessment of Impact of Quality of Internet in India and its Impact on Users October 2017
E-34, East of Kailash, New Delhi – 110065, India
URL: www.consumer-voice.org
3.3 Data Analysis 75 4 Sample and Sample Characteristics 77 5 Time and Money spent on Internet 113
5.1 Time Spent on Internet-Wireless Service 115 5.2
5.3 5.4 5.5
Money Spent on Internet-Wireless Service Tiime Spent on Internet-Wireline Service Money Spent on Internet-Wireline Service Relation Between Time and Money
117 122 124 129
6 Impact of Quality of Service on Daily Life 131 6.1 Impact of Internet on Daily Life 132 6.2 Impact of QoIS on various aspects of Daily Life 135 6.3 Overall Impact of QoIS on Daily Life 139 6.4 Regression Analysis of various impacting aspects on overall impact 140
7 Impact of Quality of Service on Rural Areas 145 7.1 Impact of Internet on Rural Areas 146 7.2 Impact of QoIS on various aspects of Rural Areas 149 7.3 Overall Impact of QoIS on Rural Areas 152 7.4 Regression Analysis of various impacting aspects on overall impact 153
8 Impact of Quality of Service on Education and Research 157 8.1 Impact of Internet on Education and Research 158 8.2 Impact of QoIS on various aspects of Education and Research 161 8.3 Overall Impact of QoIS on Education and Research 164 8.4 Regression Analysis of various impacting aspects on overall impact 165
9 Impact of Quality of Service on Health and Medical Services 169 9.1 Impact of Internet on Health and Medical Services 170 9.2 Impact of QoIS on various aspects of Health and Medical Services 173 9.3 Overall Impact of QoIS on Health and Medical Services 176 9.4 Regression Analysis of various impacting aspects on overall impact 177
10 Impact of Quality of Service on Political and Civic Participation 181 10.1 Impact of Internet on Political and Civic Participation 182 10.2 Impact of QoIS on various aspects of Political and Civic Participation 185 10.3 Overall Impact of QoIS on Political and Civic Participation 187 10.4 Regression Analysis of various impacting aspects on overall impact 188
11 Impact of Quality of Service on People with Special Needs 193 11.1 Impact of Internet on People with Special Needs 194 11.2 Impact of QoIS on various aspects of People with Special Needs 197 11.3 Overall Impact of QoIS on People with Special Needs 199 11.4 Regression Analysis of various impacting aspects on overall impact 200
12 Impact of Quality of Service on Business and Jobs 203 12.1 Impact of Internet on Business and Jobs 204
Assessment of Impact of Quality of Internet in India and its Impact on Users October 2017
E-34, East of Kailash, New Delhi – 110065, India
URL: www.consumer-voice.org
12.2 Impact of QoIS on various aspects of Business and Jobs 207 12.3 Overall Impact of QoIS on Business and Jobs 210 12.4 Regression Analysis of various impacting aspects on overall impact 211
13 Impact of Quality of Service on Shopping 215 13.1 Impact of Internet on Shopping 216 13.2 Impact of QoIS on various aspects of Shopping 218 13.3 Overall Impact of QoIS on Shopping 221 13.4 Regression Analysis of various impacting aspects on overall impact 222
14 Impact of Quality of Service on Travelling and Commuting 225 14.1 Impact of Internet on Travelling and Commuting 226 14.2 Impact of QoIS on various aspects of Travelling and Commuting 229 14.3 Overall Impact of QoIS on Travelling and Commuting 231 14.4 Regression Analysis of various impacting aspects on overall impact 232
15 Most Important Aspects from the perspective of Quality of Service 235 16 SEM 249 17 Consumer Detriment 259 18 Impact of Quality of Service on use of E-Governance Services 265
18.1 Introduction 266 18.2 Methodology 266 18.3 E-Governance Services used 267 18.4 Impact of QoIS on the type of E-Governance Service used 269 18.5 Overall Impact of QoIS on E-Governance Services 279 18.6 Anecdotes from Personal Interviews 280 18.7 Conclusion 282
ANNEXURE A. Guidelines for Situational Analysis B. List of Factors Generated from Situational Analysis C. List of Factors treated in IIM D. Final Version of Questionnaire E. Guidelines for Qualitative Study (E-Governance) F. ANOVA Tables G. Post Hoc Tables H. Regression Tables
283 288 295 300 306 308 318 327
BIBLIOGRAPHY 371
E-34,East of Kailash, New Delhi – 110065, India
URL: www.consumer-voice.org Page i
SECTION A
EXECUTIVE SUMMARY
Assessment of Impact of Quality of Internet in India and its Impact on Users October 2017
E-34,East of Kailash, New Delhi – 110065, India
URL: www.consumer-voice.org Page ii
VOICE has been conducting assessment of quality studies since 2005. The first study to assess
the quality of telecom service, which covered Mobile and Broadband, was conducted in the
year 2006-07. Since then VOICE has been regularly assessing QoS for the Telecom Regulatory
Authority of India (TRAI). These studies involved assessment of quality of landline, cellular
and broadband.
Until some years ago, broadband gap used to mean how many people have access to internet
as against those who do not have access to internet. However, broadband divide is no longer
viewed as a penetration divide. It is now becoming more of a quality and capacity divide.
When talking about broadband divide, “the relevant questions should be how good the
connection is? How fast it is? And how fast is fast? It is therefore, a divide in the range of
services people can access and use. Governments, policy makers and regulators, around the
world, have made increasing the internet penetration their main priority.” Not
underestimating the need for getting connected, which is undoubtedly the essential first step,
quality of services cannot be ignored.
TRAI has laid down certain benchmarks to ensure Quality of Service (QoS). The regulations
mandate service providers rendering Unified Access Service (UAS) as well as cellular mobile
telephone service to submit monthly performance reports to TRAI. The regulator based on
these reports, releases quarterly report for all the operators in the 22 service areas in India.
However, no penalties are imposed on operators that do not abide by these quality guidelines
and likewise, there are no incentives (from the regulator) for those performing well.
In the interest of consumers, VOICE took upon itself to conduct a study on „Assessment of
Impact of Quality of Internet Services on Internet Users‟ in September 2016. This study was
sponsored by Ford Foundation. The purpose of this study is to assess the Impact of Quality of
Internet Service on consumers in realizing their day to day tasks and needs/goals and
aspirations in their lives. There are various services for the consumers which are delivered
through internet and consumers are accessing/ using government and other services through
internet. The study intends to assess the impact of quality of internet services delivered to its
consumers and also list the shortcomings/impediments which require attention for further
enhancing this quality.
The whole study subsumes three sub-studies namely-
1. Consumer perceptions on Quality of Internet Service (QoIS) and impact thereof on
various aspects of life- Capturing consumer perceptions on various parameters of QoIS
on the internet service that they are using and impact of QoIS on various aspects of
life, to be captured through interviews with the respondents (Face to face and CATI).
2. Impact of quality of internet service on using E-governance services - Internet is the
backbone of e-governance services. In order to usher e-governance services, it is
important to improve QoIS. E-governance services, thus reckon on the quality of
Assessment of Impact of Quality of Internet in India and its Impact on Users October 2017
E-34,East of Kailash, New Delhi – 110065, India
URL: www.consumer-voice.org Page iii
internet service for its stakeholders to reap maximum benefits out of it. The impact of
QoIS on e-governance services would thus be gauged under this study.
Apart from capturing this aspect through main quantitative survey some qualitative
interviews to be conducted with the providers and beneficiaries of e-governance
services. These interviews would be videographed and a qualitative analysis to be
done thereon.
3. TRAI conducted a survey to assess the consumer perception and found that about 60%,
62% and 67% respondents were dissatisfied with their internet data speeds in Delhi, MP
and Karnataka respectively. Also, satisfaction with data speeds was given a rating of
2.39, 2.33 and 2.14 on a five-point scale, in Delhi, MP and Karnataka respectively
(where 3 was neutral, below 3 was dissatisfied and above 3 was satisfied). Also,
consumers usually choose their internet service providers/plans based on „Speed‟.
Speed being an important parameter of QoIS, „Audit of wireless internet speed‟ would
also be conducted in eight states in all the four telecom circles.
THREE VOLUMES OF THIS STUDY
Since the scope of the study is very vast, the study has been branched into three parts to
retain focus on the respective sections covered in each part. The first part in this volume
gives introduction to the study, discusses objectives, scope and methodology in detail,
besides expounding review of literature and the framework developed through it. The second
part “Assessment of Quality of Internet Service” (second volume) is based on the perceptions
of internet users on five quality parameters- Availability, Speed, Reliability, Billing and
Charges and Help (Customer Care) Services. It also presents the result of „Speed Test Audit‟
that was conducted across eight states in all the four telecom circles. The third part assesses
the impact of QoIS on various aspects of life (third volume).
A1. ASSESSMENT OF QUALITY OF INTERNET SERVICE (Volume 2)
As the final survey has been concluded now, this report is the second part that concerns with
the assessment of Quality of Internet Service only and presents the results derived from the
data of 52,000 respondents that have been covered across the country.
Chapter 1, 2 and 3 deal with the Introduction, Literature review and Methodology adopted for
this study. The objectives and scope of the study have been laid down in the introductory
chapter. During the literature review phase, more than 45 research papers, articles and news
items were studied, a brief of which has been given in the section that follows Introduction.
In addition to related studies, a theoretical base about the concept of QoIS was developed
from the regulations that TRAI has mandated to ensure consumer protection by mandating
ISPs to meet the benchmarks of service quality delivery. Methodology elaborates on the
distribution of sample into 4 Telecom Circles spread across 19 states of the country. It also
sheds some light on the statistical tools used for analysis in the study.
Assessment of Impact of Quality of Internet in India and its Impact on Users October 2017
E-34,East of Kailash, New Delhi – 110065, India
URL: www.consumer-voice.org Page iv
The sample and its characteristics based on various geographic, demographic and socio-
economic parameters have been spelled out in Chapter 4. All responses that fall in four
telecom circles (Metro, Circle A, Circle B and Circle C) were considered for the purpose of
this report. It includes the distribution of respondents on the basis of their choice of Internet
Service Provider with respect to their main mode of service (decided by highest amount of
time spent or through the preference of the respondent). A total of 12 Wireless service
providers and 92 Wireline service providers have been found during fieldwork.
Chapter 5 deals with the „average time spent daily on internet‟, and „average expenditure
incurred on internet services per month‟ by the respondent on the basis of mode of internet
use (wireless or wireline). The relationship between these two variables has also been
examined as we proceed further, which highlights that Quality of Internet Service which is
defined as an interplay of various parameters on the grounds of time spent on
Internet use, in return, leads to the estimation of time that a user will take for
performing an activity through Internet that is purchased after spending some money.
It is due to this that we could conclude that the respondents in Circle C, rural areas and lower
classes spend relatively more time on an average on their main mode of Internet use as
compared to others. On an average, respondents whose main mode of use was wireless
internet, spent 3.5 hours a day on internet while the average hours spent by wireline users
was 4.3. The average mean expenditure per month of respondents covered during the survey
on their main mode of using Internet (Wireless) was at Rs 272 while for wireline internet
users, it was Rs. 895, which was about thrice the amount spent by wireless users per month.
Chapter 6 deals with the assessment of „Quality of Service‟. In here, the QoIS of various
national and regional internet service providers under Wireless and Wireline segment have
been analyzed and compared on the basis of satisfaction of their users on the five parameters
of quality, which are- Availability, Speed, Reliability, Billing & charges and Help/Customer
care. Apart from these parameters, respondents were also asked to rate the overall quality of
their internet service, on the basis of which these ISPs have been ranked for all circles as well
as each circle individually. These ratings and rankings have further been subjected to analysis
of variance to determine the differences that exist and indicate which of them are
statistically significant. This wireline section of this chapter remarked quite surprisingly that
local ISPs have been rated much better than the national brands overall. You Broadband
(rated highest on all parameters), Hathway and GTPL have been rated better than national
SPs like Airtel, Rel Comm, MTNL/BSNL and Tata. Spectranet, Hathway and Tikona are rated
better than national brands in Metro Circle while Spidigo, Beamtele, You Broadband,
Hathway, GTPL and Tikona are rated higher than national ISPs in Circle A. These differences
were also found to be statistically significant. The last section is the application of Structural
Equation Modelling (SEM) on the data to identify the parameter and its constituent aspects
having highest impact on overall quality of the service. This analysis pointed that „Speed‟,
Assessment of Impact of Quality of Internet in India and its Impact on Users October 2017
E-34,East of Kailash, New Delhi – 110065, India
URL: www.consumer-voice.org Page v
“Reliability‟ and „Help/Customer Care Services‟ are the most important and significant
parameters in almost all cases as they have the highest contribution in determining overall
quality of service. However, Availability has been earmarked as an important aspect in less
developed regions that come under Circle C indicating that many of ISPs need to improve on
this. Under Speed, ‘Downloading Speed’ and ‘Consistency of downloading speed’ were
considered to be two important aspects, whereas under Reliability, ‘Uninterrupted services
at all times’ was the most important aspect. Lastly, ‘Transparent Refund Policy’ and
‘Accessibility and Effectiveness of Customer Care Executive’ were two most significant
aspects of Help/Customer Care Services.
Chapter 7 pertains to supplementary study conducted along with the main study of QoIS i.e.
Audit of Speed. It gives a brief picture of the actual „internet speeds‟ of Wireless mode
available across the country. An audit of internet speeds of five national level service
providers was conducted in eight states for this report. The analysis and results of the
readings collected has been furnished and has been further compared with the claimed
speeds. It shows that users get a lower speed than what is claimed. It also shows a wide gap
between 3G and 4G speed claims of ISPs and their actual performance. The poor level of
internet speeds requires the government and the telecom regulator to devise mechanisms to
improve internet speeds in one way or another. It has been found that the maximum 4G speed
among the sample was just 12.70 mbps, which is not even close to its definition. This along
with the highest speed reported by TRAI Analytics Portal i.e. 18.90 mbps provides sufficient
evidence to question the delivery of promised speed to the end user at the point of use at a
time. The chapter concludes on the note that 3G and 4G speeds are defined very loosely,
leaving enough room for the service providers to make false claims and misleading
advertisements that prompts consumer to make wrong choices.
Chapter 8 & 9, throw light on the problems and detriment faced by the consumers. Problems
encapsulate various issues faced by customers relating to their internet services and its
providers. The state of problems has been summarized in experiencing a problem,
complaining for it, getting a response and status of problem resolution coupled with statistics
of frequently occurring problems. The findings of this study are contradicting to what has
been presented in performance indicator reports by TRAI where almost every ISPs meets the
95% benchmark of problem resolution, whereas our study presents that at least 15% of the
problems remain not solved at all. In addition to this, every one in three respondents has
reported to have faced a problem with their internet connection be it wireless or wireline.
This is a representative of quite a sorry state of affairs of the concept of quality of service.
Consumer detriment expands to show the distribution of respondents who perceive to have
lost time, money or both due to poor quality of Internet on any of impact aspects discussed
above. The significant 23% people perceiving to have faced any kind of loss due to poor
quality of internet is been quite alarming, as it asks for stringent regulations and tougher
Assessment of Impact of Quality of Internet in India and its Impact on Users October 2017
E-34,East of Kailash, New Delhi – 110065, India
URL: www.consumer-voice.org Page vi
benchmarks that make it imperative for the ISPs to not cause any more such losses to their
subscribers.
It has been established that Internet has become all-pervasive and has merely left some
segments untouched. However, the concept of QoIS still remains to be foreign for the
government, TRAI and service providers. Most consumers are also not able to distinguish
between poor, average and good quality of service. As it can be seen from the highlights
given below, a lot has been left desired when it comes to getting promised quality of service.
The report has been able to demonstrate that it is not just the provision of service that will
help India become „Digital India‟, rather Quality of this service that determines the
sustainability of this vision. It is for this that aforementioned stakeholders are urged to take
corrective and timely measures that ensures promising future of this industry, at large, by
serving the mutual interest of all.
Towards the end, the annexure have been included in the report and contain the essentials of
the theoretical framework and the questionnaire that was a result of extensive review of
literature and situational analysis. It also contains the criterion used for audit of speed and
the complete list of service providers that were found during fieldwork. Furthermore, the
ANOVA tables and post hoc test tables that were generated during analysis of data have been
included in the annexure.
A2. IMPACT OF QUALITY OF INTERNET SERVICE ON VARIOUS PARAMETERS (Volume 3)
Third part of this study covers – “Impact of Quality of Internet Service on Different Aspects of
Life” and encompasses nine aspects of life where internet is being used– Daily Life,
Development of Rural Area, Education and Research, Health and Medical services, Political
and Civic Participation, People with Special Needs, Business and Jobs, Shopping, Travelling
and Commuting. Each of these nine parameters comprise of various aspects. Ratings were
sought from the respondents on a five point scale on the impact of QoIS on these aspects and
parameters. Besides these nine parameters mentioned above, this report also covers the
impact of QoIS on e-governance.
Chapter 1, 2 and 3 deal with the Introduction, Literature review and Methodology adopted for
this study. The objectives and scope of the study have been laid down in the introductory
chapter to this part of the report. During the literature review phase, more than 180 research
papers, articles and news items were studied, a brief of which has been given in the section
that follows Introduction. Methodology elaborates on the distribution of sampling into 4
Telecom Circles spread across 19 states of the country, curating of aspects that are impacted
by internet and quality thereof from review of literature and situational analysis,
classification of aspects into parameters and preparation of questionnaire (survey tool). It
also sheds some light on the statistical tools used for analysis in the study. Methodology for
„qualitative study on impact of QoIS on e-governance‟ has also been discussed.
Assessment of Impact of Quality of Internet in India and its Impact on Users October 2017
E-34,East of Kailash, New Delhi – 110065, India
URL: www.consumer-voice.org Page vii
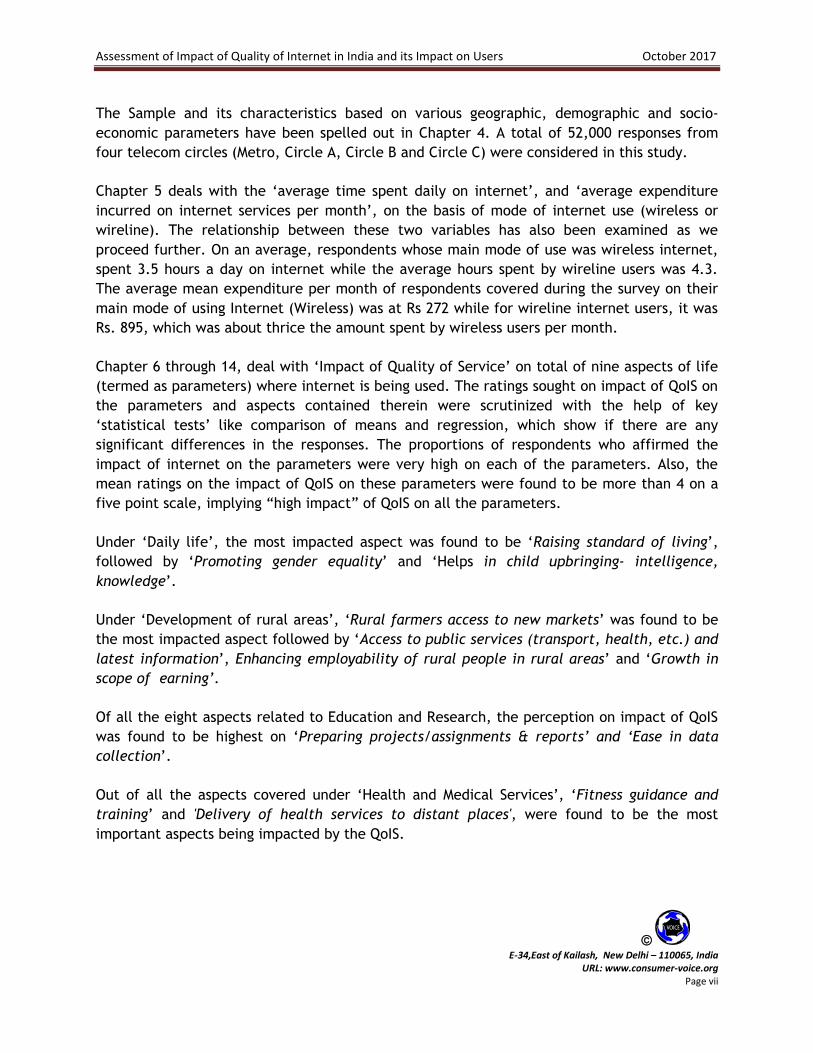
The Sample and its characteristics based on various geographic, demographic and socio-
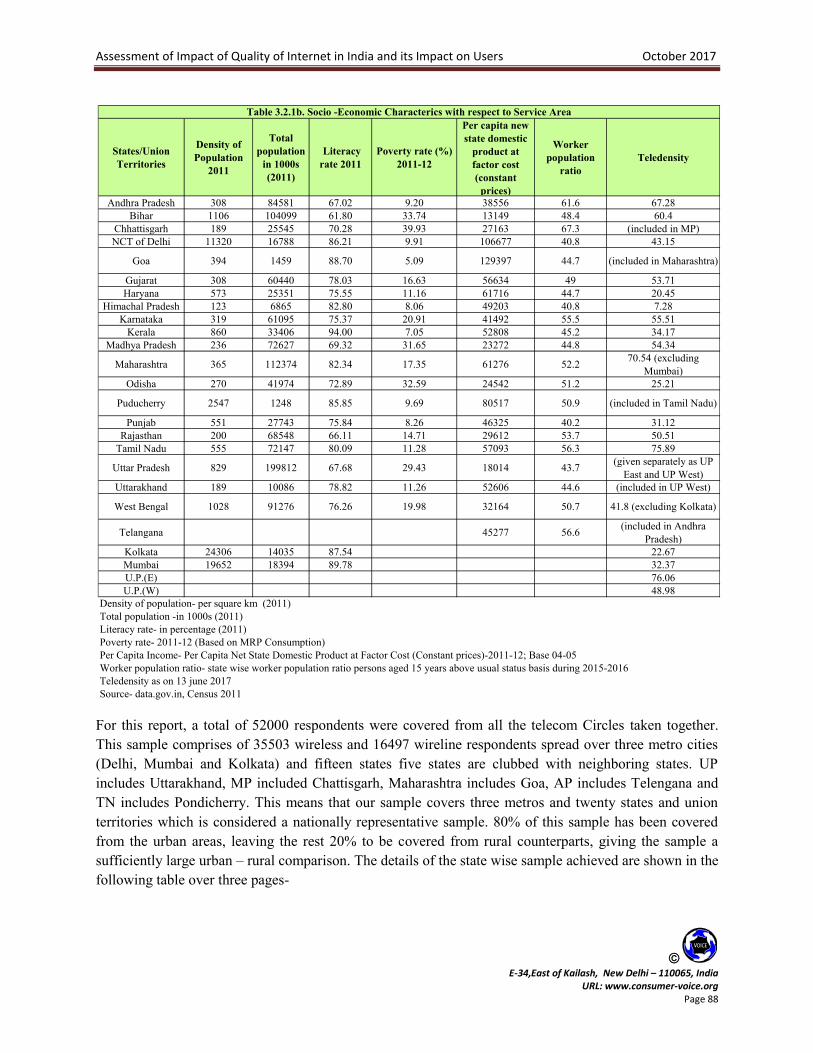
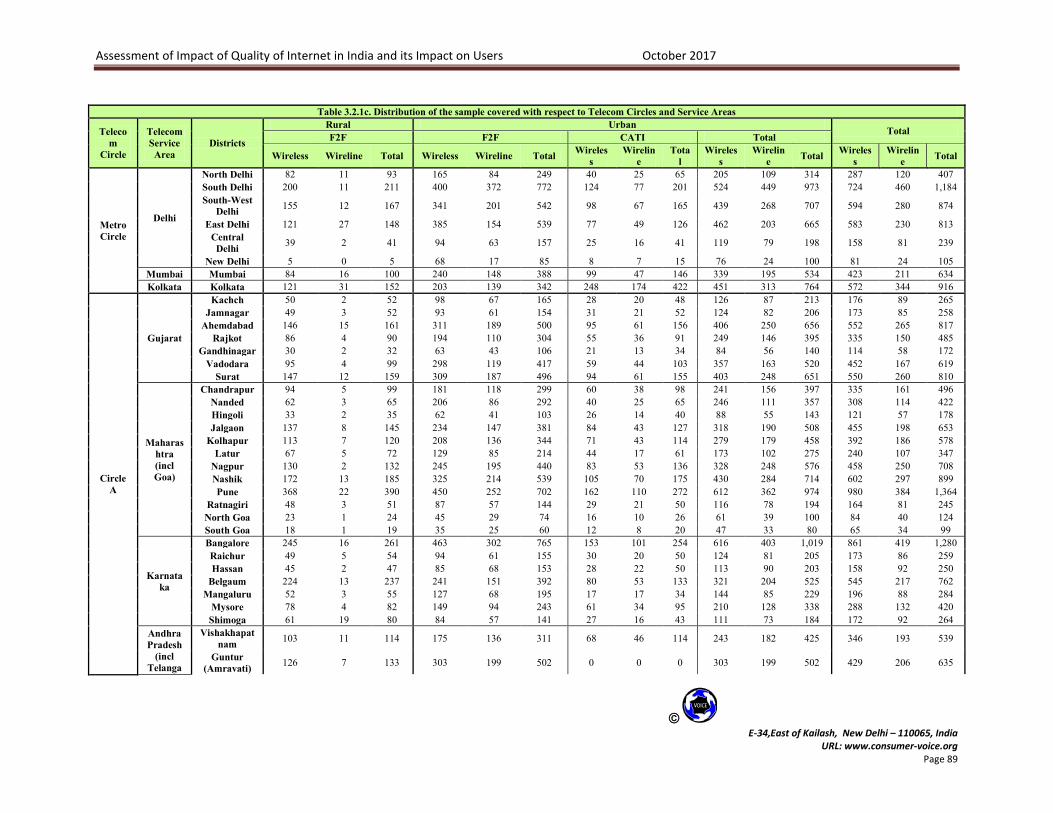
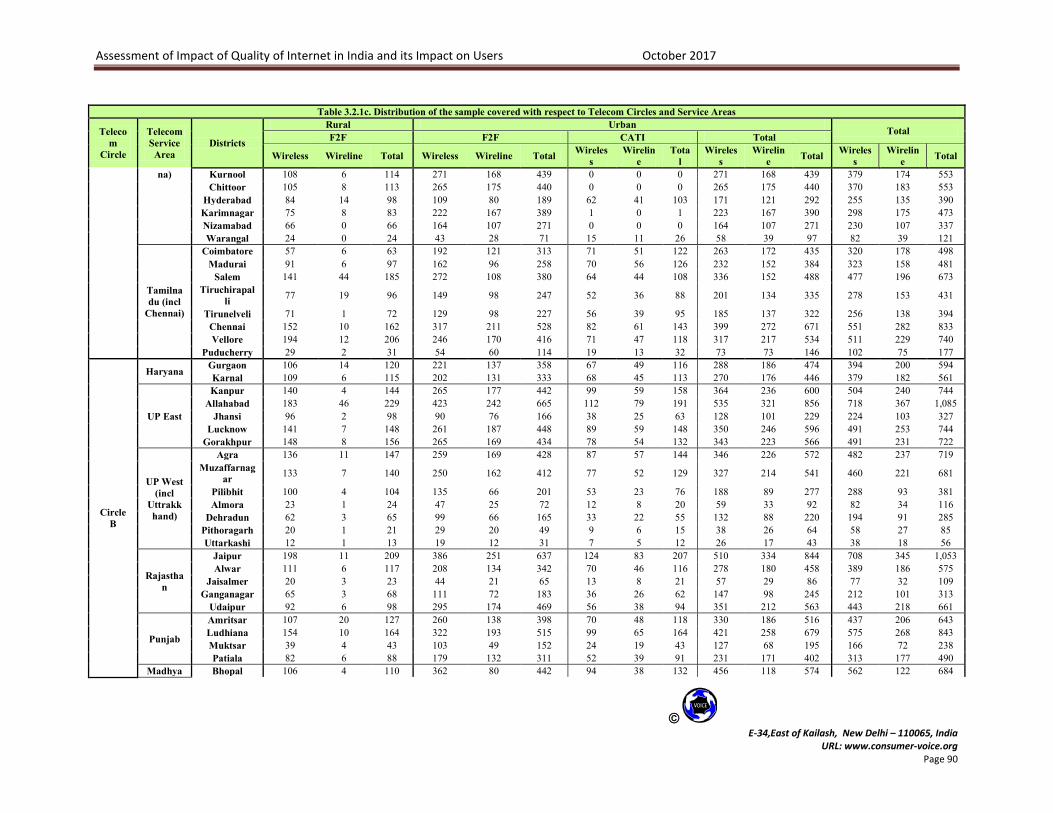
economic parameters have been spelled out in Chapter 4. A total of 52,000 responses from
four telecom circles (Metro, Circle A, Circle B and Circle C) were considered in this study.
Chapter 5 deals with the „average time spent daily on internet‟, and „average expenditure
incurred on internet services per month‟, on the basis of mode of internet use (wireless or
wireline). The relationship between these two variables has also been examined as we
proceed further. On an average, respondents whose main mode of use was wireless internet,
spent 3.5 hours a day on internet while the average hours spent by wireline users was 4.3.
The average mean expenditure per month of respondents covered during the survey on their
main mode of using Internet (Wireless) was at Rs 272 while for wireline internet users, it was
Rs. 895, which was about thrice the amount spent by wireless users per month.
Chapter 6 through 14, deal with „Impact of Quality of Service‟ on total of nine aspects of life
(termed as parameters) where internet is being used. The ratings sought on impact of QoIS on
the parameters and aspects contained therein were scrutinized with the help of key
„statistical tests‟ like comparison of means and regression, which show if there are any
significant differences in the responses. The proportions of respondents who affirmed the
impact of internet on the parameters were very high on each of the parameters. Also, the
mean ratings on the impact of QoIS on these parameters were found to be more than 4 on a
five point scale, implying “high impact” of QoIS on all the parameters.
Under „Daily life‟, the most impacted aspect was found to be „Raising standard of living‟,
followed by „Promoting gender equality‟ and „Helps in child upbringing- intelligence,
knowledge‟.
Under „Development of rural areas‟, „Rural farmers access to new markets‟ was found to be
the most impacted aspect followed by „Access to public services (transport, health, etc.) and
latest information‟, Enhancing employability of rural people in rural areas‟ and „Growth in
scope of earning’.
Of all the eight aspects related to Education and Research, the perception on impact of QoIS
was found to be highest on „Preparing projects/assignments & reports’ and ‘Ease in data
collection‟.
Out of all the aspects covered under „Health and Medical Services‟, „Fitness guidance and
training‟ and 'Delivery of health services to distant places', were found to be the most
important aspects being impacted by the QoIS.
Assessment of Impact of Quality of Internet in India and its Impact on Users October 2017
E-34,East of Kailash, New Delhi – 110065, India
URL: www.consumer-voice.org Page viii
Under „Political and civic participation‟, ‘Wider exposure to Government’s plan & Policies’
(4.24) and ‘Raising voices against social barriers & issues’ were found to be most impacted
aspects.
The overall impact of QoIS on „Empowering people with special needs‟ was found to be
highest on „Availing govt’s facilities’, followed by ‘Increasing opportunities’, and ‘Making
people self-dependent’.
‘Ease in conducting business from one place to distant places’ and ‘Promotes creative work’
were found to be the most impacted aspects under „Business and Jobs‟, closely followed by
‘Searching jobs and getting placements’.
Under „Shopping‟, „Time taken by websites and items to open’ was the top most aspect
impacted by QoIS. This was closely followed by the aspects „Online Tracking of Shipment’ and
„Convenient Shopping-Time and Location’.
The impact of QoIS was found to be highest on „Empowering people to travel alone’ and
„Accessing competitive ticket price’, followed by „Booking of travel packages’ under
„Travelling and Commuting‟.
Under Chapter 15, ranking of all these parameters in the categories of „most important‟,
„very important‟ and „important‟ has been given. Out of the nine aspects, „Daily Life‟ was
found to be the most impacted aspect with regard to the QoIS, followed by „Business and
Work‟ and „Education and Research‟. Many aspects were found to be more important in the
rural areas as compared to urban areas which mostly included social aspects like „women
empowerment‟, „uplifting rural society‟, and „empowering people with special needs‟. QoIS
for „shopping‟ was comparatively less important.
Chapter 16 presents overall impact of QoIS on the parameters and aspects covered in this
study. The Structural Equation Modeling (SEM) was used to run multiple regressions
simultaneously to examine the structure of inter-relationships among various factors by
establishing causality and co-variances. All the aspects were found to be significantly
representing their respective parameters.
Chapter 17 sheds light on the „consumer detriment‟ caused due to loss in time, money or both
because of poor quality of Internet on any of the impact aspects discussed above. The
substantial percentage of people perceiving to have faced any kind of loss due to poor quality
of internet is quite alarming and it asks for stringent regulations and tougher benchmarks that
make it imperative for the ISPs to not cause any more such loss to their subscribers.
Assessment of Impact of Quality of Internet in India and its Impact on Users October 2017
E-34,East of Kailash, New Delhi – 110065, India
URL: www.consumer-voice.org Page ix
Chapter 18 pertains to the supplementary study conducted along with the main study of QoIS.
The chapter analyzes the perceptions of consumers relating to their recent experiences on
various e-governance services such as- Aadhar, PAN, and Passport etc. The strategy used was
two pronged. It includes quantitative as well as qualitative analysis on the perception of
impact of QoIS on e-governance services. Qualitative study was based on 120 personal
interviews conducted with beneficiaries and service providers of these e-governance services.
The study found that there is a high impact of QoIS on provisioning and availing of e-
governance services and the QoIS must improve for the e-governance services to burgeon.
These interviews were video-recorded for accuracy.
It has been established that Internet has become all-pervasive and has merely left a segment
or two untouched. The report has been able to demonstrate that it is not just the provision of
service that will help India become „Digital India‟, rather it is concept of Quality of this
service that determines the sustainability of this vision. It was found that every Internet user,
irrespective of the time and money they spend on Internet, believe that getting promised
quality of service is a non-negotiable pre-requisite to living a digital life.
Last but not the least, the annexure have been included in the report and contain the
essentials of the theoretical framework and the questionnaire that was a result of extensive
review of literature and situational analysis. It also contains the guidelines used for the
qualitative study on impact of QoIS on e-governance. Furthermore, the ANOVA tables, post
hoc tests and regression tables that were generated during analysis of data have been
included in the annexure.
E-34,East of Kailash, New Delhi – 110065, India
URL: www.consumer-voice.org Page xi
SECTION B
EXECUTIVE TABLES
Assessment of Impact of Quality of Internet in India and its Impact on Users October 2017
E-34,East of Kailash, New Delhi – 110065, India
URL: www.consumer-voice.org Page xii
B1. THEORETICAL FRAMEWORK
a. Profound Digital Impact on Lives of Indians
This study aimed to study the Impact of Quality of Internet on the use of internet in Indian
society. It commenced with unraveling the impact of internet on the lives of Indians. Through
extensive literature survey it identified various dimensions of human behavior which had been
influenced by usage of internet. Review of Literature from around the world threw up
hundreds of items. These were reduced to 199 items. A situation appraisal exercise was
conducted to confirm the validity of these 199 items in Indian context with face to face in
depth interviews with a cross section of internet users. This resulted in about 83 new items
relevant to the Indian context. By merging and combining a list of 225 items emerged. These
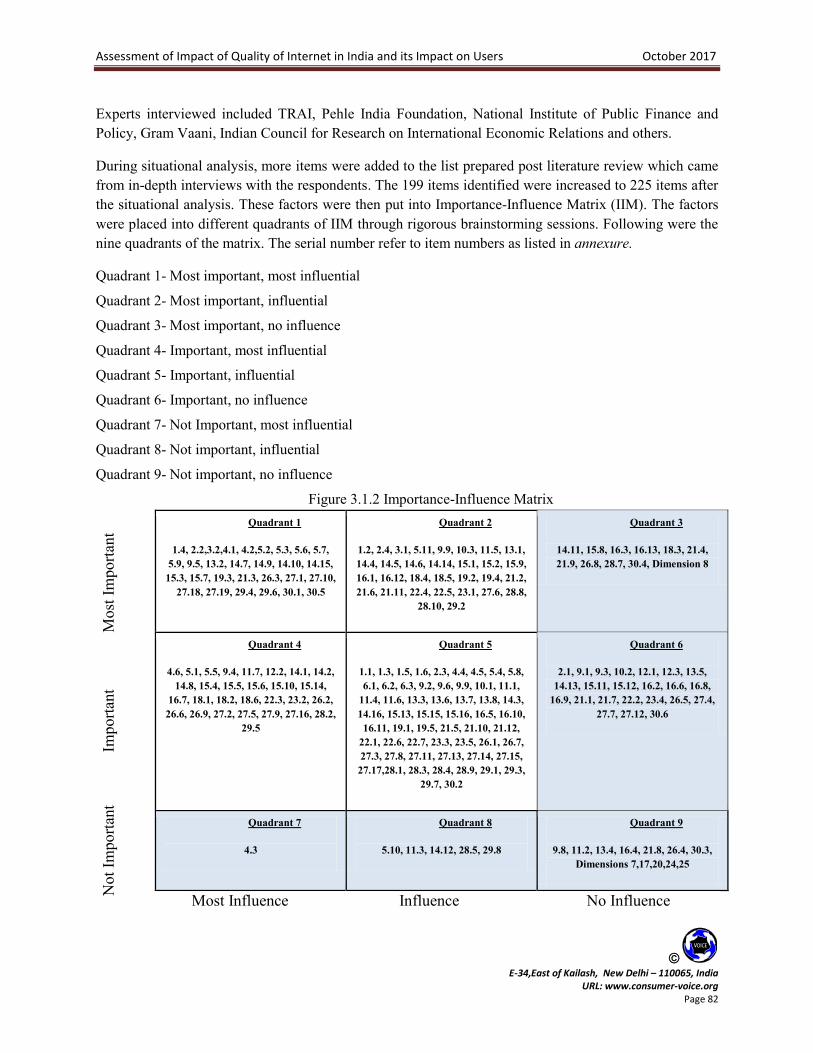
225 items were then analyzed through an Importance influence (IIM) matrix. Through this
process the numbers of items were reduced to 142. These 142 items were then distributed
over 12 different dimensions of a citizen‟s life. The following figure shows these 12
dimensions which have been labeled as parameters for the purpose of measurement in this
study.
Impact of Internet
Daily Life
Developement of Rural
Areas
Education and
Research
Health & Medical Services
Shopping
Travelling &
Commuting
People with special needs Business &
Jobs
Entertainment
Banking & Finance
Women Empowerm
ent
Political & Civic
Participation
Assessment of Impact of Quality of Internet in India and its Impact on Users October 2017
E-34,East of Kailash, New Delhi – 110065, India
URL: www.consumer-voice.org Page xiii
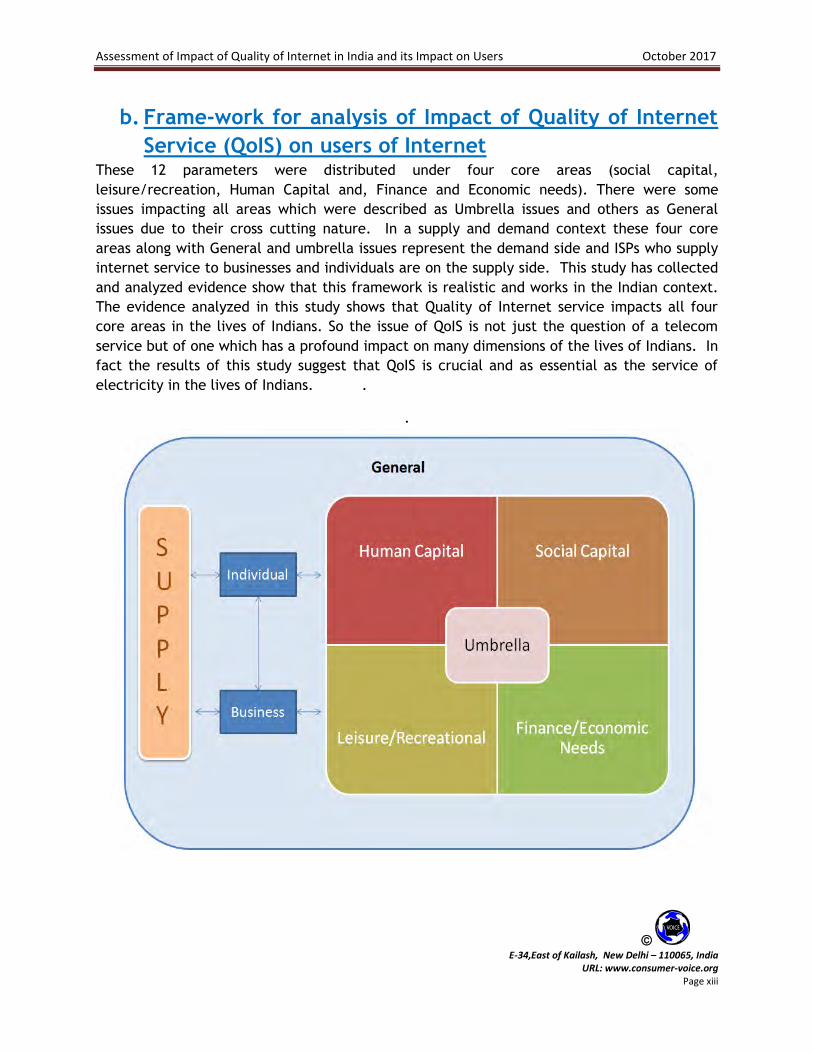
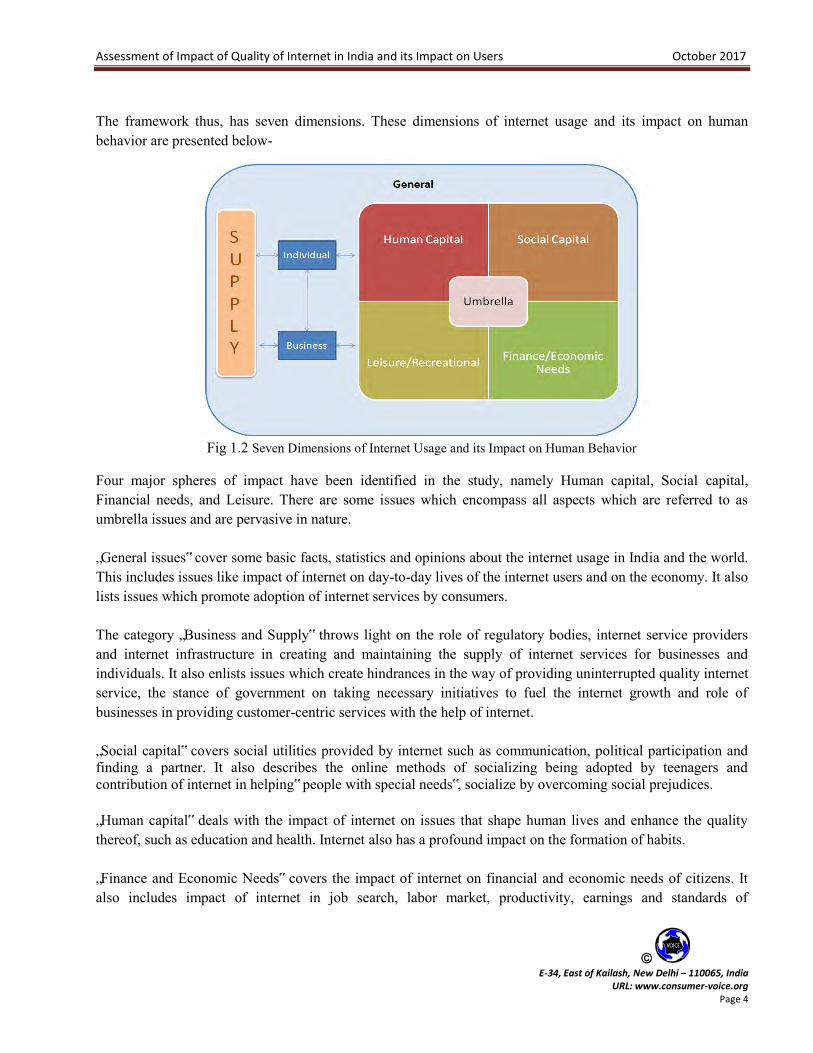
b. Frame-work for analysis of Impact of Quality of Internet
Service (QoIS) on users of Internet These 12 parameters were distributed under four core areas (social capital,
leisure/recreation, Human Capital and, Finance and Economic needs). There were some
issues impacting all areas which were described as Umbrella issues and others as General
issues due to their cross cutting nature. In a supply and demand context these four core
areas along with General and umbrella issues represent the demand side and ISPs who supply
internet service to businesses and individuals are on the supply side. This study has collected
and analyzed evidence show that this framework is realistic and works in the Indian context.
The evidence analyzed in this study shows that Quality of Internet service impacts all four
core areas in the lives of Indians. So the issue of QoIS is not just the question of a telecom
service but of one which has a profound impact on many dimensions of the lives of Indians. In
fact the results of this study suggest that QoIS is crucial and as essential as the service of
electricity in the lives of Indians. .
.
Assessment of Impact of Quality of Internet in India and its Impact on Users October 2017
E-34,East of Kailash, New Delhi – 110065, India
URL: www.consumer-voice.org Page xiv
c. Measuring Quality of Internet Service Quality of any service is seen through the eyes of its users. VOICE has conducted several
studies of quality of a wide range of services for over a decade. The different key service
aspects of use to a consumer can be measured on a scale. Based on our previous work on
measurement of quality of telecom and internet services we have developed a framework of
decomposing quality of Internet service to five constituent parameters. Each of these five
parameters is composed of a number of aspects each of which can be measured on a five
point scale. (A score of 1 represents poor on five constituents of quality and a score of 5
represents excellent). The following figure shows the scores of different ISPs using this
methodology.
Using this framework we have measured quality of service of all the service providers on a
sample of 52000 respondents who use internet services. The results show that „Speed‟,
„Reliability‟ and „Help/Customer Care services‟ are the most important parameters while
determining overall quality of internet service. It is also seen that in the wireline segment,
local ISPs have been rated much better than the national brands overall. You Broadband,
Hathway and GTPL have been rated better than national ISPs like Airtel, Rel Comm,
MTNL/BSNL and Tata. Spectranet, Hathway and Tikona are rated better than national brands
in Metro Circle while Spidigo, Beamtele, You Broadband, Hathway, GTPL and Tikona are rated
higher than national ISPs in Circle A.
Overall Quality of Internet
Service
Availability
Speed
ReliabilityBilling & Charges
Help/Customer Care
Services
Assessment of Impact of Quality of Internet in India and its Impact on Users October 2017
E-34,East of Kailash, New Delhi – 110065, India
URL: www.consumer-voice.org Page xv
B2. EXECUTIVE TABLES OF ASSESSMENT OF QUALITY OF INTERNET SERVICE
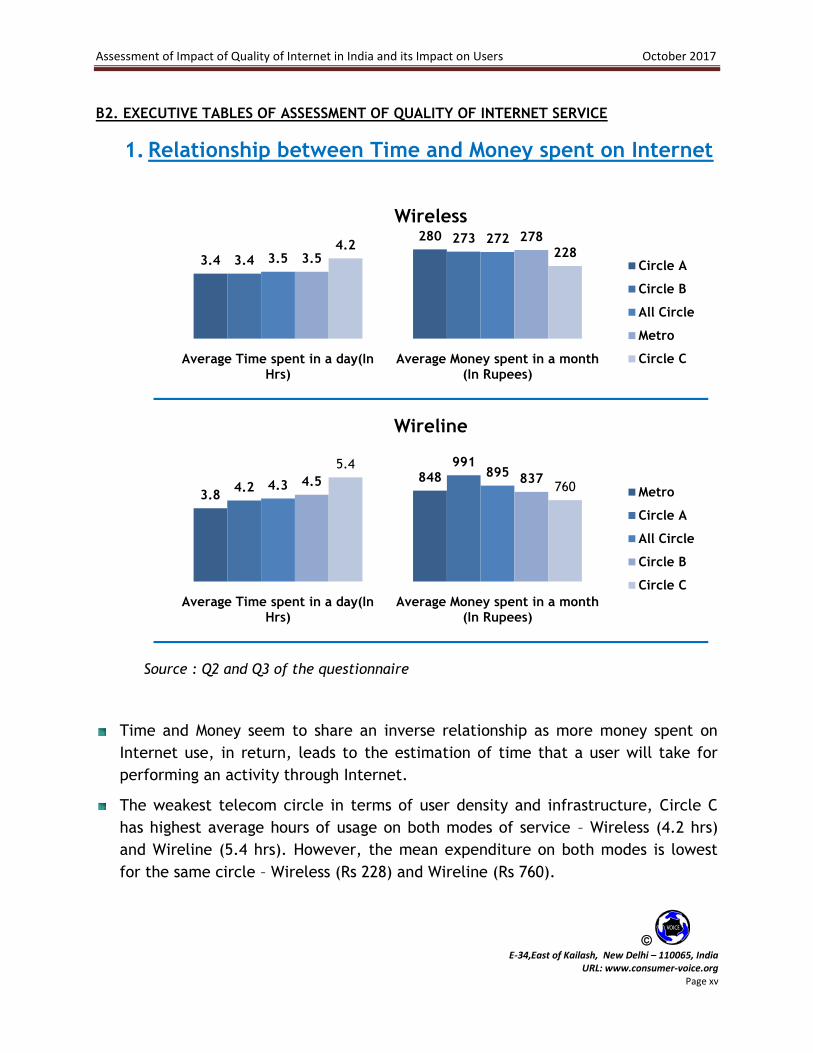
1. Relationship between Time and Money spent on Internet
Source : Q2 and Q3 of the questionnaire
Time and Money seem to share an inverse relationship as more money spent on
Internet use, in return, leads to the estimation of time that a user will take for
performing an activity through Internet.
The weakest telecom circle in terms of user density and infrastructure, Circle C
has highest average hours of usage on both modes of service – Wireless (4.2 hrs)
and Wireline (5.4 hrs). However, the mean expenditure on both modes is lowest
for the same circle – Wireless (Rs 228) and Wireline (Rs 760).
3.4
280
3.4
273
3.5
272
3.5
2784.2
228
Average Time spent in a day(In Hrs)
Average Money spent in a month (In Rupees)
Wireless
Circle A
Circle B
All Circle
Metro
Circle C
3.8
8484.2
991
4.3895
4.5 8375.4
760
Average Time spent in a day(In Hrs)
Average Money spent in a month (In Rupees)
Wireline
Metro
Circle A
All Circle
Circle B
Circle C
Assessment of Impact of Quality of Internet in India and its Impact on Users October 2017
E-34,East of Kailash, New Delhi – 110065, India
URL: www.consumer-voice.org Page xvi
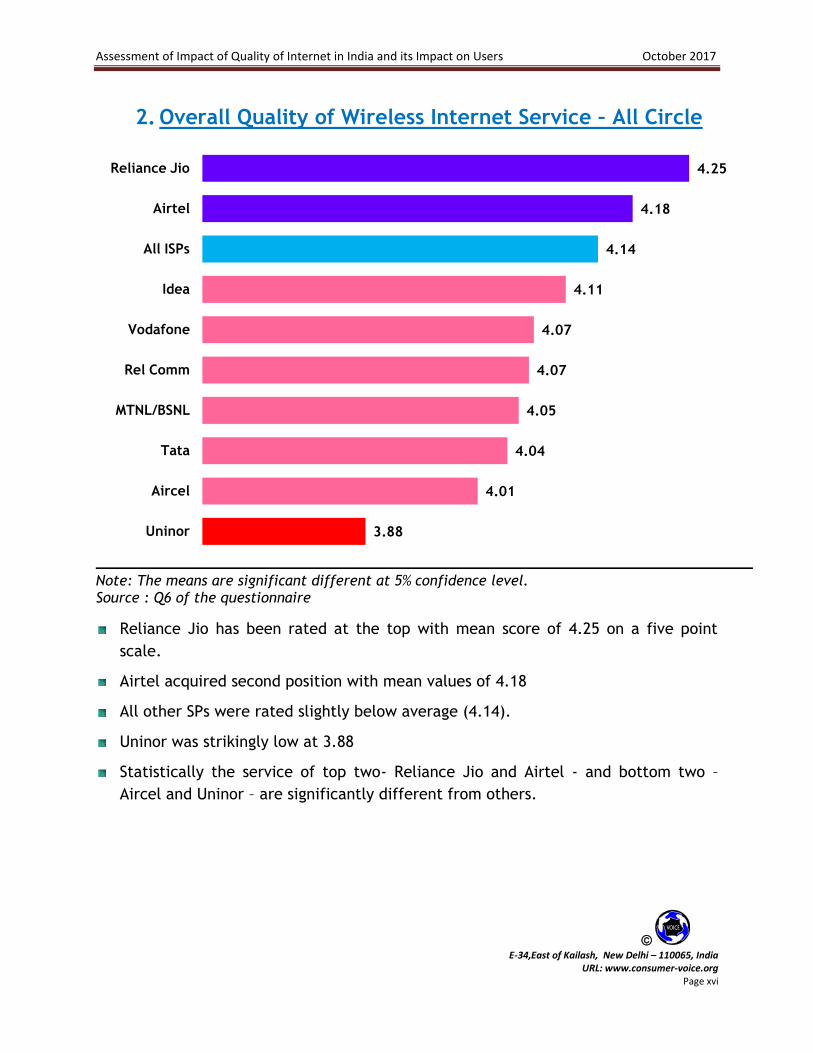
2. Overall Quality of Wireless Internet Service – All Circle
Note: The means are significant different at 5% confidence level. Source : Q6 of the questionnaire
Reliance Jio has been rated at the top with mean score of 4.25 on a five point
scale.
Airtel acquired second position with mean values of 4.18
All other SPs were rated slightly below average (4.14).
Uninor was strikingly low at 3.88
Statistically the service of top two- Reliance Jio and Airtel - and bottom two –
Aircel and Uninor – are significantly different from others.
3.88
4.01
4.04
4.05
4.07
4.07
4.11
4.14
4.18
4.25
Uninor
Aircel
Tata
MTNL/BSNL
Rel Comm
Vodafone
Idea
All ISPs
Airtel
Reliance Jio
Assessment of Impact of Quality of Internet in India and its Impact on Users October 2017
E-34,East of Kailash, New Delhi – 110065, India
URL: www.consumer-voice.org Page xvii
3. Overall Quality of Wireline Internet Service – All Circle
Note: The means are significant different at 5% confidence level. Source : Q6 of the questionnaire
You Broadband was ranked as the top most provider with the average score of
4.71 on a five point scale.
Hathway (4.55), GTPL (4.46), Airtel (4.24) and Tikona (4.20) were also rated above
average (4.17).
The service of You Broadband has statistical significant difference with all other
providers.
3.95
3.99
4.06
4.09
4.10
4.12
4.17
4.20
4.24
4.46
4.55
4.71
Connect
Alliance
Tata
MTNL/BSNL
Asianet
Rel Comm
All ISPs
Tikona
Airtel
GTPL
Hathway
You Broadband
Assessment of Impact of Quality of Internet in India and its Impact on Users October 2017
E-34,East of Kailash, New Delhi – 110065, India
URL: www.consumer-voice.org Page xviii
4. Consumer perception on speed of Internet service-
Wireless
Note: The means are significant different at 5% confidence level. Source : Q5 of the questionnaire
Reliance Jio obtained highest mean rating of 4.29 on a five point scale.
Airtel (4.26) and Rel Comm (4.23) occupied second and third position respectively.
Idea (4.20) was marginally lower than overall average of 4.21 .
Uninor was remarkably low at 3.85.
The top performer – Reliance Jio and worst performer – Uninor were statistically
different from all others.
3.85
4.03
4.05
4.13
4.15
4.20
4.21
4.23
4.26
4.29
Uninor
Aircel
Tata
MTNL/BSNL
Vodafone
Idea
All ISPs
Rel Comm
Airtel
Reliance Jio
Assessment of Impact of Quality of Internet in India and its Impact on Users October 2017
E-34,East of Kailash, New Delhi – 110065, India
URL: www.consumer-voice.org Page xix
5. Consumer perception on speed of Internet service -
Wireline
Note: The means are significant different at 5% confidence level. Source : Q5 of the questionnaire
You broadband was rated highest with mean rating of 4.42, closely followed by
Hathway (4.38) on a five point scale.
Regional providers - Alliance (4.37) and GTPL (4.35) were rated above national
providers - Airtel (4.33) and Tikona (4.31).
All other ISPs were rated below average score of 4.25.
Connect Broadband with rating of 3.97 was significantly different from all others
except Asianet.
3.97
4.05
4.16
4.17
4.20
4.25
4.31
4.33
4.35
4.37
4.38
4.42
Connect
Asianet
Tata
Rel Comm
MTNL/BSNL
All ISPs
Tikona
Airtel
GTPL
Alliance
Hathway
You Broadband
Assessment of Impact of Quality of Internet in India and its Impact on Users October 2017
E-34,East of Kailash, New Delhi – 110065, India
URL: www.consumer-voice.org Page xx
6. Consumer perception on Reliability Internet Service -
Wireless
Note: The means are significant different at 5% confidence level. Source : Q6 of the questionnaire
Most reliable Wireless ISP was Reliance Jio with mean rating of 4.28 on a five
point scale.
Airtel and Rel Comm with mean ratings of 4.24 and 4.22 respectively were also
more reliable than the whole lot.
All other national providers were below the average mark (4.20).
The service reliability of Uninor, rated least at 3.87, was found to be
significantly different from all the others.
3.87
4.03
4.05
4.12
4.13
4.19
4.20
4.22
4.24
4.28
Uninor
Aircel
Tata
MTNL/BSNL
Vodafone
Idea
All ISPs
Rel Comm
Airtel
Reliance Jio
Assessment of Impact of Quality of Internet in India and its Impact on Users October 2017
E-34,East of Kailash, New Delhi – 110065, India
URL: www.consumer-voice.org Page xxi
7. Consumer perception on Reliability of Internet Service -
Wireline
Note: The means are significant different at 5% confidence level. Source : Q6 of the questionnaire
You Broadband was rated highest at 4.72 on a five point scale.
Hathway (4.58) acquired a distant second position.
Regional provider - GTPL that serves in Gujarat, Maharashtra and Rajasthan
was rated more than Airtel and Tikona – providers having national footprint.
Government owned ISPs- MTNL/BSNL (4.24) was rated below average of 4.31.
Connect Broadband was rated least at 3.87 and differed significantly from all
nine other ISPs except Asianet.
3.87
3.96
4.18
4.21
4.24
4.27
4.31
4.32
4.40
4.49
4.58
4.72
Connect
Asianet
Alliance
Tata
MTNL/BSNL
Rel Comm
All ISPs
Tikona
Airtel
GTPL
Hathway
You Broadband
Assessment of Impact of Quality of Internet in India and its Impact on Users October 2017
E-34,East of Kailash, New Delhi – 110065, India
URL: www.consumer-voice.org Page xxii
8. Did you ever have a problem with internet service?
Source : Q34 of the questionnaire
Irrespective of the mode of Internet Use, every three out of ten claimed that
they have faced problem(s) in their Internet service.
The highest percentages of problem facing respondents were concentrated in
Circle C, where the ratio increased to five in ten wireless respondents and four
in ten for wireline respondents.
Due to the innate nature of wireless connections, which are considered be less
reliable in comparison to wireline connections, everywhere except Metro and
Circle A – the percentages of problem facing wireless respondents is higher
than that of problem facing wireline respondents.
31.7%
26.5%23.7%
28.0%30.9%
29.1%
34.3% 34.6%
54.4%
40.0%
Wireless Wireline
Circle B Circle A All Circle Metro Circle C
Assessment of Impact of Quality of Internet in India and its Impact on Users October 2017
E-34,East of Kailash, New Delhi – 110065, India
URL: www.consumer-voice.org Page xxiii
9. Status of Problem Resolution by ISPs
Source : Q34 of the questionnaire
Of all the respondents who had faced at least one problem with their
wireline/wireless internet connection, about two-third reported that their
problems got completely solved
The highest percentages of respondents who reported that their problems were
completely solved belonged to respondents of Circle A, whereas lowest were in
Circle C.
Almost 15% of the respondents who faced problems remarked that their
problems were not solved at all. This proportion was highest for Circle B
respondents.
44.3%
64.2%
64.6%
65.6%
68.7%
38.4%
23.3%
19.7%
16.9%
16.8%
17.3%
12.5%
15.7%
17.5%
14.5%
Circle C
Metro
All Circle
Circle B
Circle A
Wir
ele
ss
Completely Solved Partly Solved Not Solved at all
51.7%
60.2%
67.8%
71.0%
75.7%
33.3%
20.5%
17.5%
18.3%
12.0%
15.0%
19.3%
14.7%
10.7%
12.3%
Circle C
Circle B
All Circle
Metro
Circle A
Wir
eline
Assessment of Impact of Quality of Internet in India and its Impact on Users October 2017
E-34,East of Kailash, New Delhi – 110065, India
URL: www.consumer-voice.org Page xxiv
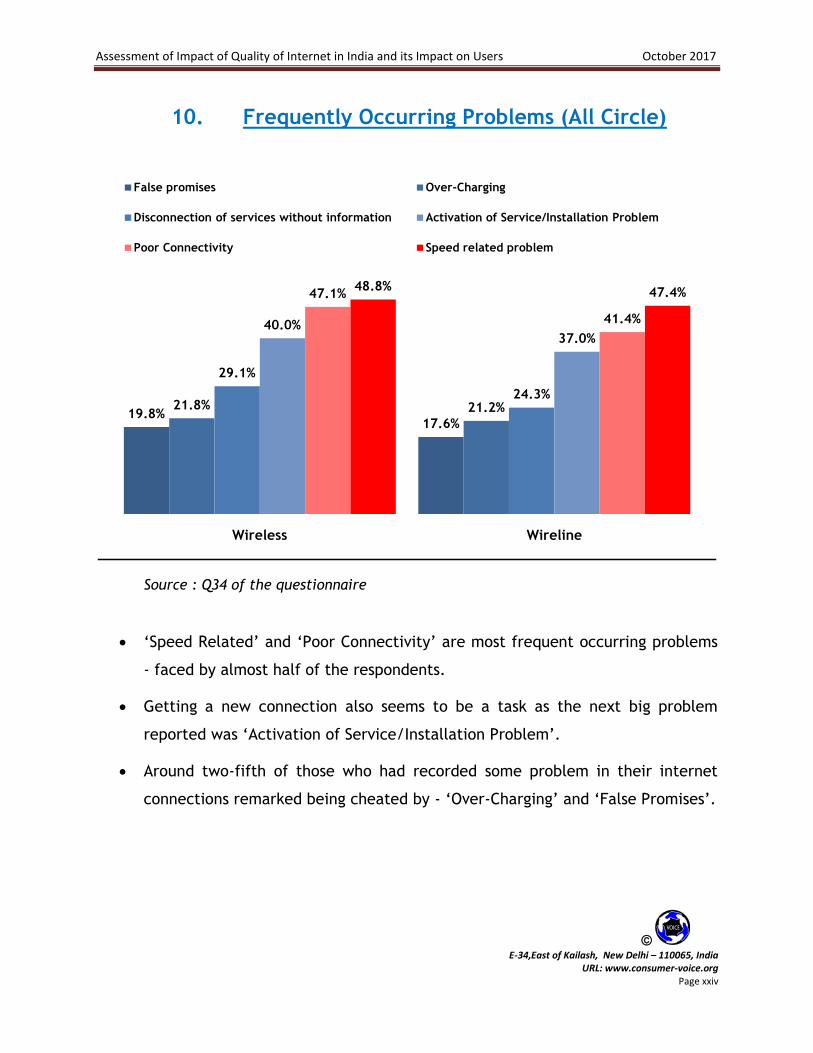
10. Frequently Occurring Problems (All Circle)
Source : Q34 of the questionnaire
„Speed Related‟ and „Poor Connectivity‟ are most frequent occurring problems
- faced by almost half of the respondents.
Getting a new connection also seems to be a task as the next big problem
reported was „Activation of Service/Installation Problem‟.
Around two-fifth of those who had recorded some problem in their internet
connections remarked being cheated by - „Over-Charging‟ and „False Promises‟.
19.8%17.6%
21.8% 21.2%
29.1%
24.3%
40.0%37.0%
47.1%
41.4%
48.8%47.4%
Wireless Wireline
False promises Over-Charging
Disconnection of services without information Activation of Service/Installation Problem
Poor Connectivity Speed related problem
Assessment of Impact of Quality of Internet in India and its Impact on Users October 2017
E-34,East of Kailash, New Delhi – 110065, India
URL: www.consumer-voice.org Page xxv
11. Average Download Speed recorded in all circles
Source: Criterion for Speed Testing
Average 4G Download Speed was 4.10 mbps. Except Kerela, Bihar and Odisha,
all other states had attained below average speeds. When compared provider
wise, Airtel was the only one providing more than average speed.
Average 3G Download Speed was 1.50 mbps. However, the mean average
attained in UP was almost double of this. BSNL provided more than average
speed of 1.61 mbps.
In the case of $G speed, Airetl with 6.05 attained highest average speed
followed by Reliance Jio (4.07) and Vodafone 3.45.
2.55
3.90 3.893.27
6.13
3.14
4.26
5.52
4.10
Average 4G Download Speeds
0.79
1.66 1.52
0.71
1.93
2.98
0.65
1.231.50
Delhi Gujarat Karnataka Punjab Kerala UP Bihar Odisha
Average 3G Download Speeds
6.054.07
3.452.85
1.61 .79
Airtel Reliance Jio Vodafone Idea BSNL MTNL
4G 3G
Assessment of Impact of Quality of Internet in India and its Impact on Users October 2017
E-34,East of Kailash, New Delhi – 110065, India
URL: www.consumer-voice.org Page xxvi
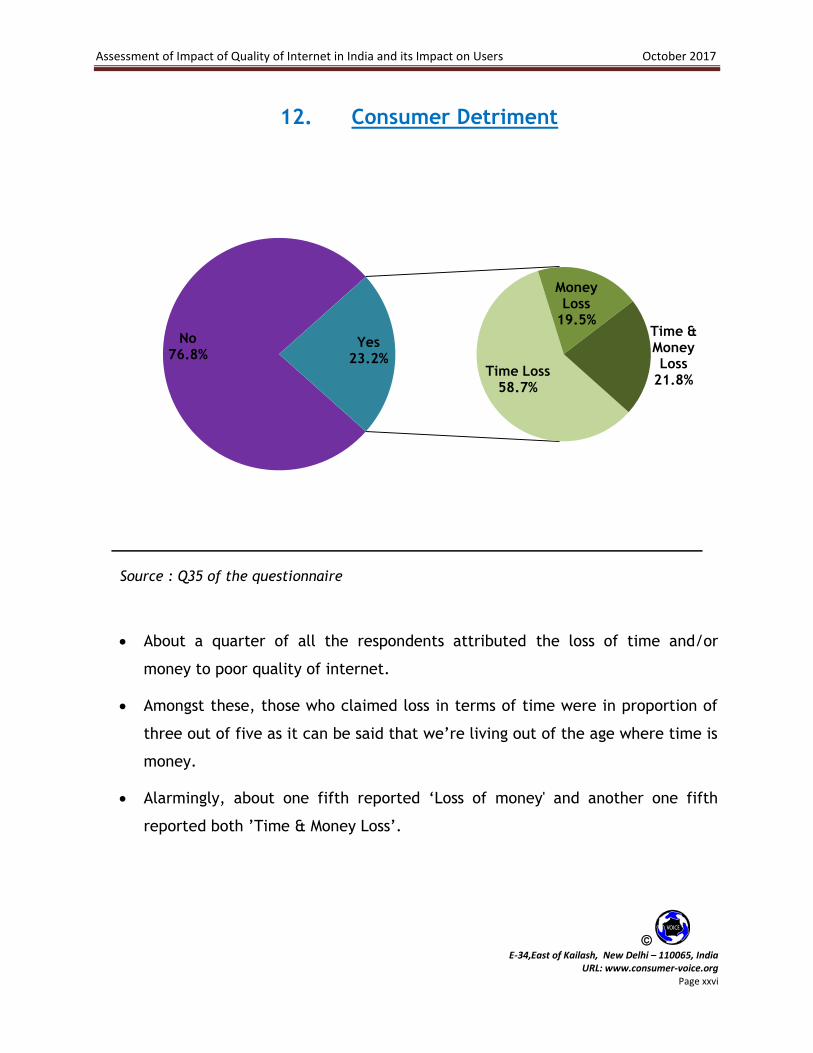
12. Consumer Detriment
Source : Q35 of the questionnaire
About a quarter of all the respondents attributed the loss of time and/or
money to poor quality of internet.
Amongst these, those who claimed loss in terms of time were in proportion of
three out of five as it can be said that we‟re living out of the age where time is
money.
Alarmingly, about one fifth reported „Loss of money' and another one fifth
reported both ‟Time & Money Loss‟.
No 76.8%
Time Loss58.7%
Money Loss
19.5%Time & Money Loss
21.8%
Yes23.2%
Assessment of Impact of Quality of Internet in India and its Impact on Users October 2017
E-34,East of Kailash, New Delhi – 110065, India
URL: www.consumer-voice.org Page xxvii
B2. EXECUTIVE TABLES OF IMPACT OF QUALITY OF INTERNET SERVICE
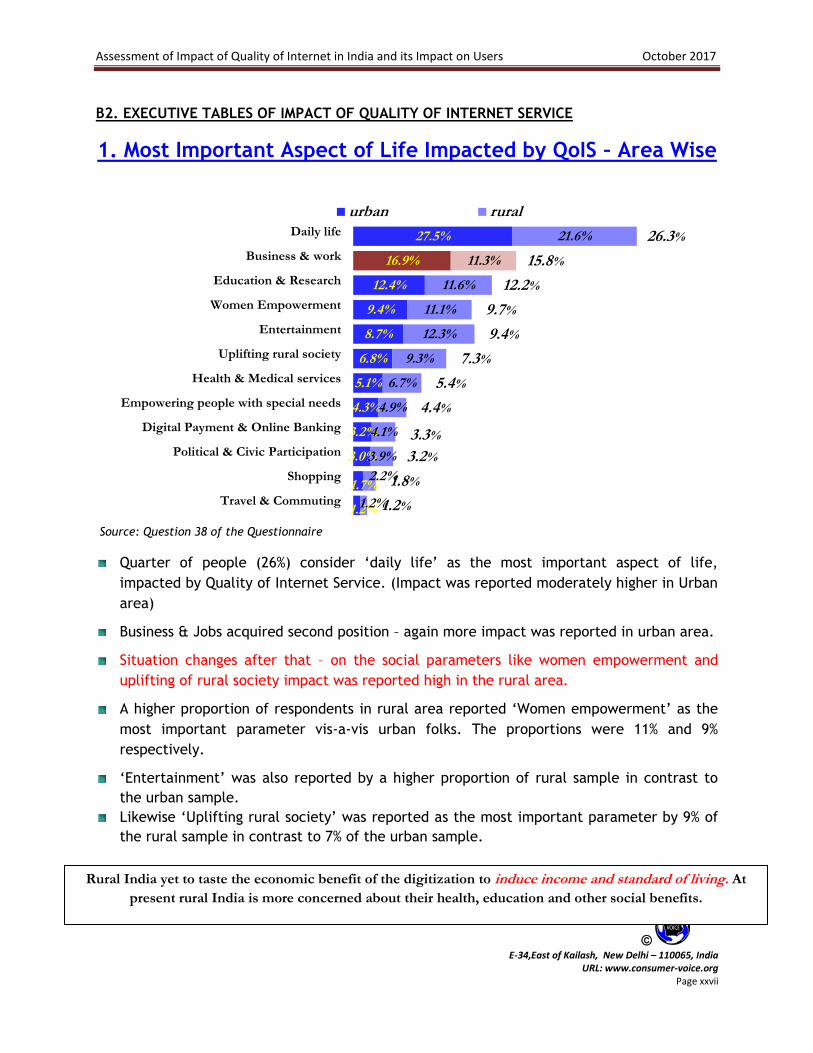
1. Most Important Aspect of Life Impacted by QoIS – Area Wise
Source: Question 38 of the Questionnaire
Quarter of people (26%) consider „daily life‟ as the most important aspect of life,
impacted by Quality of Internet Service. (Impact was reported moderately higher in Urban
area)
Business & Jobs acquired second position – again more impact was reported in urban area.
Situation changes after that – on the social parameters like women empowerment and
uplifting of rural society impact was reported high in the rural area.
A higher proportion of respondents in rural area reported „Women empowerment‟ as the
most important parameter vis-a-vis urban folks. The proportions were 11% and 9%
respectively.
„Entertainment‟ was also reported by a higher proportion of rural sample in contrast to
the urban sample.
Likewise „Uplifting rural society‟ was reported as the most important parameter by 9% of
the rural sample in contrast to 7% of the urban sample.
1.2%
1.7%
3.0%
3.2%
4.3%
5.1%
6.8%
8.7%
9.4%
12.4%
16.9%
27.5%
1.2%
2.2%
3.9%
4.1%
4.9%
6.7%
9.3%
12.3%
11.1%
11.6%
11.3%
21.6%
1.2%
1.8%
3.2%
3.3%
4.4%
5.4%
7.3%
9.4%
9.7%
12.2%
15.8%
26.3%
Travel & Commuting
Shopping
Political & Civic Participation
Digital Payment & Online Banking
Empowering people with special needs
Health & Medical services
Uplifting rural society
Entertainment
Women Empowerment
Education & Research
Business & work
Daily life
urban rural
Rural India yet to taste the economic benefit of the digitization to induce income and standard of living. At
present rural India is more concerned about their health, education and other social benefits.
Assessment of Impact of Quality of Internet in India and its Impact on Users October 2017
E-34,East of Kailash, New Delhi – 110065, India
URL: www.consumer-voice.org Page xxviii
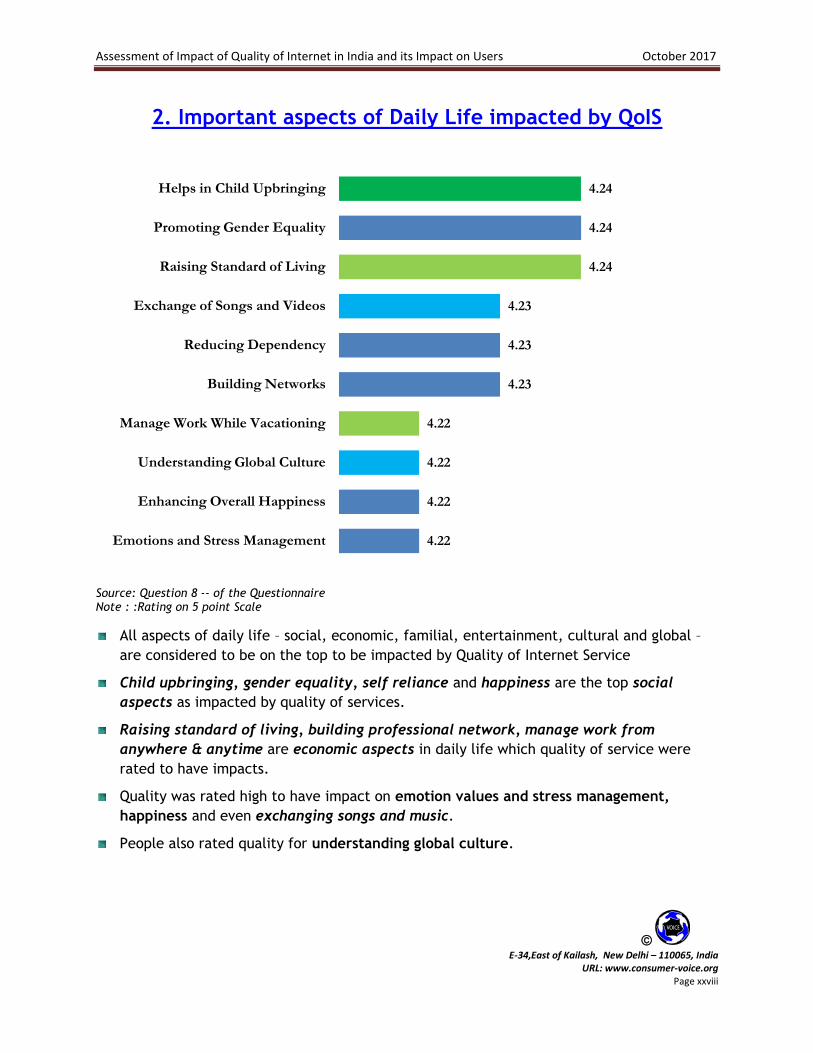
2. Important aspects of Daily Life impacted by QoIS
Source: Question 8 -- of the Questionnaire Note : :Rating on 5 point Scale
All aspects of daily life – social, economic, familial, entertainment, cultural and global –
are considered to be on the top to be impacted by Quality of Internet Service
Child upbringing, gender equality, self reliance and happiness are the top social
aspects as impacted by quality of services.
Raising standard of living, building professional network, manage work from
anywhere & anytime are economic aspects in daily life which quality of service were
rated to have impacts.
Quality was rated high to have impact on emotion values and stress management,
happiness and even exchanging songs and music.
People also rated quality for understanding global culture.
4.22
4.22
4.22
4.22
4.23
4.23
4.23
4.24
4.24
4.24
Emotions and Stress Management
Enhancing Overall Happiness
Understanding Global Culture
Manage Work While Vacationing
Building Networks
Reducing Dependency
Exchange of Songs and Videos
Raising Standard of Living
Promoting Gender Equality
Helps in Child Upbringing
Assessment of Impact of Quality of Internet in India and its Impact on Users October 2017
E-34,East of Kailash, New Delhi – 110065, India
URL: www.consumer-voice.org Page xxix
3. Impact of QoIS on Business & Jobs
Source: Question 26 -- of the Questionnaire
Note : :Rating on 5 point Scale
Internet has truly revolutionized the way people do their business and fulfill their job
responsibilities.
Ease of doing business and adding value to the work (creativity) were the two aspects
to be rated at the top as impacted by quality of internet service.
Internet and its quality also impact the way the people search for jobs for better
placement.
Emailing & social media, enhancing quality of work, filing of tax returns and other
legal obligations and inducing revenue, profits & income are other important areas to
be impacted by QoIS.
4.21
4.21
4.24
4.24
4.24
4.24
4.25
4.27
4.27
Quality of Business Meetings
Work from home
Inducing revenue, profit & income
Facilitating filing of e-forms & returns
Enhancing the quality of work
Working through email & social media
Searching jobs & getting placements
Promotes creative work
Ease in conducting business from one place to distant places
Assessment of Impact of Quality of Internet in India and its Impact on Users October 2017
E-34,East of Kailash, New Delhi – 110065, India
URL: www.consumer-voice.org Page xxx
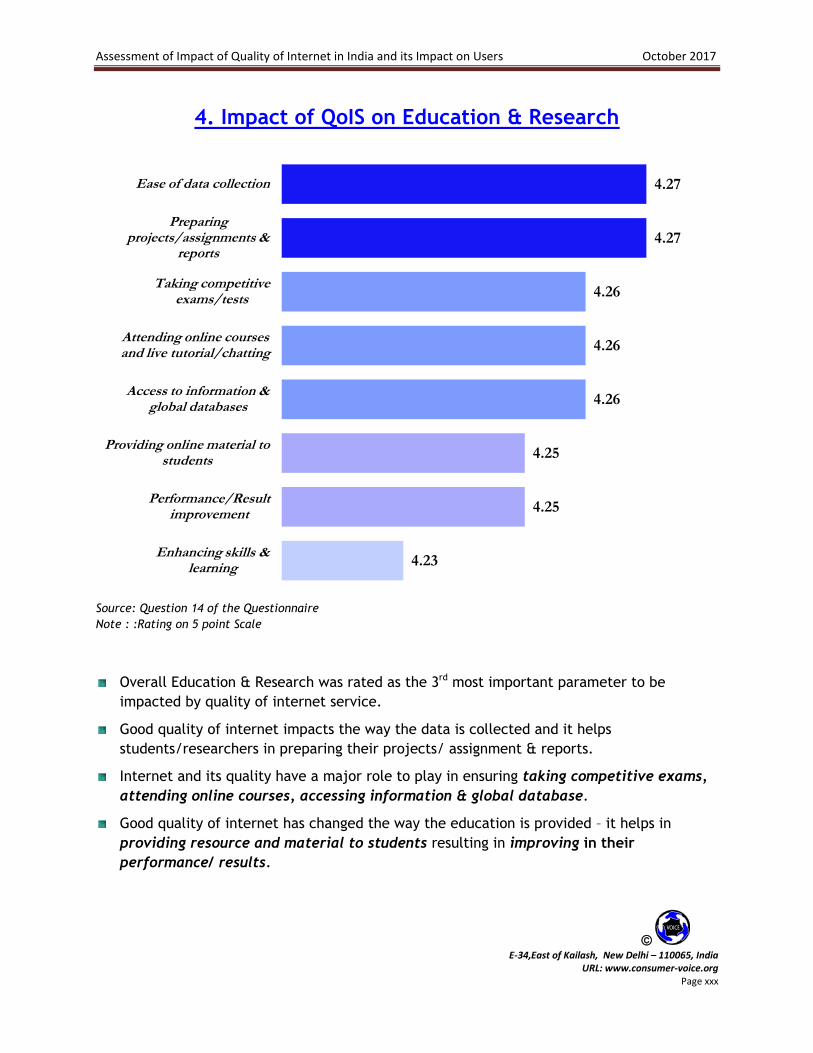
4. Impact of QoIS on Education & Research
Source: Question 14 of the Questionnaire
Note : :Rating on 5 point Scale
Overall Education & Research was rated as the 3rd most important parameter to be
impacted by quality of internet service.
Good quality of internet impacts the way the data is collected and it helps
students/researchers in preparing their projects/ assignment & reports.
Internet and its quality have a major role to play in ensuring taking competitive exams,
attending online courses, accessing information & global database.
Good quality of internet has changed the way the education is provided – it helps in
providing resource and material to students resulting in improving in their
performance/ results.
4.23
4.25
4.25
4.26
4.26
4.26
4.27
4.27
Enhancing skills & learning
Performance/Result improvement
Providing online material to students
Access to information & global databases
Attending online courses and live tutorial/chatting
Taking competitive exams/tests
Preparing projects/assignments &
reports
Ease of data collection
Assessment of Impact of Quality of Internet in India and its Impact on Users October 2017
E-34,East of Kailash, New Delhi – 110065, India
URL: www.consumer-voice.org Page xxxi
5. Impact of QoIS in the Development of Rural Area
Source: Question 11 of the Questionnaire
Note : :Rating on 5 point Scale
Good Quality of Internet Service has greater impact for the development of rural India as
almost all the aspects listed above were rated high.
“Rural farmers’ access to the new market” is the most important aspect to be impacted
by the quality of services for the development of rural India.
Quality of service more or less equally impacts “Growth in Scope of earning”, “Access
to public service” and “Enhancing employability of rural people” in the rural India.
“Education” and “Farming process” followed by “Bridging of gap with urban and rural
both” are other aspects which are rated to be impacted by quality of internet services.
4.05
4.08
4.14
4.15
4.11
4.17
4.19
4.18
4.27
4.29
4.29
4.35
4.32
4.31
4.31
4.33
4.15
4.12
4.17
4.11
4.19
4.20
4.20
4.20
3.87
3.93
4.02
4.07
4.08
4.02
4.00
4.03
4.17
4.17
4.21
4.22
4.23
4.23
4.23
4.24
Bridging gap with other rural areas
Bridging gap with urban areas
Improves farming processes
Better access to higher education
Enhancing employability of rural people in urban areas
Access to public services (transport, health etc.) and latest information
Growth in scope of earning
Rural farmers access to new markets
Metro Circle A Circle B Circle C OVERALL
Good quality of internet service has the potential to change the face of rural India through enhancing income
of farmers and also assuring provision of education and medical health facilities.
Assessment of Impact of Quality of Internet in India and its Impact on Users October 2017
E-34,East of Kailash, New Delhi – 110065, India
URL: www.consumer-voice.org Page xxxii
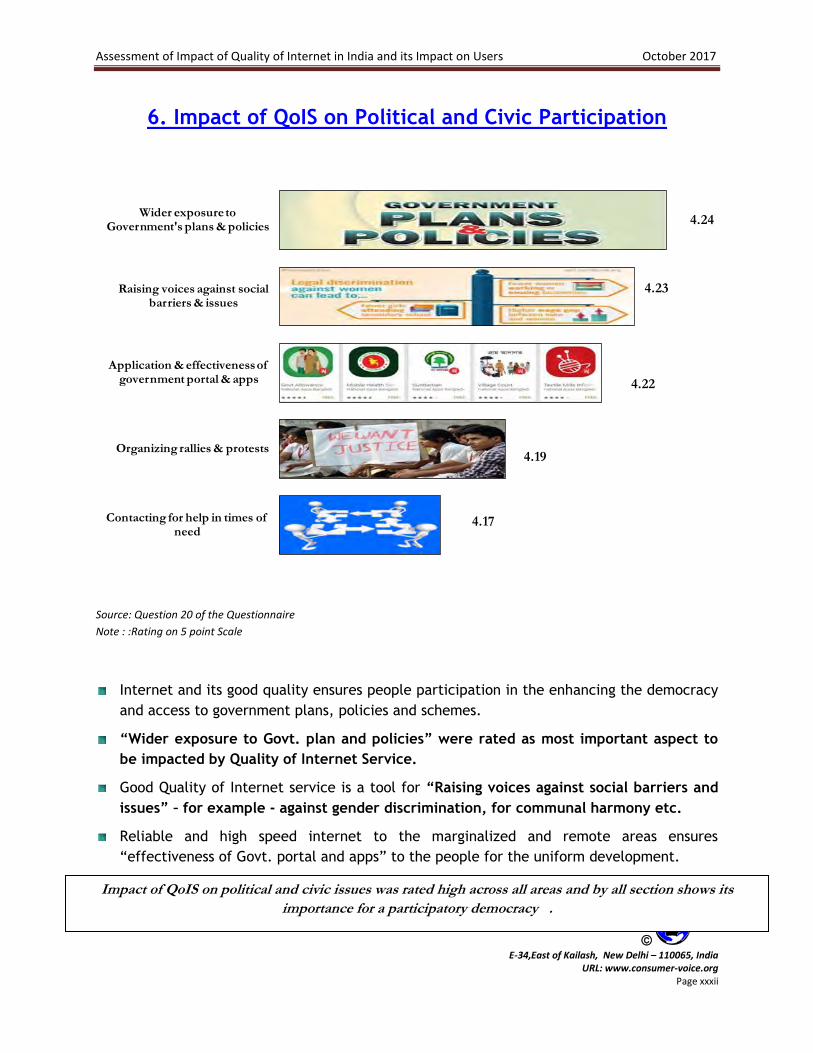
6. Impact of QoIS on Political and Civic Participation
Source: Question 20 of the Questionnaire
Note : :Rating on 5 point Scale
Internet and its good quality ensures people participation in the enhancing the democracy
and access to government plans, policies and schemes.
“Wider exposure to Govt. plan and policies” were rated as most important aspect to
be impacted by Quality of Internet Service.
Good Quality of Internet service is a tool for “Raising voices against social barriers and
issues” – for example - against gender discrimination, for communal harmony etc.
Reliable and high speed internet to the marginalized and remote areas ensures
“effectiveness of Govt. portal and apps” to the people for the uniform development.
4.17
4.19
4.22
4.23
4.24
Contacting for help in times of need
Organizing rallies & protests
Application & effectiveness of government portal & apps
Raising voices against social barriers & issues
Wider exposure to Government's plans & policies
Impact of QoIS on political and civic issues was rated high across all areas and by all section shows its
importance for a participatory democracy .
Assessment of Impact of Quality of Internet in India and its Impact on Users October 2017
E-34,East of Kailash, New Delhi – 110065, India
URL: www.consumer-voice.org Page xxxiii
7. Usage of E- Governance and Impact of QoIS
Source: Question 36 and 37 of the Questionnaire
Aadhar, a mandatory e-governance services, was at the top (70%) used to be procured
online followed by railway booking (55%) and PAN Card (28%).
Other services such birth certificates, passport etc. though picking up, but still with
low usage.
Other e-governance services such as Pension card, e-BPL card, income certificates, and
property tax – though are on the scheme – yet to pick up as used by less than 10%.
Impact of quality of internet was considered to be high for all services as most of the
users face problem in filing and feeling online prescribed format – frequent disconnection,
losing of data, reliability and speed for uploading required document etc.
70.4%
54.8%
28.3%
14.4% 13.9%8.8% 7.1%
Aadhaar IRCTC PAN Birth and death
certificate registration
Passport Pensionincome, BPL certificates
4.20
4.35
4.11
4.194.16 4.14
4.34
The success of E-Governance service can only be ensured through reliable and high speed internet
connection.
E-34,East of Kailash, New Delhi – 110065, India
URL: www.consumer-voice.org Page xxxv
SECTION C
RECOMMENDATIONS
Assessment of Impact of Quality of Internet in India and its Impact on Users October 2017
E-34,East of Kailash, New Delhi – 110065, India
URL: www.consumer-voice.org Page xxxvi
Based on the findings of this report, VOICE has the following recommendations to the TRAI
and the government of India:
1. Resume Assessment of QoS through third party assessment-: The framework of Telecom Regulatory Authority of India (TRAI), established in 1997 is to “Lay down the standards of quality of service to be provided by the Operator and ensure the quality of service and conduct the periodical survey of such service provided by the Operator so as to protect interest of the customers of telecommunication service”. In this concern, TRAI initiated study to assess the quality of telecom services every year, by third party agencies, selected through tender notifications. The study, through Customer Satisfaction Survey and Audit of the operator’s operation, covered the whole India comprising four metros and three circles, initially for Basic wireline and Cellular services only, and later included the broadband service. The result of these annual studies used to be regularly published through press statements and also the full report used to be uploaded on the web site. This used to assure minimum level of customer satisfaction with quality of services provided by operators of these three services. However, in April 2015, after the inviting the tender from various agencies, the process of assessing customer perception on quality of service through customer satisfaction survey (CSS) was discontinued without providing any reason. Considering the fact that individual customers can not seek redressal from TRAI, CSS was a powerful tool for understanding the quality of operators’ services on different parameters. This provided an option for the telecom consumers to have right choice. Therefore VOICE, would recommend the TRAI to reconvene the practice of assessing quality of telecom service (QoTS) annual CSS.
2. Compensate for loss of Time and Money-: Since poor quality of Internet service causes loss of time and money to consumer, Telecos/ISPs should be made responsible for causing consumer detriment and provide monetary compensation for detriment caused to consumer. TRAI/GOI should create norms on the basis of which consumer should be compensated monetarily.
In case there are legal impediments the government must amend the relevant legislation to specifically empower TRAI to set up legally enforceable mechanism to ensure compensation of consumer.
3. Consumer Complaint system: A large number of consumers face problem with ISPs. However, all of them do not make complaints. Mainly because they either feel that there is no point in wasting time with complaints or it’s not easy to log complaints. Hence lodging of complaints must be made simple and easy. Most ISPs have launched their Apps which are being used to promote their sales and collection of payments from consumers. However, they do not contain a feature to log complaints. TRAI should mandate that each app must have a complaint feature with follow up of outcome of complaints. This feature should be integrated with ISPs mechanism of complaint handling. This feature should be included in each ISPs app, where the subscribers can easily lodge their complaints and send periodic reminders till the time resolution takes place.
Assessment of Impact of Quality of Internet in India and its Impact on Users October 2017
E-34,East of Kailash, New Delhi – 110065, India
URL: www.consumer-voice.org Page xxxvii
4. Promote Internet application among rural and lower income consumers: Internet appears to be a bridge to cross the urban-rural divide. However, this report finds those rural consumers are way behind their urban counterparts in appreciating the potential of internet to change their lives. Hence, government policy must ensure good quality for speed. Moreover, in rural areas digital user education programs tailored to enhance appreciation of internet tools for rural consumers need to be launched by appropriate institutions.
Similarly, the lower income users in urban areas are way behind affluent and middle class consumers. Similar, user digital education programs should be promoted for lower income citizens by appropriate institutions.
5. E-governance: This report has demonstrated evidence that poor quality internet service can disrupt delivery of E-governance program. There is need to ensure that reliable fast speed internet is necessary for citizens to benefit from E-governance services. Whenever, E-governance service requires filing of forms or detail of any sort, the software should include autosave features to save data while availing this service, to avoid loss of data due to reduced speed or disconnection.
6. Minimum download Speed : TRAI must mandate every Internet Service Provider (ISP) to disclose a minimum average download speed that must be provided at least 95% of the time. For this, the regulator should direct each service provider-
a) to include a speed measurement tool in their respective apps which should maintain a record of average speed during the day, week and month.
b) to disclose minimum and maximum speeds on daily, weekly, monthly and quarterly basis.
c) to compensate consumer for failing to adhere to average download speeds and down time.
d) The ISPs must be made to declare the minimum and average speed at the time of sale of their plan. It must become obligatory to declare their minimum speeds at the time of communicate of their plan to consumers.
7. TRAI MySpeed app, which was used for this study, should be made more robust and user-friendly. It should be able to provide speed comparisons for each Base Transceiver Station(BTS) or the location where the consumer is using the internet. The user should be able to get daily, weekly, monthly and quarterly comparisons of speed at specific BTS which can provide information on performance of each ISP at the same area/location.
8. TRAI should find a way so that consumer using internet can come to know the
reduction in speed or loss of signal at a particular point of time. At present the phones show E or 3G or 4G signal when there is in fact no signal. When signal is lost there should be a way to inform the consumer about loss of speed or signal by an adequate label mechanism.
E-34,East of Kailash, New Delhi – 110065, India
URL: www.consumer-voice.org Page 1
CHAPTER 1
INTRODUCTION – OBJECTIVES AND SCOPE OF THE STUDY
Assessment of Impact of Quality of Internet in India and its Impact on Users October 2017
E-34, East of Kailash, New Delhi – 110065, India
URL: www.consumer-voice.org Page 2
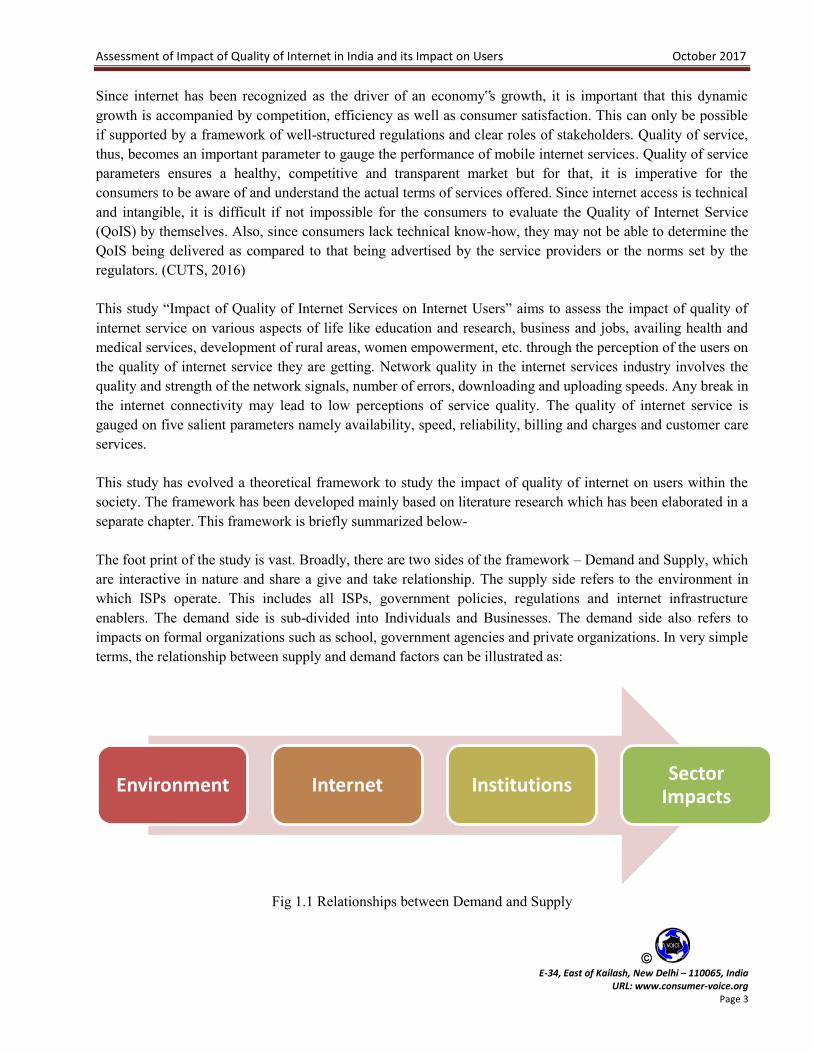
1.1 Introduction As one hears the phrase „industrial revolution‟, one can recollect the era in late 18th and 19th centuries, when rapid changes were taking place all over the world, led by England and America. Those were the changes which transformed the way manufacturing was done. This generation is witnessing another such evolution in the field of technology. The proliferation of internet is becoming a harbinger of new such type of industrial revolution inviting far reaching impact and changes in society which makes it imperative to assess the validity of this belief.
Today, internet has become the lifeline of modern day businesses and helps common people in accomplishing their day-to-day tasks. Economies have progressed the world over and internet has been a major driver of this progress. Humankind has begun to rely on it to fulfill its information and education needs, to say the least. Its depth and intensity to influence human life is way beyond what any of us could ever imagine. Today there are 7 billion people dwelling on this planet of ours. We live in a society where everyone wants to stay connected and have their needs fulfilled in the shortest possible time. Looking at some numbers to have a clear picture of how the internet has become the most important innovation of this century and how it is impacting our society, we find that there are 3.2 billion internet users in the world, 207 billion e-mails are sent everyday through internet, 8.8 billion YouTube videos are watched everyday, 803 million tweets are sent in a day and 36 million is the number of Amazon purchases made in a day (ICRIER, 2016). Furthermore, according to Hostingfacts.com, 2016 , there are 1.5 billion active Facebook users in the world, 2.9 billion Google searches are made every day, 2.7 million blog posts are published every day, 966 million is the number of websites in the world, with these figures growing exponentially.
The above facts provide evidence of majority of people‟s dependency on the internet in modern era. With time, this dependence is going to increase even more. About half of the world population is yet to be connected to the internet. The story is progressing almost on the same lines in India as well. According to a report by Statista, India is the second largest online market, with over 460 million internet users. However, it must be noted that only internet user figures give a partial picture as only 26 percent of the Indian population accessed the internet in 2015, despite the vast user base.
Quettera Software (Chafekar, 2015) analyzed thousands of users in India based on their usage data. It found that, daily usage of shopping apps is about 402 times higher than US data. At an app level basis, total time spent on WhatsApp dwarfs all other apps. An average Indian user spends 25% of his/her total mobile usage time on WhatsApp messenger. This number is 2.5 times higher than an average US user.
Not underestimating the need for getting connected, which is undoubtedly the essential first step, quality of services of internet has emerged as a critical variable. The significance of internet quality cannot be ignored. The way internet has transformed lives of the people and has made people its slaves; one cannot imagine life without internet. Regarded as a powerful general purpose technology, internet quality is as important as internet access, if not more, as internet usage is not limited to email and web browsing. With the interactive media-rich services and more user generated content being uploaded and shared, and with the availability of high quality videos, we need to go much beyond internet penetration.
Assessment of Impact of Quality of Internet in India and its Impact on Users October 2017
E-34, East of Kailash, New Delhi – 110065, India
URL: www.consumer-voice.org Page 3
Since internet has been recognized as the driver of an economy‟s growth, it is important that this dynamic growth is accompanied by competition, efficiency as well as consumer satisfaction. This can only be possible if supported by a framework of well-structured regulations and clear roles of stakeholders. Quality of service, thus, becomes an important parameter to gauge the performance of mobile internet services. Quality of service parameters ensures a healthy, competitive and transparent market but for that, it is imperative for the consumers to be aware of and understand the actual terms of services offered. Since internet access is technical and intangible, it is difficult if not impossible for the consumers to evaluate the Quality of Internet Service (QoIS) by themselves. Also, since consumers lack technical know-how, they may not be able to determine the QoIS being delivered as compared to that being advertised by the service providers or the norms set by the regulators. (CUTS, 2016)
This study “Impact of Quality of Internet Services on Internet Users” aims to assess the impact of quality of internet service on various aspects of life like education and research, business and jobs, availing health and medical services, development of rural areas, women empowerment, etc. through the perception of the users on the quality of internet service they are getting. Network quality in the internet services industry involves the quality and strength of the network signals, number of errors, downloading and uploading speeds. Any break in the internet connectivity may lead to low perceptions of service quality. The quality of internet service is gauged on five salient parameters namely availability, speed, reliability, billing and charges and customer care services.
This study has evolved a theoretical framework to study the impact of quality of internet on users within the society. The framework has been developed mainly based on literature research which has been elaborated in a separate chapter. This framework is briefly summarized below-
The foot print of the study is vast. Broadly, there are two sides of the framework – Demand and Supply, which are interactive in nature and share a give and take relationship. The supply side refers to the environment in which ISPs operate. This includes all ISPs, government policies, regulations and internet infrastructure enablers. The demand side is sub-divided into Individuals and Businesses. The demand side also refers to impacts on formal organizations such as school, government agencies and private organizations. In very simple terms, the relationship between supply and demand factors can be illustrated as:
Fig 1.1 Relationships between Demand and Supply
Environment Internet InstitutionsSector
Impacts
Assessment of Impact of Quality of Internet in India and its Impact on Users October 2017
E-34, East of Kailash, New Delhi – 110065, India
URL: www.consumer-voice.org Page 4
The framework thus, has seven dimensions. These dimensions of internet usage and its impact on human behavior are presented below-
Fig 1.2 Seven Dimensions of Internet Usage and its Impact on Human Behavior
Four major spheres of impact have been identified in the study, namely Human capital, Social capital, Financial needs, and Leisure. There are some issues which encompass all aspects which are referred to as umbrella issues and are pervasive in nature.
„General issues‟ cover some basic facts, statistics and opinions about the internet usage in India and the world. This includes issues like impact of internet on day-to-day lives of the internet users and on the economy. It also lists issues which promote adoption of internet services by consumers.
The category „Business and Supply‟ throws light on the role of regulatory bodies, internet service providers and internet infrastructure in creating and maintaining the supply of internet services for businesses and individuals. It also enlists issues which create hindrances in the way of providing uninterrupted quality internet service, the stance of government on taking necessary initiatives to fuel the internet growth and role of businesses in providing customer-centric services with the help of internet.
„Social capital‟ covers social utilities provided by internet such as communication, political participation and finding a partner. It also describes the online methods of socializing being adopted by teenagers and contribution of internet in helping‟ people with special needs‟, socialize by overcoming social prejudices.
„Human capital‟ deals with the impact of internet on issues that shape human lives and enhance the quality thereof, such as education and health. Internet also has a profound impact on the formation of habits.
„Finance and Economic Needs‟ covers the impact of internet on financial and economic needs of citizens. It also includes impact of internet in job search, labor market, productivity, earnings and standards of
Assessment of Impact of Quality of Internet in India and its Impact on Users October 2017
E-34, East of Kailash, New Delhi – 110065, India
URL: www.consumer-voice.org Page 5
professionalism, how internet has helped in digitization of various services and improved payment mechanisms, and how it has popularized online shopping in India.
„Leisure and recreation‟ focuses on the changes that internet has brought about in the leisure and recreational activities. It majorly covers the impact of internet on travel and tourism related behavior, online games and gambling, along with proliferation of pornography and impact thereof.
„Umbrella issues‟ as explained above, encompasses all the areas that have an impact on all aspects of behavior discussed here above. For instance, transportation has an impact on social capital, human capital, and economic needs as well. Similarly, gender inequality, privacy issues and laws pertaining to internet can be regarded as umbrella issues.
1.2 Objectives of the Study VOICE has been conducting assessment of quality of service studies since 2005. The first study to assess the quality of telecom service, which covered Mobile and Broadband, was conducted in the year 2006-07. Since then VOICE has been regularly assessing QoS for the Telecom Regulatory Authority of India (TRAI). These studies involved assessment of quality of landline, cellular and broadband.
The purpose of the current study is to assess the Impact of Quality of Internet Service on consumers in realizing their day to day tasks and needs/goals and aspirations in their lives. There are various services for the consumers which are delivered through internet and consumers are accessing/ using government and other services through internet. The study intends to assess the impact of quality of internet services delivered to its consumers and also list the shortcomings/impediments which require attention for further enhancing this quality.
Therefore, the broad objective of the current study can be enumerated as:
a. To understand and enumerate different modes of accessing the internet
b. To enumerate the profile of internet users w.r.t to their socio economic background in urban and rural areas across the country
c. To measure the perception of the customer about the quality of internet service from their service providers on access and use of internet through all modes.
d. To assess and enumerate the nature and consumer perception w.r.t. problems and grievance redressal mechanism in the usage of internet services
The study shall also assess its impact of internet and its quality of service on various aspects of life. Since the usage of any service is impacted by its role and purpose, the assessment of quality of internet will also require assessment of impact of internet and the quality thereof on various aspects of life.
Assessment of Impact of Quality of Internet in India and its Impact on Users October 2017
E-34, East of Kailash, New Delhi – 110065, India
URL: www.consumer-voice.org Page 6
1.3 Scope of the Study The scope of this study is to capture consumer perceptions through various dimensions of life which are impacted by quality of internet service. The strategy of this study is to cover around 50,000 internet users in 19 states of India spread in all the telecom circles. In each state, the sample is further divided in to rural as well as the urban parts to get a holistic picture of the subject in study. The „internet user‟, in context of this study is anyone who meets a minimum level of knowledge about the uses of internet. It is presumed that not every internet user has sufficient knowledge of the uses of internet or how internet impacts various aspects of life. So, for the purpose of this study, internet user (or respondent) must have attained a minimum educational qualification of SSC, to be able to understand the aspects under study and respond seriously. The respondents may be individuals or small businesses who have sufficient knowledge of their internet plans, and quality parameters like speed, reliability, billing and charges and help services.
The scope of the main study mainly subsumes three sub studies-
1. Perception on QoIS and its impact on users: Capturing consumer perceptions on various parameters of quality of internet service (QoIS) that they are using and impact of QoIS on various aspects of life, captured through interviews with the respondents (Face to face and CATI).
2. E-governance: Impact of quality of internet service on using E-governance services. Apart from capturing this aspect through main quantitative survey some qualitative interviews were conducted with the providers and beneficiaries of e-governance services. These interviews were videographed and a qualitative analysis was done thereon.
3. Audit of Speed Test: Internet speed is considered to be an important parameter of Quality of internet service. Therefore audit of wireless internet speed was also conducted in eight states in all the four telecom circles.
The entire study commenced in September 2016 and has involved the following activities:-
1. Literature review on internet, its impact on various dimensions and assessment as well as role of quality of internet service.
2. Methodology:
a. Situation Analysis through interaction with various stakeholders of telecom and internet service sector.
b. Questionnaire building process for capturing the response of consumers, E-Governance providers and beneficiaries and audit of internet speed testing.
c. Pre-pilot by research team and pilot test of questionnaires by field in eight states, analysis of data and changes in the questionnaire.
Assessment of Impact of Quality of Internet in India and its Impact on Users October 2017
E-34, East of Kailash, New Delhi – 110065, India
URL: www.consumer-voice.org Page 7
d. Main survey in all the 19 states.
3. Data Analysis and Report Writing
Final report is based on a sample of 52,000. The report is divided into three parts-
a. Introductory part – “CONCEPT, SCOPE and DIMENSIONS”, which includes Introduction- Objectives and scope of the study, discusses methodology, contains review of literature including parameters, dimensions and factors as well as the executive summary and highlights of the outcomes, executive tables and conclusion.
b. The second part “Assessment of Quality of Internet Service” presents results based on perceptions on quality of internet service in India and includes “Time and Money spent on Internet”; “Problems, Grievances and Redressal” and consumer detriment based on QoIS . Also, this part includes results of Internet Speed Audit conducted in eight states across the four telecom circles.
c. The third part “Impact of Quality of Internet Service on Various Aspects of Life” analyses the perceptions of the internet users on the degree of impact the quality of internet has on various dimensions like daily life, education and research, availing health and medical facilities, political and civic participation, travel and commuting, shopping etc.
The hypotheses adopted for the study and tested are presented below:
a. Overall Quality of Internet Service is impacted by various quality parameters. These are- i. Availability ii. Speed iii. Reliability iv. Billing and Charges v. Help/Customer Care Services
b. Internet speeds delivered by service providers at the point of use are equal to their claims/promises.
c. Quality of Internet Service impacts the user in various dimensions of use of internet service. These dimensions include-
i. Daily lives ii. Development of rural areas
iii. Education and Research iv. Health and Medical facilities v. Political and Civic participation
vi. Empowerment of people with special needs vii. Business and Jobs
viii. Shopping ix. Travel and Commuting x. E-governance
E-34, East of Kailash, New Delhi – 110065, India
URL: www.consumer-voice.org Page 9
CHAPTER 2
LITERATURE REVIEW
Assessment of Impact of Quality of Internet in India and its Impact on Users October 2017
E-34, East of Kailash, New Delhi – 110065, India
URL: www.consumer-voice.org Page 10
Internet is a revolutionary technology that has transformed the lives of people in an unimaginable way. This research study aims to measure current status of Quality of Internet Service in India and its impact on various aspects of life. Our strategy is to evaluate QoIS with reference to its current uses in different aspects of life and not in a vacuum. This report outlines the patterns of current usage of Internet in order to study the impact of Quality of Internet on Usage of Internet. For this purpose, a framework has been designed to represent the broad concept of quality of Internet and its impact on usage. This is done through seven dimensions, as discussed in the previous chapter (chapter 1). In this chapter, these seven dimensions have been elaborated with the help of published literature and their components have been explained in detail. These seven dimensions have been included in separate sections in the following pages. The sources that were used for developing this literature review have been duly listed in the bibliography section.
I. IMPACT OF INTERNET 1. GENERAL ISSUES A. Internet Growth: India And World
As one hears the phrase ‗industrial revolution‘, one can recollect the era in late 18th and 19th centuries, when rapid changes were taking place all over the world, led by England and America. Those were the changes which transformed the way manufacturing was done. This generation is witnessing another such evolution in the field of technology. Modernization has made machinery an indispensable part of human life, without which one cannot even think of travelling from one place to another. The proliferation of Internet is being seen as another such type of industrial revolution which makes it imperative to assess the validity of this belief.
Today, Internet has become the lifeline of modern day businesses and helps common people in accomplishing their day-to-day tasks. World economies have progressed in the field of security & surveillance and common people rely on it to meet their information and education needs. This is just the basic of Internet. Its depth and intensity to influence human life is way beyond what any of us could ever imagine. Today there are 7 billion people dwelling on this blue planet of ours. We live in a society where everyone wants to stay connected and have their needs fulfilled in the shortest possible time. Now, let‘s look at some numbers to have a clear picture of how the Internet has become the most important innovation of this century and how it is impacting our society. There are 3.2 billion Internet users in the world, 207 billion mails are sent everyday from Internet, 8.8 billion YouTube videos are watched everyday, 803 million tweets are sent in a day and 36 million is the number of Amazon purchases made in a day (ICRIER, 2016). And according to Hostingfacts.com, 2016, there are 1.5 billion active Facebook users in the world, 2.9 billion Google searches are made every day, 2.7 million blog posts are published every day, 966 million is the number of websites in the world. Another chilling fact is that only 44% of web traffic is from humans; a massive 56% of web traffic is from bots, impersonators, hacking tools, scrapers and spammers.
Assessment of Impact of Quality of Internet in India and its Impact on Users October 2017
E-34, East of Kailash, New Delhi – 110065, India
URL: www.consumer-voice.org Page 11
The above facts provide enough evidence of our dependency on the Internet in modern era. With time, this dependence is going to increase even more. About half of the world population is yet to be connected to the Internet. The story is progressing almost on the same lines in India as well. According to a report by Statista, India is the second largest online market, with over 460 million Internet users. However, it must be noted that only Internet user figures give a partial picture as only 26 percent of the Indian population accessed the Internet in 2015, despite the vast user base. The study also found out that men dominated Internet usage in India with the percentage of men and women Internet users being 71 and 29 percent respectively. There was another interesting finding that the majority of the population using Internet accessed it through their mobile handsets in 2016, the figure being 323 million users. The figure is expected to increase further in the years to come, the projections amounting to 524.5 million in 2021. As of 2016, the estimated Internet users in India stood at 262 million in urban communities and 109 million in rural areas. (Statista, 2016)
As per Internet live stats data (Internet live stats, 2016), the share of India‘s Internet users in the world digital population is 13.5 per cent, with the penetration rate in India being 34.8 per cent. The penetration of Internet in India is increasing. The percentage of population using Internet was only 27 percent in 2015 and 18 percent in 2014. Internet user base has increased by 30.5 percent in 2016.
Statscounter, an independent analytics company, found that Internet usage worldwide on mobile and tablet exceeded that on desktop for the first time in October, 2016. As measured by the company, mobile Internet usage was 51.3 percent while desktop Internet usage was 48.7 percent. The data was based on over 15 billion page views per month to over 2.5 million websites. According to the report, 75 percent of India‘s Internet usage occurred through mobile phones. It is interesting to note that while emerging markets have shown a growth in Internet usage on mobile and tablets, mature markets like UK and US, continue to have higher Internet usage on desktops. (StatCounter GlobalStats, 2016)
But this growth hasn‘t been inclusive so far. 850 million Indians still do not have an Internet connection. Everyday almost 70,000 people in India use Internet for the first time (India Telecom 2016- "Transforming India", 2016).
B. Motivation & Barriers To Internet Usage As per a World Bank report, a 10% increase in broadband Internet penetration increases the per capita Gross Domestic Product (GDP) by 1.38% in the developing countries (TRAI, Telecom consumer Protection (10th amendment) regulations, 2016, 2016). The rate of Internet adoption is increasing at a fast pace worldwide, but there are still millions left out. Governments have recognized its importance and therefore are making efforts to increase the level of Internet penetration in their respective countries. In India, about 34% of the population is using Internet, Internet penetration being 18% in rural India (Digital Rajasthan Conclave: Transforming lives through technology, 2016). As more and more people have started using Internet, there are many who are yet to see how their lives can be changed with Internet. Those who use Internet have some motivation to use it and those who don‘t are trying to break the barriers that restrict their Internet usage. According to TRAI, only 31.35 crore people out of a total wireless subscriber base of 103.37 crore, use Internet on their handsets. Also, the growth observed in wireless subscriber base which used Internet was a mere 16% in 2015-16 (TRAI, Telecom consumer Protection (10th amendment) regulations, 2016, 2016). The question that arises here is what are the
Assessment of Impact of Quality of Internet in India and its Impact on Users October 2017
E-34, East of Kailash, New Delhi – 110065, India
URL: www.consumer-voice.org Page 12
reasons behind such a meager growth for a country having world‘s second largest population? According to TRAI, following reasons seem to be plaguing the adoption of wireless Internet in the country-
a) Low levels of literacy and digital literacy b) Low perceived utility of the Internet c) Lack of adequate Internet coverage d) Non- affordability of data among poor customers
According to Katz & Aspden, 1997, the main motivation/reason for people to use Internet is to communicate with others and get information of general interest to keep up-to-date. Commercial reasons and contacting new people appeared to be the minor reasons for using the Internet. However, as this study was done in 1997, the dynamics ruling these motivations have changed pretty much. In 2016, major businesses have their presence online. Even brick-and-mortar businesses make use of Internet in conducting their day-to-day operations. Internet makes us meet new people more conveniently than ever. That is why we are witnessing a spurt in number of social media and dating sites. Another point made in the study by Katz & Aspden, 1997 is that ‗social-personal development‘ is the key driver of Internet usage among current and former users. Non-users emerged to be more strongly drawn to the Internet for business reasons and the opportunities for staying up-to-date. The study also found that long-time users were more likely to use online services as compared to recent users. It has also outlined some barriers to get started for the nonuser such as cost of Internet services, lack of comprehension, difficulty to access Internet, complexity and uncomfortable sitting in front of a computer.
C. General Impacts Of Internet On Day-To-Day Life Pulitzer award winning writer Thomas Friedman in his book ―The World is Flat‖ has described the flatteners that shaped the 21st century global economy. These flatteners, beginning with the fall of Berlin wall, allowed us to think of the world as a ―seamless whole‖, to see it as ―a single market, a single ecosystem and a single community.‖ Some of these flatteners have emerged as a result of Internet (Friedman, 2005). Internet has now started to have an impact on our daily lives. We resort to Internet for most of our needs, be it communication, education, travel or shopping. About 70-80% of the Internet users use social media. Technologies touching life-travel sites are the most used sites, even more than the shopping sites, followed by Banking (Digital Rajasthan Conclave: Transforming lives through technology, 2016).
Quettera Software (Chafekar, 2015) analyzed thousands of users in India based on their usage data. It found that, daily usage of shopping apps is about 402 times higher than US data. At an app level basis, total time spent on WhatsApp dwarfs all other apps. An average Indian user spends 25% of his/her total mobile usage time on WhatsApp messenger. This number is 2.5 times higher than an average US user. The usage of Candy Crush Saga, a game, is also significant. An average Indian user spends 17% of his/her total mobile usage time on this game which is 7.5 times higher than the average US user. A user in India spends an average of 3 hours on his/her mobile phone in one day, which is one hour less than the worldwide users and two hours less than the US users. Indian users spend most of their time in communication (48.3%).
An article in Economic Times (businessinsider.in, 2016), has highlighted the arenas where technology is going to make major shifts in the life of an average human being. The article explains the contents from
Assessment of Impact of Quality of Internet in India and its Impact on Users October 2017
E-34, East of Kailash, New Delhi – 110065, India
URL: www.consumer-voice.org Page 13
the World Economic Forum‘s report called Global Agenda Council on the Future of Software & Society. According to this report, 90% of the population will have unlimited and free data storage by 2018. One trillion sensors will be connected to Internet by 2022. 10% of the world‘s population will be wearing Internet connected clothes by 2022. Production of 3D-printed cars will start by 2022. Old ways of collecting census data by government will be replaced by big-data technologies by 2023. 80% of Earth‘s population will have a digital presence online by 2023.
All these dreams can come to reality in India only when good quality Internet is available at low costs.
D. Mobile Internet
Internet is undoubtedly one of the biggest inventions of this century. Another such invention which has actually helped in Internet proliferation and its best possible use is ‗mobile phone‘. Smart phones have made it possible to easily access Internet as and when required. India too has been reaping its enormous benefits. The number of mobile phones is greater than the number of toilets in our country (DIGITAL RAJASTHAN CONCLAVE, 2016). 80% of Internet usage in India is driven through mobile phones (Internet & Cities: How It is changing the Way We Live, 2016). India is the third largest smart phone market in the world. According to Mobile India in 2015: A year in review, 2016; reduced cost of service plans and availability of faster Wi-Fi has contributed to the rise of smart-phone adoption
As people have different patterns of consumptions, Internet usage across various regions also has a pattern. Mobile Internet usage pattern in India differs in urban and rural areas. Business Today, 2016 reports that urban users use Internet mostly for online communication (80%), social networking (74%) and entertainment (13%) purposes. Whereas, rural customers mostly use it for entertainment (52%), social network (39%) and communication (37%) purposes. Internet user base is increasing in India at a fast pace primarily due to increased rate of adoption in rural areas. The average growth rate for India has been 71% y-o-y. In December 2015, user base in rural India registered an astounding increase of 97%. Also by the year 2030, India is expected to have 702 million smart phone users (Digital Rajasthan Conclave, 2016).
These statistics show how India can serve as the largest potential growth market in the world. In India, overall app usage is on the rise due to significant growth in number of mobile users. India accounts for 9% of the world‘s app downloads. Out of these downloads shopping & entertainment constitutes about 25% and 16%, respectively. Travel apps have witnessed substantial growth in India in 2015 primarily because of competition between various cab services and increased popularity of travel booking apps (Mobile India in 2015: A year in review, 2016).
The average use of apps downloaded has increased about 102% since 2014 (Mobile India in 2015: A year in review, 2016). A survey done by Google, known as ―Mobile App Marketing Insights Asia Survey for 2016‖, has revealed that Indian Internet users are most likely in Asia to pay for digital goods and apps. It also showed that Indian users spent more time on web (62 mins) than on apps (44 mins). Indians have fewer apps installed than most other Asian nations, but Indian Internet users use 27% of their installed apps on daily basis. On an average, Indians use 9 apps per day (Gadgets 360, 2016). Even though, the concept of mobile app advertising is new in India, it leads the world in installs driven by ads. Nearly, 25% of all app installs in India are the result of paid advertising. This is the highest in the world. The US and UK have 17% of their installs driven by paid ads (Mobile India in 2015: A year in review, 2016).
Assessment of Impact of Quality of Internet in India and its Impact on Users October 2017
E-34, East of Kailash, New Delhi – 110065, India
URL: www.consumer-voice.org Page 14
E. Internet And Economy
DePrince Jr. & Ford, 1999, assessed the impact of Internet on the structure and growth potential of US economy. The Internet economy in the US had been growing at a three digit growth rate annually and contributes significant portion of country‘s GDP along with the employment of huge number of workers. Although the growth rate of the Internet economy will decelerate in coming years, its share in the economy‘s total output and employment will continue to increase rapidly. The Internet economy comprises of four sectors- hardware providers, software/application providers, intermediary/ market makers and companies engaged in e-commerce. The first two help in building and operating the required infrastructure. In the consumer sector, producers and distributors of high value-to-weight and high value-to-volume products like personal computers and peripheral equipment, computer software, books, video discs are already experiencing rapid growth of Internet driven sales. The transportation industry is also being heavily impacted by the migration toward E-commerce. As consumers are getting home deliveries for their online purchases, shipping companies are experiencing a surge in the volume of their transactions. Health related transactions that can be processed on the Internet include medical record keeping, health provider searches and appointments, health/medical information directories, insurance applications & payments and pharmaceutical orders & records, are resulting in major cost savings.
Consumers of products and services use the Internet to scan global markets on a real-time basis. The explosive growth in effective search engines has reduced costs of searching and making transactions over the Internet. Internet clearly intensifies the price-war and thereby reduces inflationary pressures engendered by segmented and disjointed markets.
Internet has had a profound impact on the services sector. In the airline industry, consumers have shifted from traditional modes of booking to website booking, where they get bonus miles, more discounts and special services. Financial services industry is also undergoing a transformation to use Internet as the main communication platform. Many large firms now offer online trading of stocks, bonds and other financial instruments, which bypass the human contact generally involved in such transactions. In addition to marketing services, Internet has also facilitated the introduction of a wider range of secondary markets for various real assets to solve their liquidity problems.
The authors also marked that there is a transition taking place in the distribution channels (Amazonic and/or Dellphic) which is set to reshape the micro-economic structure and operating characteristics of various industries. In Amazonic distribution, the end user orders products directly from a distributor that maintains a warehouse inventory of products. Those products are ordered and reordered from producers, in response to sales, usually via wholesale-level Internet or private intranet transactions. The end user gets the product directly from the distributor. This channel bypasses retailers and thereby undermines the retailers‘ business. Whereas, Dellphic distribution involves direct contact between end users and producers in which there is no inventory of finished products anywhere in the distribution channel. In this model, end users respond directly to producers‘ promotional efforts by ordering custom-made products telephonically or via the Web, which are then produced and shipped directly to the buyer. Products and services such as sale of personal computers and books stock trading, and travel services are already migrating very rapidly towards this transition.
Assessment of Impact of Quality of Internet in India and its Impact on Users October 2017
E-34, East of Kailash, New Delhi – 110065, India
URL: www.consumer-voice.org Page 15
2. BUSINESS & SUPPLY
A. ICT and Broadband and Role of Government Policy Information and Communication technology is widely acknowledged as instrumental to the growth and development of economies. A study points out that the gains from IT can be of two types-
i. Gains in efficiency, both static and dynamic. Static gains are onetime gains, allowing higher consumption in the present, while dynamic gains come from higher growth, potentially raising the entire stream of consumption for the population.
ii. The second type is the potential benefits due to reduction in economic inequality.
Developments accruing to IT may include improvements in the capabilities of the population which may have direct or indirect economic impact. The role of IT is not limited to economic benefits arising out of it. Non-economic dimensions must also be covered to understand fully, the role of IT. (Kaushik & Singh, 2004)
Closely related to ICT is broadband, a disruptive innovation which has transformed lives.
TRAI defines Broadband connection as ―A data connection using any technology that is able to support interactive services including Internet access and support a minimum download speed of 512 Kilo bits per second (Kbps)‖.
Broadband Internet service is regarded as a catalyst in the growth of an economy, infrastructure and Internet traffic of a country. Since the information system of a country is interconnected, the development and deployment of information and communication technology is crucial for expanding knowledge base and increasing productivity. Development of technologies and improvement in telecommunications infrastructure has enabled loosely bound business entities to collaborate and provide a number of services, thus, connecting more communities socially as well as technologically. (Tanguturi & Harmantzis, 2007)
A report by International Telecommunication Union (ITU) describes broadband as a facilitator of economic and social growth which empowers people, and creates an environment that nurtures the technological and service innovation, which indeed triggers positive change in business processes as well as in society as a whole.
In the initial stages, Internet was primarily accessed through dial-up means. Consumer and enterprise demand for high speed Internet prompted the development of technologies that facilitated access at higher speeds. In the mid 1990s, telecommunications and cable TV companies started offering services that significantly enhanced experience of Internet use. This led to increase in investment and adoption of Internet services.
With the huge investments being made in technology, policy makers and researchers began to analyze the economic and social impact of broadband. The first analyses of the impact of fixed telephone density on economic growth were done by World Bank researchers in the mid 1970s.
Assessment of Impact of Quality of Internet in India and its Impact on Users October 2017
E-34, East of Kailash, New Delhi – 110065, India
URL: www.consumer-voice.org Page 16
Broadband has posed some challenges for researchers which include the rate of adoption, lack of early stage statistics for comparison as only some countries had collected data in the early stages who recognized its economic potential and accessing its economic impact as it is used in combination with the adoption of information technology and the implementation of the organizational and process changes in enterprises. These challenges complicated the policy making process
Another problem is that of causality. It is difficult to say if broadband contributes to economic growth or it is a result of economic development. (Katz, 2012)
B. Situation of IT and Internet in India India‘s software industry has had a good contribution in the overall exports since 1990s and has thus helped immensely in the easing of b-o-p situation. The introduction of competition, removal of entry barriers, and increasing foreign direct investment led to unparalleled growth of the Indian telecommunications industry. (Kaushik & Singh, 2004)
In 1990s Department of Telecommunications (DoT) began investing in digital equipment. The government had realized that telecommunications services contribute to economic growth. The government then adopted ideas for reforms, with the objective of making India a hub of business opportunities. To achieve this objective, the government streamlined the foreign direct investment (FDI) process; worked to attract FDI in industries like telecommunications, software, and electronics; opened new investment avenues; created software technology parks; and identified new profitable sectors.
In India, leading ISPs like BSNL, Sify, Pronto Networks, and Dishnet Wireless have setup Wi-fi networks in airports, coffee shops, and other locations in metropolitan areas. For instance, WiFyNet has installed a city-wide network in Mysore, which is the largest Wi-Fi hotspot center in India, with a coverage of 130 km2. Intel and Pune municipality took an initiative to provide a city-wide Wi-fi network of 400 km2. (Tanguturi & Harmantzis, 2007)
a) Internet Revolution in India
We can view the growth of Internet in India during four phases alongside the development of State Telecom Policy. They are National Telecom Policy 1994, National Telecom Policy 1999, Broadband Policy 2004 and National Telecom Policy 2012
Telecom Policy 1994- At the onset of the first phase, the government took upon itself to improving India‘s infrastructure, competitiveness, exports and its attractiveness to foreign investors through growth in telecommunications. Centrally owned Videsh Sanchar Nigam Limited launched and operated Internet services in India in 1995. In 1998, the government gave licenses to private operators to offer Internet services in India. Failures and hindrances forced government to revisit its policy framework which led to the second phase. (Kaushik & Singh, 2004)
National Telecom Policy 1999- It was only in the second phase that the government recognized the relationship between telecommunications infrastructure development and social and economic growth of the country. When the intended results were not realized, government began to acknowledge the importance of telecom services. These were meant not only for the growth of the IT industry but for the development of the entire economy. For the first time in the history of Indian telecom, the government welcomed corporate involvement in providing paging services, cellular mobile telephone services
Assessment of Impact of Quality of Internet in India and its Impact on Users October 2017
E-34, East of Kailash, New Delhi – 110065, India
URL: www.consumer-voice.org Page 17
(CMTS), and later, fixed telephone services (FTS). In addition, 100% of FDI was allowed when providing Internet services. These policies infused competitiveness in the information highway market and increased penetration of telecom services. (Kaushik & Singh, 2004)
Broadband Policy 2004- The Broadband Policy was laid down by the government to realize the potential of broadband services. The policy was implemented with the objective of enhancing quality of life through high speed access to information, web-based communication and better avenues of entertainment by enabling e-education, e-medicine, e-governance, etc. The implementation of the policy was also expected to generate employment. Prior to Broadband Policy, broadband penetration in India was significantly low as compared to its other Asian counterparts. At the time of implementation of the policy, the penetration of broadband, Internet and personal computers stood at 0.02 per cent, 0.4 per cent and 8 per cent respectively. There was no uniform standard for broadband speed and connectivity. Internet access speed varied from 64 kbps to 128 kbps. Following targets were set under the policy-
Year ending Internet Subscribers Broadband Subscribers
2005 6 3
2007 18 9
2010 40 20
Source: cis-india.org (In millions)
The policy aimed at providing broadband (minimum speed of 256 kbps) to 20 million subscribers by 2010. However, there were only 13 million broadband subscribers as in May, 2012. This led to the fourth phase of growth of Internet. (The Centre for Internet & Society, 2004) National Telecom Policy 2012- National Telecom Policy 2012 envisioned ‗Broadband on Demand‘ and envisaged leveraging telecom infrastructure to enable all citizens and businesses, both in rural and urban areas, to participate in the Internet and web economy, thereby ensuring equitable and inclusive development across the nation. The policy envisaged support to platform neutral services in e-governance and m-governance in key social sectors such as health, education and agriculture that were present at that time limited to a few organizations in isolated pockets. This was expected to expand the footprint of these services and thus foster an atmosphere of participative democracy delivery model that was truly citizen-centric. Given the continued predominant role of wireless technologies in delivery of services in ICT sector, National Telecom Policy 2012 incorporated framework for increasing the availability of spectrum for telecom services including triple play services (voice, video and data) for which broadband was the key driver. This would be facilitated by deployment of services through appropriate instrumentalities, while safeguarding national interests. (DOT, 2012)
C. Internet Enablers and Service Providers: Impact of Internet Infrastructure on Digital India
Siriginidi Subba Rao defines Internet Service Providers (ISPs) as the companies that sell Internet services through various packages. Apart from connectivity, Internet service providers also provide value added services like web hosting, Net solutions, virtual private networks, email, voice over Internet etc. Owing to the increasing Internet users, amount of time spent on the Internet, access to superior content and number
Assessment of Impact of Quality of Internet in India and its Impact on Users October 2017
E-34, East of Kailash, New Delhi – 110065, India
URL: www.consumer-voice.org Page 18
of web sites, increasing importance as an advertising medium and platform for consumer services, there has been a phenomenal growth of Internet. (Rao, 2000)
ISP sector was opened to private operators in 1998 with a view to encouraging growth of Internet and increasing Internet penetration. The government‘s liberal ISP policy encouraged private players to enter the industry with minimum legal formalities. A supportive policy regime was adopted with no license fee, no entry fee, liberal roll out obligations, and no ceiling on the number of Internet service providers in a license area. This light regulatory approach was adopted to encourage private participation, bring in competition, and thus, fuel the growth of Internet. This resulted in the issuance of about 700 ISP licenses in the country within first three years of opening the sector to private participation. Earlier the monopolies did not have an incentive to improve quality of services. However, with the recent opening up of ISP sector, because of competition, bandwidth deployment began to increase. (Sridhar & Sridhar, 2006)
As per a news report by NDTV, The government had received over 70 applications (around 10 being pan India service) seeking permission to provide telecom services within four months of issuing guidelines related to virtual network operators (VNO). The VNO is an entity providing telecom services like mobile, landline, and Internet, but only as a retailer for full-fledged telecom operators like BSNL, MTNL, Airtel etc. This is likely to push down the cost of offering telecom services for the companies and even give them room to slash tariff. The processes were expected to enable and expedite bandwidth cost advantage to consumers. (Press Trust of India, 2016)
Another article published by BGR, cites that Google is making conscious efforts in India to connect the unconnected. To be a part of PM Narendra Modi‘s Digital India mission, Google has partnered with RailTel to offer free wi-fi at select railway stations across India. The company has announced ―Google for India‖ that includes Google station as well as India specific customization to its app that will enable Indian Internet users to use its services even on slow Internet speeds. Google is also in talks with the Indian government for UPI and Aadhaar programs. This would enable smartphone users to do more transactions in a secured manner. (Bendre, 2016) UPI and Aadhaar can, thus, be regarded as Internet enablers. Such enablers are expected to have notable impact on e-commerce and overall Internet usage.
In the India Telecom 2016, in a panel chaired by Mr. J.S. Deepak, Secretary, Department of Telecommunications, Ministry of Communications, Government of India, Dr. Anand Agarwal,CEO and Director, Sterlite Technologies Ltd emphasized the fact that data connectivity needs to meet some major challenges and emphasized on the need to have planned infrastructure and to bring in competition, affordability and scale. Shri RS Sharma, Chairman, TRAI explained that Digital India stands on three pillars- digital infrastructure, governance and services on demand, and digital empowerment. Digital infrastructure includes hard underlying networks and soft infrastructure or as it is also called Digital Identity Infrastructure.
D. Internet & Its Applications a) Consumer Centricity of Business Bhatt 2015, Firms of Endearment and customer centric companies, reviews the present scenario and firms‘ attitude towards the benefit of all the stakeholders, not just shareholders of the company. Stakeholder engagement has evolved with the changing role of corporations in the society. It has changed from being a reaction to customer problems to their greater participation in the value chain. The
Assessment of Impact of Quality of Internet in India and its Impact on Users October 2017
E-34, East of Kailash, New Delhi – 110065, India
URL: www.consumer-voice.org Page 19
stakeholder engagement has benefitted many companies through informed decision making by generating business intelligence. It also brings diverse perspectives together for creativity and innovation.
Earlier through traditional means of marketing, there used to be a monologue between customers and businesses and a wide range of advertisement was broadcasted. But the modern customer has very less time to watch all these ads and therefore chooses the message he/she wishes to see. As Internet facilitates interactions, customers want that companies should listen to them and respond. Technology is serving in a big way by helping companies get insights about their customers. Companies are offering customized products and services to their customers as they are no longer the passive players in the market. They already have a lot of information at their disposal. Therefore, being customer centric is the only way to survive in the modern day markets (Bhatt 2015, Customer Centricity).
Kanojia 2015, discusses the concept of ‗Digital Customer Engagement‘ which emphasizes on the dependence and reliability on customer generated content. Online modes of consumer engagement are gaining popularity as it involves Internet marketing, social media marketing, blogs, web portals, crowd sourcing, email campaigns etc and has wide number of applications in different sectors. Many private companies are now using social media platforms, mobile devices and other technologies to get closer to their customers because of its volume and speed to reach customers. Technology has also changed the way customers contact the companies. They seek automation, self-service and personalization. The technology also brings good prospects for the government and the jurisdiction of the country as it helps them to empower the citizens and gives them more access to the details through the use of location based services. It helps in achieving long-term operational efficiencies. In the education sector also, MOOCs (Massive Open Online Courses) have been successfully implemented by the top universities of the world because of the availability of Internet services.
As mobile phones (now mostly smart phones), have become an integral part of our day-to-day life, there is a need to change the way businesses reach and interact with its customers. Kanojia 2015, Customer Engagement by Corporates, asserts that smart-phones act as primary Internet devices and thus can be used for mass marketing to gain more participation. Kanojia 2015 is of the view that, to ensure deeper reach, the focus must be on developing customer-centric applications. There is a need to make these applications available in different languages to avoid the gap that may generate. Some touch –points that can be of core importance for the businesses to engage with customers through mobiles are product discovery platforms, search engines, customer care portals, consumer grievance forums and digital payment mechanisms.
The proliferation of social media and the video invasion are instrumental for building strong relationships with customers. Videos ensure attention for longer duration and provide opportunities for emotional congruence. Social media relationships build on videos and social interaction result in self-efficacy and positive word of mouth. Social interactions and shared experiences will increase their levels of commitment and engagement lasts longer when consumers feel emotionally charged and connected with the business. Increased interaction results in more satisfied customers and thereby positive actions. The paper concludes that to attain higher levels of consumer engagement, businesses must integrate the digital channels with traditional brick & mortar.
Finally, to be a customer centric company, a collective effort by the different departments of the organization is an imperative practice. It is unlike product centric approach where the functions are
Assessment of Impact of Quality of Internet in India and its Impact on Users October 2017
E-34, East of Kailash, New Delhi – 110065, India
URL: www.consumer-voice.org Page 20
compartmentalized. Linkages have to be developed across the organization and a better understanding of customer needs has to be developed at every level. These linkages are being made with the help of Internet technologies (Bhatt 2015, Firms of Endearment and customer centric companies). Kanojia 2015 argues that even customers should be treated as business partners and their feedback and suggestions should be taken into consideration. E-tailers must first ask consumers what they want to buy rather than trying to push what they want to sell.
Internet and Advertising Companies use various marketing tools to increase customer engagement and participation. McGaughey & Mason, 1998, examined the moderating impact of Internet on consumer behavior and role of Internet as a marketing tool. Internet has become much more user friendly with the passage of time. Online business activities are a rapidly growing phenomenon. Internet has proved to be a powerful medium for obtaining and distributing information to help marketers take product decisions and devise appropriate marketing plans.
As the popularity of Internet increased, popularity of sports has increased as well. Viewers are no more glued to their TV screens, wishing to watch only live shows. They want the convenience of watching their favorite matches whenever and wherever they want to. Digitization of media content, proliferation of IT enabled devices and easy availability of high speed broadband connections has given birth to the phenomenon called ‗media convergence‘ (as defined by Brittanica.com, it‘s a phenomenon involving the interconnection of information and communications technologies, computer networks, and media content). Various forms of media such as TV, social platforms and even Out of home Advertising (OOH), are being used by brands to bridge the gap between online and offline resources. It helps them efficiently identify their target group of sports fans. As per a research, sports fans are some of the most loyal customers because they are open to use the products of the brands, which are participating in their favorite games. Brands not only need to provide relevant content and enhanced experience to the sports fans, but also engage them sustainably with the brand. ‗Programmatic technology‘ is the need of the hour. Here, with the help of triggers, ads and content can be displayed to the viewers based on monitoring real time developments as the game progresses (Campaignasia.com, 2016).
Mediavataar.com, 2016, presents the opportunities and challenges of Out-Of-Home (OOH) advertising in the digital age. OOH advertising is an old form of advertising which was assumed to be restricted to hoardings and billboards on roadsides. They were more of a distraction rather than attention gainers. Now IT has shown the way to modernize the OOH advertising in the form of digitizes and interactive billboards. The authors of the article have supported the above statement with an example- ―the Ford Mustang digital hoarding at Delhi airport, which actually gives out the sound of the Mustang engine in order to grab the attention of passerby. The moment the digital screen is looked at, it blows out air, and the Mustang passes across the screen‖. OOH advertising has shown good results in the rural markets as well. In rural areas, people gather at public places such as bus tops or marketplaces, where many OOH exercises like permanent billboards are done. Even though the quality of those billboards is very basic, they have proven to be better communication tools than most others.
b) Impact on Businesses and Industry
Assessment of Impact of Quality of Internet in India and its Impact on Users October 2017
E-34, East of Kailash, New Delhi – 110065, India
URL: www.consumer-voice.org Page 21
A study by Grimes et al. (2012), suggests that productivity increases by 7-10 percent, when broadband connections are used. Another research study explored the impact of ICT on productivity of small firms. Broadband Internet connection is a powerful tool for SMEs as it provides connectivity to the global markets at a much lower cost than ever. It also acts as an enabling technology that allows them to adopt a number of valuable complimentary applications that may increase their efficiency. The use of ICT in service sector SMEs, enables them to reach distant employees and coordinate production activities more efficiently. SMEs in the manufacturing sector benefit from the supply chain and customer management applications, whereas advanced communications applications are more useful for service sector firms. Some other applications like human resource, administration applications and management systems applications, etc. are useful to most firms as these are not industry specific. (Massimo G. Colombo, 2013)
Gains from Broadband on businesses can be classified into direct and indirect. Direct gains are due to increased efficiency which results in increased productivity. On the other hand, indirect gains, result through positive externalities. Broadband has a positive impact on GDP growth and increased exports, which leads to increase in the intermediate demand and growth of support sector.
A study by ITU (Katz D. R., Impact of broadband on the economy, 2012) found that broadband technology improves productivity by facilitating the adoption of more efficient business processes. Also, extensive deployment of broadband accelerates innovation. Another way through which broadband brings in efficiency in the business is through a more efficient functional deployment of enterprises by maximizing their reach to labor pools, access to raw materials and consumers, streamlining of supply chains. In addition to the impact on productivity, broadband technology also impacts business expansion, product innovation, and new business creation. It was found that in the manufacturing sector, firms with Internet access enabled by broadband generate 6 percent more foreign sales than the rest, while in the service sector, the impact on exports was found to be between 7.5 percent and 10 percent. Besides increasing exports, it was also found that broadband has a positive impact on the development of new businesses. This results from the network effects of connectivity. When a large enough number of households are connected to broadband, the incentive to develop new businesses increases, especially around information search, advertising and e-commerce.
The impact of Internet is briefly discussed on some of the industries-
Power- According to a news report (Government Eyes Savings Of Rs 10,000 Crore A Year Via IT-Enabled Power Distribution, 2016), IT-enabled power distribution systems help distribution companies in reducing aggregate technical and commercial (AT&C) losses and in monitoring the feeders online. These systems benefit consumers as well. They can pay bills online, apply for new connection and know the status of power supply. The central government aims to save as much as Rs. 10,000 crores annually by using IT enabled technology in power distribution in urban towns by January 2019, under the Integrated power Development Scheme.
IoT- Internet of things (IoT) is one of the latest developments in the field of ICT. IoT basically means ―anything that can be connected to the Internet will connect to the Internet‖. (James, 2016). It‘s a concept of connecting all our personal digital devices through a single network. It‘s the future of technology and a step towards smart homes and offices.
Assessment of Impact of Quality of Internet in India and its Impact on Users October 2017
E-34, East of Kailash, New Delhi – 110065, India
URL: www.consumer-voice.org Page 22
Mr. Virat Bhatia, Chairman, FICCI addressed the audience in India Telecom 2016 and stated that ―IoT could connect each individual to about 3000 devices. It has the potential of changing almost everything altogether. The way businesses are done, the way things are done, and standards of efficiency and competence will all get radically changed with the development of new technology‖. In the same conference, Mr. D P De, Sr. DDG, Telecommunications Engineering Center, Government of India, expressed that there‘s huge hype about services that are likely to come with IoT. He stated that the journey of telecom has been very exciting. Internet also had started as a dialogue service. It only reached the masses at a later stage due to increased connectivity. Broadband was launched in India in 2005, 3G in 2011 and 4G in 2015. It cannot be denied that Internet has become the medium for the propagation of e-commerce. Earlier, there was a skeptical view that surrounded e-commerce as it was believed to be unsafe and insecure. Mr. Eric Loeb, Senior vice President, AT&T Services, expressed that IoT, in itself can address various issues and problems and thus, the cumulative impact is very significant. It can help in dealing with society and government challenges of Traffic, Aviation, Energy, Agriculture, etc. IoT will enable better decision making, leading to more consumer benefits and remarkable opportunities.
Insurance- An article by McKinsey and Company (Catlin, Khanna, Lorenz, & Sultan, 2016) talks about the changing phase of the insurance sector. It explains why digital transformation must be undertaken. The nature of competition in the sector has been evolving everyday because of changing behaviors and technological innovations. Digitalization has the power to reshape the industry and disrupt established value chains and business models. The disruptions caused by innovation of digital technology would affect the insurance sector tremendously. Driverless vehicles would alter the need of auto insurance. Connected homes would transform house insurance, cyber security and drones would create demand for new forms of coverage, and shared businesses would change the underlying need for insurance. Claim processes are getting transformed because of automation, analytics and consumer preferences. Connected technologies allow for self-diagnose and auto- reporting of incidents/problems by insured devices. Self-service claims reporting technologies can create fast, seamless customer experiences. This has also made damage assessment quick, safe and cheap. Digitalization of insurance sector would substantially reduce human service costs, enhance customer experience and increase profitability and growth rate.
E. Internet Issues: Challenges and Risks Internet poses some challenges and risks to the various stakeholders.
a) Challenges Telecommunication Companies encounter the challenge of increasing user base in a particular area with the limited bandwidth which leads to lower speed resulting in shrunken user base as the telecommunication companies find it difficult to maintain Internet quality as the user base expands. This is one of the reasons why average Internet speed in India is lower than all other BRICS economies and lower than most other emerging economies. On the occasion of World wi-fi day (June 20, 2016), an article was published in Economic Times, which discussed the plight of Internet users in India. Wired broadband speeds available to customers in India is way lower than what is promised by the service providers. A data service pack that warrantees a speed of 8 mbps typically provides 5 mbps at max. Wireless connections are much worse. TRAI has a conservative definition of broadband that download
Assessment of Impact of Quality of Internet in India and its Impact on Users October 2017
E-34, East of Kailash, New Delhi – 110065, India
URL: www.consumer-voice.org Page 23
speed should not fall below 512 kbps. That gives customers quite a narrow window to complain. (Parbat, 2016)
Elucidating on the TRAI‘s mandate, an article titled ―TRAI‘s meager 512 kbps broadband mandate will push India into a technological slump‖ was published by the Huffington Post (Mehta, TRAI's meagre 512 Kbps Broadband Mandate Will Push India Into A Technological Slump, 2016). TRAI issued a mandate stating that all fixed line Internet service providers will provide a minimum speed of 512 kbps to their users in order to be classified as a broadband service provider. The mandate specifies that instead of the earlier 64 kbps download speed, users will now get a minimum download speed of 512 kbps after they have used up their data at higher speeds. The speed of 512 kbps for a broadband connection however, is disappointing, especially when the government is trying to boost its startup ecosystem and taking initiatives such as ―Digital India‖.
Another challenge encountered by the regulatory TRAI is with regard to VoIP. VoIP enables customers to make calls to any phone number in the country, be it a landline or mobile number, the party being called need not even have any app, or even Internet connection for that matter. This would enable customers to make calls over the Internet at one third the current calling rates and has numerous advantages such as the ability to make calls over WiFi in bad signal areas, 90% cheaper international calling, HD Voice, and innovations like simultaneous data transmission, video calls etc. In Telecom license, the Government of India, in 2008, had made provisions permitting unrestricted Internet Telephony which enables any telecom carrier in the country to provide lower cost calls through Internet to any mobile or landline number in the country. The incumbent players, in response to TRAI‘s consultation paper on VoIP countered the ―Free Your Voice‖ campaign, a national campaign launched by entrepreneur Bhavin Turakhia, aimed at freeing the voice of the people of India. The incumbent Telecommunication companies claimed that only the Telecom carrier that provides a data connection to a subscriber should be allowed to offer Internet Telephony to that subscriber over their Internet connection. (DQINDIA ONLINE, 2016)
Bringing in net neutrality is another such critical issue. From the consumer perspective, net neutrality can be defined as the principle that all electronic communication passing through a network is treated equally, independent of content, application, service, device, source or target. Consumers expect the ISPs to provide them access to the pool of resources and applications. They also expect them to comply with the fundamental principles of openness, inter-operability and neutrality. However, some operators providing end-user connections undermine users‘ rights when they undertake certain discriminatory activities, thereby challenging the neutral architecture of the Internet. A solution suggested by some to this problem is switching to some other ISP. However, it is not a viable solution always. Switching to a better service provider often comes at a cost. Switching costs include contract cancellation fees, costs related to setting up the new network and installation costs, as well as those related to informing third parties of the new contract information. Moreover, switching may not be possible for customers who are confronted with a limited choice of operators available in a specific geographic area. (BEUC, 2012)
b) Risks Cyber security is a matter of great concern. Albeit the government and regulatory keep coming up with ways to combat cyber crimes, the number of cyber crimes is growing. The Indian Government is reinforcing systems and establishing a centre for cyber security.
Assessment of Impact of Quality of Internet in India and its Impact on Users October 2017
E-34, East of Kailash, New Delhi – 110065, India
URL: www.consumer-voice.org Page 24
Ravi Shankar Prasad, in an interview, stated that India has about 440 crore Internet users. Out of them, every 1 in 2 connections is mobile based. The number of mobile phones added in India in the past two years, is equal to the combined population of France and Italy. Government has launched schemes such as e-health, e-scholarship for students, e-mandi for farmers, digital lockers, Jeevan Pramaan for pensions, MyGov for citizen engagement, etc. Government has taken various steps to minimize cyber-security threats in India including training police personnel, judges, and appointing security auditors. Also, the government has urged big companies such as Facebook, Microsoft, and Google to set up their data centers in India. (Prasad, 2016)
Cyber terrorism is yet another threat that is severely affecting the quality of Internet services. According to a news report (Press Trust of India, 2016), ISPs in Maharashtra claimed to have suffered DDoS (Distributed Denial of Service) attacks. A denial of service attack typically bombards websites with requests, overloading the portal until its server crashes, thus denying access of the website to legitimate users. Such attacks reduce Internet speed to almost zero.
F. Barriers to Internet Supply- Importance of Uninterrupted Internet Access Internet quality parameters, as identified by various studies, can be gauged only after a threshold of uninterrupted Internet access is ensured. In other words, Internet access is a prerequisite to quality Internet services. However, it must be noted that Internet access is not something only Internet service providers can be held responsible for. The ISPs cannot alone ensure uninterrupted Internet supply when the government(s) acts otherwise.
Around the world, digital technology is seen instrumental in economic development. According to a 2012 World Bank report, ―a ten percentage point increase in fixed broadband generates a 1.35% increase in per capita GDP for developing countries and a 1.19% increase for developed countries.‖ (Minges, 2016). This points toward the fact that broadband is much more significant for economic growth in developing countries as compared to developed countries.
The United Nations enacted a resolution which supports the ―promotion, protection and enjoyment of human rights on the Internet‖. The resolution specifically ―condemns unequivocally measures to intentionally prevent or disrupt access to or dissemination of information online in violation of international human rights law and calls on all States to refrain from and cease such measures.‖
According to a report by Centre for Communication Governance at National Law University, Delhi, ―Internet shutdown issues relate to access to the Internet and Internet services at all times. The Indian government has routinely cut access to the Internet during times of public strife; the rationale being that Internet services (like texting apps, social media) are used to coordinate and spread violence‘. (Centre for Communication Governance, 2016)
There have been many instances of shut-downs in a number of countries across the world wherein countries block particular applications, turn off mobile telecommunications services, shut down specific services like instant messaging, and voice over Internet protocol (VoIP) calling, or disrupt the entire Internet. These actions separate people from their friends and family, affect their livelihoods, undermine economic growth, interfere with the startup ecosystem, and threaten social stability by interrupting economic activity. Internet shutdown is a critical issue which calls for immediate resolution as it adversely affects the economy.
Assessment of Impact of Quality of Internet in India and its Impact on Users October 2017
E-34, East of Kailash, New Delhi – 110065, India
URL: www.consumer-voice.org Page 25
Centre for Technology Innovation at Brookings reported that there were about 81 short-term shut downs in 19 countries in 2015. The study estimated that between July 1, 2015 and June 30, 2016, these shutdowns cost at least US$ 2.4 billion in GDP globally. India tops the list of countries with the highest shutdown cost and incidence, being $968 million and 22 respectively. The shutdown cost stated herein is only a conservative estimate that takes into account only reductions in economic activity and does not account for tax losses or drops in investor business, and consumer confidence. (West, 2016)
The reasons for ordering these disruptions may be safeguarding government authority, fighting terrorism, reducing public dissidence, maintaining national security, or protecting local businesses, etc.
A study by University of Washington researchers identified 606 occasions between 1995 and the first part of 2011, where 99 different governments deliberately ―interfered‖ with the normal operations of the Internet. Whereas there was only one such incident in 1995 and 4 in 1996, the number was 107 in 2008 and 111 in 2010. (Howard, Agarwal, & Hussain, 2011)
CCG, NLU reported that, since 2012, India has witnessed at least 37 such shutdowns. Maximum incidents of shutdown were observed in Jammu and Kashmir, followed by Gujarat and Rajasthan. These shutdowns were imposed by the respective state governments to prevent people from protesting, in response to some or the other threat from communities, or to prevent cheating during examinations. Suspension of Internet services has been viewed as a handy weapon by the state governments to prevent communal clashes, and anticipated protests and/ or violence. (Centre for Communication Governance, 2016)
India is in the transitional phase of becoming a digital economy. The government encourages and supports this transition. Despite this widely acknowledged fact, social and/or political turmoil have led to governments repeatedly shutting down mobile Internet in order to deal with the problem prevailing in the society.
The growing scope of Internet shutdowns is creating significant detrimental impacts on economic activity globally. With the expansion of digital economy, it is going to become even more expensive for economies to shutdown Internet.
Internet access includes three aspects. One, its price which should be reasonable enough to enable people from all income groups to access Internet services. Two, uninterrupted services: an issue, which ISPs and government(s) need to resolve together. Three, open Internet, i.e., access to information on the web. First two have been discussed above. The third one, along with digital literacy would bring about metamorphosis in education and would thereby foster development.
United Nations General Assembly, in its resolution A/HRC/32/L.20, acknowledged that the spread of ICT and global interconnectedness has great potential to accelerate human progress, to bridge the digital divide and to develop knowledge societies. The resolution emphasizes that ―access to information on the Internet facilitates vast opportunities for affordable and inclusive education globally, thereby being an important tool to facilitate the promotion of the right to education, while underlining the need to address digital literacy and the digital divide, as it affects the enjoyment of the right to education‖. It also stressed upon the importance of applying a comprehensive and integrated approach in providing and expanding access to the Internet and for the Internet to be open, accessible and nurtured by multi-stakeholder participation. (United Nations Human Rights Council Resolution, 2016)
Assessment of Impact of Quality of Internet in India and its Impact on Users October 2017
E-34, East of Kailash, New Delhi – 110065, India
URL: www.consumer-voice.org Page 26
3. SOCIAL CAPITAL A. Social Interactions
Inevitable medium of communication: Alrayyes, 2012 recognizes the scarcity of time in present and future lifestyles that have made Internet being accepted as an inevitable medium that connects people to each other, to make lives more easy and productive. Lee, Leung, Lo, Xiong, & Wu, 2011 apprises that Internet acts as a mediator in broadening people‘s social experiences and involvement with family, friends & peers by providing communication solutions, helps in bridging the physical distance among people and brings them closer emotionally as well as culturally. It continues to add that ease of connecting with people through Internet has transformed it into a ‗hospitable‘ place and many people use it along with traditional ways of communication. It aptly describes that ‗Internet has not displaced people‘s involvement in communicating with each other, but it has very much displaced the way it used to be done.‘ Brignal III & Valey, 2005 notifies that individuals online are more likely to respond in a quick and spontaneous manner, as there is no shared physical space to disrupt, no implicit social contact, and few social interaction rituals to prevent individuals from being rude when delivering their responses. Relation between virtual and physical spaces: Alrayyes, 2012 implies that virtual and physical spaces co-exist due to their strong interconnection and people like to experiment with what they do in virtual spaces in reality. The authors support this argument with following three examples. First, Companies advertise and engage their target customers through virtual spaces and drive them towards their physical stores like what has been done by Angry Birds. Second, in Music Industry, virtual spaces have allowed the conversion of physical products into softcopies and resulted in market expansion, sales growth & reduced production cost, but, undoubtedly, physical spaces are used as venues for music concerts that are marketed virtually as virtual spaces are used to spread the word, expand audience internationally and increase popularity. Third, the development of social networks reflects demands of social democracy as they‘ve become the spaces where people gather in to discuss their demands & organize protests like the use of Twitter during Egyptian revolution, when it was used to connect people, share latest updates & venue for next gathering and acted like a walkie-talkie to share information of what the government was doing to stop protests.
Changing structure of social gatherings: Alrayyes, 2012 conveys that virtual spaces help people to share their interests and social needs and thus lead to creation of online communities that allow public to join activities virtually and really. It adds that the change in culture of recording music affects city and physical settings as in restaurants, pubs, and cafeterias, the physical seating arrangements are decided on how people listen to music – either they share or they may listen to it in isolation through their personal headphones/earplugs. Brignal III & Valey, 2005 reinforces by adding that online social support offers benefits that face- to-face social networks cannot: anonymity, constant access to better quality expertise, and enhanced modes of expression, with less chance of embarrassment and without incurring an obligation to the support provider.
Displacement of social ties: According to Lee, Leung, Lo, Xiong, & Wu, 2011, Internet has led to ‗Time Displacement‘ – using the Internet has displaced time spent earlier on engaging in social & outdoor activities and acknowledges that interpersonal communication through Internet helps in forming core & significant ties that help in networking. It adds, that Internet has enabled people to displace poor
Assessment of Impact of Quality of Internet in India and its Impact on Users October 2017
E-34, East of Kailash, New Delhi – 110065, India
URL: www.consumer-voice.org Page 27
relationships with better ones through increased social involvement and well being; results in increased strength in relationships with family and friends due to increased events of working at home.
Level of Social Connectedness: Taube, 2004 is based on the premise that the dispersal of new information and communication technologies will affect social life strongly and the amount of actual social relations a person has will diminish with increasing use of such technologies. The study identified that Internet causes increasing disconnectedness of society as time that was previously spent in social interactions has been reallocated towards Internet use. It further added that Internet has also led to decrease in social contacts, as it can be the ultimate isolating technology that reduces an individual‘s contribution towards the society. Bannon, McGlynn, McKenzie, & Quayle, 2015 propose following four hypotheses to explain the impact of Internet on level of social connectedness. First, Displacement hypothesis - It suggests that the Internet will have a negative impact on social interaction and connectedness due to time online replacing time spent in face-to-face interactions and relationships. Second, Increase hypothesis - It suggests that Internet use can increase social interaction and the development and maintenance of social connectedness by maintaining existing relationships and providing opportunities to develop new ones. Third, Rich-get-richer hypothesis – It claims that Internet use can provide positive social and psychological outcomes for individuals considered to already have good social skills and networks offline. Fourth, Social Compensation Hypothesis – It considers that the Internet may be particularly beneficial for socially anxious and isolated individuals, allowing them to develop online connections to compensate for their lack of offline network.
Impact of e-WOM: Cheung, Lee, & Rabjohn, 2008 explains that electronic word-of-mouth allows consumers to obtain information related to goods and services from a vast, geographically dispersed group of people who‘ve had experience with relevant products or services. The authors imply that information transfer through e-WOM may vary from person to person and same content can incite very different responses in different recipients. The study concluded that relevance and comprehensiveness of online opinions are key elements in decision-making process and have significant impact on information adoption & usefulness.
Difference between face-to-face interactions & Internet communication and the resulting impact on quality of life: Brignal III & Valey, 2005 informs that individuals in face-to-face interactions give out more subtle cues such as posture, hand gestures, tone of voice, movement in a conversation, eye contact, and levels of social formality that are generally absent in online interactions and argues that limited capacity to detect such cues inherent in computer-mediated communications has negative consequences as it gets impossible for people to change the course of their conversation to relieve stress or reduce emotional discomfort. Furthermore, it could undermine the perception of leadership, status, and power, and leads to reduced impact of social norms and therefore to deregulated, anti-normative behavior. Lee, Leung, Lo, Xiong, & Wu, 2011 showed that Interpersonal communication via Internet has negative impact on people‘s quality of life and cannot replace face-to-face conversations in improving relationships and suggests that people who have offline social support tend to enjoy face-to-face communications more than online interactions. Whereas, socially isolated people, due to absence of non-verbal and emotional information that impairs their communicating ability, are less likely to indulge in Internet communications.
Assessment of Impact of Quality of Internet in India and its Impact on Users October 2017
E-34, East of Kailash, New Delhi – 110065, India
URL: www.consumer-voice.org Page 28
Impact on Growth & Development of Young generation: Brignal III & Valey, 2005 notifies the point that the heaviest users of Internet i.e. the cyber-kids who spend most of their time on computers & Internet for various activities and spend less time having face-to-face interactions with peers may have significant consequences for their development of social skills and presentation of self due to absence of visual and auditory cues that are present during personal forms of interaction. The authors highlight that social freedom leads to emergence of a ‗cyber-self‘, wherein teens manipulate their online identities, pretend to be different people, give out false information to people when they communicate online and this helps little in the practice of maintaining stable relationships. They added that Children and teenagers who are heavily involved in communicating through Internet could be improving their imagination and cognitive abilities but are also evading reality by avoiding necessary practice of social interaction rituals. Instead of learning the interaction skills, they are learning how to deceive individuals and they may not be able to trust accurately without visual verification through personal modes of interaction. They warn that if children develop interaction skills based on online communications and without enough experience of personal interactions, the likelihood of friction increases. It can be argued that new cultural and social phenomena have typically produced tensions between the generations as Internet environments are training students to work as individuals rather than as members of any social group, where people can choose with who they wish to interact and how they want to manage it.
Negative aspects: Brignal III & Valey, 2005 interestingly noted that online behavior is different than that of offline behavior, as people are willing to misrepresent themselves by feigning a different gender, skin color, sexual orientation, physical condition, or age; open display of group norm violations such as aggressive behavior, racism, sexism, homophobia, personal attacks, harassment; and a tendency for individuals to quickly abandon groups and conversations, refusing to deal with issues they find difficult to immediately resolve. It adds that impersonal interactions through Internet environments have made people employ multiple roles in their interactions with others, which are chosen for employment on basis of audience segregation. It concluded on the note that no matter how large, Internet technologies and their potential may grow; it will always cast a doubt on the reality and continuity of it, as the opportunities to learn will be overshadowed by concepts of self-interests and the possibility of people isolating themselves from the world tends to get higher with the growth of Internet.
Better or worse: Brignal III & Valey, 2005 presents that Internet will revolutionize social interactions, politics, communities, or society because it allows ideas to circulate to a wide audience and thus helps entrepreneurs with good ideas find capital and bring expertise to bear on marketable products and services, help flatten hierarchies, dilute power and reduce monopolization of information, permit new and interesting forms of community, make citizen activism easier and encourage a self-reflective society. Furthermore, Alrayyes, 2012 suggested that because virtual spaces have decentralization of source of content, they have made spreading information between people easier and allow people having common interests to create a social group.
B. Teenagers
Adoption of Internet: Teenagers have taken to Internet like fish to water. Like water is lifeline of a fish similarly Internet has become no less than a lifeline for modern day teenagers. Gencer & Koc, 2012 has recognized that the adoption of digital technologies is higher in young adolescents than adults. It adds that, new products, communications and advertisements are designed in a way to appeal to the youth
Assessment of Impact of Quality of Internet in India and its Impact on Users October 2017
E-34, East of Kailash, New Delhi – 110065, India
URL: www.consumer-voice.org Page 29
culture, as they are the center of lucrative digital marketing enterprise. As per Choi & Ross, 2006, due to the availability of high-speed broadband, young people have been the main beneficiaries of easy and fast access to Internet and spend hours being online each day.
Create Own World: According to Choi & Ross, 2006, Internet has granted the power to create ‗own world‘ to the youth, where they are allowed to talk freely. It evidences that they use Internet in a variety of ways that spans from educational purposes to entertainment. Gencer & Koc, 2012 supports this argument by mentioning that the increasing scope of uses of Internet interacts with people‘s needs and motivation and leads to multiplication of inevitable and well-evidenced advantages of Internet. Choi & Ross, 2006 also acknowledge the fact that Websites are becoming online communities; making it possible for young people to do everything at one place and in order to keep customers glued to them, they lure them into upgrades and make them continue to pay for virtual goodies through real money that is funded by parent accounts. Lee, 2008 noted that digital expertise among young people has revealed in a way that it has led to application of new technologies, with many having their own online content in the form of blogs and personal sites.
Safety Valve: Internet acts as a safety valve for youngsters from the demands of their parents and pressures of succeeding academically, where their unconventional skills and abilities were recognized and appreciated, as described by Choi & Ross, 2006. It further elaborates that, Internet has made way for them to gain popularity and hold dominant status amongst a group of friends and satisfy the gratification that they could not be able to do in their academic endeavors. The authors have noted that Online gaming, information and data sharing could allow them to escape from reality and be a part of the competition. Winners and leaders were blessed with influential and commanding powers, whereas people who lacked these skills found themselves isolated and victimized. It emphasizes that the fear of being on the losing side makes youngsters invest more time to maintain the status of their character.
Erosion of Parental Control: Choi & Ross, 2006 narrates that the use of Internet by children was originally initiated by parents as they believed that it will ensure better academic performance, but they failed to realize when Internet was being used in different ways for many other purposes like access to pornographic sites and the promotion of violent behavior. The paper highlights that the lack of knowledge about Internet and its full potential among parents made it possible for youngsters to conceal the extent and type of their Internet activities and such disobedience has led to violation of parental authority.
Negative Aspects: Choi & Ross, 2006 also stresses that this disturbed and increased use of Internet has highlighted concerns in terms of anxiety about health, interpersonal problems, declining academic performances and dilution of traditional family values. Gencer & Koc, 2012 supports this view by adding that, Internet as a strong source of need satisfaction can even defy the intimate connectedness of collectivist cultures and break-through to generate isolation in strong family ties. It further explains that excessive use, intolerance, preoccupation with the Internet and use of Internet to escape negativity are some of the symptoms of serious disturbances in user‘s social capitals & the potential for Internet abuse will increase upon transition to college life and flexible hours, where it gets easier to access high-speed Internet. It closes with alarming implications for parents as they need to control and monitor Internet usage of their children. Lee, 2008 apprises that Internet access from home allows youngsters to use more Internet and access a broader range of content, which cannot be done in schools due to restrictions that govern the use of Internet. However, the paper concluded that the impact of Internet is transitory and
Assessment of Impact of Quality of Internet in India and its Impact on Users October 2017
E-34, East of Kailash, New Delhi – 110065, India
URL: www.consumer-voice.org Page 30
restricted and is incapable to deal with the wider range of disadvantages suffered by young people from poorer backgrounds.
C. Search for Partner
Efficient Search Tool: Rosenfeld & Thomas, 2012 advises that Internet search is important in finding potential partners for individuals. Bellou, 2014 briefs that searching for a suitable partner in an offline and decentralized environment can be a lengthy process, while an online centralized market could resolve a number of issues as it allows for targeted search with certain desirable characteristics with users holding some degree of secrecy. It proposed that Internet could be professed as a way of declining search frictions by reducing the cost of search and increasing the offer arrival rate.
Meeting Point: Bellou, 2014 apprises that nowadays, more people access Internet than before and can use online resources as a fast and possibly more proficient way of meeting others via instant messaging, email, online dating and chat rooms. Rosenfeld & Thomas, 2012 also implies that Internet is one social arena that is unambiguously gaining importance over time as a place where heterosexual couples meet.
Social Intermediary: Rosenfeld & Thomas, 2012 advises that Internet plays the role of a social intermediary as it fosters new social relationships between two strangers. It adds that Internet compresses social world and allows people to find each other and meet without any other intervention. Bellou, 2014 further adds that Internet plays an important role in family formation as it is being used by people as an intermediary for partner search.
Negative Aspects: Bellou, 2014 highlights that unnoticed heterogeneity that arises in Internet search for partner makes decision-making difficult for females.
D. Political Participation
Abundant Information at Low Costs: Providing Information has costs implications, which have limited political participation, but as per Ikeda, Richey, & Teresi, 2013, Internet has the potential to reduce these costs that will lead to increased participation and thus help people in becoming better citizens. It elaborates by adding that the Internet‘s ability to easily multiply and amplify an individual‘s information gathering abilities coupled with its interactive nature makes it a promising tool for overcoming time-costs associated with political participation.
Impact of Social Media: Fu & Chou, 2016 indicates social media can bring the dropping performance of long-ruling political party into limelight, lowering public support for them, which allows adherents to play more active role and change the issues under discussion in an election as it breaks traditional media‘s mode of unidirectional broadcasting of information. It adds that social media has also made it possible for the Internet to become a new medium for political campaign and fundraising. Websites and blogs allow people to express opinions, diversify their political views, discuss and interact with politicians directly. Ikeda, Richey, & Teresi, 2013 apprises that Internet allows users to target their exposure to preferable information and like-minded individuals, promoting network building and knowledge homogeneity enabling such groups to stand for what they believe in and enter into a conversation/dialogue with those having a counter view.
Assessment of Impact of Quality of Internet in India and its Impact on Users October 2017
E-34, East of Kailash, New Delhi – 110065, India
URL: www.consumer-voice.org Page 31
Increased Real Participation: Ikeda, Richey, & Teresi, 2013 introduces the opinion that Internet may be keeping people at home by giving them tools for virtual communication which may reduce highly valued voluntary experiences. Jennings & Zeitner, 2003 supports this view and adds growing and widespread use of Internet is alleged to threaten face-to-face communication that characterizes volunteering. However, it also affirms that Internet leads to replacement of spectator activities with more active forms of behavior.
Impact on other media: Jennings & Zeitner, 2003 highlights the fact that Internet has been posing noticeable threat to pre-existing media as people prefer to use it to follow public affairs, politics, and news as compared to newspapers, magazines, radio and television or use it as an additional supplier of information. We can say that Internet has reduced the significance of other media, as reported in Easy Access to Online Information Reducing Voter Turnout: Study, NDTV 2016.
Overload leads to Mistrust: Jennings & Zeitner, 2003 raise the concern that physical isolation associated with Internet use as well as widespread instances of uncivil net behavior can drive down levels of social trust, which are crucial for people to work collectively for a common cause. It further speculates that Internet via its chat rooms provides an ideal forum for fostering and abetting political cynicism. Easy Access to Online Information Reducing Voter Turnout: Study, NDTV 2016 seconds this by adding that the deluge of information makes it difficult for voters to filter relevant information efficiently and create confusion.
Digital Divide: Jennings & Zeitner, 2003 argues that the ‗digital divide‘ that is associated with differential access to the Internet could get exaggerated and may reinforce existing inequalities in civic engagement as people those who already have resources and skills, will simply adopt Internet as another tool. The results of the study revealed that heightened Internet use is either related with reinforcement or widening of civic engagement gap between those with and without access.
Mobile Divide: Ikeda, Richey, & Teresi, 2013 confirms that browsing platforms have differential impacts on participation. It defines that Mobile Divide occurs because mobile Internet usage does not facilitate social networking and political participation the way PC Internet usage does. The authors noted that mobile users have started to think that there is an app for everything and search for it even before browsing it. It explains that mobile browsing has been designed in a way to avoid cumbersome browsing, limit Internet usage, reduce exposure to news & heterogeneous others, which can serve as a source of unbiased political information and can potentially, eliminate the need of full-scale browsing. It has been clearly evidenced in the study that Mobile use of Internet being more focused on one-to-one communication makes access to search engines, chat-rooms and blogs nearly impossible unlike that of a PC which can connect diverse virtual social networks. It concludes that PC Internet usage has a positive effect on political participation, while mobile phone Internet use has a negative effect as expected.
Increased Participation: Ikeda, Richey, & Teresi, 2013, claims that by promoting virtual communication, internet can actually increase participation in voluntary organizations and politics. Further, Jennings & Zeitner, 2003 proposes that Internet will enrich community life, strengthen civil society and democratic politics as it expands the opportunities for communication and mobilization. But the authors also added that Internet acts as a depoliticizing medium by deflecting people from civic matters as it engages them with its extensive use of e-mail, shopping and entertainment platforms.
Assessment of Impact of Quality of Internet in India and its Impact on Users October 2017
E-34, East of Kailash, New Delhi – 110065, India
URL: www.consumer-voice.org Page 32
E. People with Special Needs
Internet comes to the rescue: Reeves, 2000 proposes that HIV-positive individuals have to cope up with not just the physical consequences of illness, but many social, emotional and psychological issues also. They seek emotional support in dealing with psychological stress that comes along with this disease and can be accomplished through a network of friends, family and community-based service organizations but, due to their circumstances may not be able to get sufficient social support. The authors noted that affected individuals generally lose their social skills because they stop going out, but through Internet, they receive validation for their feelings and thoughts. Bannon, McGlynn, McKenzie, & Quayle, 2015 highlights that it is sensitizing to know that young and adult people with special needs, autistic disorders, intellectual disabilities, mental health problems, social, emotional and behavioral problems and specific or more general learning difficulties experience a range of difficulties in development of identity, competence and social connectedness. It elaborates that Internet may serve potential benefits to conquer these difficulties and the use of Internet will allow them to engage in activities which support the development of identity, competence and a sense of connectedness and belonging within a social network that is essential to healthy development and psychological well-being and areas that present a challenge for this population in offline environments. The results of the study underscore that participants felt that unlike other people, Internet is always there no matter what time or day it is.
Online Identity Development: Bannon, McGlynn, McKenzie, & Quayle, 2015 presents the benefits of using Internet in identity formation for such persons with two varying options. On one side, it is believed that identity experiments online will result in individuals feeling less sure of themselves and therefore hindering the process, potentially resulting in poorer outcomes. But, on the other side, it is believed that experimentation of identity online, where individuals may pretend to be someone else can support and foster identity development, as role-playing allows individuals to control how they are seen by others. It is justified to say that Internet as a mode of online interaction facilitates the development of identity as it allows for more impression management than in face to face interactions.
Availability of Information: Bannon, McGlynn, McKenzie, & Quayle, 2015 puts forward the idea that Internet makes itself a place for self-help materials and web-based information that can help people live a normal life. Reeves, 2000 has too reassured that Internet promotes empowerment through providing all the relevant information one may need. Grimaldi & Goette, 1999 also implies that Internet played an important role in life of people with disabilities as it allows them to access e-mail and wealth of other information without having to leave home.
Social Support Network: Reeves, 2000 implies that Internet with its wide array of functions provides a viable alternative for individuals who cannot or who elect not to pursue traditional avenues of social support and can be used for information, communication and interaction. It is a medium of connecting people who identify with one situation and makes it easy to talk about heavy and personal stuff. It further adds, that Internet augments social support and becomes integral to the survival of such people by providing them with an ability to communicate and have support network online.
Empowerment: Reeves, 2000 in their study to understand the impact of Internet on HIV-positive individuals realized that it gave people a sense of power that allowed them to cope with a strengthened position rather than being a victim or in a weakened position, boosted confidence among affected
Assessment of Impact of Quality of Internet in India and its Impact on Users October 2017
E-34, East of Kailash, New Delhi – 110065, India
URL: www.consumer-voice.org Page 33
individuals making them feel that they were capable of accomplishments. It was noted that it empowered people to identify the virus and build up their immune system by highlighting it as an enemy with the tactics it uses to weaken affected human bodies and made people realize that they are in-control of their bodies and can be productive. Bannon, McGlynn, McKenzie, & Quayle, 2015 adds that asynchronous communication on the Internet allows for online learning forum where young people can take more time to process information presented before forming a response.
Building Competence & Self-confidence: Bannon, McGlynn, McKenzie, & Quayle, 2015 argues that Internet has considerable potential forum for allowing young people to learn and develop competence because it allows for continued learning online and may benefit individuals who may otherwise find a face-to-face learning environment difficult resulting in them avoiding this, such as people who experience anxiety or have communication difficulties. It elaborates that Internet may also be helpful for individuals with heightened anxiety in comparison to the general population, as they may find it easier and less threatening to participate in online learning. It is also highlighted that Internet use allowed the development of a range of skills including cognitive, social and communication abilities and it may also offer greater opportunity for this group to participate within a wider social community, thus, benefitting social competence. Reeves, 2000 signifies that this increased confidence allowed them to deal with pain, disability, fear and depression associated with their illness. Grimaldi & Goette, 1999 agrees and adds that Internet gives liberty of expression and self-reliance by expanding their independence and helping them in their recovery.
Psychological well-being: Bannon, McGlynn, McKenzie, & Quayle, 2015 advises that development of skills and abilities through Internet use helps in raising self-esteem and makes such people feel good about them. The authors note that Internet use has a positive impact on psychological well-being in people with special needs as it offers them opportunities to make social ties and is beneficial for people who are considered to be as less competent.
Facilitating help to others: Reeves, 2000 found out that Internet helps people to be of service to others, through opportunities such as volunteering and speaking to groups, serve as counselors of wellness clinics to other people. It could allow people to create websites and blogs to disperse helpful information and resources to people where there was scarcity, as they realize the importance of sharing. The respondents realized helping others also added to positive energies, eventually, helping themselves and was like self-fulfillment for them. Bannon, McGlynn, McKenzie, & Quayle, 2015 also confirmed that users‘ sense of competence improves by providing information and clarification to aid the understanding of others.
Clinical assessment & treatment: Reeves, 2000 advises that it is due to Internet that people with special needs don‘t just take passive recommendations from their doctors, but an active role in standing up for themselves, as it has made them being an equal and active partner along with their physicians in health-care decision-making. It implied that Internet is a valuable resource for HIV-positive individuals and thus, there is growing interest among health-care professionals in creation of programs that alleviate stress and nurture the coping efforts of their clients who are struggling to live with HIV. Bannon, McGlynn, McKenzie, & Quayle, 2015 added that the role of Internet is of high importance to clinical assessment as appropriately adapted online forums can provide support and counseling as a way of delivering psychological therapies as such people finds it easier to interact socially and openly online.
Assessment of Impact of Quality of Internet in India and its Impact on Users October 2017
E-34, East of Kailash, New Delhi – 110065, India
URL: www.consumer-voice.org Page 34
Unrealized potential: Bannon, McGlynn, McKenzie, & Quayle, 2015 admits that there are possible difficulties that people with special needs may face that inhibit them from taking full advantage of Internet. These include experiencing confusion, cognitive deficits relating to processing speed and selective attention, attention and concentration problems and heightened distractibility. It has been explained that in the Internet environment, generally there are lots of sources of information, including auditory and visual stimuli, perhaps all being presented at the same time, from various sources which make it difficult for such individuals to use Internet to support their special needs.
Negative Aspects: Bannon, McGlynn, McKenzie, & Quayle, 2015 informs that Internet allows users to put up inaccurate information on their social profiles to engage in online role playing and impression management. Reeves, 2000 raise the concern of abundance of information on Internet can be frustrating, because it is difficult to identify which one is accurate and reliable. Grimaldi & Goette, 1999 confirms that the biggest problem is locating valuable information that is available on Internet.
4. HUMAN CAPITAL
A. Education
Paradigm shift: Pollock & Wilson, 2002 recognizes that the use of Internet for educational purposes has been growing rapidly as Internet assignments and Internet-mediated instruction replace face-to-face class time. It adds that Internet has been helpful in containing the rising costs of higher education, accommodates more diverse body of students and may also be effective than courses that are delivered face-to-face. It further validates that there are three functions of computer enhanced instruction model – Information, Instruction and Communication that aim at increasing student participation, enhancing written communication skills and focusing the learning experience on interaction and reflection. Agarwal & Day, 1998 reassures that Internet has resulted in two major advantages for students. First, it offers a new medium of interaction that complements classroom instruction and facilitates learning. Second, it offers the opportunity to learn, use Internet technology and yield positive externalities for future academic and career paths. Also, as per Hinson, 2006, Internet can improve the productivity and efficiencies of university academicians as they can use Internet to improve their skills and get any knowledge & information. Fung & Pun, 1997 concluded that the main goal of acceptance of rapid developments in technology by the education sector is to support learning and teaching to make the best schools, teachers, and courses available to all students without regard to gender, distance, resources, or disabilities i.e. teaching without discrimination.
Information Transmission & Retrieval: Agarwal & Day, 1998 records that recent developments in technology have made transmission of information possible through Computer communication and conferencing that include e-mail, mailing lists, newsgroups, interactive messaging or ‗chat‘ sessions and video conferencing and Information Access, retrieval and use through FTP, WWW etc. It adds that e-mail, mailing lists, and chat software promote instructor-student interaction, and Web-page dissemination of information provides easy access to class syllabi, schedules, lecture notes, projects, and assignments. Hinson, 2006 also implies that Internet offers a range of capabilities for retrieving information, providing access to multimedia data and allows users to utilize information at remote locations. Fung & Pun, 1997 acknowledges that wealth of information on Internet is growing exponentially each day and has replaced the dominant sources or vehicle of knowledge i.e. books and papers. Utilizing these traditional ways of
Assessment of Impact of Quality of Internet in India and its Impact on Users October 2017
E-34, East of Kailash, New Delhi – 110065, India
URL: www.consumer-voice.org Page 35
obtaining information was a tedious job when it came down to searching for a specific piece of information through the index or table of contents. In addition to this, the information was confined to the pages of a book, which became a handicap, as information must always be updated and available on demand at immediate basis. The authors explained Internet has not just rendered these sources of information as un-economical in terms of time, costs and space, but also, equipped users with multimedia and hyper-linking capabilities that allow information to be presented in form of sounds, videos and pictures with no limit on number of users who could use it simultaneously.
Interaction & Communication: Fung & Pun, 1997 features that Internet breaks the boundary of traditional classroom by allowing teachers and pupils to have immediate connection to the outside world. Agarwal & Day, 1998 adds that students find value in electronic communication as it provides better access to instructor, more interesting assignments and advocate future use of e-mail in their academic and professional careers. The authors noted that greater interaction between the instructors and the students and hands-on learning of new concepts are results of effectiveness of Internet usage. Pollock & Wilson, 2002 also confirmed that computer-enhanced format of instruction was marked more favorable for helpfulness of discussions with other students, ease-of-contact with the instructor, and opportunities for expressing and sharing ideas. It elaborated that instructors rely on Internet to provide course material, direct assignments and readings, and obtain feedback from students, whereas students can read, process, and analyze information, discuss the issues with their peers, and complete assignments—in short, to change their roles from passive recipients to active participants. Hinson, 2006 noted that academicians are able to communicate with their worldwide colleagues through Internet and discussion groups allow users to follow issues of interest and keep themselves up-to-date on these issues. It also serves as a tool for supporting networking among professionals in different geographical locations.
Attitude towards the subject: Pollock & Wilson, 2002 evidences that the students, who enrolled for computer-enhanced format, expressed greater willingness to take up other courses that employ similar formats and had higher level of overall satisfaction. Agarwal & Day, 1998 supports this view and confirmed that computer conferencing allows for increased interaction and discussion, which results in increased ability of students to apply theory and thus stimulate their perceptions and interests towards their subjects. The authors observed that the Internet-enhanced group expressed a significantly higher likelihood of attending a lecture given by an economist, was more likely to consider economics as their favorite subject, used economic concepts to analyze situations more frequently, and disagreed about finding economics dull.
Collaborative teaching: Fung & Pun, 1997 marks that nothing in history has been as powerful as the Internet in terms of changing traditional roles of teacher as an expert and student as passive receptacle for handover of knowledge. Active and expression learning has shifted traditional information-giving to pupil‘s participation in information-gathering, interpretation and use. It adds that, Internet is like a vehicle for teachers to create high performance learning environments through which the goals of the various dimensions of schooling can be accomplished. Through resources available via the Internet, students may be provided opportunities to engage in authentic, challenging activities; teachers can set meaningful, challenging activities as the center of instruction; and Classroom approaches that support such a paradigm might include collaborative learning, heterogeneous groupings, teacher as facilitator, performance-based assessment, peer-to peer mentoring, multidisciplinary curriculum, interactive modes of instruction,
Assessment of Impact of Quality of Internet in India and its Impact on Users October 2017
E-34, East of Kailash, New Delhi – 110065, India
URL: www.consumer-voice.org Page 36
student exploration, and extended blocks of time. Agarwal & Day, 1998 adds that the point of using Internet is to add value to classes and to meet the challenges of teaching, as it substantially reduces the contact time through email and discussion lists that allows students to observe the real-life implications of the theory learned in class. Thereby, the authors conclude that Internet serves as an information revolution and its use in pedagogy is beneficial whenever interaction, discussion, research or transmission of information is involved. Collier & Lebaron, 2006 noted that teachers can be encouraged to follow ways to improve their teaching through technology; however, their reluctance on capitalizing through this technological revolution is not good for their long-term survival.
Enhanced Learning: Pollock & Wilson, 2002 observed that students who studied under computer-enhanced instruction model exhibited an edge in creative thinking, further facilitating creative application of assignments to course themes and contents. It further marked that computer-based learning models required higher level of interaction between the student and the material and thus fosters more thorough and meaningful learning than standard lecture delivery. Agarwal & Day, 1998 seconds this opinion by adding that Computer communication and ease of information retrieval through the Internet allow higher development of critical thinking and problem solving, foster independence and autonomy, and permit greater interaction. Moreover, better correspondence fosters thought and interest in the subject matter and hands-on experience makes understanding and learning process more active. As per Fung & Pun, 1997, students can learn by doing in a more authentic sense, using real life situations and simulations at times and they may learn not only from their teachers but also from many others by becoming both publishers and browsers on the Internet. It also conveys that Internet will not just change classroom processes, but also pupil‘s learning through an ultimate home infrastructure as web technology has opened new channel for direct sales to customers. An example is the Internet for learning pages that provide learning materials to pupils and students directly. The spectrum of their subject contents, design and attractiveness to pupils is beyond the competition of the curriculum in any single school.
Student Empowerment: Fung & Pun, 1997 acknowledges that Web technology has shifted the ability to control information flow from the information provider to the users. However, the authors could not rule out the possibility of this empowerment being a threat to many teachers. Moreover, pupils can now acquire their own communication links for exploring topics beyond the boundaries of the traditional concept of school and they can quickly access learning resources at any hour of the day while studying at home, or in a library or any place with Internet connection.
Improved quality of education: Agarwal & Day, 1998 suggests that Internet enhancement of courses facilitates communication between the instructor and students, easy access of information that has promoted the use of economic data and real-world applications to enhance the teaching of the theory. This provides real increase in quality of education. Besides this, higher simulation of interest and better use of class time and communication of ideas was noticed to be present in the Internet group and thereby resulted in better overall assessment of the instructor and his feedback and interest in students. As a result, Instructor effectiveness improved due to facilitation of learning and communication of ideas and information. The findings of Pollock & Wilson, 2002 also showed that students in the computer format showed double increase in their knowledge improvement as compared to that of students in traditional lecture formats. Collier & Lebaron, 2006 also noted that a growing number of universities have
Assessment of Impact of Quality of Internet in India and its Impact on Users October 2017
E-34, East of Kailash, New Delhi – 110065, India
URL: www.consumer-voice.org Page 37
emphasized on increased exposure to computer networking and technology-rich pedagogy. It is for this, that they have introduced Internet training and education as a major in their course curriculum.
Contradictory concerns: Pollock & Wilson, 2002 raised some concerns that challenge each other. First, Internet has allowed some people to work at their own pace, but they also feel that it has reduced face-to-face time with instructor. Second, some people found it interesting to use the Internet for educational purposes, whereas some had to face network problems. Third, Forum discussions yielded better results for some, while others went confused in figuring the flow of the conversation. Fourth, Instructor‘s enthusiasm and knowledge can provoke interest for some but others had to wait for days to get responses from instructors. Fifth, Internet can be interesting for some but others may find it hard to understand, as it might not explain well. Sixth, altogether, Internet can be enjoyment and fun for some, while others might think of it as boring and repetitive.
Negative Aspects: According to Fung & Pun, 1997, the entire schooling system will be re-engineered in the era of Internet, where students are more detached from a single school and the teachers therein and open to more opportunities of interacting directly with other schools and 'knowledge providers' on the Internet. On top of this, Web technology has made both publishing and retrieval of information accessible to many, due of which, schools will now have to be gatekeepers in short-listing books and educational websites that students can read and visit as finding relevant information becomes difficult in such a loosely controlled and independent environment. Internet is anarchic in a way that it is accessible by anyone anywhere in the world and anyone anywhere can publish anything. Without proper management, the Internet could become a potential threat to the well-being of a school and its pupils when they are Internet connected.
B. Health
Process Automation: London & Dash, 2016 briefs that many healthcare processes can be digitized, including appointments, logistics, patient records, admissions, human resources and rotation management, and billing.
Advanced Analytics: London & Dash, 2016 argues that health-care industry must harness the power of data through advanced analytics and transparency as available applications that rely on healthcare data analytics support patients in understanding and managing their medical condition, influencing their medical care and help in identifying the drug to which they are likely to respond best. It elaborates that the process of making crucial clinical decisions about diagnosis and treatment will increasingly be supported by algorithmic tools that compare a patient‘s clinical and other data with large datasets and draw on the full body of scientific literature.
Reduced costs: London & Dash, 2016 proposes that health care costs can be reduced up to 10% as the collection & publishing of data on outcomes and quality of care can also allow systems to modulate tariffs & orchestrate competition among providers based on their quality of care and will be important for raising the overall standard of care across healthcare systems. It affixes that collaboration of information and care profiles will lead to improvement of effectiveness and efficiency of maintaining patients at home, thereby avoiding unnecessary hospital stays, improving clinical outcomes, and reducing the costs of care
Assessment of Impact of Quality of Internet in India and its Impact on Users October 2017
E-34, East of Kailash, New Delhi – 110065, India
URL: www.consumer-voice.org Page 38
Improved Quality: London & Dash, 2016 asserts that in addition to providing efficiency gains, automation can improve patient care like remote monitoring of intensive-care units via patient sensors and a central control room can lead to reduction in mortality rates and the average length of hospital stays. It adds that digitization can also bring significant benefits in the area of clinical trials, such as improving the efficiency, reliability of clinical data collection, trial monitoring and optimizing trial design through the use of modeling tools. Moreover, enhancing clinical decision making and the monitoring of treatment protocols can significantly reduce variability and increase adherence to good clinical practice, thereby promoting healthier behaviors.
Patient Engagement: Hospitals use portals to drive patient engagement, Internet Health Management 2016 defines patient engagement as greater involvement of patients in healthcare that results in their good health and ensures its maintenance. The article apprises that many hospitals in western countries have taken some form of patient engagement initiatives that are information technology driven and help in delivering better health care services. Most popular tools used by hospitals to drive patient engagement are web portals, secure emailing, electronic health record, online scheduling & reminder tool and social media.
Repercussions of Internet Addiction: Young, 1998 notifies that the initial symptoms of Internet Addiction are depression, bipolar disorder or anxiety, which later grow into compulsive use of Internet that is characterized by preoccupation with the Internet, lying about the behavior, a loss of interest in other interests and/or people only to prefer more time online, using the Internet as a form of escape, an inability to control the behavior, impairment in functioning, frequent time distortion, sleep deprivation, increased social isolation, being secretive about online activities or a sudden demand for privacy when online, and persona development when online. Internet Addiction May Increase Risk of Depression and Anxiety, NDTV 2016 signifies that excessive use of Internet may be responsible for increasing the risk of depression, anxiety and other mental problems, especially among college going students. It is noted that those having Internet Addiction face more trouble in accomplishing day-to-day tasks and have attention deficiency that leads to poor planning and time management skills.
Bone Health: According to Social media addiction bad for hands, The Hindu 2016, continuous texting on social media/mobiles and gaming through the day can cause injuries arising out of prolonged stress positions and repetitive motions. The article informed that leading orthopedic experts have warned about wrist & finger joint pain, repetitive stress injuries to the hands, arms & back, wrong postures, physical stress and problems in cervical & spinal cord. Neglect of such conditions can further result into arthritis of fingers, blackberry thumb, carpet tunnel syndrome and disturbed spine.
C. Habits
Interpersonal Relationships: Mokhtari, Reichard, & Gardner, 2009 notes that Internet influence on social life appears to revolve around whether the Internet makes things more efficient for people by freeing up additional time for socializing and other activities or whether Internet use is a potentially isolating activity that competes with, rather than complementing social time. The authors quoted that the location and timing of Internet use determine which interpersonal relationships are affected.
Recreational Reading: The results of Mokhtari, Reichard, & Gardner, 2009 revealed that students spend more time on an average on Internet as compared to that of academic reading, television watching and
Assessment of Impact of Quality of Internet in India and its Impact on Users October 2017
E-34, East of Kailash, New Delhi – 110065, India
URL: www.consumer-voice.org Page 39
recreational reading as more number of students enjoyed using Internet than doing other activities and they were more likely to use Internet everyday or almost every day.
Time Displacement: According to Mokhtari, Reichard, & Gardner, 2009, Internet has emerged as an exceedingly prominent new information and communication technology that might interfere with the time that students spend in doing recreational activities and thus marks the concept of displacement hypothesis that is based on the premise that Internet has created a shift in people‘s allocation of time during the day i.e. more time on the Internet equals less time on other activities. It explains that Internet use is associated with reduced amounts of time spent socializing with family, friends, and colleagues.
Time Creation: Mokhtari, Reichard, & Gardner, 2009 proposes another hypothesis called efficiency hypothesis, which suggests that Internet serves as an added resource, makes users more efficient and results in less time spent on other activities. The findings showed that Internet appears to be a powerful informational resource for respondents who spent more time on Internet as compared to other activities and marked that people enjoyed using Internet for e-mail, chatting, surfing, conducting research and listening to music. The study concluded that the time college students spent on the Internet did not appear to displace or interfere with the time they reported spending on reading for academic or recreational, thereby lending support to efficiency hypothesis.
Newspaper Reading: Vyas, Singh, & Bhabhra, 2007 highlights that the three key elements that drive the newspaper industry are content, delivery and advertising, which Internet is very well capable of providing at much lesser costs. In addition to this, it also provides convenience of reading news as per discretion & availability of time, cost advantages for those who have free Internet access and allows for simultaneous scanning of two- three similar news-sites to find out the view different opnions on the same issue. Also, the amount of information available is abundant and easily accessible from anywhere. The analysis indicated that more updated and multiple reporting, for the newsreader on Internet highly correlates with perfection dimension; presentation, amount of news & availability with access dimension; and convenience & cost advantage with value dimension. The authors found that Internet has resulted in time displacement of newspapers and is more popular in case of business/stock news, sport news and international news. It was concluded that reading news on Internet is complimentary to reading newspaper and it is not substituting newspaper.
D. Research
Worldwide connectivity: Perry, 1995 explains that Internet is a global network of networks that connects more number of people each day in different countries worldwide to more than a billion computers. It adds that the nature of the Internet creates an environment in which information is shared with colleagues in cross-disciplinary research that spans across the globe. Parent & Cruickshank, 2009 also validates that Internet fosters the creation of virtual communities of individuals who are geographically distant but linked with common interests and concerns.
Information Sharing: Chen, et al., 2009 reports that Internet provides information originating from governments, institutions, corporations, or individuals for a wide array of purposes that include research, learning, business, politics, charity and leisure in various forms like e-mail, web pages, blogs, wiki resources, instant messages, open access journals and books. It is for these reasons, that users consider it as the first choice for information search. As per Parent & Cruickshank, 2009, Internet has highly
Assessment of Impact of Quality of Internet in India and its Impact on Users October 2017
E-34, East of Kailash, New Delhi – 110065, India
URL: www.consumer-voice.org Page 40
influenced the way information is accessed and shared around the world. Zumalt & Pasicznyuk, 1998 apprises that Internet has an ability to store billions of records such as complex data sets, high-resolution graphics, sounds, videos and animation that are available in addition to plentiful databases and documents. Perry, 1995 defines two categories of information available on Internet. First, Static – They are Internet-accessible databases that are continuously updated, always remain a recognizable entity, provide exhaustive indexing than many of the print or CD resources and have more flexible access points. Second, Dynamic – They are constantly enhanced information resources or electronic sites that contain reference aids and specialized documents of all types, originating from all areas of the world. They can be electronic bulletin board around which a given community of scholars worldwide gather, confer and contain embedded pointers & related hypertext links. Also, in Moore, 2000, the authors could not deny that electronic materials have means of easing the pressure on space and the flexibility to lend themselves to easier transmission, copying and reprocessing into special formats.
Academic Use: Applebee, Clayton, & Pascoe, 1997 notes that Internet has made a significant impact on academic work as it has resulted in improvement of productivity, quality and efficiency. Furthermore, Dowling, 1998 adds that the complete accessibility of educational resources via the Internet generates consequences in relation to knowledge creation and raises concerns as to whether the timeframes traditionally associated with research degrees should be reduced in acknowledgement of benefits that arise out of more proficient information retrieval and efficient effects of word processing on academic writing. This development of technology has resulted in reduction of social complexity that is innate in traditional system of interaction and has maximized benefits for academics. Moore, 2000 includes that e-books and electronic journals are available on Internet, some which can be accessed freely whereas others ask for subscription charges. Parent & Cruickshank, 2009 verifies that the invention of World Wide Web provides a coherent view of a library of files that are distributed across host computers all over the world. In addition to this, hyper-linking has also allowed them to follow the thread of one file on one computer to a related file on another and thus creates an increased demand for means of information search.
Reference tool: Devlin & Burke, 1997 describes Internet as a very useful reference tool as it includes documents in different media, both hardcopy and electronic, besides to non-conventional sources of information such as information centers, individual experts and electronic mailing lists. It adds that categorization increases the usefulness of Internet as a reference tool as it would help in matching particular resources with specific question types. Zumalt & Pasicznyuk, 1998 confirms that Internet has the ability to answer wide range of questions and is a stable reference medium as Internet based results can be verified with a traditional reference source. The authors note that many research professionals use it as an instrument of choice rather than a tool of last resort. However, Chen, et al., 2009 noted that web information is not regularly cited as reported in a number of publications due to lack of confidence among researchers in the quality and reliability of resources.
Supports collaboration: Perry, 1995 proposes that the interactive nature of the Internet plays a formative role in the discussion of original results or findings and provides a venue in which scholars from around the world can participate in the reasoning and sculpt the information into a larger and cohesive whole. Dowling, 1998 adds that Internet has the ability to support collaborative research & writing as it facilitates exchange & modification of textual material by writers who can interact through a range of software types and makes assembling of electronic textual material a reality. Moore, 2000 advises that
Assessment of Impact of Quality of Internet in India and its Impact on Users October 2017
E-34, East of Kailash, New Delhi – 110065, India
URL: www.consumer-voice.org Page 41
development in electronic resource purchasing has resulted in a decline in possession of print items, which further causes libraries to explore co-operative collection & development of print materials to ensure access and maintenance.
Plagiarism & Copyright issues: Dowling, 1998 highlights that the ready availability of massive amounts of material in useable form significantly facilitates the problem of plagiarism. The authors also note that it gives rise to copyright issues as it seeks the prior consent of original author/owner of electronically mediated textual information. Parent & Cruickshank, 2009 also confirms that Internet age gives rise to issues of copyright, freedom of access to information and enfranchisement. Chen, et al., 2009 adds that research information on the web comes with varying quality, as some information is available without any name or affiliation, which is a major determinant of reliability of information.
Virtual Library: Moore, 2000 describes virtual libraries as libraries without walls and informs that Internet provides the windows and transparency to these libraries. It allows users that are physically isolated from the library to see in and those who are inside the library to see out. It reassures that Internet plays an inevitable role in virtual libraries as they have become of core importance for distance learning programs. The widespread access of Internet into homes of students ensures the success of these schemes and facilitates the libraries to offer course materials and other documents electronically to students scattered over wide areas, particularly rural areas. Parent & Cruickshank, 2009 affixes that just as libraries are getting transformed into databases of digital objects from being brick-and-mortar structures, librarians are also getting transitioned from being custodian of books to being leaders and enablers of the information. Libraries now are like Internet cafés, satellite- equipped bookmobiles, a collective with a laptop, a person with a cell phone and thus can close the informational gap that exists between skilled and the new Internet user. The librarian needs to be a teacher of and guide to the resources available, and also an advocate to ensure that these resources continue to be available and new ones are continually brought forward.
Digital Divide: Parent & Cruickshank, 2009 notes that citizens of developing countries are unable to take full advantage of the Internet potential, due to limited access to computers, lack of training and less available bandwidth. This concept is termed as Digital Divide.
Open Access: Perry, 1995 illustrates four different categories of operations that link Internet resources to users. First, Telnet - It gives remote users the ability to connect to remote locations, makes it possible for a user to log into a system other than of his own and use its resources and allows scholars to search the contents of libraries around the world from remote locations, no matter where these scholars actually live. Second, File Transfer Protocol - Through this, one can access sites all over the world. Information available on these sites can easily be downloaded and transported into word processing programs. Third, Gophers - This is a repository of full text resource written by specialists in a given academic discipline that is dynamic, interactive and almost constantly updated. It is designed to be a software application that organizes access to vast worldwide Internet resources using a series of nested menus. Fourth, World Wide Web - It provides a document delivery system, which uses built-in hypertext linkages to connect relevant documents or ideas and may contain not just text, but also sound, graphics and videos. It is valuable because it provides a consistent and easy-to-use interface to other Internet services.
Reduced gap between developed and developing countries: Dowling, 1998 informs that in developed as well as developing economies in the world, academics with access to technology are interested in using
Assessment of Impact of Quality of Internet in India and its Impact on Users October 2017
E-34, East of Kailash, New Delhi – 110065, India
URL: www.consumer-voice.org Page 42
various user friendly facilities and capabilities of the Internet that includes emails, newsgroups, list servers, etc. Parent & Cruickshank, 2009 supports this view and adds that Internet as a technology has potential to narrow down the gap between developed and emerging economies by enabling access, sharing of useful information and by connecting virtual communities of interest. It elaborated further that Internet is not passive; rather it drives activity and cannot be ignored for its fast and low-cost alternatives to traditional models of research, business, consumption and communication. The authors claim that Internet has the potential to be a force multiplier to development. They give an example of India‘s Education Research Network (ERNET) that is notable for how it is used by universities, NGOs, government agencies and other non-commercial entities in meeting their diverse research needs. The Digital library of India is a portal with over one million books available free-to-read to anyone with Internet connection and a means to display the electronic text. This unlocked access unfolds how Internet comes handy in benefiting emerging economies by making large volume of researches available to academic, professionals, public servants and the general population.
5. FINANCE/ECONOMIC NEEDS A. Jobs and Employment a) Help in Job Search The impact of Internet on Job Search in Germany was estimated by Chau, 2012. Internet has played an important role for the job seekers and employers as it has saved the time of both. Job seekers who use the Internet have 4 percentage points higher probability of being employed in a 12-month period. University degree holders were more likely to be employed in a 12-month period. Unemployed people aged 26-35 were most likely to be employed within 12 months of the period. Job search via federal employment institution had a negative effect on the search results. In contrast, job seekers who contacted employers directly had much higher probability of being employed in a 12-month period. Single women job seekers are less expected to be re-employed in a 12-month period. Job search on the Internet can definitely serve as a signal. The employers and the job seeker both are proficient in using computers and browsing Internet.
b) Impact on Earning The impact of Internet use on earning of U.S. workers was examined by Bonikowski, 2008. People who have access to the new digital technology have benefited in the form of improved employment possibility. Internet use is becoming necessary for certain kinds of social and political participation and for access to some private markets and government services. Technology-linked wage gains show improved productivity due to the use of the new technology at work. Internet use may also contribute to earnings by enhancing access to labor-market information and by serving as a signal of status or competence. Internet can be used as a source of social capital and as a cultural resource. Internet users may benefit from online job listings, expanding personal social network, benefit their employers with useful information, contacting clients or setting up collaborative ventures. Internet users earned more than nonusers, especially if they used the Internet in both years. The labor market rewarded Internet use at home and at work, and workers who went online at home and work did best of all.
c) Impact on Professionalism
Assessment of Impact of Quality of Internet in India and its Impact on Users October 2017
E-34, East of Kailash, New Delhi – 110065, India
URL: www.consumer-voice.org Page 43
Ellen M. Harshman, 2005 studied the impact of Internet on professionalism. Traditional concepts of professionalism have been significantly challenged by the appropriation of Internet technologies. Some people misuse Internet on professional ground because its authenticity cannot be verified. The emergence of new forms of expertise on the Internet, by challenging established institutional and professional guarantees of expertise, undermines important and powerful arbiters of ethical forms and behaviors. Convenience, access, and price act as motivators for seeking non-traditional sources of advice and information on the Internet. It provides a sense of belonging. An analysis of history of professional practice recommends that institutional and professional interests have colluded to create a widening net of claims for exclusive rights to the possession and distribution of information. The increasing use of the Internet to access knowledge and advice once thought to be the exclusive province of particular professions challenges both the meaning of the term profession and the infrastructure assumptions which supports codes of professional conduct. On the other hand, Internet can also become a means for professions to successfully negotiate the challenges created by virtual environment. It is concluded that the Internet provides a means of reinforcing traditional professional practice, thus increasing the quest for alternative sources of knowledge and information, leading to the pressure for Internet regulations on the part of the professions and increasing the quests for alternatives.
d) Impact on Labor Market Singh, 2008 examined the impact of Internet and E-commerce on labor market. E-commerce has played an important role to generate employment in economy. This is possible through improved labor facilitation and direct employment for developing countries. The maintenance and supervision of the additional hardware and software systems that are pre-requisites for e-commerce has lead to the need of more computer workers. Internet technologies that drive the global information revolution that is happening around have made outsourcing of service related jobs to developing counties possible. The rise of Internet has also lead to increase in women‘s presence in paid employment and has further reduced gender based discrimination. Internet has positively impacted the labor productivity because e-commerce reduces the coordination costs between different work processes, facilitates firms to fragment tasks and thus enables them to improve labor productivity. Development of more interactive job search sites allows job seekers to store search preferences and user profiles and easily follow-up on identified vacancies by making online applications. Internet is invaluable for employers as well. The ease of posting employment openings the relatively low cost of advertising and the speed of candidates response has many hiring managers devoting more time than ever before to recruiting online. The study noticed a shift in labor demand towards high-skilled workers (i.e. IT workers) both in manufacturing and non-manufacturing industries. Implementation of ICTs makes the labor market more of a gainer, but a loser too. It is expected that implications of these technologies will open new opportunities for the labor market and give a shape to the future labor market.
e) Impact on Married Women’s Labor Force Participation Dettling, 2016 examined the impact of residential high-speed Internet on married women‘s labor force participation by using instrumental variable strategy. Educated married women with children are actively using Internet and there is a large increase in their participation. Internet has saved time and money as it facilitates individual life in different ways. The high-speed Internet use has positively impacted the labor supply decisions of married women as it facilitates work-family balance. There was a declining aggregate trend in labor force participation for men, single women and married women in the early 2000s. Tele-
Assessment of Impact of Quality of Internet in India and its Impact on Users October 2017
E-34, East of Kailash, New Delhi – 110065, India
URL: www.consumer-voice.org Page 44
work has increased the wages by reducing travel times and by improving productivity through reductions in absenteeism. Effect of high-speed Internet on labor supply will be relatively more positive for married women than single women and men if the Internet is used for tele-work and home production. High-speed Internet increased labor participation rate among college-educated married women with children. Less-educated women and highly-educated childless women exhibit a similar, somewhat smaller labor-supply response to high-speed Internet, while both are positive relative to men and single women. It was found that married women with high speed Internet were less likely to be unemployed than single women or men who used high-speed Internet.
B. Productivity Goss, 2001 studied the contribution of Internet to productivity performance of US in late 90s. Productivity enhancing power of Internet differs according to the intensity of IT of the industry. The productivity of the labor almost doubled of what it was two decades back. This growth was attributed to technology expansion and expanding IT capital stock. The results suggested Internet usage has a statistically significant impact on productivity. The U.S. productivity expansion during this period, results indicate that the Internet generated roughly one-fourteenth of U.S. productivity growth over the two-year period—not an insignificant share at all. But, beyond a certain stage, Internet usage has a negative impact on productivity which is explained by large adjustment costs associated with the implementation of computers. IT's drag on economic growth occurs because of the high costs of changing business practices necessary to utilize computers. Results show that Internet usage had a statistically significant impact on productivity for non-IT intensive industries. For IT intensive industries, Internet usage is found to have had no statistically significant impact on productivity. The paper concludes that Internet does have a positive impact on US productivity numbers from the years 1997-1999, which does not match the exaggerated claims of many economists, but is definitely not insignificant to be ignored. It has a promising future potential that will be harnessed with coming times and full adaptation by businesses.
C. Online Shopping
A study by ASSOCHAM and Grant Thornton (2015) revealed that online shopping via mobile phones are gradually increasing in India and are likely to touch 40 million in 2016.
Risk and Trust: Trust plays an important role in e-commerce activities. Grabner-Kraeuter, 2002 reported how trust is an important factor for the circulation and acceptance of e-commerce. There are two types of uncertainty, namely system-dependent and transaction specific. Online retailers are finding it increasingly difficult to sell their goods. Internet Users are unwilling to shop online because of fundamental lack of faith that must exist between business and consumers. Trust is not only a short-term issue but the most important long-term barrier to realize the full potential of e-commerce. Consumers foresee numerous risks while buying on the Internet as it does not involve simultaneous exchange of goods and money, because of the temporal separation between exchange partners. System dependent uncertainties arise because of potential technological problems and lack of clear legal norms. On the other hand, transaction-specific uncertainties arise out of asymmetric distribution of information between the transaction partners. Trust plays a key role in buying process as consumers tend to look for experience in credence qualities of products and their sellers. Trust functions to lower the perceived risk of a transaction. On the other hand, there are some risks that come about during exchange of information via Internet. System-dependent uncertainty comprises of events that are beyond the direct influence of actors and can be characterized as
Assessment of Impact of Quality of Internet in India and its Impact on Users October 2017
E-34, East of Kailash, New Delhi – 110065, India
URL: www.consumer-voice.org Page 45
environmental uncertainty. In the context of the Internet, it relates to potential technological sources of errors and security gaps. Technical safety gaps can emerge either in the data channel or on the final points of the process like the desktop system of the customer, the server of the Internet retailer or the involved banks. Transaction specific uncertainty may arise out of decisions of economic actors and is caused by asymmetric distribution of information between the transaction partners. This primarily concerns the quality of products and services offered on the Web because the quality assessment in electronic markets is much more difficult due to disappearance of the personal factors that are used in traditional modes of selling. This type of uncertainty can be reduced by application of concepts of search, experience and credence qualities. Online Product evaluation is possible through performance-oriented information substitutes that relate to the seller and his reputation in the market or adequate indicators such as brand names or performance bonds. Online retailers facilitate the evaluation of credence qualities, by signaling trustworthiness like referring to a certificate of a trusted third party. The paper concludes trust is a potentially important aspect for reducing uncertainty and complexity of online transactions & relationships. Trust is considerably useful in reaping economic benefits. Because in the near future trust will remain the decisive factor for success or failure of e-businesses, it is very important for Internet companies to act in a way that engenders consumers' trust. Efforts to increase the security of e-commerce systems and trustworthy behavior of online-retailers will prove to be of advantage for both consumers and companies engaging in e-commerce.
Furthermore, the role of perceived risk in online consumer buying behavior in Indian youth is explained (Kumar, 2013). The possibility of personal and financial information being compromised is the biggest fear that consumers generally have. Payment security and personal privacy are key concerns for the e-commerce industry. But at the same time, they are vulnerable to the risks associated with Internet shopping. These risks revolve around the expectations and the performance of products/parties involved. It comprises of two terms- Uncertainty and Consequences. It was also found out that social risk is one another major factor that is given priority by online shoppers, which is why Internet brands must pay great attention to it while developing marketing strategies. Online shopping accounts for a very small share of total Internet. This is primarily because consumers are reluctant to make purchases on the Internet due to perceived risk and lack of trust. Developing trust in online shopping environment is especially challenging because of the lack of direct contacts with the physical stores, salesperson and physical products in the digital world, where consumers can see, touch, feel and try the product and its quality which is not there in online shopping. Online shopping reduces opportunities for sensory shopping, social shopping, and face – to- face interactions with sales personnel. The degree and intensity of perceived risk would be different for different people, it would be different for different products; and, it would also change with situation. The perceived risk in online consumer buying behavior has been categorized into two: Product Uncertainty – when the product does not match up with the expectations and Process Uncertainty – when consumer doesn‘t have complete confidence in the transaction process. It has been found that product intangibility greatly increases the degree of perceived risk. The way shoppers can examine, compare and interact in offline modes is not possible in online modes. The means of getting information which reduces uncertainty and risk is not available in online shopping. Perceived risk acts as one of the major barriers to the growth of e-commerce. The government is investing loads of money in Internet infrastructure to promote it. It the retailers now, who have to understand the issues related to perceived risks and should come up with the solutions.
Assessment of Impact of Quality of Internet in India and its Impact on Users October 2017
E-34, East of Kailash, New Delhi – 110065, India
URL: www.consumer-voice.org Page 46
Suresh, 2011 examined the identifying factors of consumer perceived risk towards online shopping in India. Various perceived risks are involved in online shopping. These are functional risk, physical risk, financial risk, social risk, psychological risk and time risk. Consumer perception of risk is a function of consumer specific traits, product category, shopping situation and culture. Perceived risk is higher when purchasing products through Internet than when purchasing in-store. Perceived risk is said to decrease with Internet experience. Two major concerns that online shoppers have are- ‗security of online payments‘ and ‗privacy of personal information‘. Privacy risks have an inverse relationship with online shopping behavior. However, this does not imply that lower levels of privacy risk result in frequent shopping online. There are some cons of online shopping which include lack of social interaction, inability to inspect merchandise before purchase, and the lack of the so called ‗shopping experience‘. Performance risks can be minimized by designing websites effectively to offer experiential value by reducing impersonal nature of Internet shopping through virtual characters called avatars.
Forsythe, 2003 examined the risk perceptions of online customers and their online patronage behaviors within a perceived risk theoretical framework. It examined four types of perceived risks- Financial, Product Performance, Psychological and Time/Convenience loss risk. Some factors that contribute to better online purchase experience as compared to offline purchase are- saving time and money, wider choice, convenience, no transportation cost, no waiting line and no pressure from sales persons to buy certain products. There are four types of perceived risks. These are financial risks, product performance risks, psychological risks and time/convenience risks. There is a negative relationship between online shopping behavior and perceived risks. High perceived risk leads to increased reluctance in online buying.
Nature of Online Shopping: Brian T. Ratchford, 2016 examined the determinants of use of the Internet as a source of information on automobiles and its impact on the use of other sources, and on total search effort. The study found that the share of search time spent with the Internet is inversely related to age and positively related to education. Younger and more educated consumers are significantly benefitted by the Internet. People consider Internet as a source of information. Consumers use Internet to gather information about automobiles. Internet leads to reduced search for automobile on average, which is more pronounced for those who are likely to use the Internet, and are relatively young and are highly educated and rich. The total search for automobiles across all sources increases with gains to search, as measured by sticker price, but decreases with costs of search, as measured by log of wage, and with variables related to prior information and age, which are used as a measure of experience.
Priscila Silva Estevesa, 2015 discussed about the third-agers of Internet and identifies the relationships between the several variables surrounding this consumer behavior and the use of the Internet. Third-agers have come to make up an increasing percentage of the population in both developed countries and developing ones. There are two types of Internet use: Socio-Affective-Regulation (SAR) and Goods-and-Information Acquisition (GIA). SAR refers to Internet use for interacting with other individuals, affiliations and relationships, whereas GIA refers to use of the Internet as a convenient way to simplify knowledge and information gathering as well as for the acquisition of goods and services. Third-agers are beginning to show a greater interest in new technologies. However, there are still significant differences in the manner and frequency with which they use them. The needs of elderly people may differ from those of younger people, but also that needs may differ from one elderly person to another. The ―young
Assessment of Impact of Quality of Internet in India and its Impact on Users October 2017
E-34, East of Kailash, New Delhi – 110065, India
URL: www.consumer-voice.org Page 47
elderly‖ have more self-confidence, are willing to accept changes and personal challenges probably actively seek new experiences, are more likely to try new products, and are the most likely buyers of new products and services and, as such, may be an appropriate segment for many businesses to target. Third-agers are a population whose behavior is distinct from that of other age groups (whether for physiological, demographic or cognitive reasons).
The Neilson Online Shopping Trends Report, 2010 has given a brief snapshot of Online Shopping with a global perspective. Internet has transformed the ways of living is uncountable. It has changed the way of shop for foods and services, simply because the convenience of doing it online can‘t be beaten. The ability to book travel or concert tickets online has made the process much easier and more efficient. In the past decade, Clothing and Books top the list of products that are bought online and this trend is set to continue ahead too. The survey found that about one-third of online consumers say they primarily do their Internet shopping at retailers that have only an online presence, followed by another 20% respondents who prefer sites that also have ‗brick and mortar‘ stores and those that allow you to select products from many different online stores. However, these numbers varied across different countries. For 45% respondents, online shopping accounted for about 5% of their monthly spending. One of the great benefits of online shopping is the ability read others‘ reviews of a product, be they experts or simply fellow shoppers. These opinions are most important when it comes to purchasing consumer electronics. About 40 percent of online shoppers would not even buy electronics without consulting online reviews first. (Neilsen, 2010)
According to the report on NDTV, 2016 a survey done by Google, known as ―Mobile App Marketing Insights Asia Survey for 2016‖, has revealed that Indian Internet users are most likely in Asia to pay for digital goods and apps. It also showed that Indian users spent more time on web (62 mins) than on apps (44 mins). Indians have fewer apps installed than most other Asian nations, but Indian Internet users use 27% of their installed apps on daily basis. On an average, Indians use 9 apps per day. When installing an app, Indians look for the highest star rating, reviews and size of the app. They don‘t care much about money and are most likely to pay for an app. A good percentage of Indians as compared to other nationals, prefer to pay & subscribe for their content. Indians are also more likely to compare prices of different goods over the app than on mobile web. As more Indians use apps for shopping, ―app only‘ deals have become a norm in India. As compared to other countries, where almost half of the users turned off the app notifications, in India, this percentage was only 22%. This has helped drive companies‘ profits many notches up.
The report is based on online retail market (Crisil, 2014). Online retail market size has grown with an approximate CAGR of 56% in 2007-08 to 2012-13. The size of the online retail industry is very humble as compared to the overall retail (organized as well as unorganized) industry in the country. This point towards the enormous potential this industry holds. Fierce competition in the retail sector has compelled many retailers to go online, even if it resulted in reduced profits. Segments having standard product specifications and low differentiation are most affected by online retail.
According to an article published by Mint, 2016, a study by consulting firm Kantar TNS found that about 47% of Indian consumers having basic Internet facilities feel constantly followed by online advertisers. The study was conducted in 57 countries among 70,000 respondents between June and September. Indians are one of the biggest fans of social media, yet 21% of them ignore social posts or contents from
Assessment of Impact of Quality of Internet in India and its Impact on Users October 2017
E-34, East of Kailash, New Delhi – 110065, India
URL: www.consumer-voice.org Page 48
brands. Social trust has risen among Indian consumers, with the greater involvement on social media. 53% of the online customers (aged between 16 and 24 years), trust what their social circle says about the brands on the Internet, rather than official sources such as newspapers, TV advertisements or brand website. The rising ‗social trust‘ in India is one of the highest seen globally. Millennials are trusting bloggers and peers more than the information provided by brands. Rise of picture sharing apps such as Instagram and Snapchat, has provided brands with new channels to engage customers more deeply. Experts are seeing the future of digital advertising through advertisement funded content, which implies integrating brands within the online content such as web series, games etc. According to a report titled ‗The Future: now streaming‘ by consulting firm KPMG and lobby group FICCI, digital advertising is expected to touch Rs.25,500 crore by 2020 from Rs.6010 in 2015, with a shift towards video and mobile advertising on the back of increase in mobile users and improved digital infrastructure.
Toh, 2012 conducted a study about the travel planning. The study was done to examine how travelers search and then book airline tickets, what are the dominating distribution channels and what percentage of online searches convert to actual bookings on the same website. Currently most of the online ticket purchasing is done via third party websites such as Expedia, Priceline and Google. Convenience of buying intangible goods online and expectation for better products and quality, contribute to the increased popularity of online airline tickets buying. 82% respondents had used Internet to either search for or book their flight tickets. Third party websites (TPW) are the most popular websites for airline searches and ticket booking, followed by airline websites. Various channels used for searching about flights- Internet (83%), Travel agent and corporate travel planner (14%), telephone (3%), and walk in counter (less than 1%). The study also indicated that there were a lot of ‗search and switch‘ activities. 88% respondents admitted to having searched on various websites while they finally booked on some other website. Finding lower fare, conveniences, registered on website, avoiding fees, were found to be the main reasons behind switching. But 95% of those who had searched on the net also booked tickets on the net. Those who used the Internet for travel search or booking flight tickets, out of them, 80% identified themselves as pleasure travelers and the rest 20% were business travelers. Also, pleasure travelers are more likely to use Internet as compared to business travelers. Women are more likely to search for better prices and deals online as compared to men. Pleasure travelers are more fare-sensitive as compared to business travelers.
Websites Shopping: Ganpathy, 2001 reported key dimensions of B2C websites. There has been a phenomenal growth in the number of organizations using Internet for marketing, promoting, and transacting products and services because of growth in B2C e-commerce. Firms and consumers have started using Internet to gather information and for online shopping. Georgia Institute of Technology conducted a study to gauge the primary use of Internet by the consumers. The study reported that 40% of the respondents used web for shopping primarily. The usefulness of a B2C site not only depends upon the content and design but also the navigation tools. There has been much technical advancement in Internet security including cryptography, digital signatures, and certificates and authentication. Despite these advancements, consumers are apprehensive about online shopping. An effective B2C site provides quick access to information about product and services, information about the organization (the seller) and contact information.
Assessment of Impact of Quality of Internet in India and its Impact on Users October 2017
E-34, East of Kailash, New Delhi – 110065, India
URL: www.consumer-voice.org Page 49
Lin, 2010 studied website attributes which increase customer purchase intention and makes them revisit the website in Taiwan. The study revealed most prominent attributes that customers look for while visiting a website. These are usability, delivery, security, trust and convenience. Research suggests that trust helps in developing strong relationships with customers, such as a strong IT infrastructure is imperative in making customers believe that their personal details are secure and this helps in reducing perceived risk.
Niebel, 2016 examined the firm-level evidence on the productivity effects of mobile Internet use. Recent Internet growth is propelled by wireless Internet connections. Mobile Internet has improved information and communications flow which resulted in reduced costs. Employees at an organization can access necessary information within seconds, anywhere & anytime. This promotes decentralization and simplifies decision making process. Use of communication technologies increases work satisfaction, but also lead to work-life imbalance.
Quality of E-Tail Experience: Hans H. Bauer, 2006 presented the need to integrate the serviceable and hedonic motives into one measurable scale so that the quality of e-service can be revealed explicitly. A substantial number of customers experience problems while shopping online such as lost orders, service breakdowns, or inadequate handling of complaints. All these problems make the maintenance of the quality of e-service challenging. There are two dimensions of online services-Functional and Technical.According to the results of eTransQual, hedonic quality aspects emerge from intrinsic shopping motives. This implies that shopping behavior is not only influenced by goal-orientation and rationalism but emotional motives as well. Research has shown that the hedonic qualities are more of a ―dissatisfaction inhibitor‖ rather than ―satisfier‖.
The level of customer satisfaction with the quality of E-Tail experience and what makes a customer shop online has been studied by Wolfinbarger, 2016. It also suggested various factors that predict customer judgment of quality & experience. Online shopping experience is different from offline shopping experience. There are many factors affecting online purchasing behavior of consumer such as attitude towards technology, skills & experiences, people having greater internal control, knowledge of Internet, willingness to adopt new technology or those who spend much of their time online, are more likely to shop online. Furthermore, those who are time starved, have higher disposable income, convenience and are career oriented are more likely to shop online. Other factors also influence the decision of shopping online or offline, such as type of product, customer mood and goal behind shopping (experiential/ socializing/ actual need). It is also found that website design, reliability and security/privacy serve as the basis of judgment for the quality of an online site. Research suggests that as more and more information and technological tools are available to customers, their preferences and experiences are likely to change.
D. Travelling Displacement Hausmann, 2016 explained the need for business travel and identified that in the times of Internet, the need for business travel may get eliminated. Internet allows business and people to call, email, see and talk to counterparties without travelling to distant locations. Most of the business travel relates to management of foreign subsidiaries. The brain needs to move and not the bytes, primarily because (1). Brain has a capacity to absorb information, identify patterns and solve problems without us being aware of how it does it. It lets us understand facial expressions, body language, intonation and other subtle indicators that are gathered unconsciously and results in better evaluation. (2). Brain is designed to work
Assessment of Impact of Quality of Internet in India and its Impact on Users October 2017
E-34, East of Kailash, New Delhi – 110065, India
URL: www.consumer-voice.org Page 50
in parallel with other brains. Thus, it is noted that the amount of travel is related to the amount of know-how that needs to be moved around. Thus, it is suggested that firms must try to move brains for key tasks and not just for relevant information to the brains.
A paper was reviewed which was about the impact that the use of Internet carries for Trip-making behavior of individuals. (Hemrick, 2004) The study was done through a web survey and explores whether the use of e-mail and the Internet has led to more or less trips and more or less driving during rush hour and overall. Snowball sampling method was used to determine the sample and about 118 responses were received from a 31-question survey that was administered online. The respondents were found to be active users of e-mail and Internet, having ready access to them. E-mail was used to build or at least maintain social capital. The Internet is mainly used as an information resource. E-commerce is also a major use, especially when making purchases, downloading software, financial transactions, placing product service requests, and downloading music are considered together. The respondents were active drivers too, with most of them driving more than 100 miles per week. The results suggested that e-mail and the Internet use lead to trip substitution as many respondents indicated that they used information technology instead of making trips to work, bookstores, other stores, and libraries. Information technology was also frequently used instead of making trips to clothing stores, music stores, friends‘ houses, government offices, and special interest organizations. This resulted in about 18% lesser trips. Internet is used to gather information to prompt trips to bookstores, other stores, government offices, movies, libraries, and other stores. This survey supported the conclusion that overall, use of information technology by this group of respondents, led to less driving rather than more. The study suggested that information technology has a very high potential to reduce traffic both during rush hour and overall if large segments of the population come to use e-mail and the Internet. Age was considered an important variable to describe the reduction in number of trips, probably because of immobility that comes with it. Similarly, people with less education had more time to spend on e-mail and the Internet, so they could take more advantage of the technology. The paper concluded that a fair amount of trip substitution related to work, e-commerce, participation in volunteer organizations, and dealing with government was happening. Information technology has led to more trips in some cases, related to work, e-commerce, volunteer work, and socializing. Overall, trip reduction was greater than trip generation.
E. Digitalization of Financial Services a) Digitalization of Banks Juan Antonio Bahillo, 2016 assessed the digitalization of banks. It reported that digital transformation of banking services has brought greater transparency in financial services. Digitalization of banks requires various steps such as retail credit processes, digital approaches like mobile application and automation of credit decision. Customers are benefited from higher speed, increase in efficiency and simplicity in banking system. Risk modeling has become possible with digitalization because increased use of digit banking services by customers generate more data. New competitors can operate at much lower costs with improvements in the traditional banking operations, branch network and legacy IT system. Machine learning techniques in banks has improved the predictability of credit early-warning system. Digitalization of banking operation has resulted in ease in its system. It has reduced hours of paperwork and increased client interaction by 5 times while cutting administration and preparation by half.
Assessment of Impact of Quality of Internet in India and its Impact on Users October 2017
E-34, East of Kailash, New Delhi – 110065, India
URL: www.consumer-voice.org Page 51
Automated monitoring of customers and optimized restructuring solution has led to minimization of losses. Consumers benefit from faster approvals to credit decision by banks. Application of advanced-analytics techniques has led to reduction of credit risk costs.
b) Use of Credit Cards Hem C. Basnet, 2016 studied the impact of the Internet on consumer spending and in carrying a credit card balance. Digitalization has played an important part in changing consumer behavior toward credit card debt. Digitalization has increased the usage of credit card for online shopping. Online shopping has become easier and faster because these cards are easy to carry and readily substitute the traditional payment system such as cheques and cash. Consumer attitudes towards credit card are influenced by many economic and demographic factors such as their income, race, age, education and gender. The introduction of credit cards has changed the traditional pattern of consumption smoothing and debt repayment as spending through credit card is not as painful as spending the cash.
c) Unified Payment Interface (UPI) According to Sunday Guardian (2016) UPI is a payment system that promises seamless money transaction between Bank A and Bank B without asking for card detail, IFSC code, or net banking passwords. UPI could not gain much popularity as the mobile wallet companies like ItzCash and Paytm could, because there was a lack of awareness among people. Users can avail the services of UPI if they are registered on the app. The user can directly pay to merchants or service providers by simply entering the virtual address of the beneficiary, provided the latter is registered on UPI as well. UPI users can transfer up to Rs 1 lakh as initial transfer, which might be increased depending on the learning from pilot phase. Many banks have started UPI app for customers. The app helps hassle free money collection. Money can be directly transferred from one user to another user account. Virtual pay address of user works as P.O. box. It is as simple as sending message through WhatsApp. Though UPI is low on popularity during 2016 but industry sentiments are running high and many have put their bets on it. (Tiwari, 2016)
d) Heading Towards Cashless Society According to an article in The Indian Express, 2016, the government is preparing a platform for realizing a cashless society by developing a common mobile phone app that can be used by shopkeepers and merchants for receiving Aadhaar enabled payments, bypassing credit and debit cards, PIN and password. The mobile application will be used for authenticating biometrics of customers making Aadhaar-enabled payment. The program will help the government undertake situations like recent demonetization and control black money threat while bringing in more financial transaction transparency. People can link their Aadhaar (12-digit number) with their bank accounts and use Aadhaar Enabled Payment System (AEPS) for money transfer, balance enquiry, cash deposits or withdrawals and inter-bank transactions. The funds can be directly transferred from the customer‘s bank accounts to the merchant‘s. There is a need to create awareness among people about this mode of transactions. (Express, 2016)
6. LEISURE/RECREATIONAL A. Travel and Leisure
Assessment of Impact of Quality of Internet in India and its Impact on Users October 2017
E-34, East of Kailash, New Delhi – 110065, India
URL: www.consumer-voice.org Page 52
a) Impact on Travel and Tourism With the commercialization of the Internet, the nature of society has changed in many ways. In recent years, the economic power of Internet has grown and further reconfigured the world we live in. Today, Internet can be seen as a platform that assists in continuous technological innovations, encourages new business practices and changes the competitive landscape of various industry sectors. With technological innovations, Internet has changed from ‗publishing-browsing-platform‘ to a ‗participation-interaction-platform‘. It has enabled new business models and fostered changes in social life (Xiang, Wang, O‘Leary, &Fesenmaier, 2015).
Internet provided the foundation for the expansion of new systems linking consumers and Computer Reservation System and Global Distribution System (CRSs/GDSs), which certainly, lowered the entry barriers to new players. Thus in late 1990s, a series of online travel agencies like Expedia, PreviewTravel, Priceline, and TravelBids began to offer direct access to the travel products. The innovations in the travel and hospitality sector have been widely accepted by consumers (Xiang, Wang, O‘Leary, &Fesenmaier, 2015). Previous researchers have clearly identified Internet as a platform that cannot be overlooked or ignored by tourism organizations while forming their marketing mixes owing to its advantages such as global accessibility, convenience in updating, real time information service, interactive communication features and unique customization capabilities. Internet is successful in swift identification of customer needs and establishment of direct contact with consumers, offering them comprehensive, personalized and up-to-date information. Tourism suppliers can remotely control their servers to display information on products/services at an electronic speed. As far as the travelers are concerned, Internet allows them to communicate directly with tourism suppliers to seek information. It also empowers them to develop and purchase their own itineraries anytime and anywhere (Castaneda, Frias, & Rodriguez, 2007).
Travel related social media now significantly influences travel information search and sharing behavior and certainly mediates the way travelers perceive and interact with travel products and tourism destinations (Xiang, Wang, O‘Leary, &Fesenmaier, 2015). Social media related to travel influences information search. Xiang, Wang, O‘Leary, &Fesenmaier, 2015 found some interesting trends. Ownership of the desktop computer was in decline, whereas that of the tablet computer and GPS was in sharp rise. This indicates that people are moving away from their desktop computers and accessing the Internet via various devices such as mobile. Also, popularity of some other travel information sources such as automotive clubs and travel guide books are declining, whereas other such travel sources like travel companies, magazines/ newspaper, TV, radio, and movies are increasing. People were found to be extremely satisfied with using the Internet for trip planning. Some people were, however, not interested in using online travel sites due to the security, personalization and trust issues.
Castaneda, Frias, & Rodriguez, 2007, examined the relationship between satisfaction with the information obtained through Internet and the satisfaction with the selected destination. It was found that this relationship is positive and significant and is dependent on tourist‘s previous experiences of the destination and Internet. An individual‘s ability to use the information source is also an important factor that determines the extent of Internet satisfaction on destination satisfaction. The author concluded that Internet and tourism sector enjoy good coordination due to convenience provided by increased use of communication and sales channels. The information available on the Internet is of considerable value to
Assessment of Impact of Quality of Internet in India and its Impact on Users October 2017
E-34, East of Kailash, New Delhi – 110065, India
URL: www.consumer-voice.org Page 53
tourists as they can use it to customize their travel plans to suit it to their needs and thus it contributes to destination satisfaction. It is also observed that Internet can complement traditionally used information sources such as travel agencies.
According to the findings presented in Xiang, Wang, O‘Leary, &Fesenmaier, 2015, the use of Internet to book a hotel, purchase air tickets and to purchase other products such as park tickets, travel packages etc has increased. (Gadgets now: Tech news, 2016), highlighted the fact that it is not high roaming bills that Indian travelers fear, but, it is the lack of Internet connectivity that worries them. People wish to stay connected to the Internet in order to share updates when on the move. About a third of Indian travelers use mobile data for social media posts and to seek information about the places they are planning to visit. Also, about 15% people use mobile data to stay connected with their family and use GPS while travelling. It also marked what people are ready to forego to get lag-free Internet connection on their vacation- be hungry for a day, not take shower, sacrifice drinking for a night and not using a restroom for few hours.
b) Leisure Activities Zach &Lissitsa, 2016, examined in their study, how Internet access, digital use and time spent online correlate with the odds of engaging in strenuous, moderate and muscle-strengthening physical activity. The background of the study was that computers and Internet have become an integral part of leisure time as an increasing number of people use it for engaging in diverse activities. Some previous studies have reported both the advantages and disadvantages of Internet use. Internet provides almost unlimited opportunities as an essential resource of information on education, business, shopping, travelling and health care issues. It also offers its users great opportunities and resources for promoting their careers, work, education and social status and enhancing income and social mobility, all of which correlate positively with individual well-being. Balanced use of Internet to access online news, online forums and online counseling can help promote self-efficacy, psychological empowerment, lifelong learning and a higher quality of life. However, on the negative side, higher Internet use causes neglect of important aspects of life, leading to detrimental effects such as academic problems, dysfunctional personal relationships, financial difficulties, work-related problems and physical risk factors such as sleep deprivation and lack of exercise. Internet activities are done in isolation and thus lead to displacement of interactive social activities. Internet users can feel socially isolated, decline in mood and low life satisfaction. Compulsive Internet Use (CIU) can also lead to various addictions such as addiction to gambling, gaming and pornography.
Internet use can be classified into capital-enhancing and recreational. Capital-enhancing uses of Internet offer more advantages and opportunities for advancing careers, work, education and social status than that of recreational uses. Recreational activities include those done for entertainment, i.e., browsing for fun, playing games, messaging, downloading music or gambling online.
Zach & Lissitsa, 2016, claim that people with intentions to be physically active and those who have access to sport facilities, acquire a variety of digital uses that assists them in implementing their intentions and attain patterns of behavior that include physical activity. People may use Internet to seek information about aspects of physical activity such as type, level, duration and intensity of various exercise plans. On social media, they can share knowledge in discussion groups and give and receive feedback on various physical activities. The findings of this study presented that the odds of engaging in versus not engaging in strenuous type of physical activity, were higher among Internet users as compared to non-users. Similar
Assessment of Impact of Quality of Internet in India and its Impact on Users October 2017
E-34, East of Kailash, New Delhi – 110065, India
URL: www.consumer-voice.org Page 54
was the case for physical exercise to strengthen muscles and moderate type of physical exercise. It was noticeably higher for people who used Internet for studying, social media, seeking information and downloading, as it enables them to access information that might help them developing specific plans for physical activity tailored to their needs, perceptions, and abilities. The author finally concludes that Internet users are more likely to engage in physical activities contrary to the claim that Internet users may neglect an area of importance in their lives that leads to detrimental effects such as physical risk factors.
B. Games and Gambling a) Internet and Gaming Internet provides tremendous educational benefits to children and adolescents, such as more information access, better visual intelligence skills, and enhancement of teacher-student communication. But it has some serious implications too. A time has come when parents are literally forcing their children to go outside and do some physical activity because outdoor games have now been replaced by mobile phones and online gaming. A study done in China (Jiang, 2014), examined the interrelationship between Internet connectedness, online gaming, Internet addiction symptoms and academic performance decrement among the Internet dependent young people in China. In China, Internet addiction has been identified to be a growing problem among young people, who account for about 60% of Internet users, of which 14% are adolescents, equally spread in rural and urban areas. It is an alarming situation because excessive Internet use can be pathological and addictive, and is treated like an Internet addiction disorder having various symptoms that include substance based addictions, such as tolerance, withdrawal, preoccupation, numerous unsuccessful attempts to cut down use of the Internet, and feeling restless without Internet. It was also observed that the amount of time spent using Internet causes higher distraction from academic tasks and deficiency in self-regulation. The paper apprises that ―it is not Internet that is addictive; it is rather the highly interactive features that come with specific applications that keep people stick to them‖. In particular, online games and other entertainment applications with immersive or interactive features lead to development of pathological Internet use and pose a great threat to the well being of users. It has also been observed that inclination towards online gaming is higher in men as compared to women. Social status as the occupational variable was found to be significantly associated with Internet addiction and academic performance.
In spite of all these disadvantages, online gaming has been widely recognized as a popular leisure activity and has become a part of daily life of young people in China.
b) Internet and Gambling Gambling in India is heavily restricted except for selective categories including lotteries and horse racing. The critics of gambling claim that it leads to crime, corruption and money laundering while those in favor of a regulated gambling system in India argue that it can be a huge source of revenue for the state (Wikipedia). Whatever may be its harmful implications, gambling has seen a tremendous growth with the advent of ICT. According to Griffiths & Parke, technology plays an important role in development of gambling practices and provides new opportunities.
The fast technological developments in Internet are increasing the global potential of gambling. The paper accepts that Internet gambling is set to multiply in times to come, primarily because of its easy access and participation. Sophisticated gaming soft-wares, integrated e-cash systems that include multi-currencies,
Assessment of Impact of Quality of Internet in India and its Impact on Users October 2017
E-34, East of Kailash, New Delhi – 110065, India
URL: www.consumer-voice.org Page 55
multilingual websites, increased realism through webcams, live betting mechanisms and improved customer care solutions, all can be attributed to the increased popularity of Internet gambling. Internet gambling is global, accessible and has 24-hour availability. It offers convenience gambling. The initial set-up costs are also minimal in comparison to a casino.
Easy access to Internet gambling has major social implications. It does not provide for gate-keeping of vulnerable set of people that include adolescents, problem gamblers, drug/alcohol abusers, the learning impaired, etc. it can extend its claws to workplaces as well, impacting work efficiency and employee productivity. Unscrupulous operators indulge in embedding (pop-ups related to gambling websites), circle jerks (never ending loop of similar websites) and online customer tracking (collecting customer data) to lure Internet users into Internet gambling.
There are some differences between traditional gamblers and Internet gamblers as pointed in the study. First, Internet gamblers stop gambling when they run out of money they had set aside for this purpose. But traditional gamblers continue gambling even if they have to borrow money to satiate their thirst for it. Second, traditional gamblers enjoyed gambling as a means of escape but, Internet gamblers find the real gambling environment at their home satisfying enough. Third, Internet gambling is highly competitive and more exciting as compared to traditional gambling because of the introduction of person-to-person gambling. Fourth, Internet gambling satisfies the psychological need of self-esteem. Fifth, physiological effects are more prominent in traditional gamblers as against Internet gamblers.
There is not enough support for the argument that Internet gambling can be doubly addictive, majorly because Internet and gambling alone are addictive too. But it also cannot be denied that Internet has made gambling more convenient, anonymous and enjoyable and caters to the psychological needs of users.
C. Internet and Pornography Owens, Behun, Manning, & Reid, 2012 has studied the impact of pornography on adolescents (aged 13-18 years), to which today‘s youth has easy access, thanks to such a rapid proliferation of Internet. Pornography has become mainstream over the last two decades. Internet has provided easy access to sexually explicit material to the people of all ages. But its popularity has been growing among adolescents like never before. This easy access comes at the cost of risks of Internet addiction, cyber bullying, sexual victimization or harassment. Internet has also increased the frequency of such incidents where adolescents are exposed to obscene material. A small, but growing body of research indicates that adolescents are increasingly struggling with Compulsive Internet Use (CIU) and compulsive behaviors resulting from Internet pornography and cybersex. Research suggests that there is a link between adolescents exposed to Internet pornography and their sexual beliefs. Pornography can change viewer‘s perceptions about sex which may differ from those instilled by their families and schools. This may lead to dissonance and conflict in sexual beliefs and is attributed to increased sexual uncertainty. A Dutch research has been mentioned in the paper. It found that increased exposure to sexually explicit material aided through the wide reach of Internet, raises the likelihood of women being viewed as sex objects. According to Owens, Behun, Manning, & Reid, 2012, adolescents use Internet frequently because it gives them a sense of acceptance and approval from others. Sexually Reactive Children and Adolescents (SRCA), who are frequently exposed to sexually explicit material, are more likely to engage in ―coerced vaginal penetration and forced sexual acts such as oral or digital penetration, to express sexually aggressive remarks (obscenities), and to engage in sex with animals.‖ Also, higher the exposure to sexually explicit material,
Assessment of Impact of Quality of Internet in India and its Impact on Users October 2017
E-34, East of Kailash, New Delhi – 110065, India
URL: www.consumer-voice.org Page 56
lower will be the degree of social integration. It also negatively affects their self control and decision making abilities. Manning, 2006, found that children and adolescents who themselves are not involved in Internet pornography but live amongst people who consume it frequently are also at high risk of consuming such content and indulging in problematic sexual behavior in future.
According to Manning, 2006, industry and governments are also at fault by making it easy to access such content by any age group, due to lack of proper rules and regulations. The pornography industry does not consider the age of viewers, before presenting their content. Approximately 75% of pornographic websites display visual teasers on their homepages before asking if viewers are of legal age. Only 3% of pornographic websites require proof of age before granting access to sexually explicit material and two-thirds of pornographic websites do not include adult content warnings. But there are some arguments against restricting the access to Internet pornography asserting that many adolescents also look for information on sexual precautions, STDs and other health related issues. This may actually assist in their sexual development and understanding.
Manning, 2006, acknowledges the impact of Internet on sex industry and its resultant impacts on the married couples and families. Internet has undoubtedly benefitted sex education and sexual health of the society by providing greater, easy and timely access to information. But it has also given birth to social atrocities such as sex addictions, sex trafficking, sex crimes and distribution of sexually explicit materials by unfair means to the innocent audiences. Manning, 2006, has compiled the results of various other studies on the same topic to study the systematic rather than the individual impacts of Internet pornography. Internet pornography can be categorized as an altogether different genre of pornography due to the effects of ―Accessibility, Affordability and Anonymity. This effect is cited as the primary reason for problematic pornographic consumption. The six Is- Intoxicating, Isolating, Integral, Inexpensive, Imposing and Interactive are the characteristics of the Internet which make it a unique & powerful medium to access pornography. Many researchers in this field are of the view that consumption of pornographic content has become gender-neutral. A meta-analysis conducted in 1995, suggested that pornographic material showing sexual violence has the strongest correlation with aggressive behavior. Although the Internet pornography is often consumed by an individual in a solitary & secretive manner, but its bad impacts might spread to the entire family, friends or even social and corporate circles. Another study conducted in the year 2000, found that Internet pornography addiction was one of the most significant reasons contributing to separation and divorce among affected couples. Some other research works have revealed that pornography is responsible for causing sexual dissatisfaction among viewers. Also those who turned to online sexual activities to deal with stress, were more likely to have sexual and relationship problems in their real life. It was also found that online sexual activities increase emotional distance among partners and can badly damage a healthy relationship. Different studies have found that both men and women, view online sexual activity as a form of infidelity and it can be as influential as the real life infidelity actions.
RailTel, a public sector undertaking, provides free Wi-Fi Internet services at railway stations in India in collaboration with Google. As of 2016, 23 railway stations in India have access to free Wi-Fi and the ministry of railways wants to scale it to 400 stations in next three years. Surprisingly, this free access to Wi-Fi is not being used for information access. It is rather being used for entertainment purposes and to watch and download porn clips. The reports from the stations regarding the sites that were being accessed
Assessment of Impact of Quality of Internet in India and its Impact on Users October 2017
E-34, East of Kailash, New Delhi – 110065, India
URL: www.consumer-voice.org Page 57
revealed that porn sites were the most watched/ most visited sites followed by YouTube and Wikipedia. Patna station ranked first in terms of using the free Wi-Fi service, followed by Jaipur, Bengaluru and Delhi (Sputnik International, 2016).
7. UMBRELLA ISSUES A. Impact on Everyday Life A study examined the impact of high-speed Internet on the user behavior in Korea. (Sung, 2003) The consumer behavior towards Internet usage has changed with rapidly advancing Internet network technologies. The impact of high-speed Internet on consumer behavior was measured in terms of purchasing over the Internet, Internet services, information exchange and chatting, online problems and user satisfaction. The Internet is affecting socioeconomic activities and cultural aspects of organization and individuals. Younger generation use Internet for leisure activities, for e-shopping, e-auctions and fulfill to other personal needs. E-commerce has been on a constant growth due to many factors e.g. convenience, saving time, cheap prices, easy comparison and vendor information availability. The older group with higher purchasing power and income were the actual online buyers. Internet provides a variety of services to its consumers such as e-mail, address book and online tax filing. Internet users can exchange any information, documents and communicate via e-mail. Users can obtain any information with the help of search engines provided Internet portal sites like Yahoo!, AOL. The traditional mass media e.g. television, radio, newspaper and magazines have been replaced by Internet radio, online television, e- magazine and are on the rise among users. The study found that the current transition of network has no influence on those who are willing to participate in commercial activities on Internet via e-shopping and e-auction. Network development is not a cause of any problem.
Another study highlights the advantages of Internet and how it brings about essential benefits that improve the quality of life. It was found that people are of the opinion that the use of e-services is improving their lives. Four major dimensions that were in the framework of e-life indicators were e-daily life, e-business, e-government and e-infrastructure. Internet has a significant influence on the quality of life, including social, leisure, economic, and community well being. The Internet also offers individuals a medium through which it is possible to communicate with the world around them. E-mail is also found to facilitate social contact. Online chats/discussions have a positive impact in some cohorts. Internet and e-mail are excellent sources of support and enjoyment, resulting in improved quality of life for older homebound adults. But, Internet use leads to family alienation in adolescents. The correlation coefficients of e-service Cognition and Usage with that quality of life revealed that Usage of e-services has a strong and positive correlation with the quality of life than that of Cognition of e-services. The paper concluded that people can experience high overall quality of life when they have higher degree of cognition and deeper degree of usage. Merely hearing or knowing of availability or presence of e-services does not promote the quality of life. But, their usage can bring more happiness to someone‘s life. (Liang, 2010)
Blas, 2006 analyzed the key drivers of Internet dependency and its impact on willingness to purchase online. Internet has become a useful communication source. It is very beneficial for businesses and consumers. Internet has been growing fast with increasing penetration rate. Internet users are not an identical behavioral group of people. The study found Internet dependent users as the young Internet
Assessment of Impact of Quality of Internet in India and its Impact on Users October 2017
E-34, East of Kailash, New Delhi – 110065, India
URL: www.consumer-voice.org Page 58
users, with high educational level and who feels affinity with the medium. Greater exposure to the medium is the main cause of media dependency. It has been found that some behavioral effects such as the purchase of products and services can be increased when dependency level with a medium is mainly high. Consumer needs and interests change with age, with younger individuals being more favorable to Internet. Furthermore, lack of acquaintance with the medium, prevents adult consumers from assessing the benefits of Internet and they tend to prefer other information sources for their purchases such as television, press or social interaction with friends and relatives. Persons who have used Internet the greatest are more dependent than those who are less well-known with the medium. Thus, greater online experience leads to better relations with the medium, as the individual is more familiar with it and values its benefits more.
Groselj, 2014 examined the dimensions of Internet use based on a representative sample of the population of the UK, making important contributions. The study used principle components analysis to identify 10 distinctive types of Internet activities out of 48 activities ranging from email to online banking to gambling to selling products. The paper described three dimensions i.e. amount of use, variety of use and types of use along with Internet use. Amount of use (first dimension) is a continuous variable measuring the frequency of Internet use in day-to-day life-some people use it for many hours each day, others only once a week. The amount of Internet use (second dimension) is an interval variable measuring the number of different activities undertake online. Type of Internet use (third dimension) is a series of nominal variables describing different activities (sending emails to investing in stock to making travel reservations to gambling) people engage in online. The common Internet users are doing 25 different activities that are surprisingly large in number. The paper briefly explained the relationship between type, amount, and variety of uses, but much more can be done. As the Internet develops, it is likely that the common activities on the Internet could become one way to measure changes in the Internet. The results of the present study have implications for digital divide research.
Tracey, 2001 studied the impact of the Internet on the everyday lives of U.K. citizens through the integration of quantitative longitudinal time-use data and qualitative interviews. The study analyzed the causal relationships between their acquisition and use of new information and communications technologies (ICTs) and changes in their behavior and their social, symbolic and economic capital. The pattern of Internet usage is not similar in the different age groups. The youngest group spent less time using e-mail than the Web; in fact, they spent less time using e-mail than the 25- to 34-year-old and 55-year-old and older groups. But, this pattern is almost exactly reversed in the oldest group (aged 55 years and older), who used e-mail more than the Web. Different kinds of people make differing uses of the range of applications and services that the Internet supports and probably for differing reasons. The impact of the Internet on everyday life in the United Kingdom in not identical. The variety of activities that were being displaced comprise reading newspapers, magazines, and books, writing letters, typing on the typewriter, watching television and playing computer games. Work-related changes such as shifting from home-based to office-based work or the reverse in the case of new teleworkers or new self-employment appear to affect access to and the style of Internet usage
B. Gender Inequality B. Paige Miller, 2006 examined the impact of the Internet on the research careers of female scientists in three developing areas- Ghana, Kenya and Kerela, India. The premise of the research is that gender
Assessment of Impact of Quality of Internet in India and its Impact on Users October 2017
E-34, East of Kailash, New Delhi – 110065, India
URL: www.consumer-voice.org Page 59
inequality is related to differences in human and social capital and women are less likely to acquire advanced degrees and more likely to experience educational and organizational localism. The diffusion of the Internet to developing world has the potential to alleviate the difficulties many researchers experience. New ICTs enable users to access a wide variety of information quickly and relatively cheaply, as well as develop and maintain contacts with other professionals.. The study was conducted in three developing countries namely – Ghana, Kenya and India. They were chosen to represent varying levels of socioeconomic and technological developments. Face-to-face interviews were conducted with academics and scientists employed in international research centers and universities, employed in broad range of science and engineering fields. Five key dimensions of research careers were studied- human capital, localism, access to resources, social capital and productivity. The paper suggested that the differences between educational attainment and gender were statistically insignificant. And the gender gap was observed to be declining during the test period with women displaying increasing educational and organizational localism. It was noticed that the time spent in a foreign country hugely differed between the two genders. Information and communication technology has provided new means for the development of social capital as more people have gained access to it and this can be done without generating any disadvantages for women, as both of them get equal access and advantage due to Internet. Women scientists continue to exhibit localism not only in their educational and organizational environments, but also in their pattern of social relationships, which has profound impact on their productivity. The paper concluded that the widespread diffusion of Internet throughout the scientific communities of the developing world is a development that has great potential for changing the status of women. This is because; access to ICT does not differ in its advantages for men and women. The increased access to ICT diminishes the necessity for travel, as it makes scientists capable of interacting with each other at distance. There is a widespread expectation that diffusion of Internet will eventually yield career gains for women, enabling them to circumvent restrictions on their mobility
According to Forum, 2016, 95% of all jobs today have a digital component. Millions of women still lag behind in the ownership of digital devices. Globally, 202 million (14%) women lag behind men in ownership of digital devices. South Asia has the highest percentage of this digital gender gap, with approximately 38% (140 million) women deprived of technology.
C. Privacy A news article by Gadgets360 boldly underlined the fact that free public wifi has undoubtedly become a pre-requisite for our generation. It is the first thing that people look for anywhere they go. But, it is important for us to know that it carries certain risks that may cost us a lot. Lastly, it also suggested some ways to deal with these dangers and how we can safeguard ourselves from unwelcome surprises. Millennials seem to be the most vulnerable to attacks as most of their work, business, and socialising is done online. Many Indians would be devastated if their personal financial information was compromised and if there‘s a credit card fraud done to them. Hackers & cyber criminals regularly run diet and fitness related promotional links, because many Indian citizens click onto them in order to achieve their dream bodies and end up sharing information like email address, full name or age. various forms of attacks are-Man-in-the-middle attack, Sidejacking, Rouge Networks and Malware. The biggest problem with public networks is the lack of authentication. There isn't any password required to join as you would normally have at home or in private networks. This means anyone can join the network and start tapping into your
Assessment of Impact of Quality of Internet in India and its Impact on Users October 2017
E-34, East of Kailash, New Delhi – 110065, India
URL: www.consumer-voice.org Page 60
information very easily. The article concluded that there are no absolute guaranties even when precautions are in place. Thus one must stay vigilant and restrict the types of activities that are conducted on free wifi to safeguard their privacy. This is one of the side-effects of living in a heavily interconnected world. (Cerejo, 2016)
The article is based on the proposed broadband privacy regulations in USA. (Pociask, 2016) Federal Communication Commission (FCC) chairman proposed a controversial rule, expanding commission‘s jurisdiction over privacy practices of Internet service providers. From Amazon and Ebsy to WhatsApp and Pokémon Go, the Internet is rampant with tracking cookies, ID markers, data aggregators and malvertisers. Further, studies indicate that mobile apps and device manufacturers are the ones who most frequently share customer data with third-parties as a way to increase profits.
D. Internet and Law Forcht, 1998 analyzed the role of legal measures and regulations that determine what is acceptable in what is not acceptable in the time, where Internet has started to govern a major portion of our lives. It is of core importance that laws and regulations must be addressed and adapted for the technological arena. E-mails are generally broken into different packets that take different routes to reach their final destination. This is why, there are several points where the packets could be interpreted and examined. Without the presence of ethics and laws, a private e-mail message can become public. Piracy is possible over Internet. It is very easy to duplicate an online application and sent it over the Internet. Thousands of electronic bulletin boards that are present on Internet are used as clearing houses for transferring illegally produced copies of softwares that are copyrighted. The law is not clearly spelled out to determine what is reasonable and what is not. The problem is that it is easy to dispose of computer information. It is easy to send out information that might be incriminating to another location or person via Internet.Since Internet has made it possible for businesses to do business electronically, there is a rising that transactions can be intercepted as easily as e-mail messages. With incredibly large sums of money exchanging hands over the Internet, the potential for doing wrong is ever present. Communicating on Internet is riskier as compared to communicating face-to-face in physical world because no one person is in charge of what happens on the Internet. There is also great deal of concern regarding the accessibility of explicit material by children. However, parents and organizations can block access and censor certain material and use systems that specify maturity levels to allow access to data. The wealth of information available on Internet can be easily viewed, downloaded and passed on to other individuals. The right to use someone else‘s intellectual material should be granted by the owner of that information. They are protected by copyright laws as people who put them up on Internet expect to receive credit for their work. The use of Internet has also facilitated some crimes in physical world occurrences. There is no doubt that crime will increase as technology grows because simpler access and ready availability have made Internet a valuable tool for conventional criminals. It is concluded that Internet is a tremendous resource and is a great place to learn, work and play. It draws its strengths from the diversity of the users because there is no one group or person in charge. But with this continuous growth and change, it is important that it retains the qualities that have made it what it is today. For that, there must be ethics and laws with which people can operate. Problems arise because people that cause these problems do not understand the full implications of their action.
E. Internet and Transportation
Assessment of Impact of Quality of Internet in India and its Impact on Users October 2017
E-34, East of Kailash, New Delhi – 110065, India
URL: www.consumer-voice.org Page 61
The news article by Gadgets360 explained how app-based cab companies Uber and Lyft want to replace public buses in US. The company also said it has helped a dozen transit agencies apply for federal grants that would pay for a portion of Lyft fares in situations where its drivers would effectively become part of the public transportation system. Ride-hailing deals are too small to seem threatening for public transportation. They can affect some routes; it may affect service overall; but it's not going to replace the main lines that carry thousands of riders per day. Pilot programs are run parallel to help riders connect to transit system and reduce the burden of huge costs of public transport by paying 50% of the costs of taxi rides in areas with less commutability. It also helps in connecting remotely located areas that are often connected with less frequent shuttle services. Local government transit agencies are partnering with these rival transit agencies in order to provide better service at much cheaper prices. However, another transport technology startup called Bridj criticises the track records of cooperation of these ride-hailing companies with the local governments. It is rather proposing a model that would leave more control with the governments and has no set lines and instead responds to requests made on its app. Unlike the ride-hailing partnerships, which are largely designed to get people to another form of transit, the Bridj program aims to drop people off where they're actually trying to go. Instead of sharing in fares, Bridj takes a service fee for the use of the technology that accepts ride requests and directs the vehicles on ever-changing route. (Brustein, 2016)
F. Impact of Mobile Internet The study examined the relationship between the monthly number of outgoing mobile voice (MV) minutes and monthly mobile Internet (MI) data traffic in a sample of 11,614 residential postpaid subscribers over 25 months from October 2011 to October 2013 (TorstenJ.Gerpott n, 2016). Longitudinal data is used in this study. The study measured a set of predictor variables, which comprise general and mobile contract-related customer characteristics e.g., gender, age, and current device tenure. There are three varieties of customer-specific characteristics that may clarify diverging trajectories between MV calling and MI use intensity, namely socio-demographic factors, contractual terms and features of the individual‘s handset. An average male MNO subscriber generates fewer MV calling minutes than his female fellow. Older and male subscribers caused less MV call minutes than younger and female individuals. The study found that the age of subscribers is more negatively correlated with MI data volume generated than it is with MV minutes consumed. In contrast, an average older customer uses MV calls significantly more intensely than she uses MI equivalents. The multilevel analysis revealed that the MI–MV usage relationship considerably changes over time and between individuals depending on a customer‘s age, gender, tenure with the MNO, tariff type, device tenure and device type. The number of SMS sent by MNO subscribers significantly moderates their MI–MV association. Subscribers with higher SMS consumption have a tendency to decrease their MV calling minutes in case that they expand their MI usage.
Lia Puspitasari, 2016 analyzed the role mobile phones in narrowing the digital divide among Indonesian people at four levels -device ownership, Internet adoption, use, and information acquisition. Mobile phones can be used as a device for mobile leapfrogging (Mobile leapfrogging refers to the process by which new Internet users access the Internet using mobile phones and not PCs) the digital divide in Indonesia. People access the mobile Internet more for entertainment than for information gathering. The gap between developed and developing countries has reduced due to the use of Internet. The digital divide occurs at the usage and skill levels as well as with the ownership of the devices. Mobile phones are
Assessment of Impact of Quality of Internet in India and its Impact on Users October 2017
E-34, East of Kailash, New Delhi – 110065, India
URL: www.consumer-voice.org Page 62
valuable tools that allow leapfrogging because feature phone handsets are reasonable. Demographic factors are considerably related to the use of the Internet. Educational level is positively and significantly correlated with the adoption of the mobile Internet on smart-phones but not on feature phones. Income is not significantly correlated with the adoption of using the mobile Internet for either feature phones or smart-phones. Age is negatively correlated with the ownership of mobile phones, adoption of mobile Internet, and mobile Internet use, but not for feature phone ownership. Older people are less ready to adopt and use the Internet even if they own mobile phones. The economic factors have a hindering effect on mobile network service consumption by the poor in spite of affordable handsets but it is not an important factor for narrowing higher levels of digital divide.
G. Undiscovered Potential World Payment Report, 2016 reported that the growth in non-cash transactions is below potential in India and even government is not promoting digital payments, whereas global digital payment volumes continue to increase. The transaction volumes grew at 8.9 per cent to reach 387.3 billion in 2014. The highest growth rate - 31.5 per cent - was recorded in Emerging Asia. China and India emerged as leaders in this region. Although the number of non-cash transactions is increasing in India, it is still below full market potential. Moreover, not all banks are promoting digital payments because they are of the view that card acceptance network is too narrow. (Profit, 2016)
The way internet has transformed lives of the people and has made people its slaves; in 2017 one cannot imagine life without internet. Regarded as a powerful general purpose technology, internet quality is as important as internet access, if not more, as internet usage is not limited to email and web browsing. With the interactive media-rich services and more user generated content being uploaded and shared, and with the availability of high quality videos, we cannot talk only about internet penetration
E- GOVERNANCE
Information technology has revolutionized lives. Uses of internet and computers are growing immensely. Internet has enabled quick dissemination of information to the public, making the processes all the more transparent, and efficient. The role of the government is to formulate policies and implement them effectively. This involves communication among and within government departments- upward, downward, horizontal or vertical and with the citizens. Electronic media has immensely eased communication and has improved effectiveness. (Lokhande, 2004) When this electronic technology is used for the delivery of government services and dissemination of information to the citizens, the process is called 'E-GOVERNANCE'. In other words, it is the process of policy formulation and implementation through electronic media by the government and its agencies. It is the essence of democracy to bridge the gap between the government and the citizens, making the administrative system more transparent and effective to address to the needs of the citizens. E-governance services can be broadly classified into four services-
1. Government to Citizens services (G2C) – services like passport, land records, Aadhar registration, driver‘s license, etc.
2. Government to Business services (G2B) – Taxes payment online, E-Customs, paperless trade licenses etc.
Assessment of Impact of Quality of Internet in India and its Impact on Users October 2017
E-34, East of Kailash, New Delhi – 110065, India
URL: www.consumer-voice.org Page 63
3. Government to employees (G2E) – E-Office, payroll, paying tax, and e-learning are some examples of G2E services
4. Government to Government services- These services are typically intra government services, which connect one government department to others. Examples of such services are e-migrate, SSDG etc.
E-Governance is an evolutionary phenomenon. In India, the main thrust for e-Governance was provided by the launching of NICNET in 1987 – the national satellite-based computer network which was followed by the launch of the District Information System of the National Informatics Centre (DISNIC) programme to computerize all district offices in the country for which free hardware and software was offered to the State Governments. In the ensuing years, with ongoing computerization, tele-connectivity and internet connectivity established a large number of e-Governance initiatives, both at the Union and State levels. The formulation of National e-Governance Plan (NeGP) by the Department of Electronics and Information Technology (DEITY) and Department of Administrative Reforms and Public Grievances (DAR&PG) in 2006 has boosted the e-Governance process.
E-governance in India is graduating from pilot E-Governance projects to bigger Mission Mode Projects. E-governance services, thus reckon on the quality of internet service for its stakeholders to reap maximum benefits out of it.
National e-Governance plan (NeGP) aims to ―make all government services accessible to the common man in his locality through common service delivery outlets and ensure efficiency, transparency and reliability of such services at affordable costs to realize the basic needs of a common man‖. (National e-Governance Plan, 2011)
NeGP has a three-tier architecture. Tier 1 includes Common Service Centres (CSCs) which are the front end delivery points for a range of G2C services. These centres provide transparent services at convenient locations, at affordable costs. Tier 2 includes State Wide Area Networks (SWANs) and the State Data Centers (SDCs) , both of which provide common and support infrastructure, to allow information to be shared electronically between different agencies of the government and with citizens. Tier 3 comprises Mission Mode Projects (MMPs) which transform high priority citizen services from their current manual delivery to electronic delivery. MMP is an individual project within the NeGP that focuses on one aspect of electronic governance such as banking, land records, commercial taxes, etc. NeGP comprises 31 MMPs which are classified as Central, State and Integrated projects. They have clearly defined objectives, scopes, and implementation timelines and milestones, as well as measurable outcomes and service levels.
The use of e-governance services is increasing year-by-year. This is substantiated by data from e-Taal, which is a web portal for dissemination of e-transactions1 statistics of National and State level e-Governance projects including Mission Mode Projects.
1 An ‗e-transaction‘ alludes to a transaction delivering public service using ICT tools to improve access, enhance transparency and reduce response time while also satisfying all of the following four conditions: a. Service is requested through electronic means (self-access or assisted access) including mobile devices b. Workflow/approval process is electronic c. Database is electronic/ digitized d. Service delivery is electronic Across the Counter Services
Assessment of Impact of Quality of Internet in India and its Impact on Users October 2017
E-34, East of Kailash, New Delhi – 110065, India
URL: www.consumer-voice.org Page 64
The average transactions per day were 64.7 lakh in 2013. The average transactions grew by about 50% in 2014. In 2015, the growth rate was 114.5% implying that average transactions more than doubled in 2015 as compared to 2014. The growth rate was about 43% in 2016 and 152% in 2017.It is clearly evident that average transactions per day have substantially increased every year. (The average transactions per day for the year 2017 are based on the data till September 22, 2017).
Amongst the Central government projects UIDAI recorded the highest number (53.2%) of e-transactions in 2016. UIDAI comprises of two e-governance services – Aadhaar Authentication service and e-KYC service of which the major proportion was of the former (83.5%).
The second most widely used e-governance services as reflected by e-transactions in the year 2016 was for Agriculture (17.3%).
Service-wise data on e-transactions shows that proportion of e-governance services for rural development (which includes services like Services like Job Card Issued, Job Demanded and Job Provided under MGNREGA) was 14.8%, followed by Agriculture and allied (including services like Agriculture Market Information, Agricultural Advisory Service, Animal Disease Alert, etc.) with proportion of e-transactions being 10.1% and Commercial Tax (6%). The highest proportion was, however, for ‗other services‘ which mainly included Central Government Projects.
In 2016, Caste certificate was the most widely accessed e-governance service, followed by residence certificates, driving licenses, and birth certificates (E-Taal).
In 2016, Uttar Pradesh recorded highest number of e-transactions (187.85 lakhs), followed by Kerala (163.77 lakhs) and Karnataka (114.18 lakhs).
E-Governance and Internet Infrastructure Internet is the backbone of e-governance services. In order to usher e-governance services, National Informatics Center (NIC) has been involved in supporting the government in improving the internet/intranet infrastructure for enhancing the provisioning of e-governance services in the country. (National Informatics Centre)
A country-wide satellite based communication network NICNET provides connectivity to Central Government Ministries/Departments, states/UTs and districts of India. In a number of states, State Wide Area Networks (SWAN) are also being integrated with NICNET. The government approved the scheme for establishing SWAN across the country in March 2005. Under this Scheme, technical and financial assistance are being provided to the States/UTs for establishing SWANs to connect all State/UT Headquarters up to the Block level via District/ sub-Divisional Headquarters, in a vertical hierarchical structure with a minimum bandwidth capacity of 2 Mbps per link. Each of the State / UT can enhance the bandwidth up to 34 Mbps between SHQ and DHQ and upto 8 Mbps between DHQ and BHQ depending upon the utilization.
A large number of services are being offered by various Ministries/ Departments/ Organizations at Central and State Governments. However, the name of a particular service may vary across the states.
Assessment of Impact of Quality of Internet in India and its Impact on Users October 2017
E-34, East of Kailash, New Delhi – 110065, India
URL: www.consumer-voice.org Page 65
To monitor the performance of SWANs, the department has mandated positioning of Third Party Auditors (TPAs) in the states/ UTs. (Ministry of Electronics and Information Technology, Government of India, 2016-2017)
Ministry of Electronics and Information Technology (MeitY) proposed that high speed broadband connectivity would be made available upto all 2.5 lakh Gram Panchayats in the country under BharatNet programme (which is presently being implemented by Department of Telecommunications). Robust connectivity would enable central and state governments to deliver various G2C, G2B, G2G services efficiently, while also enhancing delivery of other social sector services including e-Health, e-Education, e-Agriculture, etc. (Ministry of Electronics and Information Technology, Government of India, 2016-2017)
To develop rural wi-fi network infrastructure and in an attempt to provide means to transform Indian villages into ―smart villages‖, CSC e-Governance Services India Limited has taken an initiative called e-Choupal. (wifi Choupal).
II. QUALITY OF INTERNET SERVICES
QoIS (Quality of Internet Service), according to RF Benchmark, ―specifies the guaranteed level of services quality ordered and received by the mobile network user during the service contract with the operator. As far as telecommunication services are concerned QoIS are defined by three functions: access, information transfer and disconnection, and three criteria: speed, accuracy and reliability. The mobile network operator is obliged to provide services of a specific, guaranteed quality‖.
Until some years ago, broadband gap used to mean how many people have access to internet as against those who do not have access to internet. However, broadband divide is no longer viewed as a penetration divide. It is now becoming more of a quality and capacity divide. When talking about broadband divide, ―the relevant questions should be how good the connection is? How fast it is? And how fast is fast? It is therefore, a divide in the range of services people can access and use. Governments, policy makers and regulators, around the world, have made increasing the internet penetration their main priority.‖ Not underestimating the need for getting connected, which is undoubtedly the essential first step, quality of services cannot be ignored. (Vicente & Gil-de-Bernabé, Assessing the broadband gap: From the penetration divide to the quality divide, 2010)
Since internet has been recognized as the driver of an economy‘s growth, it is important that this dynamic growth is accompanied by competition (demonstrated by consumer choice), efficiency as well as consumer satisfaction. The significance of competition can be explained with the help of an example. Suppose, in an area in Delhi, only one service provider offers its services; no other service provider serves in that area. Despite people knowing that service provider X provides better services, they cannot avail of its services because it is not available in that particular area. They are forced to avail of the services offered by that ‗only‘ service provider available in that area, howsoever poor it may be. This is illustrated by local monopolies in parts of NCR Delhi where only one ISP is available. Healthy competition is thus necessary for the market to function efficiently. This can only be possible if supported by a framework of well-structured regulations and clear roles of stakeholders. Quality of service, thus, becomes an important parameter to gauge the performance of mobile internet services.Quality of service parameters ensure a healthy, competitive and transparent market but for that, it is imperative for the consumers to be aware of
Assessment of Impact of Quality of Internet in India and its Impact on Users October 2017
E-34, East of Kailash, New Delhi – 110065, India
URL: www.consumer-voice.org Page 66
the actual terms of services offered. Since internet access is technical and intangible, it is difficult if not impossible for the consumers to evaluate the QoS by themselves. Also, since consumers lack technical know-how, they may not be able to determine the QoS being delivered as compared to that being advertised by the service providers or the norms set by the regulators. (CUTS, 2016)
TRAI regulates the QoIS and monitors the performance of internet service providers (ISPs) in India. The TRAI contrived standards for mobile internet under the QoS for Wireless Data Services Regulations 2012 in which TRAI laid down stringent quality guidelines for Wireless Data Services that telecom operators have to abide by. The regulations mandate service providers rendering Unified Access Service (UAS) as well as cellular mobile telephone service to submit monthly performance reports to TRAI. The regulator based on these reports, releases quarterly report for all the operators in the 22 service areas in India. However, no penalties are imposed on operators that do not abide by these quality guidelines and likewise, there are no incentives (from the regulator) for those performing well. In July 2014, TRAI introduced a new clause that mandates service providers to state minimum download speed for the wireless data plans. The clause requires operators to ensure that the download speed advertised is delivered not less than 80 percent of the usage time. This clause was introduced as the advertised speeds differed significantly with what was being delivered. TRAI has separate QoS regulations for broadband and wireless data services. 3G and 4G data services can be categorized as broadband services but 2G mobile internet services cannot be regarded as broadband service. Given the fact that a significantly large chunk of population still uses 2G, there is a separate set of regulations required for wireless internet services, at least, till the time the users choose to upgrade to faster internet services. (CUTS, 2016)
TRAI issued a mandate stating that all fixed line Internet providers will always provide a minimum speed of 512 Kbps to their users in order to be classified as a broadband service provider. This order includes all the services that offer a Fair Usage Policy (FUP). Under FUP, an Internet service has to provide an Internet connection to the user at all times at a certain minimum guaranteed speed. So, instead of the earlier 64 Kbps download speed, users will now get a minimum download speed of 512 Kbps after they have used up their data at higher speeds. TRAI has also asked all Internet providers, both wired and wireless, to ensure that the full information about their FUP plans is accessible to the public. (Mehta, The Huffington Post, 2016)
In an attempt to improve internet service quality for Indian mobile users, TRAI launched an application - TRAI MySpeed App on 5th July 2016, to help consumers check real time internet speed on their hand held devices which they can report to the regulator. The data, thus collected from the subscribers, was expected to be used by TRAI to fix new quality of service norms. Most of this data is hidden and only a general average is displayed online.
As far as the quality parameters are concerned, speed is an important determinant of internet quality. However, there are additional factors that come into play, when determining the quality of internet services. Broadband experience is affected by throughput, latency, network oversubscription, jitter and packet loss etc. However, it must be noted that for consumers, the only available information about quality is typically download speed. There are factors beyond technical performance of broadband that affect the overall quality of experience. These may include cost, ease-of-use, customer support and user‘s expectations. Also, significance of various quality parameters differs across mobile applications. Some need low latency while others may require good network reliability, and yet others need great bandwidth
Assessment of Impact of Quality of Internet in India and its Impact on Users October 2017
E-34, East of Kailash, New Delhi – 110065, India
URL: www.consumer-voice.org Page 67
and speed and so on. In order to create a mass market for innovative next generation applications, networks need to consistently support high bit rates in both the directions, low latency and reliable connectivity. Thus, a country cannot properly assess its progress on digitization without taking into account service quality. (Vicente & Gil-de-Bernabé, Assessing the broadband gap: From the penetration divide to the quality divide, 2010).
In order to fill this void, the industry regulator – Telecom Regulatory Authority of India (TRAI) has been mandated under TRAI Act 1997 to lay down Quality of Service (QoS), to ensure QoS and to conduct periodical surveys to assess QoS so as to protect the interests of the consumers. The authority has been exercising these provisions that are linked with the objective of protecting interests of service providers & consumers and maintaining an environment of orderly growth in the industry. However, it has stopped regular QoS surveys since 2013.
Over the years, TRAI has released a number of regulations for Basic Wireline, Cellular Mobile, Broadband, Dial-up & Leased Line connections and Wireless services. These regulations have been reviewed time and again as evolving customer requirements and expectations have been given paramount considerations. The framing and moderation of such regulations is the result of a consultation process through written comments and open-house discussions, which comprehensively addressed all aspects of QoS. Such discussions with Service providers, Consumer Organizations and general public are held in various parts of the country to get inputs from the stakeholders. The comments and feedback received from stakeholders are thus taken into account.
The regulations clearly define the accountability of the service providers towards the authority, failing which they could be either penalized in the form of financial disincentives or get their licenses revoked. In addition to prescribing the benchmarks for various parameters of QoS with their denotation, the authority also specifies the measurement methodology, record-keeping, review and audit requirements to be adhered by the service provider. It also reserves the right to publish such reports on regular basis to ensure that consumers have adequate information about the QoS being provided by various service providers. These results are released in the form of performance indicator reports at the end of each quarter and available at the website (Telecom Regulatory Authority of India, 2016) for perusal. Furthermore, TRAI has been conducting periodic survey through independent agencies across the country, to monitor the compliance of prescribed standards/benchmarks. Zone-wise tenders were floated on annual basis wherein the research agency had to present the findings in a tabular format that depicts which service provider has not met the quality of service benchmarks of the prescribed parameters. These regular survey reports have stopped being published in 2013 and have not been resumed since then.
The Concept of Quality Of Service (QoS) The International Telecom Union defines Quality of Service (QoS) as the ‘Totality of characteristics of a telecommunications service that bear on its ability to satisfy stated and implied needs of the user of the service’2 . TRAI has revised this definition to corroborate all kinds of services that come under its umbrella, which says that ‘QoS is the main indicator of the performance of a telecommunication network
2 (ITU, 2008)
Assessment of Impact of Quality of Internet in India and its Impact on Users October 2017
E-34, East of Kailash, New Delhi – 110065, India
URL: www.consumer-voice.org Page 68
and the degree to which the network conforms to the stipulated norms. The subscriber’s perception of the Quality of Service (QoS) is determined by a number of performance factors’3. The benchmarks for Quality of Service parameters for Broadband services as described in the regulations (Quality of Service of Broadband Service Regulations , 2006) are given below:
S. No. QoS Parameters Benchmarks Averaged over
a period of
1 Service Provisioning
/Activation Time
100% cases in =<15 working days (subject to technical feasibility). In all cases where payment towards installation charge & security deposit is taken and the Broadband connection is not provided within 15 working days, a credit at the rate of Rs.10/ per day, subject to a maximum of installation charge or equivalent usage allowance shall be given to the customer, at the time of issue of first bill.
2 Fault Repair / Restoration
Time
By next working day: > 90% and within 3 working days: 99% Rebate: (a) Faults Pending for > 3 working days and < 7 working days: rebate equivalent to 7 days of minimum monthly charge or equivalent usage allowance (b) Faults Pending for > 7 working days and < 15 working days: rebate equivalent to 15 days of minimum monthly charge or equivalent usage allowance (c) Faults Pending for > 15 working days: rebate equivalent to one month of minimum monthly charge or equivalent usage allowance
One Month
3 Billing Performance • Billing complaints per 100 bills issued • %age of Billing Complaints resolved • Time taken for refund of deposits after closure
< 2% 100% within 4 weeks
100% within 60 days
One Month
4 Response time to the customer for assistance
% age of calls answered by operator (Voice to Voice) Within 60 seconds > 60% Within 90 seconds > 80%
One Month
5 Bandwidth Utilization/ Throughput: a) Bandwidth Utilization i) POP to ISP Gateway Node [Intra-network]
<80% link(s)/route bandwidth utilization during peak hours (TCBH). If on any link(s)/route bandwidth utilization exceeds
One Month
3 (Quality of Service of Broadband Service Regulations , 2006)
Assessment of Impact of Quality of Internet in India and its Impact on Users October 2017
E-34, East of Kailash, New Delhi – 110065, India
URL: www.consumer-voice.org Page 69
S. No. QoS Parameters Benchmarks Averaged over
a period of
Link(s) ii) ISP Gateway Node to IGSP / NIXI Node upstream Link(s) for International connectivity b) Broadband Connection
Speed (download)
90%, then network is considered to have congestion. For this additional provisioning of Bandwidth on immediate basis, but not later than one month, is mandated. Subscribed Broadband Connection Speed to be met >80% from ISP Node to User.
6 Service Availability / Uptime (for all users)
> 90% quarter ending June 2007; > 98% with effect from quarter ending September 2007 and onwards
One Quarter
7 Packet Loss (for wired broadband access)
<1% One Month
8 Network Latency (for wired broadband access) • User reference point at POP / ISP Gateway Node to International Gateway (IGSP/NIXI) • User reference point at ISP Gateway Node to International nearest NAP port abroad (Terrestrial) • User reference point at ISP Gateway Node to International nearest NAP port abroad (Satellite)
<120 msec <350 msec <800 msec
One Month
9 Customer perception of Services (a) % satisfied with the provision of service (b) % satisfied with the billing performance (c) % satisfied with help services (d) % satisfied with network performance, reliability and availability (e) % satisfied with maintainability (f) % satisfied with Overall customer satisfaction (g) % satisfied with Customer satisfaction with offered supplementary services such as allocation of static/fixed IP addresses, e-mail IDs etc.
>90% >90% >90% >85% >85% >85% >85%
One
Quarter
Source: TRAI website
Over the years, with the advent of technology and the concept of Speed gaining momentum, TRAI upgraded the definition of Broadband from a service that must provide at least 256 kbps to 512 kbps in June 2014 (Quality of Broadband Services (Second Amendment), 2014).
Assessment of Impact of Quality of Internet in India and its Impact on Users October 2017
E-34, East of Kailash, New Delhi – 110065, India
URL: www.consumer-voice.org Page 70
Similarly, the quality of service parameters for various parameters of Wireless services as defined in the regulations (The standards for Quality of Service for Wireless Data Services Regulations, 2012) are given in the table below:
S.No. Name of Parameter Benchmarks Averaged over a period
1 Service Activation
/Provisioning
Within 4 hrs with 95% success rate. One Month
2 Successful data transmission
download attempts >80% One Month
3 Successful data transmission
upload attempts >75% One Month
4 Minimum download speed To be measured for each plan by the service provider and reported to TRAI
One Month
5 Average Throughput for
Packet data
>75% of the subscribed speed. One Month
6 Latency Data <250ms One Month
7 PDP Context Activation
Success Rate ≥95% One Month
8 Drop rate ≤5% One Month VOICE in its study about Quality of Broadband Services (VOICE, 2008) made use of a service quality model that was carved out of these parameters and generic SERVQUAL4 and SERVPERF5 models. The research instruments thus used included variables under following dimensions: DIMENSION VARIABLES WITH CORRESPONDING PARAMETERS TANGIBILITY : Physical facilities, equipment and appearance of service firm‘s employees
Availability of suitable plans (Service Provision) Provision of information on SIM Card, recharge cards etc. (Service Provision) Provision of visually attractive material – starter pack, reload card (Service Provision) Provision of variety of entertainment facility – apps etc. (Supplementary services)
RELIABILITY : Performing the promised services at stated level
Provision of service accuracy and dependable (Billing) Transparent & Accuracy of bill/ charges (Billing) Customer friendly staff (Help services)
RESPONSIVENESS : Providing prompt services and willingness to help customers.
Provision of timely service (Service Provision) Effective handling of downtime i.e. maintaining a service (Maintainability) Prompt handling of complaint (Grievance redress) Effective grievance redressal mechanism, customer service (Grievance redress)
4 Model of Service Quality developed by A. Parasurman, Valarie Zeithaml and Leonard L. Berry first published in 1988 5 Modification to SERVQUAL proposed by J.J. Cronin and S.A. Taylor in 1994
Assessment of Impact of Quality of Internet in India and its Impact on Users October 2017
E-34, East of Kailash, New Delhi – 110065, India
URL: www.consumer-voice.org Page 71
ASSURANCE : Knowledge and courtesy of employees and their ability to inspire trust and confidence in the firm.
Competency of the staff/ services/ problem solving ability (Help services) Feedback mechanism (Grievance redress)
EMPATHY : Caring and personalized attention to its customers
Provision of service manual, complete tariff plan at the time of subscription (Service Provision) Having convenient periods and terms for activation, recharge and account suspension , free call times (Billing) Ease of taking a connection (Service Provision) Ease of recharging process in a prepaid connection (Billing) 24 x 7 customer care service (Help services)
NETWORK/TECHNICAL QUALITY : Network availability, reliability and performance
Availability of signal in your area (cell)/ working phone(basic)/ uptime (broadband) (Network Performance) Ability to make and receive call / uninterrupted (Network Performance) Clear Voice quality (Network Performance)
ECONOMY : How economical is the use of mobile/broadband/basic wire line service
Availability of recharging cards in various denomination (Billing) Economical call charges per minute/ second (Billing)
CONVINIENCE : Ease of approaching the service provider for any particular service
Ease of access to Customer help line numbers (Help services) Ease of activating & deactivating any service (VAS)/ any other (Supplementary services) Ease of registering for unwanted calls/ SMS (Supplementary services)
Source: TRAI website The Customer Satisfaction Surveys (CSS) conducted by TRAI through third-party assessment (Mott MacDonald, 2015) every year made use of these parameters and customer perception parameters (only for broadband) mentioned above which are defined as follows:
S. No. Name of Parameter Benchmark for Broadband Service
1.
Customers satisfied with the provision of service Defined by satisfaction with time taken to provide/ activate working connection, time taken for shifting of connection, re-activation of service in case of disconnection due to non-payment and ease of understanding the offer or tariff plan.
≥90%
2.
Customers satisfied with the billing performance For Postpaid customers, this is defined by satisfaction with the timely receipt of the bill, accuracy and completeness of the bill, clarity in bills/ presentation of the billing information in terms of transparency and understandability and with the process of resolution of billing complaints. For Prepaid customers, this is defined by satisfaction with accuracy of charges i.e correctness of the amount deducted on every usage, credit and validity correctness, ease and transparency of recharge.
≥90%
3. Customers satisfied with network performance reliability and availability Defined by satisfaction with the network coverage (signal strength or availability of telephones connections).
≥90%
4. Customers satisfied with maintainability ≥85%
Assessment of Impact of Quality of Internet in India and its Impact on Users October 2017
E-34, East of Kailash, New Delhi – 110065, India
URL: www.consumer-voice.org Page 72
Defined by average duration and frequency of network/ exchange outages (signal), satisfaction with the availability of network (signal), restoration of network (signal/ exchange) problems and number and frequency of faults/ problem experienced.
5.
Customers satisfied with supplementary and value added services Defined by satisfaction with process of activation of supplementary/ value added services with the roaming services and the quality of the supplementary/ value added services.
≥85%
6.
Customers satisfied with help services including customer grievance redressal Defined by satisfaction with ease of access of call centre/ customer care or help line, the response time taken to answer (waiting time) the call by the customer care executive, the time taken by call centre/ customer care/ help line to resolve the complaint, the problem solving ability of the customer care executive, the achievement of a satisfactory solution or resolution of complaint and the overall grievance redressal mechanism.
≥85%
7. Customers satisfied with overall service quality
Defined by the satisfaction with overall quality of total service offering. ≥85%
Source: TRAI website
An excerpt from a CSS study conducted by TRAI for the period July-September 2013 (VOICE, 2013) for Broadband services shows the percentage of customers of each cellular service providers were satisfied with various parameters of service. The analysis of the table reveals that in terms of meeting the benchmark, the performance of Airtel was the best as it was able to meet the benchmark in all parameters except Supplementary services. It was followed by Hathway and MTNL. Hathway was able to meet benchmark criteria on 5 out of 8 parameters. The analysis reveals that, performance of Airtel and Hathway in broadband services was comparatively better than other operators in Delhi Metro circle.
Conducting such assessments on quarterly basis for every service provider in each of the service areas helped TRAI understand the QoS of each of them. It was of core importance for the service providers to meet the benchmarks as these findings were disseminated through the website for consumers and other stakeholders. In addition to this, non-compliance also invited financial disincentives payable by concerned service provider. However TRAI has not resorted to levying any penalty so far. Also, it has stopped such surveys in 2013 which need to be urgently revived.
Learning: These past studies conducted by independent research organizations along with the regulations set by TRAI to regulate the service providers prompted the research team to stick to the QoS framework so constructed, which was refined further to maintain focus on Internet Services only for the purpose of our study. Following parameters were thus considered for the purpose of this study:
1. Availability – Pertains to availability of Internet service, availability of appropriate information and availability of all means to access this service
2. Speed – Concerns with the download and upload speeds of each service, difference between committed and actual speeds and their consistency
3. Reliability – Refers to the reliability of service in terms of trust that it shall provide uninterrupted services at all times and places and shall also be equally effective during roaming
Assessment of Impact of Quality of Internet in India and its Impact on Users October 2017
E-34, East of Kailash, New Delhi – 110065, India
URL: www.consumer-voice.org Page 73
4. Billing & Charges – Deals with clarity and transparency of bills and charges for postpaid and prepaid service respectively
5. Help/Customer Care Services – Regards to the access and effectiveness of help services and customer care executives
6. Overall QoS – Defines the overall Quality of Internet Service 7. Problems, Grievance and Redressal – List various problems that can be faced by an Internet
user during the use of service, the complaint procedure and response time associated with them and the status of problem resolution.
These dimensions were broken into a number of variables that were validated through situational analysis and became the base of questionnaire design. The literature for QoS also pointed out that speed is one of the most important parameters and needs to be studied in depth to get the holistic picture of existing Quality of Internet Services (QoIS) in India.
Speed of Internet ‗Speed of Internet Service‘, is not just considered to be an important parameter for the Quality of Internet, rather it is also a principal factor that influences the purchase decision that a consumer takes when given a plethora of plans that are priced on the basis of combinations of speed and data allowance to choose from. In this digital era, where communication services have become an essential part of our economy, interest of consumers with respect to internet services cannot be sidelined. However, a large number of internet users in India are still unaware of the difference between the speeds they pay for and the actual speeds they get. With the advent of new technologies, it has now become possible to provide bigger and better services to internet users. But with increasing number of internet connections, incidences of consumer detriment and dissatisfaction have also surged. TRAI acknowledges (TRAI, 2017) that there exists ‗Information Asymmetry‘ in the telecom sector which is one of the causes of market failure. It basically pertains to the situations ―where one transacting party has access to more superior or accurate information compared to the other party‖. Non- disclosure of provisions of services like accurate data speeds, contract terms, latency, etc may cause customer dissatisfaction. Even if the complete information is available, it might not be in a format that is easily comprehensible to the customers. Use of terms like ‗up to‘ for data speeds has become a common occurrence although the theoretical speeds (as claimed by ISPs) are rarely delivered. One of the recently conducted surveys by TRAI to assess the consumer perception found that about 60%, 62% and 67% respondents were dissatisfied with their internet data speeds in Delhi, MP and Karnataka respectively. Also, satisfaction with data speeds was given a rating of 2.39, 2.33 and 2.14 on a five-point scale, in Delhi, MP and Karnataka respectively (where 3 was neutral, below 3 was dissatisfied and above 3 was satisfied). (TRAI Survey Reports, 2017)
After receiving a number of complaints from consumers regarding poor internet speeds, TRAI proposed to ‗mandate the minimum download speeds‘, so as to protect the interests of consumers. But service providers opposed the proposal citing a number of constraints due to which exact speeds cannot be measured, such as- limited availability of spectrum per operator in 2G/3G bands; low coverage zones such as basements, high rise buildings, tunnels, etc; quality and type of subscriber‘s device, number of
Assessment of Impact of Quality of Internet in India and its Impact on Users October 2017
E-34, East of Kailash, New Delhi – 110065, India
URL: www.consumer-voice.org Page 74
subscribers browsing the data services, peak/ off peak time, transmission bandwidth, external interference, website behavior etc.
In October 2016, TRAI issued directions applicable to the wireline and wireless broadband services. Wireless broadband service providers are ―required to disclose the data usage limit which specifies primary technology (3G/4G) and the speed offered after that limit on its website in all advertisements‖. In case of wireless connections, consumers are generally not aware of the actual speeds and perceive the speed to the theoretical speeds, which are claimed by ISPs . Theoretical speeds are the ‗advertised speeds‘ which often greatly vary from the actual speeds. Data available at TRAI‘s MySpeed Portal shows that a large number of 3G subscribers throughout the country receive a download speed of less than 1mbps and may go as low as 10 kbps for some users.
The table below shows the theoretical 2G, 3G and 4G speeds (TRAI, 2017)-
Table 1: Upload and Download Speeds for Various Technologies SI
Source: Qualcomm Report - Evolution of Mobile Technologies (Taken from TRAI consultation paper) It can be observed that there is improvement in internet speeds with each advanced generation of cellular network. CUTS International in their broadband labels training manual (CUTS International, 2017) discuss about the various generations of cellular networks which were designed to provide better internet services in terms of speed. These generations are explained as below-
a) 2G- Came in 1991 and cell phones became Digital from Analog. It was primarily designed for phone calls and enabled use of text messaging.
Then came 2.5G that enabled internet on mobile phones. Users could access GPRS. Maximum theoretical download speed under 2.5G network was ‗up to 80 kbps‘.
The next upgrade was 2.75G that offered improved data transfer rates through GSM. Maximum theoretical download speed under 2.75G network was ‗up to 236.8 kbps‘.
b) 3G- It was introduced in 1998 and commercially launched in Japan during 2001. It enabled faster data transmission provided scope for video streaming, downloads etc. 3G brought the mobile broadband evolution and offered speeds ‗up to 42 mbps‘.
Maximum Theoretical Download Speeds under 3G Network Standards
UMTS (Universal Mobile Telecommunications Service) : up to 384 Kbps W-CDMA (Wideband Code Division Multiple Access) : up to 384 Kbps
HSPA (High Speed Packet access) : up to 14.4 Mbps HSPA+ or HSPA Plus : up to 42 Mbps
Assessment of Impact of Quality of Internet in India and its Impact on Users October 2017
E-34, East of Kailash, New Delhi – 110065, India
URL: www.consumer-voice.org Page 75
Maximum Theoretical Download Speeds under 4G Network Standards
Long Term Evolution (LTE) : up to 100 Mbps
Long Term Evolution (LTE) Advanced : up to 1 Gbps WiMAX (Release 1) : up to 40 Mbps WiMAX (Release 2) : up to 1 Gbps
c) 4G- It was launched in 2009 and is able to support much higher speeds and data intensive tasks as compared to 3G. The maximum theoretical 4G download speeds are given below-
The speeds mentioned in the tables above are maximum speeds which cannot be attained every time a person is using internet. In fact, they are rarely attained. Therefore TRAI defines a broadband connection by citing the minimum speed. As per TRAI- “Broadband is a data connection that is able to support interactive services including Internet access and has the capability of the minimum download speed of 512 kbps to an individual subscriber from the point of presence (POP) of the service provider intending to provide Broadband service” (TRAI Regulations, 2014). This minimum download speed has been raised from 256 kbps (Broadband Policy, 2004) to 512 kbps in July 2013.
In its efforts to ensure consumer protection, TRAI has issued ―Standards of Quality of Service for Wireless Data Services Regulations, 2012‖ that introduced a list of QoS parameters. These parameters have certain benchmarks that service providers have to comply with. Following this regulation, in 2014, TRAI introduced a clause in the regulation that mandates service providers to publish minimum download speed for the wireless data plans. Also, service providers are directed to ensure that the minimum download speed specified in their advertisements is delivered not less than 80% of the usage time. The table below shows the QoS parameters and benchmarks laid down in this regulation (CUTS International, 2017)-
Table 2: QoS Standards for Wireless Data Services in India, Regulation 2012 Name of Parameter Benchmark
Service Activation/ Provisioning Within 4 hours with 95% success rate Successful Data Transmission Download Attempts > 80% Successful Data Transmission Upload Attempts > 75%
Minimum Download Speed To be measured for each plan by the service provider and reported to TRAI
Average Throughput for Packet Data > 75% of the subscribed speed Latency Data < 250 ms PDP Context Activation Success Rate ≥ 95% Drop Rate ≤ 5%
Amendment 2014 Minimum Download Speed ≥ 80% of the usage time Source: TRAI Website, http://www.trai.gov.in/Content/Regulation/0_3_REGULATIONS.aspx
Assessment of Impact of Quality of Internet in India and its Impact on Users October 2017
E-34, East of Kailash, New Delhi – 110065, India
URL: www.consumer-voice.org Page 76
TRAI has framed its regulations in such a way that allow ISPs to mislead consumers by not assuring minimum or average speeds. ISPs may not commit to an average speed, yet certain apps such as TRAI MySpeed app, allow the users to test their network speeds. But it is difficult for the users to determine the reasons behind low network speeds. As mentioned above, TRAI proposed to make disclosure of average speeds mandatory, but it has not been able to put it into effect till date and many ISPs have opposed to this. However, similar efforts have been made and were somewhat successful in other countries. In 2010, the Federal Communications Commission (FCC), the American telecommunications regulator, conducted a survey which revealed that 80% of Broadband users in the United States were unaware of their internet speeds. After seeking inputs from stakeholders, the FCC passed the Open Internet Order in 2015. The order states that it is obligatory for each internet service provider to disclose network performance information for each of its broadband services (3G/4G). The order applies to mobile broadband providers as well. It has recently also introduced Broadband labels called 'Broadband Facts' for fixed and mobile broadband services. It is designed to deliver accurate information regarding 'typical speed', 'typical latency' and 'typical packet loss'. Providers are also expected to disclose 'typical peak usage download and upload speed' under this order. (TRAI, 2017)
While conducting the situation analysis for this study, the research team observed that the most significant and recurring problem faced by consumers due to poor quality of internet was that of ‗Speed‘. They reported battling with the inconsistent speeds throughout the day and at different locations on frequent basis. Meetings with different experts and regulatory officials made it clear that Speed has been largely neglected so far in spite of it being a crucial factor in determination of quality of service. These observations and discussions with, stakeholders prompted the research team to conduct an audit of internet speeds on important parameters. The primary objective of this was to focus on the Speed Audit to observe the difference between ‗promised speed (as claimed by service providers)‘ and ‗actual speed (as experienced by users)‘.The study involves the audit of Wireless (mobile) Internet services only. The primary reason for limiting the scope of this study to Wireless mode only was because it is only in this case, that there have been huge differences between promised and actual speeds unlike in case of Wireline, where striking differences between the two are rarely observed. Another reason for the same was the constraint of access to the consumer‘s computers or any other fixed device by the auditors.
State of Internet in India
According to AKAMAI‘s State of the Internet report, India ranked 114 globally in Q1, 2016 in terms of Average connection speed and 104 in terms of Average peak connection speed. In Q2, India moved up one position to a global rank of 113. However, it slipped to 109th position in terms of Average peak connection speed. In Q3, the rank improved. India ranked 105 in terms of Average connection speed and 107 on Average peak connection speed. In Q1 2016, the average connection speed in India was 3.5 mbps while in South Korea, it was 29 mbps. In Q2, the average speed was 3.6 mbps and 4.1 in Q3 in India.
According to an article (Hindustan Times, 2016), India ranks 114th among 146 countries in terms of internet speeds. The average speed in the country is one-eighth of world topper South Korea‘s 29 Mbps. At this rate it takes about 4 minutes to download an HD video from Youtube.
Assessment of Impact of Quality of Internet in India and its Impact on Users October 2017
E-34, East of Kailash, New Delhi – 110065, India
URL: www.consumer-voice.org Page 77
Another newspaper article (The Times of India, 2017), talks about comprehensive overhauling of tariff rules, including promotional offers by internet service providers. TRAI reported to having received a number of complaints regarding tariff offers not being adequately transparent. It released a consultation paper ‗Regulatory Principles of Tariff Assessment‘ on issues related to transparency in tariff orders: promotional schemes and their validity; anti-competitive behavior of operators; and predatory pricing and dominance by companies. In an interview with ToI, TRAI reported that ―While advertising data offers, telecom companies mention the latest technology coverage that a consumer would experience. However, in reality the current networks are a combination of 2G/3G/4G technologies and consumers experience the benefit of latest technology in patches only. This leads to consumer dissatisfaction.‖
The literature suggests that internet has an impact on lives. Literature on importance of good quality of internet services is cited above. The reviewed literature also suggests that ‗Quality of internet service‘ impacts various aspects of life. Which aspects of life are most impacted by the quality of internet services and to what extent is yet to be seen. This study intends to answer these questions among others.
E-34,East of Kailash, New Delhi – 110065, India
URL: www.consumer-voice.org Page 79
CHAPTER 3
METHODOLOGY
Assessment of Impact of Quality of Internet in India and its Impact on Users October 2017
E-34,East of Kailash, New Delhi – 110065, India
URL: www.consumer-voice.org Page 80
3.1 Introduction In the first phase of literature review, a list of key points was generated from which a framework was designed to capture and classify the impact areas of QoIS. The analytical framework (discussed in chapter 1) comprises of following seven dimensions -
1. General Issues
2. Business and Supply issues
3. Social Capital
4. Human Capital
5. Finance/Economic Needs
6. Leisure/Recreation
7. Umbrella Issues 3.1.1 Background of the study In order to ascertain the relevance of these seven dimensions in Indian society, situational analysis covered in-depth discussions with a sample of internet users on these dimensions. A list of 199 items was generated based on literature review which has been detailed in the previous chapter and guidelines were prepared for in-depth interviews to be conducted with internet users and internet service providers across nine cities selected for situational analysis (See Annexure A for guidelines). Situational analysis was conducted in all four telecom circles (Metro, Circle A, Circle B and Circle C).
For the purpose of this study, official classification of sample states into telecom circles was adopted and was considered useful and hence these states were classified into four telecom circles – Metro, Circle A, Circle B and Circle C. The official classification of states into telecom circles is thus being adopted.
Source: The Centre for Internet and Society (cis-india.org)
A Brief History of Telecom Circles in India
To set off induction of private sector in telecom, the government allowed private telecom companies to manufacture telecom switches for telephone exchange in 1991. Later, the Department of Telecommunications (DoT) invited bids for licenses for cellular service across the four metros. In 1992, the rejected bidders challenged the process of selection on the grounds that it was unclear and arbitrary. It brought to the fore-front the lack of policy with respect to licensing and regulatory framework for telecommunication.
In May 1993, The DoT commissioned ICICI to study and prepare a report on the possibility of private participation in the telecommunication sector. This led to the National Telecom Policy, 1994. In 1995, DoT allowed bidding for cellular licenses and wireline licenses. For the implementation of the licensing scheme, the country was divided into 21 circles (excluding four metros) and these were further categorized into circles namely A, B and C on the basis of the potential of the circle to generate revenue. We are adopting this official classification for geographic classification of respondents for the purpose of our study.
Assessment of Impact of Quality of Internet in India and its Impact on Users October 2017
E-34,East of Kailash, New Delhi – 110065, India
URL: www.consumer-voice.org Page 81
Fig 3.1.1 Telecom Circles in India 3.1.2 Situational Analysis Situational Analysis involved in-depth interviews with internet users (urban as well as rural), Internet Service Providers (ISPs) and experts. The details are as follows-
Table 3.1.2a Details of In-Depth Interviews Conducted during Situational Analysis
TYPE OF RESPOND
ENT
NORTH ZONE EAST ZONE WEST ZONE SOUTH ZONE TOTAL Chandigar
Assessment of Impact of Quality of Internet in India and its Impact on Users October 2017
E-34,East of Kailash, New Delhi – 110065, India
URL: www.consumer-voice.org Page 82
Experts interviewed included TRAI, Pehle India Foundation, National Institute of Public Finance and Policy, Gram Vaani, Indian Council for Research on International Economic Relations and others.
During situational analysis, more items were added to the list prepared post literature review which came from in-depth interviews with the respondents. The 199 items identified were increased to 225 items after the situational analysis. These factors were then put into Importance-Influence Matrix (IIM). The factors were placed into different quadrants of IIM through rigorous brainstorming sessions. Following were the nine quadrants of the matrix. The serial number refer to item numbers as listed in annexure.
Assessment of Impact of Quality of Internet in India and its Impact on Users October 2017
E-34,East of Kailash, New Delhi – 110065, India
URL: www.consumer-voice.org Page 83
The factors lying in the quadrants 3, 6, 7, 8 and 9 were weeded out.
The list below shows the status of factors that were put into IIM and the number of factors that were retained in the process-
Table 3.1.2b Dimensions, Parameters & Total number of factors (before and after IIM)
S. N0. Dimensions and Parameters No. of items before IIM
No. of items after IIM
A. QUALITY OF INTERNET SERVICE (QOIS) – Broadband, Mobile and Dongle Services 1 Quality of Speed 6 6 2 Availability Of Service 4 3 3 Reliability Of Service (Network, Connectivity) 2 2 4 Billing & Charges (Prepaid And Post Paid) 6 5 5 Help Services/ Customer Care Services 11 10 6 Overall Quality Of Internet Services 3 3
Total Factors 32 29 B. GENERAL AND UMBREALLA ISSUES
7 PUBLIC HOTSPOT 6 0 8 CYBER-CAFÉ 3 0 9 GENERAL USES OF INTERNET 9 6 10 FAMILY & RELATIONSHIPS 4 2 11 EVERYDAY LIFE 7 5 12 BEHAVIORAL MANAGEMENT 3 2 13 GENDER ISSUES 8 6 14 RURAL SCENARIO 16 13
Total factors 56 34 C. HUMAN CAPITAL
15 EDUCATION 16 12 16 HEALTH 13 6 17 HABITS 4 0 18 RESEARCH 6 5
Total factors 39 23 D. SOCIAL CAPITAL
19 INTERACTIONS 5 5 20 DATING & MARRIGES 2 0 21 POLITICAL PARTICIPATION 12 7 22 PEOPLE WITH SPECIAL NEEDS 7 1
Total factors 26 13 E. LEISURE/RECREATIONAL
23 TOURISM 5 4 24 GAMES & GAMBLING* 8 0 25 HOBBIES 5 0 26 ENTERTAINMENT &PORNOGRAPHY 9 6
Total factors 27 10 F. FINANCE/ECONOMIC NEEDS
27 BUSINESS & JOBS 19 16 28 SHOPPING 10 7 29 TRAVEL & TRANSPORTATION 8 7 30 DIGITAL PAYMENTS & BANKING 8 3
Total factors 45 33 Total factors (Overall) 225 142
Assessment of Impact of Quality of Internet in India and its Impact on Users October 2017
E-34,East of Kailash, New Delhi – 110065, India
URL: www.consumer-voice.org Page 84
Based on the 142 items retained, a first version of questionnaire was prepared. The questionnaire, thus prepared was put to test in the field in two phases- Pre Pilot and Pilot. Pre pilot, conducted by our core research team, involved face to face interviews with 76 respondents from Delhi. It was primarily carried out to see what aspects can be merged with other aspects, whether the language of the questions was clear to the respondents, and to validate the sequence of the questions. The questionnaire was revised thereafter. This revised questionnaire was tested in the pilot survey which followed to capture the regional flavor besides testing the vitals of the questionnaire. The fact that India is a vast country with diverse language and culture, therefore, in order to assess the smooth flow and need of translating the questionnaire, pilot testing of the questionnaire was conducted in two states selected from each of the four circles.
The pilot test was conducted through face to face interviews and CATI (Computer Assisted Telephonic Interviews). A total of 1046 interviews were conducted during pilot which was about 2% of the total sample for the study.
Post pilot testing, a few changes were made in the questionnaire which included change of sequence of the factors in the questionnaire, for improved flow and better understanding and merging of some factors.
The final questionnaire thus obtained was then used for the main survey which started in the first week of May 2017 and concluded in August 2017.
3.1.3 Questionnaire building process After the completion of literature review which included an extensive study of about 180 research papers, articles and news items, a list of approx 1000 „key points’ was extracted. The key points were basically, the statements or phrases which were somehow related to the either quality or impact of internet. These key points were then merged, clubbed or eliminated (those which were repetitive) to reach a list of 199 „key factors‟. These key factors were then segregated and divided into different dimensions which helped the research team in developing a framework (see figure 1 in chapter 1). The next step was to conduct the situational analysis which required a precise list of points of investigations/questions/checklist, for which these 199 factors were refined into a total of 83 points. Out of these 83, two separate checklists were prepared- one for consumers, containing 63 points and another for service providers, containing 20 points. The research team travelled to various states and conducted in-depth interviews with the help of these checklists (see section 3.1.2 for complete details on situational analysis).
Post the successful completion of situational analysis, the team collaborated the list of factors consisting of those which were validated/ discovered during situational analysis and reached to a total of 225 factors.
As the number of factors was too large, the team decided to make use of Importance-Influence Matrix (IIM) that helped in churning out the most important and influential aspects/factors which either get impacted or have an impact on the QoIS. At the end of this whole process, the team was left with 142 factors which were then categorized into 12 parameters and were used to prepare the first of the questionnaire (See annexure C: List of factors treated in IIM).
The whole process elaborated above is shown in the figure below-
Assessment of Impact of Quality of Internet in India and its Impact on Users October 2017
E-34,East of Kailash, New Delhi – 110065, India
URL: www.consumer-voice.org Page 85
Figure 3.1.3 Questionnaire building process and number of factors at each stage
This questionnaire (containing 12 parameters), was first tested in Delhi (pre-pilot) with about 80 respondents for further refining of the questionnaire. It was followed by Pilot survey, conducted across 8 states in India with a sample size of 1000+ respondents. At the end of pilot survey, the total number of parameters and aspects/factors were reduced to 9 and 67 respectively which then resulted in the development of the final questionnaire of this study.
3.2 Sampling and Data collection The total sample to be covered was 50,000, which was divided into 48,500 face to face using tablets and CATI (questionnaire based) quantitative interviews. There was another sample of 2400 for speed test audit sample using SIM based devices, and 120 in-depth (qualitative) interviews using audio visual facilities.
3.2.1 Quantitative Interviews (Questionnaire based) The sample distribution and procedures for the questionnaire based interviews have been elaborated below:
i. As per the latest data available published by TRAI in Sep 2016, there were 354.11 mn internet subscribers, excluding the states of Jammu and Kashmir, Assam and other North Eastern India.
ii. Out of these, 317.27 (89.6%) were mobile devices such as mobile phones and data card. It must be noted that the data does not reflect the actual users of internet subscribers, but the subscribers who are registered or capable users. As per the industry source the actual users are estimated to be between 15-20% of the capable users.
After pre-pilot and pilot- - 67
First draft of Questionnaire- 142
No. of factors after the process of IIM- 142
No. of factors after Situational Analysis- 225
Final checklist for Situational Analysis- 83
Merged and clubbed to prepare checklist- 199
Variables extracted from Literature review- 1000
Assessment of Impact of Quality of Internet in India and its Impact on Users October 2017
E-34,East of Kailash, New Delhi – 110065, India
URL: www.consumer-voice.org Page 86
iii. The total number of internet subscribers -broadband (>256kbps) and narrowband (<256 kbs) were 36.84 mn (11%). These could be taken as actual users of internet as the subscription is for exclusive usage of internet.
iv. Largest number of internet subscribers (mobile, broadband and narrowband) were in Maharashtra (including Mumbai and Goa) – 47.20 million (13.3%) - followed by Uttar Pradesh (including Uttrakhand) (41.46 mn, 11.7%) and Tamilnadu (including Chennai and Pondicherry) (29.18 mn, 8.2%)
v. Target Sample: Altogether 48,500 subscribers were targeted for field survey (questionnaire) from all the states of India located in four zones. This sample is statistically significant at 95% confidence level and 0.44% confidence interval.
vi. This sample has been distributed in all the states of India, excluding Jammu and Kashmir, Assam and other North Eastern states, on internet subscribers proportionate (percentage) basis. For example in Maharashtra the proportion of internet subscribers was 13.3%. Therefore altogether 6,465 internet subscribers were targeted in Maharashtra and Goa. Whereas, in Himachal Pradesh the share percentage was 0.9%, therefore, altogether 449 internet subscribers were targeted in this state. The sample in Jammu & Kashmir and North-East states was dropped due to objection of the union of the ministry of home affairs well before the commencement of the study.
vii. Arrived sample in each service area was further divided into two modes of internet access – Wireline (mainly broadband) and Wireless (internet through mobile data and data card). The sample in these modes was distributed in the ratio of 40:60 for the urban areas, whereas it was restricted to 5:95 in case of rural areas due to low penetration of wireline. Higher weightage (as compared to actual users) is assigned to Wireline service as this mode is considered more intense and the subscription is for the exclusive usage of internet. In the case of internet subscribers through mobile phones the subscription to 2G and 3G is given by default and subscriber is a capable user and may not be the actual user. As discussed in para (i) above, only 15-20% of capable users are estimated to be actual users by industry experts.
viii. Sample was further divided at district level by dividing the total state sample by 500 to arrive at the number of district to be covered in each selected state. For example in Maharashtra the total sample is 6,465. When divided by 500, it comes to 13.3. Therefore together in Maharashtra and Goa, it was decided to cover not less than 13 districts. The districts in each state were selected on the basis of their geographical location to spread over all the regions of the state as far as possible. The sample for each district was arrived at on the basis of population proportionate to that of the selected state.
ix. Further the sample was distributed in rural and urban areas in the ratio 20:80. Urban area comprised of district headquarters town whereas the rural area comprised the 20 km rural periphery of the district headquarter town.
The classification of sample states in the study is as follows and the sample distribution in each state is shown in the table below-
Metro- Delhi, Mumbai, Kolkata
Assessment of Impact of Quality of Internet in India and its Impact on Users October 2017
Total 354.1 36.8 317.3 100.0% 48,500 19,400 29,100
Source: Performance indicator Report, Telecom Regulatory Authority of India, published in Sep 2016.
While the metro circle includes Delhi which has second highest Per Capita Income (PCI) – Domestic Product, Mumbai and Kolkata are also high income areas even as separate PCI data for these metros are not available. Circle A included relatively affluent states like Goa which has top rank in PCI-State GDP followed by Puducherry at 3rd rank, Maharashtra, Tamil Nadu and Gujarat which are at 5th, 6th and 7th ranks respectively. It also includes middle income states like AP which holds 12th rank. Circle B includes relatively affluent states like Haryana (4th rank), Punjab (10th rank) and Kerala (8th rank). It also includes less affluent states like Uttarakhand (9th rank), West Bengal (14th rank), Rajasthan (15th rank), Madhya Pradesh (17th rank) and Uttar Pradesh (18th rank). Circle B is mixed with affluent as well as not so affluent states. Circle C has only Himachal Pradesh (10th rank) as well as the poorest states like Orrisa (17th rank) and Bihar (19th rank). This circle is predominantly poor as Orissa and Bihar comprise of over 90% of its sample.
Assessment of Impact of Quality of Internet in India and its Impact on Users October 2017
E-34,East of Kailash, New Delhi – 110065, India
URL: www.consumer-voice.org Page 88
For this report, a total of 52000 respondents were covered from all the telecom Circles taken together. This sample comprises of 35503 wireless and 16497 wireline respondents spread over three metro cities (Delhi, Mumbai and Kolkata) and fifteen states five states are clubbed with neighboring states. UP includes Uttarakhand, MP included Chattisgarh, Maharashtra includes Goa, AP includes Telengana and TN includes Pondicherry. This means that our sample covers three metros and twenty states and union territories which is considered a nationally representative sample. 80% of this sample has been covered from the urban areas, leaving the rest 20% to be covered from rural counterparts, giving the sample a sufficiently large urban – rural comparison. The details of the state wise sample achieved are shown in the following table over three pages-
Table 3.2.1b. Socio -Economic Characterics with respect to Service Area
Teledensity as on 13 june 2017Source- data.gov.in, Census 2011
Density of population- per square km (2011) Total population -in 1000s (2011) Literacy rate- in percentage (2011)Poverty rate- 2011-12 (Based on MRP Consumption)Per Capita Income- Per Capita Net State Domestic Product at Factor Cost (Constant prices)-2011-12; Base 04-05 Worker population ratio- state wise worker population ratio persons aged 15 years above usual status basis during 2015-2016
Assessment of Impact of Quality of Internet in India and its Impact on Users October 2017
E-34,East of Kailash, New Delhi – 110065, India
URL: www.consumer-voice.org Page 89
Table 3.2.1c. Distribution of the sample covered with respect to Telecom Circles and Service Areas
Telecom
Circle
Telecom Service
Area Districts
Rural Urban Total F2F F2F CATI Total
Wireless Wireline Total Wireless Wireline Total Wireless
Assessment of Impact of Quality of Internet in India and its Impact on Users October 2017
E-34,East of Kailash, New Delhi – 110065, India
URL: www.consumer-voice.org Page 92
3.2.2 Methodology for Audit of Speed ‘Speed of Internet Service‟, is not just considered to be an important parameter for the Quality of Internet, rather it is also a principal factor that influences the purchase decision that a consumer takes when given a plethora of plans that are priced on the basis of combinations of speed and data allowance to choose from. In this digital era, where communication services have become an essential part of our economy, interest of consumers with respect to internet services cannot be sidelined. However, a large number of internet users in India are still unaware of the difference between the speeds they pay for and the actual speeds they get.
While conducting the situation analysis for this study, the research team observed that the most significant and recurring problem faced by consumers due to poor quality of internet was that of „Speed‟. They reported battling with the inconsistent speeds throughout the day and at different locations on frequent basis. Meetings with different experts and regulatory officials made it clear that Speed has been largely neglected so far in spite of it being a crucial factor in determination of quality of service. These observations and discussions with stakeholders prompted the research team to conduct an audit of internet speeds on important parameters. The primary objective of this was to focus on the Speed Audit to observe the difference between „promised speed (as claimed by service providers)‟ and „actual speed (as experienced by users)‟.The study involves the audit of Wireless (mobile) Internet services only. The primary reason for limiting the scope of this study to Wireless mode only was because it is only in this case, that there have been huge differences between promised and actual speeds unlike in case of Wireline, where striking differences between the two are rarely observed. Another reason for the same was the constraint of access to the consumer‟s computers or any other fixed device by the auditors.
The study was carried with the simple objective of enlightening consumers and policy makers on their actual network speeds because what is promised is not delivered in reality. This has been reaffirmed by TRAI as well through its MySpeed Portal. The data received on this portal shows that a good number of 3G subscribers throughout the country receive a download speed of less than 1 mbps. This is due to the difference between theoretical speeds and actual speeds. According to (TRAI, Data Speed under Wireless Broadband Plans, 2017), theoretical 3G downloading speeds range from 1.8mbps to 42mbps and uploading speeds range from 384 kbps to 11 mbps. In case of 4G, downloading speeds may go upto 100-150 mbps and uploading speeds may go upto 50mbps. (TRAI, Data Speed under Wireless Broadband Plans, 2017).
During an internal brainstorming session conducted within the members of the research team, it was concluded that a speed measuring applications shall be used for the purpose. The results thus obtained through the application, shall be used for analysis and presentation of results. Since there are many apps available in the industry, the team decided to use „MySpeed‟ application, developed and distributed by the Telecom Regulatory Authority of India (TRAI). TRAI acts as the regulator of telecom and broadband industry in our country and thus considered to be unbiased and neutral towards any particular service provider. Thus, the Speed Test app - MySpeed - launched by TRAI, was used to test the speed of ISPs. The tests for each ISP were carried out at the same area/place in the city thrice a day – morning, afternoon and evening. The test was carried out for the pre decided ISPs operating at the national level – Airtel, BSNL/ MTNL, Vodafone, Idea, Reliance Jio. The auditors designated for the testing purpose were provided 3G/ 4G SIM cards of each of the ISPs operating in the area (see Annexure _ on speed test questionnaire). Below mentioned is the sampling technique of this speed test study.
Assessment of Impact of Quality of Internet in India and its Impact on Users October 2017
E-34,East of Kailash, New Delhi – 110065, India
URL: www.consumer-voice.org Page 93
Selection of States: In order to have the wider coverage from the telecom circles, the speed test was carried out in one city in the Metro circles (Delhi), two states in telecom Circle A (Gujarat and Karnataka), three in Circle B (Punjab, Kerala and Uttar Pradesh) and two in Circle C (Orissa and Bihar).
Selection of districts: The speed test was conducted in one district of each selected state/service area.
Urban/Rural bifurcation: 80% of the total sample would be conducted in urban areas of the district while the remaining 20% would be done in rural areas.
Sample size: Overall, 2400 readings of speed would be taken across 8 states. For each ISP, 20 X 3 (20 units 3 times a day) tests was conducted. This is shown in the table below:
Number & time of tests- A minimum of 60 readings from each state for each service provider (taken at different places and during the different times of the day) was collected so that the sample size is big enough to be statistically reliable.
Type of Network- 3G/4G SIM cards were bought in the state where the audit was being conducted to be used for the same depending on service available.
Device to be used- Auditors conducted the tests through 3G/4G enabled smart phones with TRAI „MySpeed‟ application installed therein.
Place of tests- All the tests were conducted in open areas where network barriers are assumed to be minimal.
3.2.3 Qualitative Interviews: Methodology and sample for E-governance sample The main study was supplemented by a qualitative study on „Impact of QoIS on E-Governance‟. The scope of e-governance is growing with the growth in ICT and in line with the Digital India programme. The objective of this qualitative study was to gauge the impact of QoIS on provisioning of and availing e-governance services. This, therefore covered the supply side as well as the demand side of e-governance. For this purpose, a mechanism was devised for gauging the views of various e-governance service providers and their beneficiaries. This was done through in-depth audio-visual interviews (IDIs) with authorized representatives of selected service providers and beneficiaries of their service(s). The table below shows the sample plan for the qualitative interviews using audio visual facility to assess the Impact of QoIS on e-governance:
Table 3.2.2 Telecom circle wise and State wise distribution of sample for Audit of Speed Telecom
Circle States
No. of ISPs
Sample per ISP Total Audit Sample
Metro Delhi 5 20*3 = 60 300
A Gujarat 5 20*3 = 60 300
Karnataka 5 20*3 = 60 300
B Punjab 5 20*3 = 60 300 Kerala 5 20*3 = 60 300
Uttar Pradesh (incl. Uttrakhand) 5 20*3 = 60 300
C Orissa 5 20*3 = 60 300 Bihar 5 20*3 = 60 300
Total 40 - 2,400
Assessment of Impact of Quality of Internet in India and its Impact on Users October 2017
E-34,East of Kailash, New Delhi – 110065, India
URL: www.consumer-voice.org Page 94
The questionnaire in field study also posed question no. 36 and 37 to the respondents. The study was thus, two-pronged. Quantitative research methodology was supplemented with the qualitative study involving personal interviews with e-governance service providers and beneficiaries thereof.
Respondents were asked which e-governance service(s) they had used in the recent past and were asked to give a rating on the impact of QoIS on using e-governance services. Sampling techniques thus used, were purposive sampling and quota sampling. The respondents from service providers were either Public Information Officers (PIOs) or designated person (for e-governance) from the service provider office Two separate checklists were used for conducting interviews with e-governance service providers and beneficiaries. The checklists were made to capture the impact of quality of internet service on provisioning and availing of e-governance services.
Since the interviews conducted were semi- structured, the data collected have been analyzed through „Interpretative data analysis‟ technique. „Summative approach‟ of „qualitative content analysis‟ was followed. Summative content analysis not just counts the frequency of specific codes but goes beyond mere word counts to include latent content analysis. Latent content analysis alludes to the process of interpretation of content. In this analysis, the focus is on discovering underlying meanings of the words or the content.
3.3 Data Analysis
3.3.1 Descriptive Analysis A. National Level- Reported results on each of the parameters were divided into seven socio-
demographic variables: i. Telecom Circle – Metro, A, B, C
ii. Respondent Area – Urban, Rural
iii. Age categories wise – 14-18 yrs, 19-25 yrs, 26-35 yrs, 36-45 yrs, 46-55 yrs, 56 yrs & above
Table 3.2.3 Telecom Circle wise Sample distribution for E- Governance Qualitative interviews Telecom
vii. Socio Economic Classification (SEC)1 – A, B, C, D, E
B. ISP: Descriptive Comparisons Answer options related to the QoS questions have been reported at the individual level of a ISPs. However, interpretation of results based on few numbers of respondents for certain ISPs were done with caution. Descriptive “comparisons” between ISPs were considered as “trend comparisons”, not as a tool to make (quality) rankings.
3.3.2 Analytical Comparisons These results allow for making quantitative comparisons between Telecom Circles, ISPs and SECs. Results mainly refer to satisfaction variables (in case of assessing QoS), impact variable (across circles and SECs) and are reported for ISPs at the country levels, across telecom circles or SECs. These comparisons are made according to the following statistical procedures.
Overall analyses of variance.(ANOVA)
Test on homogeneity of variances within subgroups.
Variance-sensitive multiple comparisons if Fp ≤ 0.05 and if sub-group variances are homogeneous.
Variance- sensitive multiple comparisons corrected by variance-robust multiple comparisons if Fp ≤ 0.05 and if sub-group variances are unequal.
H0 hypothesis if Fp ≤ 0.05 and if sub-group variances are homogeneous.
H0 hypothesis if Fp ≤ 0.05 and if sub-group variances are unequal and if non-parametric confirmation of H0.
3.3.3 Impact Assessment & Customer Satisfaction Structural Equation Modelling (SEM) was applied to identify which QoIS parameter and underlying aspect has the highest influence on the rating of overall QoIS of various service providers available in the four telecom circles. Regression analysis was carried out to ascertain the aspects that impact most on overall rating of parameters. It also includes a short overview of each of the telecom circles showing various parameters impacted by their factors. Subsequently, SEM has been applied here as well to identify which parameter is impacted the most among all due to given quality of internet.
1SEC alludes to socio-economic classification. The New SEC system was co-developed by MRSI and MRUC. It is used to classify households in India and is based on two variables – Education of the chief wage earner and Number of consumer durables (from a predetermined list) owned by the family. There are 12 SEC classes which are A1, A2, A3, B1, B2, C1, C2, D1, D2, E1, E2 and E3 (BARC, Sep,2015) . These SECs were merged into the following categories for a more meaningful analysis- SEC A, B, C, D and E. SEC A is the affluent class, B and C together form middle class and D and E poor class. (Ramola & Velmurugan, Vol 3, Issue 1, January-March 2016).
E-34,East of Kailash, New Delhi – 110065, India
URL: www.consumer-voice.org Page 97
ANNEXURES
Assessment of Impact of Quality of Internet in India and its Impact on Users October 2017
E-34,East of Kailash, New Delhi – 110065, India
URL: www.consumer-voice.org Page 98
Annexure - A
Guidelines for interviewing Consumers and Service Providers for Situational Analysis
Discussion Guidelines – Consumers
BASIC INFORMATION
1. Do you use internet on mobile, desktop or tablet? (Prepaid or Postpaid) 2. What is your monthly expenditure on internet? 3. Do you think you are getting value for money? 4. What is your general perception on Quality of Internet Service that you get? 5. Does the quality of internet services impact lives? How?
GENDER ISSUES
6. Does internet impact men and women same way? 7. Does it have any impact on the status of women?
SOCIAL INTERACTIONS
8. Do you interact socially with people online 9. How is the experience? 10. Do you think the quality of internet services affect social interactions online?
HEALTH
11. Have you or anyone you came across of using internet in health care of medical service? 12. How is the experience? 13. Do you think quality of internet services impact healthcare or medical services?
EDUCATION
14. Have you or anyone you know used internet for education? 15. Is internet helpful in teaching or learning? 16. Do you think quality of internet affects education?
RESEARCH
17. Do you use or know about use of internet for research? 18. Are there any advantages of using internet? Are there any for research? 19. Does the quality of internet services impact research?
ONLINE SHOPPING
20. Have you ever shopped online? Through app or website? 21. How does quality of internet affect online shopping?
Assessment of Impact of Quality of Internet in India and its Impact on Users October 2017
E-34,East of Kailash, New Delhi – 110065, India
URL: www.consumer-voice.org Page 99
TRAVELLING
22. Have you ever bought online train/air/bus tickets? 23. If yes, share your experience? 24. Have you ever bought online travel/ holiday packages? If yes share your experience. 25. How does the quality of internet impacts on such transactions and packages? 26. Do you use GPS and Maps for navigation? If yes, how often? 27. How is your experience of using them? 28. How does quality of internet impact GPS and Maps?
FINANCIAL DIGITALIZATION
29. Have you ever made online payment? 30. If yes, how was the experience? 31. How do you think quality of internet affects online payment experience?
JOBS AND EMPLOYMENT
32. Have you or anyone you know used online job search? 33. How was the experience? 34. Do you think the quality of internet service has an impact on this? 35. Does internet have any impact on your job or work? 36. Does internet have any impact on work-life of a married woman? If yes, what?
ENTERTAINMENT & PORNOGRAPHY
37. Do you watch movies or videos online? 38. How is your experience? 39. How will quality of internet influence your experience of watching movies online? 40. What do you think of internet pornography? 41. Do you think quality of internet has an impact on pornography viewing and downloading experience?
GAMES AND GAMBLING
42. Have you ever engaged in online gaming or gambling? 43. How was your experience? 44. Do you think quality of internet has an impact on online gaming or gambling experience?
DATING AND MARRIAGE
45. Have you or anyone you know used dating or matrimonial sites? 46. How was the experience? 47. Does the quality of internet services impact the experience of using dating and matrimonial sites?
PEOPLE WITH SPECIAL NEEDS
48. Do you know anyone who has health problem or differently-abled and has benefitted from internet?
Assessment of Impact of Quality of Internet in India and its Impact on Users October 2017
E-34,East of Kailash, New Delhi – 110065, India
URL: www.consumer-voice.org Page 100
49. Do you think quality of internet services impact such people with special needs?
PUBLIC AND CIVIC ISSUES
50. Do you think internet has made it easier to reach out to political/public representatives? What is the role of quality of internet on this?
51. How does quality of internet impacts participation in public community matters?
QoS AND QoE
52. Are there suitable plans available for your requirement? 53. Do the service providers provide information on minimum download speed in its plan on their vouchers,
website and advertisements? 54. Do the services providers provide relevant and understandable information related to tariff plans & charges? 55. Are the recharge offer/voucher/ data provided by service providers transparent i.e. such as availability of
internet usage etc? 56. Are bills for internet usage provided by service providers are clear in terms of accuracy, transparency and
understandability? 57. How is the network and signal connectivity (in your area) of your service provider? 58. How is the availability/ accessibility and Effectiveness of Help services/ customer care of your service
providers 59. What is your overall perception on Quality of Internet Service that you get?
TOUCH POINTS
60. Do you or anyone you know used cyber cafe? If, yes, how does the quality of internet affect them? 61. Have you used Wi-fi hotspots at public places in India like RailTel hotspot, metro etc.? How was the
experience? 62. How does quality of internet play a role at these places?
NON-USERS
63. Do you know anyone who does not use internet? If yes, do you feel they are at disadvantages and loosing in some way?
Assessment of Impact of Quality of Internet in India and its Impact on Users October 2017
E-34,East of Kailash, New Delhi – 110065, India
URL: www.consumer-voice.org Page 101
Discussion Guidelines – Service Provider (Broadband)
1. When did you enter the internet service (broadband/ dongle/ data) in your circle?
2. How long (no. of hours/ days) does it take to provide connection after registration? Discuss separately for mobile data and broadband/ dongle services
3. What is your subscriber base in India? Discuss separately for mobile data/ broadband/ dongle services
4. What is total bandwidth in a particular area and its utilization? Also tell us about speed availability and uptime of your service availability.
5. Does the company inform the subscriber about tariff plans before enrolment? What is the procedure followed for the same? Discuss separately for broadband/ mobile data and dongle services.
6. What are the documents required from a new broadband/ dongle subscribers (with and without telephone connection) before providing the service?
7. What is the process of installation of broadband service after the registration and how much time does it take after installation?
8. Do you intimate the client about the tariff plan, charges etc. after the activation of data/ broadband/ dongle service? If yes, what is the mode of communication and the period within which they are informed?
9. Do you follow the guidelines laid down by TRAI with regard to standardization of bills? If yes, mention the guidelines followed.
10. Are the information related to various plans, displayed on the website? What all information is displayed on the website for the benefit of the subscriber?
11. What is the provision for a consumer to check the broadband/dongle speed provided at particular time. Please explain the process? Also explain what are the limitations in providing the speed claimed by the providers.
12. What are the various modes of payment available to subscriber? In case of e-payment system what steps are taken to make e-payment safe and secure and also steps taken to make subscribers aware of this system.
13. What are the major fault incidences encountered by your subscribers and how do you solve those faults.
14. Is there stipulated fault repair time for different fault incidences? Please explain in brief. What are the major guidelines in case the fault is not repaired with the stipulated time?
15. How are complaints handled by the company? Is there any mechanism meant for recording and attending the complaint? Also, mention the timeline within which a particular complaint is resolved..
16. Is there any feedback mechanism followed by the company? If yes, give details.
17. What steps do you take to enhance the problem solving ability of your customer care executive?
Assessment of Impact of Quality of Internet in India and its Impact on Users October 2017
E-34,East of Kailash, New Delhi – 110065, India
URL: www.consumer-voice.org Page 102
18. What is the dispute settlement mechanism followed by your company? How do you make customer aware of such a mechanism and when ? Is there any timeline specified for the resolution of complaints. Please explain in detail.
19. Do you serve notice to your subscriber in case of cessation of service due to non- payment of bills or any other reasons. What is the grace period given before the cessation of service?
20. What is your security refund policy in case the customer decides for the cessation of broadband service. Please specify the time period for refund of security deposits etc.
Assessment of Impact of Quality of Internet in India and its Impact on Users October 2017
E-34,East of Kailash, New Delhi – 110065, India
URL: www.consumer-voice.org Page 103
Annexure - B
List of Key Factors Generated From Situation Analysis A. QUALITY PARAMETERS
1. Quality
1.1. Minimum download speed 1.2. Consistency of speed 1.3. Broadband Speed post-throttling 1.4. Actual vs. committed speed 1.5. Uniform uploading and downloading speed 1.6 Availability of globally competitive speed
2. AVAILABILITY 2.1. Easy Availability of plan related information 2.2. Understandable and transparent information on plans (local language) 2.3 Intimation of changes in plans 2.4 Availability of top-up plans
3. RELIABILITY 3.1. Uninterrupted Service at all places 3.2. Effective roaming services
4. BILLING & CHARGES 4.1. Clear and Transparent Bill/charges 4.2. Regular alert on data consumption. 4.3. Data delivery as per commitment 4.4. Transparent Loyalty programme such as Add-ons etc 4.5. Transparent data consumption policy 4.6. Default activation of plans and its charges
5. HELP SERVICES (CUSTOMER SERVICES) 5.1. Easy multi-point accessibility to Help Services 5.2. Effectiveness of Help Services 5.3. Accessibility of customer care executive (waiting time) 5.4. Soft skills & etiquette of the customer care executive 5.5. Customer care executives ability to solve the problem 5.6. Customer care executives equipped with adequate information 5.7. Efficient handling of problems 5.8. Transparent Dispute Settlement mechanism 5.9. Transparent Refund policy 5.10. Feedback mechanism after resolution/non resolution of the complaint 5.11. Provision of technicians as and when required.
6. OVERALL QUALITY 6.1. Process of termination of service 6.2. Comparison with digitally advanced countries
Assessment of Impact of Quality of Internet in India and its Impact on Users October 2017
E-34,East of Kailash, New Delhi – 110065, India
URL: www.consumer-voice.org Page 104
6.3. Adequate Value for Money (Paisa Vasool) 7. PUBLIC HOTSPOT
7.1. Ease of connectivity 7.2. Regular and uninterrupted connectivity 7.3. Adequate speed 7.4. Adequate Security measures 7.5. Adequate free time 7.6. Reasonable charges after free time
8. CYBER-CAFÉ 8.1. Visit to the cyber café 8.2. Adequate speed 8.3. Reasonable charges
a. Resolution of consumer detriment through social media 9.3. Reduces Generation Gap
a. Broadens knowledge base of Younger generation b. Keeps older generation updated of ongoing trends
9.4. Better coordination 9.5. Urban-Rural Divide 9.6. Time Management 9.7. Convenience of use 9.8. Enhances understandability of web content 9.9. Enhances self reliance
10. FAMILY & RELATIONSHIP 10.1. Helps in Child Upbringing 10.2. Helps in building personal/ profession Relation 10.3. Helps in managing personal/ professional relations
11. EVERYDAY LIFE 11.1. Helps in managing routine life 11.2. Helps in availing basic service 11.3. Helps in effective use of free Time 11.4. Helps in enhancing cultural values 11.5. Helps in raising standard of living 11.6. Understanding of global culture 11.7. Effective tracking system
12. BEHAVIORAL MANAGEMENT 12.1. Keeps one Overall Happy 12.2. Effective in managing the stress 12.3. Helps in keeping focus on important activities
13. GENDER ISSUES
Assessment of Impact of Quality of Internet in India and its Impact on Users October 2017
E-34,East of Kailash, New Delhi – 110065, India
URL: www.consumer-voice.org Page 105
13.1. Enhances Overall Women Empowerment 13.2. Encourage women to travel confidently 13.3. Provide opportunity to work-from-home 13.4. Better management of household affair 13.5. Enhances sharing of happiness and pain 13.6. Helps in bridging gap with men folk 13.7. Helps in converting women centric work opportunity 13.8. Helps in gender justice society
14. RURAL SCENARIO 14.1. Helps in building bridge with urban society 14.2. Helps in building bridge with other rural areas 14.3. Enhances employability in urban area 14.4. Better access to higher education 14.5. Helps in enhancing agrarian processes 14.6. Helps and enhances rural farmers access to lucrative market 14.7. Access to better transport facility 14.8. (Timely) Access to better Health services 14.9. Access to public service and information 14.10. Growth in scope of earning and opening new ways of earning 14.11. Enhances ability to search for knowledge 14.12. Enhancing participation of women in sports 14.13. Extent of online transaction 14.14. Bring down overall expenses 14.15. Access to professional consultant 14.16. Access to current/ latest information & policies related to rural India
C. HUMAN CAPITAL
15. EDUCATION
15.1. Access to information & database 15.2. Enhances learning 15.3. Improved performance/results 15.4. Enhances live chatting/tutorial 15.5. Use of teaching aids and Smooth flow of teaching session 15.6. Smooth flow of teaching session 15.7. Spontaneity of Learning & Exploration 15.8. Wider choices of courses and institutes 15.9. Reduces geographical barriers for pursuing courses from abroad 15.10. Accessibility to attend Massive open online courses (MOOCs) 15.11. Stimulation of interest in subject 15.12. Facilitates learning foreign languages 15.13. Skill Enhancement 15.14. Access to competitive exams/tests 15.15. Help in preparing projects/ assignment/ reports. 15.16. Ease to provide online study material to student.
Assessment of Impact of Quality of Internet in India and its Impact on Users October 2017
E-34,East of Kailash, New Delhi – 110065, India
URL: www.consumer-voice.org Page 106
16. HEALTH 16.1. Fitness Guidance & Training 16.2. Health-care communities (Yoga & Gym groups) 16.3. Access to home remedies 16.4. Menstrual tracker 16.5. Maintenance & Tracking of Health records 16.6. Physical Activity Tracker 16.7. Delivery of health services to villagers 16.8. Online health education/information 16.9. Booking Medical Appointments 16.10. Access to better medical facility (in India and cross border) 16.11. Enhancing communication with general physician 16.12. Better knowledge of prescribed medicines 16.13. Access online diagnostic report
17. HABITS 17.1. Enhancing reading habits 17.2. Access to hobby classes 17.3. Sharing and building of recreational activities 17.4. Sharing of media related habits
18. RESEARCH 18.1. Access to proprietary material only from the authorized connection 18.2. Access to global resources 18.3. Filtration of information 18.4. Efficacy of plagiarism tools 18.5. Ease of data collection 18.6. Enables collaborative research
D. SOCIAL CAPITAL
19. INTERACTIONS
19.1. Helps in efficient Planning & organizing events 19.2. Expansion of social network 19.3. Enhance Social Connectivity 19.4. Minimising communication gap 19.5. Help in the formation of Social/ professional groups
20. DATING & MARRIAGE 20.1. Wider choice in seeking matrimonial alliances 20.2. Seeking a partner as per family/community expectations
21. POLITICAL PARTICIPATION
21.1. Willingness to contribute to society 21.2. Contacting for help in times of need 21.3. Organizing rallies & protests 21.4. Accessibility/Availability of political representatives 21.5. Raising voice against social barriers/issues
Assessment of Impact of Quality of Internet in India and its Impact on Users October 2017
E-34,East of Kailash, New Delhi – 110065, India
URL: www.consumer-voice.org Page 107
21.6. Application & Effectiveness of government portal/apps 21.7. Seeking accountability from political representative 21.8. Helps in reducing barrier between leader and populace 21.9. Increase transparencies across political spectrum 21.10. Wider exposure to Govt’s plan and policies 21.11. Enhances participatory democracy 21.12. Participation in online political groups
22. PEOPLE WITH SPECIAL NEEDS 22.1. Helps in building and managing Social support network 22.2. Enhances Unity of communities 22.3. Enhances capability, skill & confidence (Listening to audio books & news by visually impaired) 22.4. Makes people self-dependent 22.5. Increase in opportunities 22.6. Access to government facilities 22.7. Help in earning
E. LEISURE/RECREATIONAL
23. TOURISM
23.1. Instant & convenient booking of holiday package 23.2. Empowers people to travel alone 23.3. Access to competitive travel packages 23.4. Wider choices (Selection of seats & availing offers/discounts) 23.5. Ability to manage work while vacations
24. GAMES & GAMBLING 24.1. Live updates of scores 24.2. Competitive Spirit & Fun 24.3. Place instant bets 24.4. Access to Analytical tools/ presentations Graphic Quality 24.5. Enhances flow of game 24.6. Stimulation & Generation of Interest 24.7. Accessibility to gaming sites 24.8. Group gaming experience
25. HOBBIES 25.1. Ease in pursuing hobbies 25.2. Provide wider choices for selling art 25.3. Communication with likeminded people 25.4. Helps in enhancing of artistic skills 25.5. Helps in inventing new form of art.
26. ENTERTAINMENT & PORNOGRAPHY 26.1. Selection of event seats 26.2. Enhance Entertainment Experience 26.3. Low buffering experience 26.4. Higher Video Quality
Assessment of Impact of Quality of Internet in India and its Impact on Users October 2017
E-34,East of Kailash, New Delhi – 110065, India
URL: www.consumer-voice.org Page 108
26.5. Unlimited Viewing 26.6. Gratification of Emotions/Desires 26.7. Stress Buster 26.8. Boosts Knowledge 26.9. Real-time exchange of songs & videos
F. FINANCE/ECONOMIC NEEDS
27. BUSINESS & JOBS
27.1. Quality of business meetings 27.2. Work-from-home 27.3. Induces Revenue, Profit and Income 27.4. Enhances feedback mechanism 27.5. Enhances Supervision & Tracking 27.6. Facilitates Filing of e-forms and returns 27.7. Enhancing Quality of work through higher Women participation in specialized work 27.8. Access to greater pool of prospective candidates for recruitment 27.9. Stimulation of ideas for creative work 27.10. Ease in conducting business from home country 27.11. Reinforcement of conventional industries 27.12. Maintaining work-life balance 27.13. Work through email & social media 27.14. Greater economic participation 27.15. Help in searching jobs 27.16. Enhance the Quality of work 27.17. Time duration to finish a task 27.18. Facilitates internet driven work 27.19. Enhance e-bidding
28. SHOPPING 28.1. Enables better deals 28.2. Flash sale discounts 28.3. Processing time of cart 28.4. Number/choice of options 28.5. Filter, reset and search process 28.6. Informed decision making 28.7. Impact of e-WOM (word of mouth) 28.8. Online tracking of shipment 28.9. Convenient shopping – Time and location 28.10. Time taken by websites & items to open
29. TRAVEL & TRANSPORTATION 29.1. Navigational support 29.2. Reduce cost of commuting 29.3. Accuracy of location services 29.4. Effective Cab Booking 29.5. Efficient distribution system
Assessment of Impact of Quality of Internet in India and its Impact on Users October 2017
E-34,East of Kailash, New Delhi – 110065, India
URL: www.consumer-voice.org Page 109
29.6. Reduced dependency on others 29.7. Efficient transportation system 29.8. Impact on delivery cost
30. DIGITAL PAYMENTS & BANKING 30.1. Redirection & Confirmation of payment 30.2. Debit of amounts 30.3. Live updates on banking transactions 30.4. Re-Generation of OTPs 30.5. Efficient fund transfer 30.6. Paying exact amount results in savings ( No need to ask for change) 30.7. Ease to pay bills (ebills) 30.8. Save time
Assessment of Impact of Quality of Internet in India and its Impact on Users October 2017
E-34,East of Kailash, New Delhi – 110065, India
URL: www.consumer-voice.org Page 110
Annexure- C
List of Factors treated in IIM
A. QUALITY PARAMETERS Total
factors
1. Quality
1.1. Minimum download speed 1.2. Consistency of speed 1.3. Broadband Speed post-throttling 1.4. Actual vs. committed speed 1.5. Uniform uploading and downloading speed 1.6.Availability of global standard speed
6
2. AVAILABILITY
2.1. Availability of plan related information 2.2. Clear and transparent information on plans (local language) 2.3.Intimation of changes in plans 2.4 Availability of top-up plans
4
3. RELIABILITY 3.1. Uninterrupted Service at all places 3.2. Effective roaming services
2
4. BILLING & CHARGES 4.1. Clear and Transparent Bill/charges (post-paid) 4.2. Regular alert on data consumption. 4.3. Data delivery as per commitment 4.4. Transparent Loyalty programme such as Add-ons etc 4.5. Transparent data consumption policy 4.6. Default application of plans and its charges
6
5. HELP SERVICES 5.1. Easy accessibility to Help Services 5.2. Effectiveness of Help Services 5.3. Accessibility of customer care executive (waiting time) 5.4. Soft skills & etiquette of the customer care executive 5.5. Customer care executives ability to solve the problem 5.6. Customer care executives equipped with adequate information 5.7. Efficient handling of problems 5.8. Transparent Dispute Settlement mechanism 5.9. Transparent Refund policy 5.10. Feedback mechanism after resolution/non resolution of the complaint 5.11. Provision of technicians as and when required.
11
6. OVERALL QUALITY 6.1. Process of termination of service 6.2. Comparison with International Standards 6.3. Value of Money
3
Assessment of Impact of Quality of Internet in India and its Impact on Users October 2017
E-34,East of Kailash, New Delhi – 110065, India
URL: www.consumer-voice.org Page 111
7. PUBLIC HOTSPOT 7.1. Ease of connectivity 7.2. Regular and uninterrupted connectivity 7.3. Adequate speed 7.4. Adequate Security measures 7.5. Adequate free time 7.6. Reasonable charges after free time
6
8. CYBER-CAFÉ 8.1. Visit to the cyber café 8.2. Adequate speed 8.3. Reasonable charges
3
B. GENERAL & UMBRELLA ISSUES
9. GENERAL USES OF INTERNET 9.1. Minimizes geographical barriers 9.2. Empowers consumers
9.2.a. Resolution of consumer detriment through social media 9.3. Reduces Generation Gap
9.3.a. Broadens knowledge base of Younger generation 9.3.b. Keeps older generation updated of ongoing trends
9.4. Better coordination 9.5. Urban-Rural Divide 9.6. Time Management 9.7. Convenience of use 9.8. Enhances understandability of web content 9.9. Enhances self reliance
9
10. FAMILY & RELATIONSHIPS 10.1. Helps in Child Upbringing 10.2. Helps in building personal/ profession Relation 10.3. Helps in managing personal/ professional relations 10.4. An effective tool in managing relations
4
11. EVERYDAY LIFE 11.1. Helps in managing routine life 11.2. Helps in availing basic service 11.3. Helps in effective use of free Time 11.4. Helps in enhancing cultural values 11.5. Helps in raising standard of living 11.6. Understanding of global culture 11.7. Effective tracking system\
7
12. BEHAVIORAL MANAGEMENT 12.1. Keeps one Overall Happy 12.2. Effective in managing the stress 12.3. Helps in keeping focus on important activities
3
Assessment of Impact of Quality of Internet in India and its Impact on Users October 2017
E-34,East of Kailash, New Delhi – 110065, India
URL: www.consumer-voice.org Page 112
13. GENDER ISSUES 13.1. Enhances Overall Women Empowerment 13.2. Encourage women to travel confidently 13.3. Provide opportunity to work-from-home 13.4. Better management of household affair 13.5. Enhances sharing of happiness and pain 13.6. Helps in bridging gap with men folk 13.7. Helps in converting women centric work opportunity 13.8. Helps in gender justice society
8
14. RURAL SCENARIO 14.1. Helps in building bridge with urban society 14.2. Helps in building bridge with other rural areas 14.3. Enhances employability in urban area. 14.4. Better access to higher education 14.5. Helps in enhancing agrarian processes 14.6. Helps and enhances rural farmers access to lucrative market 14.7. Access to better transport facility 14.8. (Timely) Access to better Health services 14.9. Access to public service and information 14.10. Growth in scope of earning and opening new ways of earning 14.11. Enhances ability to search for knowledge 14.12. Enhancing participation of women in sports 14.13. Extent of online transaction 14.14. Bring down overall expenses 14.15. Access to professional consultant 14.16. Access to current/ latest information & policies related to rural India
16
C. HUMAN CAPITAL
15. EDUCATION 15.1. Access to information & database 15.2. Enhances learning 15.3. Improved performance/results 15.4. Enhances live chatting/tutorial 15.5. Use of teaching aids 15.6. Smooth flow of teaching session 15.7. Spontaneity of Learning & Exploration 15.8. Wider choices of courses and institutes 15.9. Reduces geographical barriers for pursuing courses from abroad 15.10. Accessibility to attend Massive open online courses (MOOCs) 15.11. Stimulation of interest in subject 15.12. facilitates learning foreign languages 15.13. Skill Enhancement 15.14. Access to competitive exams/tests 15.15. Help in preparing projects/ assignment/ reports. 15.16. Ease to provide online study material to student.
16
Assessment of Impact of Quality of Internet in India and its Impact on Users October 2017
E-34,East of Kailash, New Delhi – 110065, India
URL: www.consumer-voice.org Page 113
16. HEALTH 16.1. Fitness Guidance & Training 16.2. Health-care communities(Yoga & Gym groups) 16.3. Access to home remedies 16.4. Menstrual trackers 16.5. Maintenance & Tracking of Health records 16.6. Physical Activity Tracker 16.7. Delivery of services to villagers 16.8. Online health education/information 16.9. Booking Appointments 16.10. Access to better medical facility (cross border) 16.11. Enhancing communication with general physician 16.12. Better knowledge of prescribed medicines 16.13. Access online diagnostic report
13
17. HABITS 17.1. Enhancing reading habits 17.2. Access to hobby classes 17.3. Sharing and building of recreational activities 17.4. Sharing of media related habits
4
18. RESEARCH 18.1. Access to proprietary material only from the authorized connection 18.2. Access to global resources 18.3. Filtration of information 18.4. Efficacy of plagiarism tools 18.5. Ease of data collection 18.6. Enables collaborative research
6
D. SOCIAL CAPITAL
19. INTERACTIONS 19.1. Helps in efficient Planning & organizing events 19.2. Expansion of social network 19.3. Enhance Social Connectivity 19.4. Minimising communication gap 19.5. Help in the formation of Social/ professional groups.
5
20. DATING & MARRIAGE 20.1. Wider choice in seeking matrimonial alliances 20.2. Seeking a partner as per family/community expectations
2
21. POLITICAL PARTICIPATION 21.1. Willingness to contribute to society 21.2. Contacting for help in times of need 21.3. Organizing rallies & protests 21.4. Accessibility/Availability of political representatives 21.5. Raising voice against social barriers/issues 21.6. Application & Effectiveness of government portal/apps 21.7. Seeking accountability from political representative 21.8. Helps in reducing barrier between leader and populace 21.9. Increase transparencies across political spectrum 21.10. Wider exposure to Govt’s plan and policies 21.11. Enhances participatory democracy 21.12. Participation in online political groups
12
Assessment of Impact of Quality of Internet in India and its Impact on Users October 2017
E-34,East of Kailash, New Delhi – 110065, India
URL: www.consumer-voice.org Page 114
22. PEOPLE WITH SPECIAL NEEDS 22.1. Helps in building Social support network 22.2. Enhances Unity of communities 22.3. Enhances capability, skill & confidence (Listening to audio books & news
by visually impaired) 22.4. Makes people self-dependent 22.5. increase in opportunities 22.6. Access to government facilities 22.7. Help in earning
7
E. LEISURE/RECREATIONAL
23. TOURISM 23.1. Instant & convenient booking of holiday package 23.2. Empowers people to travel alone 23.3. Access to competitive travel packages 23.4. Wider choices (Selection of seats & availing offers/discounts) 23.5. Ability to manage work while vacations
5
24. GAMES & GAMBLING 24.1. Live updates of scores 24.2. Competitive Spirit & Fun 24.3. Place instant bets 24.4. Access to Analytical tools/ presentations Graphic Quality 24.5. Enhances flow of game 24.6. Stimulation & Generation of Interest 24.7. Accessibility to gaming sites 24.8. Group gaming experience
8
25. HOBBIES 25.1. Ease in pursuing hobbies 25.2. Provide wider choices for selling art 25.3. Communication with likeminded people 25.4. Helps in enhancing of artistic skills 25.5. Helps in inventing new form of art.
5
26. ENTERTAINMENT & PORNOGRAPHY 26.1. Selection of event seats 26.2. Enhance Entertainment Experience 26.3. Low buffering experience 26.4. Higher Video Quality 26.5. Unlimited Viewing 26.6. Gratification of Emotions/Desires 26.7. Stress Buster 26.8. Boosts Knowledge 26.9. Real-time exchange of songs & videos
9
F. FINANCE/ECONOMIC NEEDS
27. BUSINESS & JOBS 27.1. Quality of business meetings 27.2. Work-from-home & discretion 27.3. Induces Revenue, Profit and Income 27.4. Enhances feedback mechanism 27.5. Enhances Supervision & Tracking
19
Assessment of Impact of Quality of Internet in India and its Impact on Users October 2017
E-34,East of Kailash, New Delhi – 110065, India
URL: www.consumer-voice.org Page 115
27.6. Facilitates Filing of e-forms and returns 27.7. Enhancing Quality of work through higher Women participation in
specialized work 27.8. Access to greater pool of prospective candidates for recruitment 27.9. Stimulation of ideas for creative work 27.10. Ease in conducting business from home country 27.11. Reinforcement of conventional industries 27.12. Maintaining work-life balance 27.13. Work through email & social media 27.14. Greater economic participation 27.15. Help in searching jobs 27.16. Enhance the Quality of work 27.17. Time duration to finish a task 27.18. Facilitates internet driven work 27.19. Enhance e-bidding 28. SHOPPING 28.1. Enables better deals 28.2. Flash sale discounts 28.3. Processing time of cart 28.4. Number/choice of options 28.5. Filter, reset and search process 28.6. Informed decision making 28.7. Impact of e-WOM (word of mouth) 28.8. Online tracking of shipment 28.9. Convenient shopping – Time and location 28.10. Time taken by websites & items to open
10
29. TRAVEL & TRANSPORTATION 29.1. Navigational support 29.2. Reduce cost of commuting 29.3. Accuracy of location services 29.4. Effective Cab Booking 29.5. Efficient distribution system 29.6. Reduced dependency on others 29.7. Efficient transportation system 29.8. Impact on delivery cost
8
30. DIGITAL PAYMENTS & BANKING 30.1. Redirection & Confirmation of payment 30.2. Debit of amounts 30.3. Live updates on banking transactions 30.4. Re-Generation of OTPs 30.5. Efficient transaction 30.6. Paying exact amount results in savings ( No need to ask for change) 30.7. Ease to pay bills (ebills) 30.8. Save time
8
Assessment of Impact of Quality of Internet in India and its Impact on Users October 2017
E-34,East of Kailash, New Delhi – 110065, India
URL: www.consumer-voice.org Page 116
Total number of Dimensions and Factor SNo. Dimensions Total no. of factors
1 QUALITY 6 2 AVAILABILITY 4 3 RELIABILITY 2 4 BILLING & CHARGES 6 5 HELP SERVICES 11 6 OVERALL QUALITY 3 7 PUBLIC HOTSPOT 6 8 CYBER-CAFÉ 3 9 GENERAL USES OF INTERNET 9
10 FAMILY & RELATIONSHIPS 4 11 EVERYDAY LIFE 7 12 BEHAVIORAL MANAGEMENT 3 13 GENDER ISSUES 8 14 RURAL SCENARIO 16 15 EDUCATION 16 16 HEALTH 13 17 HABITS 4 18 RESEARCH 6 19 INTERACTIONS 5 20 DATING & MARRIGES 2 21 POLITICAL PARTICIPATION 12 22 PEOPLE WITH SPECIAL NEEDS 7 23 TOURISM 5 24 GAMES & GAMBLING 8 25 HOBBIES 5 26 ENTERTAINMENT &PORNOGRAPHY 9 27 BUSINESS & JOBS 19 28 SHOPPING 10 29 TRAVEL & TRANSPORTATION 8 30 DIGITAL PAYMENTS & BANKING 8
Total factors 225
Assessment of Impact of Quality of Internet in India and its Impact on Users October 2017
6. Reliance Jio 12. a. Which Dongle network are you on?
2G 3G 4G
2.1 Avg. hours use daily 2.2 Avg. hours use daily 2.3 Avg. hours use daily
3.1 Avg. expenditure per month 3.2 Avg. expenditure per month 3.3 Avg. expenditure per month
4. Main mode of internet service:. (It is the mode on which all the responses will be recorded. It will be determined either on highest average hours of daily use or on which respondents feels comfortable to respond.) 5. Quality parameters: On each of the aspects listed below rank on scale of O to 1 to 5 where 0 is cant say, 1 is Poor ……and 5 is
Excellent
5.1 Availability
Understandable
and transparent information on plans (local language)
Notification of changes in plans
Other(specify) ………………
5.2 Speed
Downloading
speed
Consistency of downloading speed
Uploading speed
Speed as per commitment
Other(specify) ………………
5.3 Reliability
Uninterrupted
Service at all times
Uninterrupted Service at all places (only to be asked to Mobile/Dongle subscribers)
Effective roaming services(only to be asked to Mobile/Dongle subscribers)
Other(specify) ………………
5.4 Billing &charges
Clear and
Transparent Bill/charges
Transparent data consumption policy and regular alert on data consumption
Charging for renewal/ activation of plan without notification
Other(specify) ………………
5.5 Help/ Customer care
Ease in accessing help services through various modes
Accessibility and effectiveness of CCE
Efficient handling of problems
Transparent Dispute Settlement mechanism
Transparent Refund policy
Provision of technicians as and when required. (Only for broadband)
Other (specify)….
Assessment of Impact of Quality of Internet in India and its Impact on Users October 2017
E-34,East of Kailash, New Delhi – 110065, India
URL: www.consumer-voice.org Page 118
6. How would you rate overall quality of internet service on a scale of 1 to 5, where 1 is Poor ……and 5 is
Excellent
GENERAL AND UMBRELLA ISSUES 7. Internet has become a NECESSITY IN LIFE. Do you
agree with this statement?
Yes
No (go to…Q10)
No experience/ can’t say (go to…Q10)
8. Give your assessment on how quality of internet has
had impact on various aspects of life, on a scale of 0 to 5 and 9 where, 0 stands for no impact, 1 is low impact ……and 5 is highest impactand 9 for can’t say
Good quality of internet has/ can impact …….. helps in better communication (9.4) (19.4) helps in time management (9.6) emotions & stress management enhancing overall happiness ( 12.1) enhancing professional & personal network
(19.2) (19.5)
raising standard of living (11.5) understanding global culture (11.6) reducing dependency on others (29.6) efficient planning and organizing events
(19.1)
ability to manage work while vacationing (23.5)
enhancing entertainment experience and exchange of songs & videos
purchase of tickets & selection of event seat promoting ease in digital payment / net-
banking
promoting gender-equality empowering consumers (9.2) helps in child upbringing- intelligence,
knowledge (10.1)
other (specify)…….
9. How would you rate overall impact of quality of internet on your DAILY LIFE on a scale of 1 to 5 where 1 is low
impact ……and 5 is highest impact?
10. Internet has had great impact in developing the RURAL AREA. Do
you agree with this statement?
Yes
No(go to…Q13)
No experience/ can’t say (go to…Q13) 11. Give your assessment on how quality of internet has impacted
RURAL AREA in terms of social and economic development, on a scale of 0 to 5 and 9 where, 0 stands for no impact, 1 is low impact ……and 5 is highest impact and 9 for can’t say
Good quality of internet in rural area has/ can impact…. bridging gap with urban areas(14.1) (9.5)
bridging gap with other rural areas better access to higher education (14.4) access to public services(transport, health etc.) and
latest information (14.9) enhancing employability of rural people in urban
areas (14.3)
growth in scope of earning (14.10)
improves farming processes (14.5)
rural farmers access to new markets (14.6)
other (specify)………
12. How would you rate overall impact of quality of internet on
RURAL AREA on a scale of 1 to 5 where 1 is low impact
……and 5 is highest impact?
Assessment of Impact of Quality of Internet in India and its Impact on Users October 2017
E-34,East of Kailash, New Delhi – 110065, India
URL: www.consumer-voice.org Page 119
13. Internet has considerable impact on EDUCATION and
RESEARCH? Do you agree with this statement?
Yes
No (go to…Q16)
No experience/ can’t say (go to…Q16)
14. Give your assessment on how quality of internet has had
impact on various aspects of EDUCATION and RESEARCH, on a scale of 0 to 5 and 9 where, 0 stands for no impact, 1 is low impact ……and 5 is highest impact and 9 for can’t say
Good quality internet of has/ can impact on……..
access to information & global databases (15.1)
enhancing skills and learning (15.2)
performance / result improvement (15.3)
attending online courses and live tutorial/chatting (15.9)
taking competitive exams / tests (15.13)
preparing projects/ assignments/ reports (15.14)
providing online material to students (15.15)
ease of data collection (18.5)
other (specify)…….
15. How would you rate overall impact of quality of internet on EDUCATION AND RESEARCH on a scale of 1 to 5 where 1 is
low impact ……and 5 is highest impact?
16. Internet has had a considerable role in the availability & improvement of HEALTH AND MEDICAL SERVICES in India.
Do you agree with this statement?
Yes
No(go to…Q19)
No experience/ can’t say (go to…Q19)
17. Give your assessment on how quality of internet has had impact on various aspects of HEALTH AND MEDICAL SERVICES, , on a scale of 0 to 5 and 9 where, 0 stands for no
impact, 1 is low impact ……and 5 is highest impact and 9 for can’t
say.
Good quality of internet has/ can impact on spreading awareness related to health (16.8)
access to better medical facility – in India & cross border
availing better knowledge of prescribed medicine
delivery of health services to distant places (16.7)
maintenance & tracking of health record (16.5)
fitness guidance & training (16.1)
other (specify)……..
18. How would you rate overall impact of quality of internet on HEALTH AND MEDICAL SERVICES on a scale of 1 to 5
where 1 is low impact ……and 5 is highest impact?
19. Internet has enabled Indian citizen’s POLITICAL & CIVIC
PARTICIPATION. Do you agree with this statement? Yes
No(go to…Q22)
No experience/ can’t say (go to…Q22)
20. Give your assessment on how quality of internet has had
impact on various aspects of POLITICAL & CIVIC PARTICIPATION, on a scale of 0 to 5 and 9 where, 0 stands for no impact, 1 is low impact ……and 5 is highest impact and 9 for can’t say
Good quality has/ can impact on ……..
contacting for help in times of need (21.2)
organizing rallies and protest (21.3)
raising voices against social barriers & issues (21.5)
application & effectiveness of government portal/ apps (21.6)
wider exposure to Govt’s plan & policies (21.10)
other (specify)…….
21. How would you rate overall impact of quality of internet on
POLITICAL & CIVIC PARTICIPATION, on a scale of 1 to 5
where 1 is low impact ……and 5 is highest impact?
22. Internet has contributed to the empowerment of
PEOPLE WITH SPECIAL NEEDS. Do you agree with this
statement? Yes
No(go to…Q25)
No experience/ can’t say (go to…Q25)
HUMAN CAPITAL
Assessment of Impact of Quality of Internet in India and its Impact on Users October 2017
E-34,East of Kailash, New Delhi – 110065, India
URL: www.consumer-voice.org Page 120
23. Give your assessment on how quality of internet has had impact on various aspects in EMPOWERING PEOPLE WITH SPECIAL NEEDS, on a scale of 0 to 5 and 9 where, 0 stands for no impact, 1 is low impact ……and 5 is highest impact and 9
for can’t say
Good quality has/ can impact ……..
on building and managing social support network on enhancing capability, skill & confidence making people self-dependent increasing opportunities (22.5) availing govt’s facilities (22.6) other (specify)……. 24. How would you rate overall impact of quality of internet in
empowering PEOPLE WITH SPECIAL NEEDS on a scale of 1 to
5 where 1 is low impact ……and 5 is highest impact?
25. Internet has immense contribution in the way people manage their BUSINESSES & JOBS. Do you agree with this statement? 1. Yes
2. No(go to…Q28)
No experience/ can’t say (go to…Q28)
26. Give your assessment on how quality of internet has had impact on various aspects of DOING BUSINESS & JOBS, on a scale of 0 to 5 and 9 where, 0 stands for no
impact, 1 is low impact ……and 5 is highest impact and 9 for
can’t say
Good quality internet has/ can impact on……..
quality of business meetings (27.1) work from home (27.2) inducing revenue, profit and income (27.3) facilitating filing of e-forms and returns (27.6) promotes creative work ease in conducting business from one place to
distant places (27.10)
working through email & social media (27.12) searching jobs & getting placements(27.14) enhancing the quality of work (27.16) other (specify)…….
27. How would you rate overall impact of quality of internet on
doing BUSINESS &JOBS,on a scale of 1 to 5 where 1 is low
impact ……and 5 is highest impact?
28. Internet has immensely changed the way people do SHOPPING.
Do you agree with this statement? 1. Yes
2. No (go to 31)
No experience/ can’t say (go to 31)
29. Give your assessment on how quality of internet has had impact on various aspects of SHOPPING, on a scale of 0 to 5 and 9 where, 0 stands for no impact, 1 is low impact ……and 5 is highest impact and 9 for can’t say
Good quality has/ can impact on ……..
getting better deals & lower prices (28.1) increased number of choices(28.4) online tracking of shipment (28.8) convenient shopping – time and location (28.9) time taken by websites & items to open (28.10) other (specify)…….
30. How would you rate overall impact of quality of internet on
SHOPPING, on a scale of 1 to 5 where 1 is low impact ……and 5 is
highest impact?
31. Internet has immensely changed the way people TRAVEL
AND COMMUTE. Do you agree with the statement? 1. Yes
2. No (go to 34)
No experience/ can’t say (go to 34)
32. Give your assessment on how quality of internet has had impact
on various aspects of TRAVEL & COMMUTING, on a scale of 0 to 5 and 9 where, 0 stands for no impact, 1 is low impact ……and 5 is highest impact and 9 for can’t say
Good quality has/ can impact on …….. navigational support during travel (29.1) (29.3) effectiveness of booking a cab(29.4) accessing competitive ticket price (air, bus train)
(23.3)
booking of travel packages empowering people to travel alone (23.2) other (specify)…….
33. How would you rate overall impact of quality of internet on TRAVEL & COMMUTING, on a scale of 1 to 5 where 1 is low impact ……and 5 is highest impact?
FINANCE & ECONOMIC NEEDS
Assessment of Impact of Quality of Internet in India and its Impact on Users October 2017
E-34,East of Kailash, New Delhi – 110065, India
URL: www.consumer-voice.org Page 121
Problem, Complaint & Redress 34. On which of the following aspects did you have a problem with your service provider regarding your internet
connection?[Tick the problem/s that you had] Did you complaint to the service providers about this/ these problem/s? [Tick if “yes”] Did your provider respond on that complaint? [Tick if “yes”] Was your problem solved?[Tick on “completely”, or on “partly” or on “not at all”.]
Had this problem?
[Tick if yes]
Complained to the ISP about it? [Tick if yes]
Got a response from the ISP?
[Tick if yes]
Was your problem solved?
Completely solved
Partly solved
Not solved at all
Activation of service / Installation problem
Poor connectivity Disconnection of services without
information Speed related problem False promises Over-charging Other problem? *Specify+………. No Problem faced
Assessment of Impact of Quality of Internet in India and its Impact on Users October 2017
E-34,East of Kailash, New Delhi – 110065, India
URL: www.consumer-voice.org Page 122
35. Have you faced any loss in terms of time and money due to poor quality of internet on any of the aspects
discussed above? 1. No
2. Yes, loss in terms of time
3. Yes, loss in terms of money
4 Yes, both time and money
36. Which E-GOVERNANCE SERVICES have you used recently?(Respondent may select more than one option)
Aadhar Passport PAN IRCTC Pension Birth and Death certificate registration Filing property tax, income tax and other taxes Registration for obtaining income certificate (and
obtaining BPL/UPL cards) and domicile certificates
SC/ST/OBC certificate registration Application to various government scholarship
schemes
State run employment exchanges/Job portals Public grievance redressal / RTI Other (specify)…………………….. None of the above (go to Q 38)
37. Give your assessment on how quality of internet impacts use of E-GOVERNANCE SERVICESon a scale of 0 to 5 where, 0 stands for no impact, 1 is low impact ……and 5 is highest impact.
38. Overall which aspect has been impacted most by quality of Internet in India?
(choose 3 out of following twelve as 1. most important, 2. very important and 3.important).
Most important Very important important
1. daily life of people
2. uplifting rural society
3. women empowerment
4. education & research
5. health and medical services
6. political and civic participation
7. empowering people with special needs
8. entertainment
9. business and work
10. shopping
11. digital payment and online banking
12. travel & commuting
Assessment of Impact of Quality of Internet in India and its Impact on Users October 2017
E-34,East of Kailash, New Delhi – 110065, India
URL: www.consumer-voice.org Page 123
39. What is your gender? 1 = male 2 = female
40. How old are you?
41. What is the highest level of education completed by you and the chief wage earner in your family?
Of the respondent
Of the chief wage earner
Illiterate Literate but no formal
school/ School upto 4 yrs
School: 5 to 9 years SSC/ HSC Some College (incl.
Diploma) but not Graduate
Graduate/ Post Graduate: General
Graduate/ Post Graduate: Professional
42. What is your current professional/ occupational
situation? 1. Govt. Service 2. Public Service 3. Private Service 4. Business
43. Please take a look at the list given below and tell me which of these items do you have at home? (It could be owned by you, your family, or provided by the employer or it could be available in the house you live in; but it should be for the use of just you or your family)
CIRCLE ITEMS OWNED/HAVE AT HOME. TICK THE ITEM IF OWNED
Items owned / have access at home Circle Tick
Electricity Connection 01
Ceiling Fan 02
LPG/ PNG Stove 03
Two Wheeler 04
Colour TV 05
Refrigerator 06
Washing Machine 07
Personal Computer/ Laptop 08
Car/Jeep/Van 09
Air Conditioner 10
Agricultural Land 11
SOCIO DEMOGRAPHIC
Assessment of Impact of Quality of Internet in India and its Impact on Users October 2017
Following questions to be asked only from those respondents who have used e-gov services- either themselves or took the help of any of their friends or family members
1. Which e-governance service have you used recently?
2. Did you use it on website or mobile app? Name the app please.
3. Have you ever attended any training session on the use of e-governance services?
If yes,
a. Who organized the training session?
b. Was the training useful?
4. Do you think the quality of internet has impact on using e-governance services?
5. How much time does it take for the e-governance website to open?
6. Does the data you feed in remain saved when internet connectivity is poor or you have to feed the data again?
7. Do you have to log in again when the connectivity gets better?
8. How would you rate on a scale of 1-5 the impact of quality of internet service on e-governance where 1 stands for low impact and 5 stands for very high impact?
9. Is there any other experience pertaining to e-gov service used that you would like to share?
Assessment of Impact of Quality of Internet in India and its Impact on Users October 2017
E-34,East of Kailash, New Delhi – 110065, India
URL: www.consumer-voice.org Page 126
A. Guidelines for the Service Providers
S. No. _____ E-Gov Service__________________________Respondents’ Name________________ Designation_________________________________Phone No. _____________________________
Following questions to be asked from the E-governance service providers
1. What all services do you offer online?
2. Do you offer all these services offline also?
3. If the service is available offline also, what do you think people prefer- availing these services online or offline?
4. Do you make any efforts to publicize the online service?
5. Are these services also offered through mobile application? If yes, what is the name of mobile application?
6. If a consumer has a poor internet connection, does he need to log in again and restart the process or can continue from where he left?
7. Is there a time limit to complete the process?
8. Do you think internet infrastructure in India is developed enough to render these services to all the consumers at all the places?
9. Does the quality of internet service impact the provision of E-governance services?
10. For the people who do not use e-governance services, what do you think is the reason behind it?
E-34, East of Kailash, New Delhi – 110065, India
URL: www.consumer-voice.org Page 127
BIBLIOGRAPHY
Assessment of Impact of Quality of Internet in India and its Impact on Users October 2017
E-34, East of Kailash, New Delhi – 110065, India
URL: www.consumer-voice.org Page 128
Agarwal, R., & Day, A. E. (1998). The Impact of the Internet on Economic Education. The Journal of Economic Education , 99-110.
Alrayyes, Z. (2012, April 16). Between the virtual and physical spaces ; How does decentralization on virtual space affect social gathering in the city? Retrieved November 15, 2016, from www.academia.edu: http://www.academia.edu/2067014/Between_the_virtual_and_physical_spaces_How_does_decentralization_on_virtual_space_affect_social_gathering_in_the_city
Applebee, A. C., Clayton, P., & Pascoe, C. (1997). Australian academic use of the Internet. Internet Research , 85-94.
Assessing Future Trends and Regulatory Reforms of Telecom Sector. (2016). India Telecom 2016. New Delhi: FICCI.
Bannon, S., McGlynn, T., McKenzie, K., & Quayle, E. (2015). The positive role of Internet use for young people with additional support needs: Identity and Connectedness. Computers in Human Behavior , 504-514.
Bellou, A. (2014). The impact of Internet diffusion on marriage rates: evidence from broadband market. Springer , 265-297.
Bendre, R. (2016, September 28). Google in talks to partner Indian government for UPI, Aadhaar integration. BGR . Essel Group.
BEUC . (2012). BEREC Guidelines for Quality of Service in the scope of Net Neutrality: BEUC response to the public consultation.
Brignal III, T. W., & Valey, T. V. (2005). The Impact of Internet Communications on Social Interaction. Sociological Spectrum , 335-348.
Brustein, J. (2016). Uber and Lyft Want to Replace Public Buses. NDTV .
Business today. (2016, feb 4). Retrieved october 2016, from http://www.businesstoday.in/sectors/telecom/india-to-have-371-million-mobile-internet-users-by-june/story/228805.html
businessinsider.in. (2016, December 07). 8 tech tripping points we will reach by 2030. ET Panache . Delhi, Delhi, India: Economic Times.
Castaneda, J. A., Frias, D. M., & Rodriguez, M. A. (2007). The influence of the internet on destination satisfaction. Internet Research , 17.
Catlin, T., Khanna, S., Lorenz, J. T., & Sultan, S. S. (2016). Making digital strategy a reality in insurance. McKinsey&Company.
Centre for Communication Governance. (2016). INCIDENTS OF INTERNET SHUTDOWN IN INDIA (2012 ONWARDS). Delhi: NATIONAL LAW UNIVERSITY.
Assessment of Impact of Quality of Internet in India and its Impact on Users October 2017
E-34, East of Kailash, New Delhi – 110065, India
URL: www.consumer-voice.org Page 129
Cerejo, R. (2016). The Dangers of Free, Public Wi-Fi - and How to Keep Yourself Safe. NDTV .
Chafekar, D. (2015). A day in the life of mobile users in India. Retrieved November 2016, from Quettra.com: https://www.quettra.com/research/a-day-in-the-life-of-mobile-users-in-india/
Chen, C., Sun, K., Wu, G., Tang, Q., Qin, J., Chiu, K., et al. (2009). The impact of internet resources on scholarly communication on citation scholarly communication: A citation analysis. Scientometrics , 459-474.
Cheung, C. M., Lee, M. K., & Rabjohn, N. (2008). The impact of electronic word-of-mouth: The adoption of online opinions in online customer communities. Internet Research , 229-247.
Choi, Y. S., & Ross, L. (2006). Policy and Power: The Impact of the Internet on the Younger Generation in South Korea. Social Policy & Society , 421-429.
Collier, C., & Lebaron, J. (2006). The Impact of Internet Access on Designs for Internet Training. Journal of Information Technology for Teacher Education , 319-328.
CUTS International. (2017). Consumer Broadband Labels: A training toolkit , 43. Delhi, India.
CUTS. (2016). Mobile Internet Services in India - Quality of Service Report. CUTS.
DePrince Jr., A. E., & Ford, F. W. (1999). Macro and Micro impact of the internet on the economy. Business Economy , 10.
Devlin, B., & Burke, M. (1997). Internet : The Ultimate reference tool? Intrnet Research , 101-108.
Digital Rajasthan Conclave. (2016). Jaipur, Rajasthan: FICCI.
Digital Rajasthan Conclave: Transforming lives through technology. (2016). Jaipur: FICCI.
DOT. (2012). DOT-GOV. Retrieved from http://www.dot.gov.in/sites/default/files/NTP-06.06.2012-final.pdf.
Dowling, C. (1998). The imapct of the Internet on academic research parctices. Chapman & Hall.
DQINDIA ONLINE. (2016, September 28). Nationwide Campaign to Save Internet Telephony Launched. DataQuest.
Easy Access to Online Information Reducing Voter Turnout: Study. (2016, September 18). Retrieved October 2016, from www.ndtv.com: http://www.ndtv.com/world-news/easy-access-to-online-information-reducing-voter-turnout-study-1460119
E-Taal. (n.d.). State wise report. Retrieved September 20, 2017, from e-taal: http://etaal.gov.in/etaal/statewisereport1.html
Express, T. I. (2016, December 2). Government wants Aadhaar –enabled payment to replace cards. The Indian Express .
Assessment of Impact of Quality of Internet in India and its Impact on Users October 2017
E-34, East of Kailash, New Delhi – 110065, India
URL: www.consumer-voice.org Page 130
Friedman, T. (2005). The World is flat. Farrar, Straus and Giroux.
Fu, C. Y., & Chou, L. C. (2016). The influence of Internet on politics: The impact of Facebook and the Internet penetration on elections in Taiwan. Applied Economics Letters .
Fung, A., & Pun, S. (1997). The impact of internet on ITEM : educational management in preparation for the future. Information Technology in Educationbal Management for the schools of the future .
Gadgets 360. (2016, october 21). Retrieved november 2016, from gadgets.ndtv.com: http://gadgets.ndtv.com/apps/features/googles-surprising-survey-results-indians-most-likely-to-pay-for-digital-goods-and-apps-1477317
Gadgets now: Tech news. (2016, july 20). Retrieved september, from gadgetsnow.com: http://www.gadgetsnow.com/tech-news/Lack-of-internet-connectivity-is-biggest-fear-of-Indians-while-travelling-Study/articleshow/53299332.cms
Gencer, L. S., & Koc, M. (2012). Internet Abuse among Teenagers and Its Relations to Internet Usage Patterns andDemographics. Journal of Educational Technology & Society, Vol. 15, No. 2 , 25-36.
Google's surprising survey results Indians most likely to pay for digital goods and apps. (2016, october 21). Retrieved november 2016, from www.gadgets.ndtv.com: http://gadgets.ndtv.com/apps/features/googles-surprising-survey-results-indians-most-likely-to-pay-for-digital-goods-and-apps-1477317
Griffiths, M. D., & Parke, J. (n.d.). The social impact of Internet gambling. 09.
Grimaldi, C., & Goette, T. (1999). The Internet and the independence of individuals with disabilities. Internet Research , 272-280.
Hindustan Times. (2016, October 5). Surfing the Pacific: India's Internet Slowest in Asia PAC.
Hinson, R. (2006). The internet for academics : towards a holistic adoption model. Online Information Review , 542-554.
Hospitals use portals to drive patient engagement. (2016, October 12). Retrieved October 2016, from www.internethealthmanagement.com: https://www.internethealthmanagement.com/2016/10/12/hospitals-use-portals-drive-patient-engagement/
Hostingfacts.com. (2016). Retrieved november 23, 2016, from https://hostingfacts.com/internet-facts-stats-2016/
Howard, P. N., Agarwal, S. D., & Hussain, M. M. (2011). The Directors' Digital Dilemma: When do states disconnect their digital networks? Brookings: Center for Technology Innovation.
ICRIER. (2016). Internet & Cities: How it is changing the way we live. Urban Coonversation Series. Delhi.
Assessment of Impact of Quality of Internet in India and its Impact on Users October 2017
E-34, East of Kailash, New Delhi – 110065, India
URL: www.consumer-voice.org Page 131
Ikeda, K., Richey, S., & Teresi, H. (2013). Browsing Alone : The Differential Impact of Internet Platforms on Political Participation. Japanese Journal of Political Science , 305-319.
India Telecom 2016- "Transforming India". (2016). Department of Telecommunications, Ministry of communications, Government of India. Delhi: FICCI.
India to have 371 million mobile Internet Users by June. (2016, feb 4). Retrieved october 2016, from www.businesstoday.in: http://www.businesstoday.in/sectors/telecom/india-to-have-371-million-mobile-internet-users-by-june/story/228805.html
Internet & Cities: How it is changing the way we live. (2016). Urban Coonversation Series. Delhi: ICRIER.
Internet Addiction May Increase Risk of Depression and Anxiety. (2016, September 20). Retrieved October 2016, from www.ndtv.com: http://food.ndtv.com/how-to/internet-addiction-may-up-risk-of-depression-and-anxiety-1464135
Internet live stats. (2016). India Internet Users. Retrieved from http://www.internetlivestats.com/internet-users/india/
Internetlivestats.com. (2016). Retrieved October 2016, from http://www.internetlivestats.com/internet-users/india/
Jennings, M., & Zeitner, V. (2003). Internet Use and Civic Engagement: A Longitudinal Analysis. The Public Opinion Quarterly , 311-334.
Jiang, Q. (2014). Internet addiction among young people in China. Internet research , 21.
Juan Antonio Bahillo, S. G. (2016). The value in digitally transforming credit risk management. McKinsey .
Katz, D. R. (2012). Impact of broadband on the economy. Columbia University: International Telecommunication Union.
Katz, J., & Aspden, P. (1997). Motivations for and barriers to internet usage. Internet research , 24.
Kaushik, P., & Singh, N. (2004). Information Technology and Broad-Based Development: Preliminary Lessons from North India. World Development.
Kraeuter, S. G. (2002). The Role of Consumers' Trust in Online-Shopping. Journal of Business Ethics , 43-50.
Kumar, V. (2013). A Study on Perceived risk in online consumer behaviour of youth: An Indian perspective.
Assessment of Impact of Quality of Internet in India and its Impact on Users October 2017
E-34, East of Kailash, New Delhi – 110065, India
URL: www.consumer-voice.org Page 132
Lack of internet connectivity is biggest fear of Indians while travelling: Study. (2016, july 20). Retrieved september, from gadgetsnow.com: http://www.gadgetsnow.com/tech-news/Lack-of-internet-connectivity-is-biggest-fear-of-Indians-while-travelling-Study/articleshow/53299332.cms
Lee, L. (2008). The Impact of Young People's Internet Use on Class Boundaries and Life Trajectories. Sociology , 137-153.
Lee, P. S., Leung, L., Lo, V., Xiong, C., & Wu, T. (2011). Internet Communication Versus Face-to-face Interaction in Quality of Life. Social Indicators Research , 375-389.
Liang, T.-H. (2010). Internet Service Cognition and Use, and Their Promotion of Quality of Life in Taiwan. Springer .
Lokhande, D. M. (2004, December). E-Governance in India. Yojana (A Development Monthly), , VOL. 48.
London, T., & Dash, P. (2016, August). Health systems: Improving and sustaining quality through digital transformation. Retrieved September 2016, from www.mckinsey.com: http://www.mckinsey.com/business-functions/digital-mckinsey/our-insights/health-systems-improving-and-sustaining-quality-through-digital-transformation?cid=digistrat-eml-alt-mip-mck-oth-1608
Manning, J. C. (2006). The impact of internet pornography on Marriage and the Family: . Sexual Addiction and Compulsivity , 36.
Massimo G. Colombo, A. C. (2013). ICT services and small businesses’ productivity gains: An analysis. Information Economics and Policy , 171-189.
Mehta, I. (2016, November 2). Retrieved from The Huffington Post: http://www.huffingtonpost.in/2016/11/02/trais-meagre-512-kbps-broadband-mandate-will-push-india-into-a/
Mehta, I. (2016, November 2). TRAI's meagre 512 Kbps Broadband Mandate Will Push India Into A Technological Slump. The Huffington Post .
Minges, M. (2016). Exploring the Relationship between Broadband and Economic Growth. The World Bank.
Ministry of Electronics and Information Technology, Government of India. (2016-2017). Annual Report. Retrieved September 20, 2017, from http://meity.gov.in/writereaddata/files/AR2016-17_English.pdf
Mobile India in 2015: A year in review. (2016, january 13). Retrieved november 2016, from inmobi.com: http://inmobi.com/blog/2016/01/13/mobile-india-in-2015-a-year-in-review
Mokhtari, K., Reichard, C. A., & Gardner, A. (2009). The Impact of Internet and Television Use on the Reading Habits and Practices of College Students. Journal of Adolescent & Adult Literacy , 609-619.
Moore, N. (2000). The Internet and the library. Library Review , 422-428.
Assessment of Impact of Quality of Internet in India and its Impact on Users October 2017
E-34, East of Kailash, New Delhi – 110065, India
URL: www.consumer-voice.org Page 133
National e-Governance Plan. (2011). Saaransh. Department of Information Technology, Ministry of Communications and Information Technology, Governmengt of India.
National Informatics Centre. (n.d.). National Informatics Centre. Retrieved September 20th, 2017, from http://www.nic.in
Neilsen. (2010). Global Trends in Online Shopping. Neilsen .
Owens, E. W., Behun, R. J., Manning, J. C., & Reid, R. C. (2012). The impact of internet pornography on adolescents: A review of the research. Sexual Addiction and Compulsivity: The Journal of Treatment and Prevention , 25.
Parbat, K. (2016, June 23). Slow internet driving you nuts? Here is how your service provider is fleecing you. Economic Times . India: ET Bureau.
Parent, I., & Cruickshank, N. (2009). The Growth of the Internet and Knowledge Networks, and their Impact in the Developing World. Information Development .
Perry, L. S. (1995). Using the Internet for International Research. Mid-America American Studies Association , 86-98.
Pociask, S. (2016). FTC to FCC. Forbes .
Pollock, P. H., & Wilson, B. M. (2002). Evaluating the impact of Internet Teaching : Preliminary Evidence from American National Government Classes. Cambridge , 561-566.
Prasad, R. S. (2016). Government will have to play a very crucial role on cybersecurity. (E. Times, Interviewer)
Press Trust of India. (2016). Government Gets 70 Applications For Virtual Network Operator Service. Retrieved from NDTV Profit: http://profit.ndtv.com/news/tech-media-telecom/article-government-gets-70-applications-for-virtual-network-operator-service-1464331
Press Trust of India. (2016, October 17). Internet providers claim DDoS attack. BusinessLine . The Hindu.
Profit, N. (2016, October). Non-cash transactions below potential. Retrieved from http://profit.ndtv.com/news/your-money/article-non-cash-transactions-rising-but-below-potential-report-1465906.
Rao, S. S. (2000). Internet service. Online Information Review, Vol. 24 Iss 4 , 322-329.
Reeves, P. M. (2000). Coping in Cyberspace: The Impact of Internet Use on the Ability of HIV-positive Individuals to deal with their illness. Journal of Health Communication , 47-59.
Rosenfeld, M. J., & Thomas, R. J. (2012). Searching for a Mate: The Rise of the Internet as a Social Intermediary. American Sociological Review , 523-547.
Assessment of Impact of Quality of Internet in India and its Impact on Users October 2017
E-34, East of Kailash, New Delhi – 110065, India
URL: www.consumer-voice.org Page 134
Social media addiction bad for hands. (2016, October 17). Retrieved November 2016, from www.thehindu.com: http://www.thehindu.com/news/cities/Delhi/Social-media-addiction-bad-for-hands/article16073332.ece
Sputnik International. (2016, october 17). Retrieved 2016, from sputniknews..com: https://sputniknews.com/asia/201610171046419576-india-free-porn/
Sridhar, V., & Sridhar, K. S. (2006). E-Commerce Infrastructure and Econmic Impacts in Developing Countries: Case of India. Idea Group Inc.
StatCounter GlobalStats. (2016, November 1). Mobile and tablet internet usage exceeds desktop for first time worldwide. Retrieved from http://gs.statcounter.com/press/mobile-and-tablet-internet-usage-exceeds-desktop-for-first-time-worldwide
Statista. (2016). Internet usage in India. Retrieved from https://www.statista.com/topics/2157/internet-usage-in-india/
Statista.com. (2016). Retrieved October 2016, from https://www.statista.com/topics/2157/internet-usage-in-india/
Sung, S. C.-H. (2003). Impact of the high-speed Internet on user behaviors: case study in Korea. Internet Research , 360 - 376.
Tanguturi, V. P., & Harmantzis, F. C. (2007). Broadband in India: Strategic investment opportunities. Elsevier.
Taube, V. G. (2004). Connected and Disconnected? On the Impact of Internet Use on Social Connectedness. Computational & Mathematical Organizational Theory , 227-241.
The Centre for Internet & Society. (2004). Broadband Policy, 2004. Retrieved from cis-india.org: http://cis-india.org/telecom/resources/broadband-policy-2004
The Times of India. (2017, February 18). TRAI looks into poor 4G coverage by Telcos. The Times of India.
Tiwari, S. (2016, November 26). Unified payment Interface (UPI). Sunday Guardian .
TorstenJ.Gerpott n, P. (2016). The impact of mobile Internet usage on mobile voice calling behavior:A two-level analysis of residential mobile . TelecommunicationsPolicy .
TRAI. (2017, June 1). Consultation Paper on Data Speed under Wireless Broadband Plas. Retrieved September 2017, from www.trai.gov.in: http://www.trai.gov.in/sites/default/files/CP_Data_speed_01062017.pdf
TRAI Press Releases. (2016, august 19). Retrieved october 24, 2016, from TRAI: http://www.trai.gov.in/Content/PressReleases.aspx
Assessment of Impact of Quality of Internet in India and its Impact on Users October 2017
E-34, East of Kailash, New Delhi – 110065, India
URL: www.consumer-voice.org Page 135
TRAI Regulations, 2. (2014, June 25). Quality of service of Broadband services (second amendment) regulations, 2014. Retrieved from www.trai.gov.in: http://www.trai.gov.in/sites/default/files/201406250411117962118scan0004_0.pdf
TRAI Survey Reports. (2017, February). TRAI Survey Reports. Retrieved September 2017, from www.trai.gov.in: http://www.trai.gov.in/sites/default/files/IVRS_Survey_Report_08082017_0.pdf
TRAI. (2016, august 19). Telecom consumer Protection (10th amendment) regulations, 2016. India. Retrieved october 24, 2016, from TRAI: http://www.trai.gov.in/Content/PressReleases.aspx
TRAI. (2016, August 19). Telecom Consumer Protection(10th Amendment) Regulations. India.
United Nations Human Rights Council Resolution. (2016). L.20. Retrieved from 32nd session of the Human Rights Council: http://www.ohchr.org/EN/HRBodies/HRC/RegularSessions/Session32/Pages/ResDecStat.aspx
Vicente, M. R., & Gil-de-Bernabé, F. (2010). Assessing the broadband gap: From the penetration divide to the. Technological Forecasting & Social Change , 816-822.
Vicente, M. R., & Gil-de-Bernabé, F. (2010). Assessing the broadband gap: From the penetration divide to the quality divide. Technological Forecasting & Social Change , 816-822.
Vyas, R. S., Singh, N. P., & Bhabhra, S. (2007). Media Displacement Effect: Investigating the impact of Internet on Newspaper Reading Habits of Consumers. The Journal of Business Perspective , 29-40.
West, D. M. (2016). Internet shutdowns cost countries $2.4 billion last year . Brookings: Center for Technology Innovation.
wifi Choupal. (n.d.). CSC wifi Choupal. Retrieved September 20, 2017, from http://www.wifichoupal.in/
Xiang, Z., Wang, D., O'Leary, J. T., & Fesenmaier, D. R. (2015). Adapting to the internet: Trends in Travelers' use of the web for trip planning. Journal of Travel Research , 17.
Young, K. S. (1998). Internet Addiction Test (IAT). Retrieved October 2016, from www.netaddiction.com: http://netaddiction.com/internet-addiction-test/
Zach, S., & Lissitsa, S. (2016). Internet use and leisure time physical activity of adults- A nationwide survey. Computers in Human Behavior , 09.
Zumalt, J. R., & Pasicznyuk, R. W. (1998). The Internet and Reference Services : A Real-World Test of Internet Utility. Reference & User Service Quaterly , 165-172.