112
Assessment of the Jabiluka Project Report of the Supervising Scientist to the World Heritage Committee

Assessment of the Jabiluka Project
Report of the Supervising Scientist
to the
World Heritage Committee


i
Contents
Preface iii
Acknowledgements iv
1 Executive summary 11.1 Introduction 11.2 Issues to be addressed 11.3 Summary of findings 2
Hydrological modelling issues 2Prediction and impact of severe weather events 3The storage of uranium on the surface 5Long-term storage of tailings 9General environmental protection issues 11
1.4 Conclusions 13
2 Introduction 152.1 Mining of uranium in the Alligator Rivers Region 152.2 World Heritage Bureau Mission to Kakadu 172.3 Decision of the World Heritage Committee 182.4 Scope of this report 18
3 Hydrological modelling 213.1 Introduction 213.2 Determination of 1 in 10,000 year annual rainfall 21
3.2.1 Choice of data sets 213.2.2 Estimation of the 1:10,000 AEP annual rainfall for Jabiluka 23
3.3 Evaporation from open water 253.3.1 Pan factors 263.3.2 Inverse relationship between evaporation and rainfall 27
3.4 Evaporation in the mine 293.5 Summary of findings on hydrological modelling issues 32
4 Prediction and impact of severe weather events 344.1 Introduction 344.2 Evidence on past severe weather events in the region 344.3 Probable maximum precipitation events 354.4 Effect of climate change on hydrological modelling 35
4.4.1 Review of existing information on climate change 364.4.2 Climate change analysis for Jabiluka 38
4.5 Summary of findings on severe weather events 43
5 Storage of uranium on the surface 455.1 Introduction 455.2 Probability of exceedence of retention pond capacity 45
5.2.1 Design criterion 45

ii
5.2.2 Water balance modelling 465.2.3 Estimation of required storage capacity under current climatic conditions 485.2.4 Sensitivity analysis 505.2.5 Use of pond evaporation rather than evaporation in the ventilation system 525.2.6 Effect of climate change on the required water storage capacity 54
5.3 Risk assessment for the ERA proposal 555.3.1 Water quality of runoff from the ore stockpile 565.3.2 Radiation exposure of members of the public 575.3.3 Impact on aquatic ecosystems 595.3.4 Risks associated with dam failure 645.3.5 Contingency measures 68
5.6 Summary of findings on the storage of uranium on the surface 69
6 Long-term storage of mine tailings 746.1 Introduction 746.2 Erosion of tailings in the long-term 746.3 Leaching of contaminants from tailings 75
6.3.1 Hydrogeological description of the area 756.3.2 Description of the solute transport modelling 806.3.3 Properties and constituents of tailings 816.3.4 Predicted downstream concentrations of tailings derived solutes 83
6.4 Risk assessment on the long-term storage of tailings 866.5 Summary of findings on long-term storage of tailings 86
7 General environmental protection issues 907.1 Protection of the environment in the Alligator Rivers Region 907.2 The Ranger and the Jabiluka milling alternatives 917.3 Location and extent of the Jabiluka ore body 927.4 Landscape-wide analyses 937.5 Acid sulphate soils 937.6 Rehabilitation of the Jabiluka lease area 947.7 Transport of uranium from the Jabiluka mine 957.8 Summary of findings on general environmental protection issues 96
8 Conclusions 98
References 99
Attachments to this report 104
Appendix 1 105World Heritage Committee Twenty-second session Kyoto, Japan 30 November – 5December 1998 Decision on Kakadu National Park 105

iii
Preface
For almost twenty years, the mining and milling of uranium has been undertaken by EnergyResources of Australia at the Ranger mine in Australia’s Northern Territory. The RangerProject Area has become surrounded by, but has never formed part of, Kakadu National Parkwhich is inscribed on the World Heritage List. Further international recognition is grantedKakadu National Park, as its wetlands are listed under the Convention on Wetlands ofInternational Importance. Because of the significance attached to Kakadu National Park bythe Australian and the international community, the Commonwealth Government establisheda unique regime for environmental protection in the region, which demands that the highestlevel of environmental protection be achieved.
Following the Government’s approval for the establishment of a second uranium mine on theJabiluka Mineral Lease which, like the Ranger Project Area, is excised from, but surroundedby Kakadu National Park, the Bureau of the World Heritage Committee sent a Mission toKakadu to establish whether or not the World Heritage values of Kakadu were under threatfrom the Jabiluka project. The Mission concluded that both the natural and the cultural valuesof Kakadu are seriously threatened by the development of the Jabiluka mine andrecommended that Kakadu be placed on the List of World Heritage Sites in Danger.
After discussion of the Mission’s report at its meeting at Kyoto from 30 November 1998 to5 December 1998, the Committee requested that the Supervising Scientist conduct a fullreview of scientific issues raised by the Mission. Perceived scientific uncertainty with respectto these issues had led to the Mission’s conclusion that the natural values of Kakadu arethreatened by the Jabiluka project. This report is in response to that request.
It must be emphasised that this report does not purport to be a complete environmentalimpact assessment of the Jabiluka project. There are many environmental protection issuesrelated to the development of Jabiluka that were not raised in the Mission’s report or in thedecision of the World Heritage Committee. These broader issues have already beenaddressed in the environmental impact assessment process to which the Jabiluka project wassubjected and are covered by the requirements that the Commonwealth Government imposedin granting its approval for the project to proceed.
This report includes a thorough review of all of the issues raised by the World HeritageCommittee and provides a detailed assessment of the risks to the wetlands of Kakadu arisingfrom the storage of uranium ore at the surface at Jabiluka, the management of water and thestorage of tailings. The conclusion of this review is that, contrary to the views expressed bythe Mission, the natural values of Kakadu National Park are not threatened by thedevelopment of the Jabiluka uranium mine and the degree of scientific certainty that appliesto this assessment is very high.
Peter BridgewaterSupervising Scientist9 April 1999
iv
Acknowledgements
A review of this kind is never the work of one person. I would, therefore, like to express mygratitude to the following people who all made contributions:
• Arthur Johnston, Deputy Supervising Scientist, for his overall management of the review,for the extensive analyses that he carried out and for authorship of much of the report.
• Bernard Prendergast, Head of the Supervising Scientist’s research program on theEnvironmental Impact of Mining who managed the consultancy projects, interactedextensively with scientists in other institutions and wrote sections of the report.
• Bruce Stewart and his colleagues in the Bureau of Meteorology for their project onHydrometeorological analysis relevant to Jabiluka.
• Roger Jones and his colleagues in the CSIRO Division of Atmospheric Research for theirproject on Climate change analysis relevant to Jabiluka.
• Francis Chiew and QJ Wang of the University of Melbourne for their project onHydrological analysis relevant to surface water storage at Jabiluka.
• Franz Kalf of Kalf Associates and Colin Dudgeon of the University of New South Walesfor their project on Analysis of long term groundwater dispersal of contaminants fromproposed Jabiluka mine tailings repositories.
• Brian Richards, recently retired from CSIRO, for his review of the groundwater study.
• Michael Wendt of the CSIRO Division of Mining amd Exploration for his review of thesection on evaporation in the mine ventilation shafts.
• Kevin McCue of the Australian Geological Survey Organisation who provided the resultsof his recent study on earthquakes in the region.
• Andrew Jackson and Allan Wade of ERA and Mark Daniell of ERA EnvironmentalServices who promptly responded to requests for data and other information.
I also thank the large number of other staff of the Supervising Scientist who contributedextensively throughout the project in the provision of scientific and technical advice,providing summaries of their research in a number of relevant areas, in reviewing the reportand in providing logistic and editorial support throughout the review.
Finally, I would like to acknowledge both current and past staff of the Supervising Scientistfor their contribution to environment protection in the Alligator Rivers Region. Without theirdedicated work over the past twenty years, this report could not have been written and wewould not be in a position to demonstrate so clearly to the international community that thenatural values of Kakadu National Park have not, need not, and will not, be harmed by theconduct of uranium mining in the region.
Peter BridgewaterSupervising Scientist9 April 1999
1
1 Executive summary
1.1 Introduction
At the twenty-second meeting of the World Heritage Committee, held in Paris from 22 to27 June 1998, a decision was reached that the Chair of the Committee should lead a missionto Australia and Kakadu National Park to assess any ascertained or potential threats to theWorld Heritage values of Kakadu National Park that might arise from the proposal to mineuranium at Jabiluka. The visit of the Mission took place from 26 October 1998 to1 November 1998.
The report of the Mission was submitted to the Bureau of the World Heritage Committee atits meeting held in Kyoto, Japan, on 27–28 November 1998. Following consideration of thereport, the Bureau made recommendations that were considered by the World HeritageCommittee at its meeting from 30 November 1998 to 5 December 1998.
The report noted ‘severe ascertained and potential dangers to the cultural and natural valuesof Kakadu National Park posed primarily by the proposal for uranium mining and milling atJabiluka’ and recommended that the mining and milling of uranium should not proceed. Inthe case of threats to the natural values of the Park, the mission placed very significantweight on ‘the serious concerns expressed by some of Australia’s most eminent scientists asto the degree of scientific uncertainties relating to the Jabiluka mine design, tailings disposaland possible impact on catchment processes’. The concerns cited were made in a submissionby Wasson, White, Mackey and Fleming (Wasson et al 1998, Appendix 2).
Because the Australian authorities had not had sufficient time to respond to the report, theWorld Heritage Committee made no firm decision of the future status of Kakadu at theNovember 1998 meeting. In its decision, the Committee requested that the SupervisingScientist conduct a full review of the areas of scientific uncertainty. The issues specifiedwere hydrological modelling, prediction and impact of severe weather events, storage ofuranium ore on the surface and the long-term storage of mine tailings.
This report is the Supervising Scientist’s response to that request. In preparing this report, theSupervising Scientist has drawn on the broad range of expertise available within his ownorganisation. In addition, given the intense interest in the World Heritage issue and the needfor absolute transparency, he has sought independent expert advice from a number ofscientific institutes within Australia. Scientists from the the Bureau of Meteorology, theUniversity of Melbourne, the Commonwealth Scientific and Industrial Research Organisationand the University of New South Wales prepared reports on specific topics at the request ofthe Supervising Scientist. These reports are included as attachments to this report.
1.2 Issues to be addressed
Following a detailed examination of the submission by Wasson et al (1998) and the Missionreport, the Supervising Scientist has summarised the main issues arising under each of thetopics specified by the World Heritage Committee and confirmed this interpretation with theChair of the Committee. This summary is as follows:
Hydrological modelling
This topic includes issues raised by Wasson et al (1998) in section 5 of their submission;in particular, (i) the estimate of what constitutes a 1 in 10,000 AEP annual rainfall for the

2
purpose of designing the retention pond, (ii) evaporation in the exit air stream of the mineventilation system and (iii) evaporation from open water.
Prediction and impact of severe weather events
This topic refers to (i) uncertainties raised by Wasson et al (1998) in section 4 of theirsubmission arising from the work of Nott (1996) about high discharges in the WaterfallCreek region and the Katherine floods, (ii) uncertainties expressed by Wasson et al(1998) on what constitutes a Probable Maximum Precipitation (PMP) event and (iii) theeffect of climate change on both mean annual rainfall and the intensity of storms.
Storage of uranium on the surface
Included under this topic are (i) the design of the surface facilities to ensure, taking intoaccount issues raised in the first two topics above, that runoff from the ore stockpile willall be collected by the retention pond even under extreme weather conditions and (ii) theadequacy of parameters used in the design of the retention pond to ensure containment ofwater collected in it under extreme weather conditions without the need to release waterto the surface water system beyond the mine site.
Long-term storage of the mine tailings
This topic includes two issues related to the long term containment of 100% of thetailings at Jabiluka in the mine stopes and additional stopes/silos excavated near the orebody specifically to contain tailings. The two issues are (i) long-term containment of thesolid tailings so that they do not represent a threat to the wetlands of Kakadu and (ii)dispersal of contaminants in groundwater from the contained tailings and theirconsequent potential impact on the wetlands of Kakadu.
There are a number of additional issues raised in the submission by Wasson et al (1998) thatrequire clarification. These and other more general issues are also addressed in this report.
1.3 Summary of findings
Hydrological modelling issuesThe conclusions and recommendations of the Supervising Scientist on the hydrologicalmodelling issues raised by Wasson et al (1998) are as follows.
Estimate of the 1:10,000 AEP annual rainfall
• It is recommended that the Oenpelli rainfall record for the years 1917 to 1998 should beused for estimating the 1:10,000 AEP annual rainfall and for other hydrologicalmodelling for the Jabiluka project because it is much more extensive than that at Jabiruand is consistent with the Jabiru record in the period of overlap.
• The recommended value for the 1:10,000 AEP annual rainfall is 2460 mm with 95%confidence limits of ±190 mm. This estimate is in very good agreement with the valueadopted by ERA, 2450 mm.
• It is acknowledged that there may be some residual model dependence in therecommended value for the 1:10,000 AEP annual rainfall. However, this is not importantfor modelling of the Jabiluka water management system in this review because a MonteCarlo simulation method is used based upon stochastically generated rainfall data.
Evaporation from open water
• All of the suggestions made by Wasson et al (1998) to check the validity of theevaporation pan factors used by ERA had already been taken into account in the

3
evaporation calculations presented by ERA in its hydrological modelling of the watermanagement system for the Jabiluka project.
• Based upon two recent independent reviews, it is recommended that, in all futurehydrological modelling of the Jabiluka water management system, the pan factorsproposed by the Supervising Scientist in 1987 be used.
• The difference in annual pond evaporation arising from the use of the pan factorsrecommended by the Supervising Scientist compared to that obtained using the factorsadopted by ERA in the Public Environment Report for Jabiluka is small (about 2%). Thisdifference is well within current expectations of the accuracy of water managementmodelling.
• The volume of the retention pond at Jabiluka would need to be increased by about 3% totake into account the interannual variability in evaporation and the inverse relationshipbetween evaporation and rainfall.
• This estimate is, however, considered to be an overestimate because the relationshipbetween evaporation and rainfall is not linear. Rather, evaporation during the mainmonths of the Wet season tends towards a constant value at high rainfall.
• It is recommended that a linear relationship between evaporation and rainfall isincorporated in future water management modelling because this will yield conservativeresults under high rainfall conditions and more realistic results under drought conditionsthan would be obtained using the long-term monthly average evaporation.
Evaporation in the mine ventilation shafts
• The observation by Wasson et al (1998) that the latent heat of evaporation needs to besupplied is correct. The conclusion that this results in a major error is, however, invalidbecause the energy required can be supplied externally, and it was the intention of thedesign engineer that the optimum way of doing this would be assessed at the detaileddesign stage once approval for the project to proceed had been given.
• The capital and operating costs of a humidifier system designed to meet the evaporationenergy needs would be high and a cost benefit analysis of various water managementoptions will be required before a final decision on the installation of a humidifier systemis made.
• If it is decided that the cost of installing and running a humidifier system is too high orthat the environmental impact is unacceptable, the retention pond at Jabiluka would needto be increased in area from 9 ha to about 13 ha. Given the experience of the RangerMine, which has a disturbed area of about 500 ha, this 4 ha increase is not expected togive rise to any detectable environmental impact.
Prediction and impact of severe weather events
Evidence on past severe weather events in the region
• The assumption of Wasson et al (1998) on need to design and build tailings and waterretention dams that will be structurally stable for 10,000 years and will totally contain allwater that might accumulate over this period is incorrect.
• The project approved by the Minister for the Environment required all tailings to bereturned underground to the mine void and to additional stopes or silos speciallyexcavated to contain the tailings. There will, therefore, be no need to contain tailings insurface repositories for any period longer than the mine life, approximately 30 years.

4
Similarly, water retention structures will be evaporated to dryness and rehabilitated at thecessation of mining.
• The strongly worded criticism in Wasson et al (1998) that the proponent has assumedstationarity of climate over a period of 10,000 years is, therefore, without foundation.Citing this and information on significantly different climate regimes in the region in thepast few thousand years as evidence that ‘the integrity of Kakadu cannot be guaranteedwith any probability’ is unjustified.
Probable maximum precipitation events
• The 6-minute PMP intensity estimate adopted by ERA for the Jabiluka project isapproximately 20% lower than the value recommended by the Bureau of Meteorology. Itis recommended that the Bureau value be used in the detailed design of the Jabilukaproject.
• A full set of PMP values appropriate for Jabiluka is provided in this report. It isrecommended that these values be used, where appropriate, in the detailed design of theJabiluka project.
Effect of climate change on hydrological modelling
• As recommended previously by the Supervising Scientist, it is important that possible orlikely variations in climate over the next 30 years are properly taken into account in thedetailed design of the water management system at Jabiluka. This should include non-greenhouse effects such as periodic changes in the mean annual rainfall that occur in thepast meteorological record.
• There is substantial agreement in the predictions of the various climate change models onthe projected temperature increase in the region of Jabiluka by the year 2030. Theincrease is expected to be in the range 0.35–0.8ºC.
• There is substantial agreement in the predictions of the various climate change models,including models that incorporate regional climate modelling, on the likely change in theWet season rainfall in the region of Jabiluka. The predictions range from +1% to -6% by2030. These models confirm previous expectations that any increase in Wet seasonaverage rainfall due to global warming is likely to be small (1%).
• Decadal scale variation is the most significant climate change effect for hydrologicalmodelling of the Jabiluka project. The present review confirms the earlier analysis of theSupervising Scientist that this effect could be as large as 15% over the next 30 years.However, this review has established that stochastic rainfall series modelling, based uponthe Oenpelli rainfall record, fully accounts for decadal scale variability and that there isno need to include this effect explicitly in a climate change scenario.
• Analysis of the historical rainfall record at Oenpelli reveals an upward trend of 1.7 mmper annum in the mean annual rainfall that may be attributed to global warming andwhich should be added to the model predictions. The observed trend is not statisticallysignificant but the adoption of a precautionary approach implies that the significance ofthis possible trend should be assessed in hydrological modelling of the Jabiluka project.However, stochastic rainfall series modelling, based upon the Oenpelli rainfall record,also exhibits a similar trend and it is concluded that there is no need to include this effectexplicitly in a climate change scenario.
• As in previous studies, this review has found that the intensity of extreme storm events islikely to increase despite the fact that there is an overall decrease in the annual rainfall.

5
• Climate change modelling also suggests that there could be a significant increase in themagnitude of PMP events, with increases of up to 30% being suggested. Possible increasesof this magnitude should be taken into account in the final design of the Jabiluka watermanagement system by increasing the height of exclusion bunds. This is an action that canbe incorporated at the detailed design stage.
The storage of uranium on the surface
Modelling of the water management system at Jabiluka under current climatic conditions
• This review has included hydrological modelling of the water management system atJabiluka using a stochastic daily water balance model which incorporates therecommendations of this review on the appropriate rainfall record and evaporation, arealistic distribution of evaporative losses in the ventilation system throughout the year,and a simple soil water capacity model for runoff. The system modelled was the JabilukaMill Alternative – Original Concept but with tailings returned to the mine void ratherthan in tailings ponds at the surface.
• The model has enabled estimates to be made of the storage capacity required as afunction of exceedence probability over the 30 year mine life under current climaticconditions.
• The probability that the pond volume proposed by ERA in the PER (810,000 m3) wouldbe exceeded over the life of the mine is about 1 in 1000. The pond volume required toachieve an exceedence probability of 1 in 10,000 over the life of the mine would be about940,000 m3.
Review of the hydrological model adopted by ERA
• The Supervising Scientist has reviewed the hydrological model adopted by ERA in thedesign of the water management system at Jabiluka. This review has resulted in a numberof recommendations for improvement of the model.
• The effect on the volume of the water storage pond arising from the adoption of theserecommendations is as follows:
• The inclusion of interannual variability in evaporation and the inverse relationshipbetween rainfall and evaporation leads to an increase in the required pond volume ofabout 3%.
• The use of a simulated distribution of monthly rainfall rather than distributing annualrainfall to each month in fixed proportions determined from a typical distributionleads to an increase in the required capacity by about 1.7%.
• The use of a more realistic distribution of ventilation system losses between the Wetand Dry seasons rather than a constant value for each month leads to an increase inthe required capacity by about 1.2%.
• The use of pan factors recommended in this review rather than those used by ERA inthe PER results in an increase in the required volume of about 2.5%.
• The use of a daily water balance model rather than a monthly model leads to anincrease in required pond volume of about 1.4%.
• The use of conceptual rainfall-runoff model rather than fixed runoff coefficients leadsto a decrease in the required pond volume of about 0.4%.

6
• The combined effect of adopting the recommendations of this review on each of theabove topics rather than the model used by ERA is that the pond volume required toachieve a given exceedence probability will increase by about 10%.
Use of pond evaporation rather than enhanced evaporation in the ventilation system
• The use of pond evaporation rather than enhanced evaporation in the ventilation systemwould lead to a reduction in the required storage capacity of about 30% because the fullevaporative capacity would be available from the commencement of operations ratherthan achieving its maximum effect only after 10 years of operation.
• It is recommended that ERA, in its detailed design of the Jabiluka water managementsystem, uses increased pond evaporation rather then enhanced evaporation in theventilation system. In making this recommendation, it is recognised that some enhancedevaporation in the ventilation system as a result of dust suppression procedures isinevitable. This will need to be modelled carefully by ERA to achieve the optimum watermanagement system.
• Partitioning the water retention pond into three or four compartments with connectingspill-ways and a water pumping system is one way in which control of evaporative lossescould be achieved. Evaporative losses in dry spells could be minimised by pumping allremaining water into one of the compartments and could be maximised in wetter periodsby using the full evaporative capacity of all of the compartments. It is recommended thatERA consider this approach in the detailed design of the water management system atJabiluka.
Effect of climate change on the required storage capacity
• The minimum predicted temperature increase is the extreme scenario for water balancemodelling since this would minimise evaporation and hence maximise the requiredstorage volume. The minimum predicted increase of 0.35ºC over the next 30 years isinsufficient to have any significant impact on evaporation. There is no need, therefore, toadjust the hydrological model to take the effect of temperature change into account.
• The maximum predicted change in annual rainfall from global warming over the next 30years is 1%. There is, therefore, no need to repeat the simulation of the watermanagement system to take this effect into account. The effect of climate change will benegligible.
• The effect of the predicted increase in storm intensity due to global warming has beenassessed using the results of a sensitivity analysis. The results indicate that this increasein storm intensity would not have any significant impact on the required storage capacityof the water management system at Jabiluka.
Risk assessment of the ERA proposal
• A risk assessment has been carried out for the water management system proposed byERA for the Jabiluka mine. In this context, it is important to note that tailings will not bestored at the surface. The principle hazard that needs to be assessed is the possible impacton people and on downstream ecosystems arising from the unplanned discharge of waterthat has been in contact with uranium ore.
• In conducting the risk assessment, estimates have been made of the concentraions ofsolutes in runoff from the ore stockpile. All of these concentrations are considered to bemaximum expected values and some are likely to be significant over-estimates.

7
• The risk assessment included a contingency situation in which the accumulated runofffrom the catchment of the water storage pond at Jabiluka exceeds the capacity of thepond and the excess water from the Total Containment Zone is diverted and allowed toflow freely to Swift Creek. Also assessed is the risk to the environment associated withstructural failure of the water storage pond arising from overtopping of the pond, staticfailure of the constructed embankment, or the occurrence of a severe earthquake.
Risks associated with exceeding the available water storage capacity
• Estimates have been made of radiation exposure of members of the public resulting froman exceptional Wet season in which the storage capacity of the water retention pond isexceeded and the excess water is discharged to Swift Creek. The probability that anymember of the public would receive a radiation dose of 20 µSv on one occasion duringthe 30 year life of the mine would be less than 1 in 10,000. The annual dose limitrecommended by the International Commission on Radiological Protection for membersof the public is 1000 µSv per annum. The conclusion is, therefore, that the watermanagement system proposed by ERA for Jabiluka is one that poses an insignificantradiological risk to people living in the vicinity of the mine and consuming traditionalfoods obtained from the waterbodies downstream from the mine.
• Estimates have also been made of probable effects on aquatic animals resulting from anexceptional Wet season in which the storage capacity of the water retention pond isexceeded and the excess water is discharged to Swift Creek. The assessment includedboth radiological and chemical exposure. The conclusion reached is that, under normalcircumstances, no effect on aquatic animals living in Swift Creek downstream from theJabiluka mine would be expected to occur even when the volume of excess waterdischarged is that with an exceedence probability of 1 in 50,000 over the life of the mine.If the discharge results from an extreme rainfall event with an exceedence probabilitymuch greater than 1 in 100 at the end of a Wet season in which the rainfall has anexceedence probability of greater than 1 in 1000, some adverse effects may occur ininvertebrates, but adverse effects on fish would not be expected. Any adverse effects oninvertebrates would be very short-lived.
Risks associated with overtopping the water storage pond
• The probability of the pond overtopping in the absence of contingency measures has beenestimated to be 5 in 10,000. It was assummed that overtopping would lead to completestructural failure of the pond embankment. The estimated radiation exposure of membersof the public arising from such an event is about 150 µSv. Thus, even for thiscatastrophic event, the expected dose received by members of the public would not begreater than 15% of the annual limit recommended by the International Commission onRadiological Protection.
• The uranium concentration in Swift Creek following overtopping of the retention pondand subsequent total failure of the dam walls would be expected to give rise to adverseeffects on some aquatic invertebrates in the Creek but adverse effects on fish would notbe expected.
• There is a risk of about 5 in 10,000 that, following overtopping of the water retentionpond, an area that is about 1% of the Magela floodplain would experience some adverseeffects on aquatic animals. Fish and many other species would not be affected. Betweenabout 2 km2 and 20 km2, adverse effects may persist but beyond 20km2 no effects shouldbe observed. In addition, any effects will be transitory and the system would fully recoverfollowing flushing by the natural waters of the Magela Creek.

8
• If a properly engineered spillway were installed in the wall of the retention pond, the damwould be protected from destruction under overtopping. This would result in the loss ofmuch lower volumes of water over a longer period and would fully protect both SwiftCreek and the Magela floodplain under the conditions considered here. It isrecommended that such a spill-way be incorporated in the design of the retention pond.
Risks associated with slope failure of the embankment of the water storage pond
• The probability of slope failure is estimated to be less than the probability of overtoppingwhich was estimated above to be about 5 in 10,000. Since slope failure would only ariseunder circumstances similar to those considered for overtopping, the estimates ofenvironmental impact derived above for overtopping would also apply to slope failure.
Risks associated with a severe earthquake
• Over the period of the mine life, the probability of structural failure of the water retentionpond arising from a severe earthquake has been estimated to be approximately 5 in10,000. In deriving this estimate, only local and regional earthquakes were considered.The frequent but distant large earthquakes in the Banda Sea, Indonesia, should beconsidered in the design of a water retention pond since they give rise to many cycles ofground motion. It is recommended that ERA commissions such a study at the detaileddesign stage of the Jabiluka project.
• The risk of radiation exposure of members of the public resulting from such anearthquake would be extremely low. At the 1 in 10,000 level of probability, the estimatedradiation exposure is about 30 µSv. The highest calculated exposure, which is less thanone tenth of the internationally accepted limit, has an extremely small exceedenceprobability.
• For an earthquake that occurs in the Wet season, the maximum area of the Magelafloodplain in which adverse effects on some aquatic invertebrates might be expected isabout 1.5 km2 but the probability of this occurring is extremely small. The area affectedat the 1 in 10,000 level of probability is less than 0.5 km2 which is less than 0.3% of thefloodplain area. At the same level of probability, residual effects may occur for somespecies of invertebrates out to an area of about 5 km2. Even within these areas, the impactwould be small (for example, fish should not be affected) and the system would fullyrecover following flushing by the natural waters of the Magela system.
• If an earthquake occurs in the Dry season, the area of impact would be greater.Nevertheless, the probability of such effects occurring remains very low and the systemwould recover during the following Wet season.
Contingency measures
• It is recommended that runoff from the ore stockpile should be isolated from runoff fromthe remainder of the Total Containment Zone so that it is always directed to the waterretention pond while, under extreme conditions, runoff from the rest of the TCZ isdiverted away from the storage pond. This measure would reduce still further the riskassociated with exceeding the capacity of the storage pond.
• It is recommended that the water retention pond be constructed with a properlyengineered spillway to ensure that, even if diversion contingency measures fail, the pondstructure would not fail when the overtopping height is reached. This would reducesubstantially the impact arising in the event of overtopping because only a small volumeof water would be released to the environment rather than the full volume of the pond.

9
Long-term storage of tailings
Erosion of tailings in the long-term
• Once the Jabiluka mine is backfilled and sealed following completion of mining, the onlymechanism for physical dispersal of the tailings solids will be erosion of the overlyingbedrock. Since the mine void and the tailings silos will be about 100 m below the surfaceand the upper surface of these storage facilities will be below sea level, the whole landmass would need to be eroded away and by that time the wetlands of Kakadu would nolonger exist. Thus, physical dispersal of the tailings does not pose a threat to the wetlandsof Kakadu.
• The time required to erode the bedrock overlying the tailings in the mine void and thesilos would be about 2 million years. Hence, the excess concentrations of all theradioactive progeny will have decayed away by the time the tailings are exposed and theywill be in equilibrium with the residual uranium.
• Dispersal of tailings in the very long term will not constitute a hazard for futuregenerations.
Hydrogeological features of the area
• The permeability of the Cahill Formation schists west of the orebody is significantlygreater than that of the Kombolgie sandstone to the east. For this reason, it isrecommended that the additional tailings silos should be excavated in the Kombolgiesandstone east of the orebody, as is currently planned by ERA. This choice of locationwill minimise potential environmental impacts.
• The excavation of the silos will result in additional material being placed on the surface.The location of the silos in the sandstone rather than in the schists to the west is alsopreferable from the perspective of minimising environmental hazards on the surfacebecause the sandstone is relatively low in the concentrations of hazardous chemicals.This material will require additional attention during the rehabilitation phase, but controlof potential impacts on surface waters will be straightforward.
• The quality of groundwaters in the vicinity of the Jabiluka orebody, both to the west inMine Valley and to the east towards Swift Creek, is high. Soluble salt concentrations arerelatively low and radionuclide concentrations are very low. It is concluded that there isvery little movement of radionuclides into the groundwater aquifer from the orebody. Incontrast, the groundwater underlying the acid sulphate soils of the Magela floodplain isof high salinity, is acidic, and has high sulphate concentrations. The observed naturalsulphate concentrations are up to one third of the concentration of sulphate expected inthe Jabiluka tailings.
Modelling of the dispersion of solutes in groundwater
• A two dimensional finite element model was used to determine flow directions, headdistributions and the range of velocities.
• A three dimensional numerical solute transport model was applied to determine theconcentrations of solutes leached from the tailings paste material for use as the sourceconcentrations in an analytical model.
• An analytical contaminant transport model was used to determine concentrations due toadvection, dispersion in three co-ordinate directions and retardation. This model used asinput the range of velocities and source concentrations determined from the first twomodels. This model was combined with Monte Carlo calculations to determine

10
concentration profiles for a large number of different parameter values within selectedranges.
Properties and constituents of tailings
• Although limited information is available on Jabiluka tailings because the mine is notoperational, physical properties of tailings at Ranger have been studied extensively. Oreat Jabiluka and at Ranger originate from the same geological formation and will besubject to the same milling process. Hence the tailings from the two mines are expectedto have similar physical and chemical properties.
• Work undertaken as part of this review shows that achieving a tailings permeability ofless than 10-9m/sec is desirable. Based upon the research carried out on Ranger tailings, itis concluded that 99% of uncemented tailings in the silos at Jabiluka would have apermeability of less than 10-9m/sec. Similar results are expected for tailings in the minevoid but care will need to be exercised in placement of tailings in the mine void to avoidsegregation and extensive residual voids.
• Research elsewhere on the effect of cementing the tailings paste indicates that thepermeability of tailings will be reduced still further and may even reach permeabilitieswhich are lower than normal tailings by a factor of 1000.
• The addition of cement to the tailings will result in highly alkaline conditions which willreduce the availability of metals and radionuclides for dispersion from the tailings massin groundwater.
• The conclusion of this review is that there is a very high probability of achieving apermeability in the cemented tailings that is less than 10-9 m/sec.
Predicted concentrations of solutes in the environment
• Modelling of the concentrations of solutes in the deep aquifer east of the tailingsrepositories in the direction of Swift Creek predicts that, after 200 years, sulphateconcentrations should not exceed 20 mg/L even at distances as short as 100 m from therepositories. Uranium is not expected to move more than 50 m in 1000 years and forradium this distance is 15 m. The maximum distance moved by uranium under the mostextreme (and very low probability) scenario considered in the Monte Carlo analysis is300 m. Concentrations of uranium and radium at these distances will be negligiblecompared to naturally occurring concentrations.
• The transport of solutes to the west of the repositories is expected to be more rapidbecause of the higher permeability of the schists compared to that of the sandstone.Monte Carlo calculations indicate a probable migration distance of 500 m after 200 yearsfor non-reactive solutes including sulphate, although greater distances are possible. Thetailings derived solutes would be entering an area of already very poor quality waterwhere natural sulphate concentrations are in the range 1500 – 7000 mg/L so that theimpact of the migration of water from the tailings repository would be negligible. Inaddition, the floodplain is underlain by low permeability clays which act to limit anypotential upflow of the groundwater into surface waters.
• The Monte Carlo calculations indicate that uranium is likely to travel up to 200 m in awesterly direction in about 1000 years at which point the concentration would be reducedto less than 1 mBq/L, a concentration that is significantly less than natural concentrationsin the region. The calculations show that migration of uranium by up to 1200 m is

11
possible but with a very low probability. It is concluded that radium and uranium willremain at background levels in the Magela floodplain.
• The groundwater modelling indicates that the upward component of groundwater flow isweak in both the groundwater movement to the east towards Swift Creek and to the westtowards the Magela floodplain. The flow was found to be predominantly horizontal,implying that most of the solutes from the tailings repository will remain in the deepaquifer and move under the floodplain towards the sea and only a small fraction of thegroundwater in the deeper aquifer would be accessible to surface waters. All of thecalculated groundwater concentrations discussed above refer to concentrations in thedeep aquifer. Surface aquifer concentrations arising from the tailings repositories will benegligible.
• The overall conclusion is that the wetlands of Kakadu will not be harmed as a result ofthe dispersal of tailings constituents in groundwater.
Risk assessment on the long-term storage of tailings
• A risk assessment of the probable impact on people and the wetlands of Kakadu NationalPark arising from the long-term storage of tailings in the mine void and the silos has notbeen carried out to the extent conducted for storage of uranium on the surface.
• To carry out such an assessment would require the extension of the analysis ofgroundwater dispersion to the quantitative prediction, using Monte Carlo analysismethods of the concentrations of solutes in the waters of the Magela floodplain and theprobability with which these concentrations would occur. The range and quality ofexisting hydrogeological data do not enable such a detailed analysis to be carried out.
• However, the Monte Carlo analyses of solute concentrations in the deep aquifer and theinformation on the vertical component of groundwater flow demonstrate that theconcentrations of the tailings derived solutes in surface waters of the Magela floodplainwill remain at their natural values and will not be affected by dispersion of solutes fromthe tailings repositories.
General environmental protection issues
Protection of the environment in the Alligator Rivers Region
• The environmental protection regime that the Australian Government implemented forthe mining of uranium at Ranger has been completely consistent with the principles ofSustainable Development and it has been demonstrated, through an extensive chemical,biological and radiological monitoring program, that no impact of significance underthose principles has occurred, on either people or ecosystems of Kakadu National Park,throughout the operation of the Ranger mine.
• The same regulatory regime, but strengthened in some particular cases, would apply tothe mining of uranium at Jabiluka.
The Ranger and the Jabiluka milling alternatives
• The Mission report was critical of ERA for proposing to proceed with the Jabiluka MillAlternative (JMA) option ‘despite not being the preferred environmental option’. Thisreview, however, and the original assessment of the JMA proposal by EnvironmentAustralia have shown that, while the Ranger Mill Alternative (RMA) option is preferred,the risk to the environment arising from the JMA option is minimal and, in particular,that the wetlands of Kakadu National Park will not be threatened if the project proceeds.

12
Location and extent of the Jabiluka ore body
• The extent of the No 2 orebody at Jabiluka has not been fully delineated at depth in thatsection of the orebody to the east of the Hegge fault. If the Ranger Mill Alternative wereto proceed, the mining at Jabiluka would be restricted to the currently delineated orebodyand the period of mining would be about 30 years unless approval is given by theCommonwealth to mine any additional reserves following assessment under theEnvironment Protection (Impact of Proposals) Act 1974.
• If the Jabiluka Mill Alternative proceeds, there would be no need for further assessmentof a proposal to mine additional reserves under the Environment Protection (Impact ofProposals) Act 1974.
Landscape-wide analyses
• Wasson et al (1998) suggest that the landscape context of the mine proposal has beeninadequately addressed. The Jabiluka mine will be a point impact, with some specificpotential effects, which are addressed in the main body of this report and shown to benegligible. It is simply not true to suggest that the EIS and PER are inadequate becausethey have not considered potential impacts across the whole of Kakadu National Park.The assertion that the context modelling for the minesite need be broader than iscurrently the case is therefore rejected.
Acid sulphate soils
• The concerns of Wasson et al (1998) that heavy metals accidentally released from themine site could be mobilised into downstream ecosystems by the acid sulphate soils andthat the pumping of water from a billabong could lead to increased acidity in surfacewaters are not justified. Experience at the Ranger mine has shown that in every casewhere accidental releases have occurred, the total load of any metals released isextremely small compared to the natural load of metals in the soils of the floodplain. Theprevious proposal to re-establish the old Ja-Ja camp has been withdrawn and there are noplans to pump large quantities of water from the billabong.
Rehabilitation of the Jabiluka lease area
• ERA is required to rehabilitate the Jabiluka mine site in a manner which will establish anenvironment in the lease area that reflects, to the maximum extent that can reasonably beachieved, the environment existing in the adjacent areas of Kakadu National Park. Theintention is that the rehabilitated area could be incorporated into the Kakadu NationalPark without detracting from park values.
• The Government has established secure mechanisms to ensure that these rehabilitationobjectives will be achieved even if the company becomes insolvent and ceases operationsprior to the completion of adequate rehabilitation of the site.
Transport of uranium from the Jabiluka mine
• The transport of uranium product from Jabiluka to the Port of Darwin through KakaduNational Park is governed by laws of the Northern Territory which include the total textof the International Atomic Energy Agency Regulations for the Safe Transport ofRadioactive Material.
• Two emergency trailers and trained emergency response crews are on call for eachconsignment of uranium product. The trailers contain equipment that would allow thecrew to safely collect any spilled uranium product. The hazards associated with spillageof uranium product have been carefully assessed and emergency procedures have been

13
developed to ensure that both people and ecosystems will be protected in the event of anaccident.
• There has never been a transport accident involving the release of uranium productduring the life of the Ranger mine.
1.4 Conclusions
This report has been prepared in response to the request of the World Heritage Committeethat the Supervising Scientist conduct a full review of scientific issues raised by theCommittee’s Mission to Kakadu National Park in October–November 1998. Perceivedscientific uncertainty with respect to these issues had led to the Mission’s conclusion that thenatural values of Kakadu are threatened by the Jabiluka project.
It must be emphasised that this report does not purport to be a complete environmentalimpact assessment of the Jabiluka project. There are many environmental protection issuesrelated to the development of Jabiluka that were not raised in the Mission’s report or in thedecision of the World Heritage Committee. These broader issues have already beenaddressed in the environmental impact assessment process to which the Jabiluka project wassubjected and are covered by the requirements that the Commonwealth Government imposedin granting its approval for the project to proceed.
This report includes a thorough review of all of the issues raised by the World HeritageCommittee and provides a detailed assessment of the risks to people living in the vicinity ofthe mine and the risks to the wetlands of Kakadu arising from the storage of uranium ore atthe surface at Jabiluka, the management of water and the storage of tailings.
Many of the issues that were raised by the report of the Mission of the World HeritageCommittee come into the category of detailed design. That is, many of the issues had beenidentified by the Supervising Scientist and others as being issues that would need to beresolved by the proponent in consultation with officials of the Northern Territory and theSupervising Scientist at the detailed design stage but the conclusion had been reached thatthere were no insurmountable obstacles that would prevent a design being achieved thatwould ensure the highest level of environmental protection in Kakadu National Park.
This detailed review has demonstrated that there were a number of weaknesses in thehydrological modelling presented by ERA in the EIS and the PER. Accordingly, a number ofrecommendations have been made which should be implemented by ERA in completing thedetailed design of the Jabiluka project. On the other hand, the review has demonstrated quiteclearly that, if the design of the water management system proposed by ERA in the PER hadbeen implemented, the risk to the wetlands of Kakadu National Park, and the risk of radiationexposure to people of the region would have been extremely low. This conclusion is valideven in extreme circumstances leading to the complete failure of the structure of the waterretention pond at Jabiluka.
The lay reader will, no doubt, find this conclusion surprising. Its origin, however, lies in thefact that uranium is not a particularly toxic substance for aquatic animals. It has been wellestablished that the toxicity of uranium is much lower than that of many more commonsubstances such as copper, cadmium and lead. It is the perception of the public that uraniumis a very dangerous substance, and the failure of the scientific community to persuade thepublic otherwise, that has led to adoption of extreme measures to ensure that no amount ofuranium should leave the site of a uranium mine.

14
Similarly, uranium in its natural state does not pose a particularly severe radiation threat.Exposure to uranium and its radioactive progeny needs to be controlled but the inherentradioactivity of uranium and its progeny is sufficiently low that ensuring that people do notreceive exposures that would be harmful is relatively straightforward. It is only whenuranium is used as fuel in a reactor that fission reactions result in a large number ofradioactive products which produce high levels of ionising radiation.
Thus, on scientific grounds, there is no reason why water collected at Jabiluka could not bedischarged into the surface waters of the Magela floodplain under a suitably designed controlregime that would protect both people and ecosystems. The proposal by ERA that thesewaters should be totally contained at the mine site was made in response to social concernsand perceptions, not scientific evidence.
The long-term threats to the wetlands of Kakadu arising from the storage of uranium milltailings at Jabiluka have also been assessed. Because the tailings will be stored at asignificant depth below the surface of the land, physical dispersion of the tailings will not bepossible for millions of years. The whole land mass would need to be eroded away and bythat time the wetlands of Kakadu would no longer exist. Even then, the threat to futuregenerations is insignificant because the residual uranium and its radioactive progeny wouldbe present at low concentrations and would be mixed, when dispersed, with the inert materialsurrounding the current orebody. Dispersion of radionuclides and other constituents of thetailings in groundwater has been shown to present no threat to the wetlands of Kakadu or thepeople who live there in either the short-term or the long-term.
The conclusion of this review, therefore, is that, contrary to the views expressed by theMission, the natural values of Kakadu National Park are not threatened by the developmentof the Jabiluka uranium mine and the degree of scientific certainty that applies to thisassessment is very high. There would appear, therefore, to be no justification for a decisionby the World Heritage Committee that the natural World Heritage values of Kakadu NationalPark are in danger as a result of the proposal to mine uranium at Jabiluka.

15
2 Introduction
2.1 Mining of uranium in the Alligator Rivers Region
In April 1975, the Commonwealth Government of Australia established a public inquiry, theRanger Uranium Environmental Inquiry (RUEI), into the proposal to mine uranium at theRanger site in the Alligator Rivers Region of Australia’s Northern Territory (fig 2.1). Thiswide ranging Inquiry examined generic issues of the nuclear fuel cycle, including wastedisposal and possible dangers of nuclear weapons proliferation, as well as site specificaspects of the proposed Ranger development, including protection of the local environmentand Aboriginal land rights.
In August 1977, following the publication of the findings of the RUEI, the Governmentannounced its decision to authorise the mining and export of uranium in the Alligator RiversRegion under the very strict requirements for environmental control recommended by theInquiry.
Essential elements of the plan adopted by the Commonwealth Government to protect theenvironment and to insulate, to some extent, the Aboriginal people of the Region from thesocial disruptions inevitably associated with such a major development, were:
• the granting of land to the traditional owners under the Aboriginal Land Rights (NorthernTerritory) Act 1976,
• the establishment of Kakadu National Park, part of which comprised Aboriginal landleased back to the Commonwealth Government for the purposes of the Park, and
• the establishment of a Supervising Scientist to assist in the development of measures forthe protection of the environment and oversee their implementation.
From the outset, existing exploration and mining leases at Ranger, Jabiluka and Koongarrawere excluded from the Park.
Following the Government’s decision, approval was given for the mining of uranium atRanger and, after a period of mine construction, mining and milling of uranium commencedin 1981. Mining of Orebody No 1 was completed in 1994 while mining of Orebody No 3commenced in May 1997 and should be completed by about 2007. (The smaller No 2orebody is close to Mount Brockman, an Aboriginal sacred site, and will not be mined.)
In October 1996, Energy Resources of Australia submitted a Draft Environmental ImpactStatement (EIS) (ERA 1996) for the mining of uranium at the Jabiluka site, 25 km north ofRanger. This proposal was assessed by the Commonwealth Government under theEnvironment Protection (Impact of Proposals) Act 1974, (EPIP Act). The principal proposal,known as the Ranger Mill Alternative (RMA), involved the mining of the Jabiluka orebodyby underground methods and the milling of the ore at the existing mill at Ranger. Thisproposal received approval from the Commonwealth Government in October 1997 subject toa broad range of requirements on environmental protection. However, the RMA proposalrequires the trucking of ore from Jabiluka to Ranger and this requires the specific agreementof the Aboriginal land owners. The traditional land owners have so far refused to give theirpermission for the milling of Jabiluka ore at Ranger.
The draft EIS also contained an alternative proposal, known as the Jabiluka Mill Alternative(JMA), which involved the construction of a new mill at Jabiluka. The conclusion of theCommonwealth Government on the JMA in October 1997 was that insufficient informationhad been presented for a rigorous assessment of environmental impact and that, should ERA

16
Wes
t
River
River
Riv
er
Alligator
Alli
gato
rA
lliga
tor
Sou
th
East
Riv
erW
ildm
an
Cooper Creek
River
Alligator
Magela
Creek
South
Mary
River
Van Diemen GulfField Island
Nourlangie
Creek
Jim Jim
C
reek
River
Kat
herin
e
RockholeEl Sharana
ARR
Coronation Hill
NABARLEK
JABILUKA
KOONGARRAN
Boundary of the ARR
Kakadu Nat. Park
Escarpment & plateau
Uranium mine
Other major uranium deposit
Former uranium mine
0 10 20 30 40 50
km
RANGERJabiru
Oenpelli
Figure 2.1 The Alligator Rivers Region in Australia’s Northern Territory.The boundary of Kakadu National Park, within the Region, is indicated.

17
wish to proceed with that proposal, a further assessment under the EPIP Act would berequired.
In June 1998, ERA submitted a Public Environment Report (PER) (ERA 1998) containing itsdetailed proposal for the milling of ore at Jabiluka. Following assessment of the proposalunder the EPIP Act, the Government approved the project in August 1998 subject to anumber of environmental requirements. Principal among these was the requirement that allmill tailings would be returned underground to the mine void and to specially constructedstopes or silos instead of tailings pits as proposed by ERA in the PER.
2.2 World Heritage Bureau Mission to Kakadu
At the twenty-second meeting of the World Heritage Committee, held in Paris from 22 to27 June 1998, a decision was reached that the Chair of the Committee should lead a missionto Australia and Kakadu National Park to assess any ascertained or potential threats to theWorld Heritage values of Kakadu National Park that might arise from the proposal to mineuranium at Jabiluka. The visit of the Mission took place from 26 October 1998 to1 November 1998.
The report of the Mission was submitted to the Bureau of the World Heritage Committee atits meeting held in Kyoto, Japan, on 27–28 November 1998. The report concluded that thedevelopment of the Jabiluka mine poses both ascertained and potential dangers to the culturaland natural values of the World Heritage property. These threats were elaborated insections 7.5 to 7.17 of the report. Section 7.5 referred to scientific uncertainties and is quotedin full below.
7.5 Scientific uncertainties and the need for risk assessment
There are three issues of scientific uncertainty that lead to a finding of potential danger:(i) the degree of uncertainty concerning the quality of the hydrological modelling carriedout in designing the water management plan for the mine site and the implication that thismay lead to the release of water from the mine site into the Swift Creek system; (ii) thedegree of uncertainty concerning the effectiveness of the concrete pasting process as ameans of storing the tailings in the mine void, and (iii) the possible impacts on catchmentecosystems.
The mission received extensive briefings from ERA and the Supervising Scientist Group(SSG). The mission recognizes the scientific analyses carried out by ERA and the valuablerole and work of the Supervising Scientist Group (SSG). However, in the light of theconcerns expressed by some of Australia’s most authoritative and widely respectedscientists and the uncertainty that these concerns raise, the mission is of the view that ‘bestpractice’ is not to continue mining at Jabiluka regardless of the concerns, but rather toapply the Precautionary Principle which requires that mining operations at Jabiluka beceased.
There is also uncertainty expressed by ERA over the location and extent of the uraniumore body at Jabiluka and the consequent uncertainty over the final scale and duration ofthe Jabiluka mine. This uncertainty combined with the scientific concerns adds to theconclusion that the property is faced with a potential danger as defined in Paragraph 79(ii) of the Operational Guidelines.
Given the uncertainties mentioned above, the mission notes that formal risk assessmentsshould have been undertaken for the Jabiluka mining proposal. Risk assessmentprocesses are capable of putting solid upper-limit probability factors against the

18
various environmental risks; and the mission considers this essential to conveying arealistic picture of the likely overall impact of the mine.
Recommendation 2: The mission noted the serious concerns and preoccupationsexpressed by some of Australia’s most eminent scientists as to the unacceptably highdegree of scientific uncertainties relating to the Jabiluka mine design, tailings disposaland possible impacts on catchment ecosystems. The mission shares these concerns andtherefore recommends application of the Precautionary Principle which requires thatmining operations at Jabiluka be ceased.
The report of the Mission to Kakadu was considered by the Bureau of the World HeritageCommittee at its meeting at Kyoto, Japan, on 27–28 November 1998. The Bureau endorsedthe report and noted, inter alia, the significant difference in opinion concerning the degree ofcertainty of the science used to assess the impact of the Jabiluka mine on the World Heritagevalues of Kakadu National Park. It recommended that the Committee seek a report on theseissues from the Supervising Scientist.
2.3 Decision of the World Heritage Committee
The World Heritage Committee considered the report of the Mission and therecommendations of the Bureau of the World Heritage Committee at its meeting in Kyoto on30 November – 5 December 1998. The full text of the decision of the Committee is given inAppendix 1. The sections of the decision relevant to scientific uncertainty are given below.
The Committee
noted that there is significant difference of opinion concerning the degree of certainty ofthe science used to assess the impact of the mine of the World Heritage values of Kakadu(notably hydrological modelling, prediction and impact of severe weather events, storageof uranium ore on the surface and the long-term storage of the mine tailings);
and decided that:
The Australian authorities be requested to direct the Australian Supervising ScientistGroup to conduct a full review of the scientific issues referred to in Paragraph (iv)above, to be provided to the Secretariat by 15 April 1999. The review will be submittedto peer review by an independent scientific panel composed of scientists selected byUNESCO in consultation with the International Council of Scientific Unions and theChairperson of the World Heritage Committee. The report of the peer review will beprovided to the Secretariat by 15 May 1999 for immediate distribution to the members ofthe Bureau, IUCN and the Australian authorities.
The current report from the Supervising Scientist is in response to the above request.
2.4 Scope of this report
The four issues raised in the Committee’s decision are, in some cases, clearly related toissues raised in the report of the Bureau Mission to Kakadu National Park and to issues raisedin the submission by Professor Wasson and others to the Mission (Wasson et al 1998). Inother cases, the precise definition is less clear. For this reason the Supervising Scientist wroteto the Chair of the World Heritage Committee seeking clarification on the precise descriptionof these technical issues to ensure that there would be no misunderstanding at a later date.
The four issues specified in the decision are listed below together with a longer description ofeach issue that represents the Supervising Scientist’s interpretation of what is meant by each.

19
Hydrological modelling
This topic includes issues raised by Wasson et al (1998) in section 5 of their submission; inparticular, (i) the estimate of what constitutes a 1 in 10,000 annual exceedence probability(AEP) rainfall for the purpose of designing the retention pond, (ii) evaporation in the exitstream of the mine ventilation system and (iii) evaporation from open water.
Prediction and impact of severe weather events
This topic refers to (i) uncertainties raised by Wasson et al (1998) in section 4 of theirsubmission arising from the work of Nott (1996) about high discharges in the WaterfallCreek region and the Katherine floods, (ii) uncertainties expressed by Wasson et al (1998) onwhat constitutes a Probable Maximum Precipitation event and (iii) the effect of climatechange on both mean annual rainfall and the intensity of storms.
Storage of uranium on the surface
Included under this topic are (i) the design of the surface facilities to ensure, taking intoaccount issues raised in the first two topics above, that runoff from the ore stockpile will allbe collected by the retention pond even under extreme weather conditions and (ii) theadequacy of parameters used in the design of the retention pond to ensure containment ofwater collected in it under extreme weather conditions without the need to release water tothe surface water system beyond the mine site.
Long-term storage of the mine tailings
This topic includes two issues related to the long term containment of 100% of the tailings atJabiluka in the mine stopes and additional stopes/silos excavated near the ore bodyspecifically to contain tailings. The two issues are (i) long-term containment of the solidtailings so that they do not represent a threat to the wetlands of Kakadu and (ii) dispersal ofcontaminants in groundwater from the contained tailings and their consequent potentialimpact on the wetlands of Kakadu.
The Chair of the World Heritage Committee has confirmed that analyses of these issuesshould be addressed in the Supervising Scientist’s report along with the analysis any otherissue that, in the view of the Supervising Scientist, will be necessary for the Committee toreach a decision.
Although the Supervising Scientist has a broad range of expertise available within his ownorganisation, given the intense interest in the World Heritage issue and the need for absolutetransparency, independent expert advice within Australia was sought on the following topicsto assist the Supervising Scientist in his review of the topics identified by the World HeritageCommittee:
(i) Hydrometeorological analysis to determine rainfall figures appropriate for thedesign of a water management system at the Jabiluka mine,
(ii) Impact of climate change on parameters for the design of surface runoff storagefacilities at Jabiluka,
(iii) Determination of the water storage capacity needed to meet the specifiedenvironmental protection standard, and
(iv) Groundwater modelling to determine the probable increase in surface waterconcentrations of specified chemical constituents leached from tailings.
The reports on these consultancy projects are included as attachments to this report. TheSupervising Scientist’s interpretation of the material contained in these reports, and the

20
analysis of issues by the staff of the Supervising Scientist, provide the basis for this currentreport.
Following this introductory chapter, the four principal topics identified by the WorldHeritage Committee are addressed in chapters 3, 4, 5 and 6. In addition, other issues that theSupervising Scientist believes require clarification are addressed in chapter 7. The overallconclusions of this review are presented in chapter 8.
21
3 Hydrological modelling
3.1 Introduction
A number of questions were raised by Wasson et al (1998) on the validity of the assumptionsand analytical methods used by the proponent in the design of the Total Containment Zone(TCZ) at Jabiluka. The issues raised relate to:
• The methods used to derive the annual rainfall that is not likely, on average, to beexceeded more than once in 10,000 years (the 1:10,000 AEP annual rainfall),
• The methods used to estimate evaporation in the water retention pond, and
• The calculation of the quantity of water that will be evaporated in the exit stream of themine ventilation system.
Various aspects of these issues were raised in the Supervising Scientist’s submissions on theJabiluka EIS and the PER. They were, however, raised in the context of issues that wouldneed to be addressed at the detailed design stage of the project if the approval for miningwere to be granted. The important issues at the EIS/PER stage are:
(i) the acceptance of a design criterion, that the water retention system should captureand retain all water that could accumulate in a year where the annual rainfall is thatwhich is not likely, on average, to be exceeded more than once in 10,000 years, and
(ii) that adequate evidence is presented that this design is achievable.
The Supervising Scientist reached the conclusion that such a design is achievable and thatoutstanding detailed technical issues could be resolved by the Supervising Authorities andthe Supervising Scientist in the normal process of assessment and authorisation if approvalfor the project was given. This approach was endorsed by Environment Australia in itsassessment of the EIS and PER.
The above hydrological issues are addressed in this chapter to determine the basic parametersrequired for design of the water management system under current climatic conditions. Issuesrelated to possible climate change are addressed in chapter 4 and design issues per se areaddressed in chapter 5.
3.2 Determination of 1 in 10,000 year annual rainfall
The design criterion adopted by ERA in the Draft EIS (ERA 1996) for the retention pond inthe Total Containment Zone (TCZ) at Jabiluka was that it should be capable of retaining therunoff from the TCZ in a 1:10,000 AEP rainfall year as well as including a residual volumeof water retained from previous years (ERA 1996, page 4–68). Thus the estimate used for the1:10,000 AEP rainfall was considered an important issue for the success of the totalcontainment strategy.
3.2.1 Choice of data setsThe first issue that needs to be addressed in estimating the 1:10,000 AEP annual rainfall isthe choice of data set(s) to be used in the analysis. Data are available for Jabiru airport,18 km south of Jabiluka, for the period from 1971 until 1998, a relatively short data set, andfor Oenpelli, about 25 km north east of Jabiluka, from 1911 until 1998. (For locations, seefig 2.1.) The records for all other meteorological data sites within 100 km are relatively short.Extensive data sets (of the order of 100 years) are available for Darwin, Katherine, PineCreek and a number of other sites but they are all more than 200 km distant from Jabiluka.

22
The Alligator Rivers Region, in common with much of far northern Australia, has a tropicalmonsoon climate. Virtually the entire rainfall occurs in the Wet season which varies in lengthbut is generally confined to the December – March period; November and April tend to betransitional months. The Dry season extends from about May to September. For this reason,the rainfall year considered in this report is defined to be from September of one year untilAugust of the following year.
In 1988, the Supervising Scientist carried out an analysis (Carter 1990) of the correlationbetween the Jabiru rainfall record and the records for a number of sites in the north of theNorthern Territory. The correlation was found to be best for Oenpelli and this data set wasused to determine the 1:10 and 1:100 AEP annual rainfall values for the Ranger mine site. Asignificant limitation of the Jabiru data set was the very short length of record, 17 years. Theadditional data gathered in the last 10 years has significantly extended the Jabiru data set anda further comparison is warranted.
Figure 3.2.1 Comparison of monthly rainfall at Jabiru and Oenpelli(data from Sep 1971 to Aug 1998)
Table 3.2.1 Comparison of annual rainfall statistics for Jabiru and Oenpelli from September 1971until August 1998
Jabiru (mm) Oenpelli (mm)
Mean annual rainfall 1483 1,500
Standard deviation 302 295
Standard error 58 57
An analysis of the extended data set has now been carried out by the University of Melbourne(Chiew & Wang 1999, Attachment D) using data supplied by the Bureau of Meteorology(1999) (Attachment B). For the period of coincident records (September 1971–August 1998)the mean rainfall, standard deviation and standard error in the mean are given in table 3.2.1.This comparison shows excellent agreement between the two stations. Chiew and Wang
0
200
400
600
800
1000
0 200 400 600 800 1000
Jabiru monthly rainfall (mm)
Oen
pelli
mon
thly
rai
nfal
l (m
m)

23
(1999) also examined the correlations between the two stations for monthly rainfall, annualrainfall and daily rainfall characteristics. For example, the correlation for monthly rainfall isshown in figure 3.2.1. The correlation coefficients found for the Wet season months were0.79 for December–February and 0.92 for March–May. Overall the correlation is very goodand the conclusion drawn by Chiew and Wang (1999) is that the Oenpelli data set should,because of the much longer record, be used for estimating the 1:10,000 AEP annual rainfalland for other hydrological modelling for the Jabiluka project. This conclusion is supported bythe Bureau of Meteorology (1999).
The long-term (1917–1998) statistics for annual rainfall at Oenpelli are given in table 3.2.2(Bureau of Meteorology 1999). The long-term mean annual rainfall, 1397 ± 30 mm, issignificantly lower than the value of 1500 mm given in table 3.2.1 for the shorter recordbetween 1971 and 1998. Carter (1990) used a cusum technique to examine long-term cyclesor trends in the mean annual rainfall at a number of meteorological stations in the NorthernTerritory. The cusum method (Cumulative Sum) computes the sum, at any time in a timeseries, of the difference between the current observed value of a variable and the long-termmean value. This analysis revealed that the period between the mid-1960s until the mid-1980s was one of significantly higher average rainfall than the long-term mean. Thisconclusion was valid for the stations at Darwin, Oenpelli, Pine Creek and Katherine. Hencethe short-term record for Oenpelli, which is dominated by this period of higher than averagerainfall, has a mean annual rainfall greater than the long-term mean. This conclusion is alsolikely to be true for Jabiru. Incorporation of this decadal-scale variation in rainfall into thedesign of the Jabiluka water management system is considered in chapter 4.
Table 3.2.2 The annual characteristics of Oenpelli rainfall data
Statistic Magnitude Standard Error
Mean (mm) 1397 30.3
Standard deviation (mm) 284.5 21.4
Coefficient of skewness -0.018 0.257
3.2.2 Estimation of the 1:10,000 AEP annual rainfall for JabilukaThe Bureau of Meteorology (1999) notes that the coefficient of skewness of the annualrainfall series is small and that, therefore, the normal distribution is appropriate to describethe data. The annual rainfall data for Oenpelli and the fit to the data using a normaldistribution are shown in figure 3.2.2. The x-axis in this graph has a normal probability scaleand plotting position is determined by the rank of annual rainfall (plotted on the y-axis). Datathat are normally distributed plot as a straight line on this type of graph. Chi-squared (χ2) testresults (test statistic – 4.39/chi-square value (0.05%) – 9.49) and Kolmogorov Smirnov testresults (test statistic – 0.05881/value – 0.145) indicate that the annual rainfall data series forOenpelli is normally distributed. This conclusion is consistent with that of the SupervisingScientist (Vardavas 1992) who examined the distributions of annual rainfall data for severalmeteorological stations in the north of the Northern Territory. Vardavas (1992) concluded onthe basis of a χ2 analysis that the data for Darwin and Oenpelli were better described by anormal distribution than by a log-normal distribution. For these reasons, a normal distributionhas been assumed in the estimation of the 1:10,000 AEP rainfall for Oenpelli.
For a normal distribution, the probability of exceeding a particular value of the variable x isgiven by

24
)(1)( 00 xFxxP −=≥
where F(x) is the cumulative distribution function for a normal distribution. From Institutionof Engineers, Australia, (1987), F(x0) = 0.0001 when
σµ 719.30 =−x
where µ and σ are the mean and standard deviation of the distribution. Hence, using the datain table 3.2.2, the Bureau of Meteorology conclude that the 1:10,000 AEP annual rainfallestimate for Oenpelli is 2455 mm with a standard error of 85 mm. The 95 % confidence limitfor this estimate, rounded to the nearest 10 mm is 2460 ± 170 mm.
Figure 3.2.2 Distribution of annual rainfall for Oenpelli
The Bureau of Meteorology (1999) notes that an alternative method of calculating annualexceedance probability (AEP) from a relatively short record is to calculate the expectedprobability (Institution of Engineers, Australia, 1987, Beard 1960). Here, ‘expected’ is usedin the statistical sense and the name would be more precisely expressed as ‘Expected AnnualExceedance Probability’. This approach takes the view that one record, such as the Oenpellirecord, is just one sample from a normally distributed population, and it can be shown that,on average, over a large number of samples, the expected probability of estimates of the 1 inY AEP event is always greater than 1 in Y. This implies a higher annual rainfall because it isthe rainfall for the expected probability rather than that for the sample probability. Theconcept is a complex one and the subject is still debated in the literature. However, if theprocedures recommended by Beard (1960) are followed, the estimate of the 1 in 10,000 yearannual rainfall for Oenpelli is 2,510 mm. This estimate is not significantly different from the2,460 mm recommended.
The recommended value of the 1:10,000 AEP annual rainfall is in very good agreement withthe value adopted by ERA in the Draft EIS, namely 2450 mm. The rationale adopted by ERAin deriving this estimate is described in the Supplement to the Draft EIS (page 5–22). ERA
5 0 0
1 0 0 0
1 5 0 0
2 0 0 0
2 5 0 0
3 0 0 0
A v e ra g e R e c u rre n c e In te rv a l ( y e a rs )
A c tua l
F it tedd is t r ibu t ion
.1 .0 5 .0 1
A n n u a l E xc e e d a n c e P r o b a b i l ity
.2.5.8.9 .0 0 1
2 5 1 0 2 0 1 0 0 1 0 0 01 .2 5

25
used the Jabiru rainfall data because (as noted above) the mean annual rainfall for Jabiru isgreater that the long-term mean for Oenpelli and this approach should yield a conservativeresult. However, the highest recorded rainfall in 1975–76 was attributed to an averagerecurrence interval of 85 years based upon the observation that this rainfall was higher thanany that had occurred in the 85 year record at Oenpelli. In support of this approach, ERA alsopointed out that the 1:10,000 AEP derived from the Oenpelli record is 2461 mm (using dataup to 1996). The Bureau of Meteorology (1999) provides the assessment that while there isno statistical evidence for treating the 1975/76 Jabiru rainfall as an outlier, the fact thatOenpelli also experienced it’s highest annual rainfall report on record in 1975/76 providessome physical justification for reassigning its plotting position. Thus, the validity of theapproach adopted by ERA may be questioned, but there is justification for the approach andthe outcome was that, essentially, the Oenpelli 1:10,000 AEP was adopted, which is inagreement with the conclusion of this report.
The 1:10,000 AEP annual rainfall was also estimated by Chiew and Wang (1999) who used astochastically generated daily rainfall distribution based upon the Oenpelli rainfall record.The result obtained was 2702 mm, a value that is higher than that recommended by theBureau of Meteorology (1999) by almost three standard errors. Chiew and Wang (1999)argue that the difference is attributable to model dependence which is not taken into acountin the error estimated by the Bureau of Meteorology (1999). However, while the observedskewness of the daily rainfall data is well reproduced in Chiew and Wang’s model, themodelled skewness in the annual data is 0.37 compared to the observed value of –0.018 ±0.257. The positive skewness of the stochastically generated data will lead to higherpredictions for rainfall in extremely wet years.
In summary:
• It is recommended that the Oenpelli rainfall record for the years 1917 to 1998 should beused for estimating the 1:10,000 AEP rainfall and for other hydrological modelling forthe Jabiluka project because it is much more extensive than that at Jabiru and isconsistent with the Jabiru record in the period of overlap.
• The recommended value for the 1:10,000 AEP rainfall is 2460 mm with 95% confidencelimits of ±190 mm. This estimate is in very good agreement with the value adopted byERA, 2450 mm.
• It is acknowledged that there may be some residual model dependence in therecommended value for the 1:10,000 AEP rainfall. However, this is not important formodelling of the Jabiluka water management system in this review because a MonteCarlo simulation method is used based upon stochastically generated rainfall data.
3.3 Evaporation from open water
Wasson et al (1998) raise two issues related to the credibility of ERA’s estimates of waterlosses by evaporation in the water retention pond at Jabiluka. These issues are:
• the appropriateness of the pan factors used to convert observed Class-A pan evaporationmeasurements to pond evaporation estimates, and
• the significance for water balance modelling of the failure to take into account theinverse relationship between evaporation and rainfall

26
3.3.1 Pan factorsWasson et al (1998) note the use by ERA of two simple seasonal factors to estimate pondevaporation from pan measurements; 0.6 in the Dry season (May–October) and 0.75 in theWet season (November–April). They assert that there is a need to check these factors byappropriate modelling that incorporates existing solar radiation data and that the extensiveevaporation study conducted at Manton Dam, south of Darwin, needs to be taken intoaccount.
The approach outlined above was adopted by ERA in the draft EIS in 1996 but Wasson et al(1998) seem to have been unaware that ERA adopted a more sophisticated approach in thePER for the Jabiluka Mill Alternative. It was the proposal for the Jabiluka Mill Alternative,presented in 1998, which was the subject of investigations conducted by the Mission of theWorld Heritage Committee to Kakadu. ERA outlined in Appendix B1 of the PER theprocedure adopted in estimating evaporation from the retention pond. Pan factors for eachmonth of the year were adopted following a review of all existing evaporation data relevantto the region by CSIRO (Hatton 1997). The conclusion of Hatton (1997) was that, with theexception of the two months of April and October, the pan factors derived by the SupervisingScientist (Vardavas 1987) should be used in all water balance calculations.
100
150
200
250
300
Sep Oct Nov Dec Jan Feb Mar Apr May Jun Jul Aug
Mon
thly
eva
pora
tion
(m
m)
x PPEAPE
pan evaporation x pan factor
Figure 3.3.1 Comparison of average monthly storage evaporation estimates andpoint potential and areal potential evapotranspiration rates
Vardavas (1987) modelled the seasonal variations of net solar and net terrestrial radiation andevaporation for water bodies in the wet-dry tropics of northern Australia. The input to themodel consisted of short-term and long-term average meteorological data describing theseasonal changes in atmospheric conditions. He compared his calculations of radiation andevaporation with those determined in the 2-year field study at Manton Dam and 15 years ofsolar radiation measurements at Darwin and found excellent agreement between hiscalculations and the measured variables. He then applied the model to the specific case ofevaporation from ponds at the Ranger mine at Jabiru. Hence, all of the suggestions ofWasson et al (1998) had already been taken into account in the evaporation calculationspresented by ERA in its hydrological modelling of the water management system for the

27
Jabiluka project and the scientific information underlying the modelling was based uponprevious work of the Supervising Scientist.
Despite this, a further investigation of this issue was sought by the Supervising Scientist aspart of this review. The University of Melbourne (Chiew & Wang 1999) re-examined theappropriateness of the pan coefficients proposed by Hatton (1997). The average monthlyevaporation rates derived using these coefficients were compared with point potentialevapotranspiration (PPE) and areal potential evapotranspiration (APE) estimates. The PPEand APE estimates were extracted from the digital maps of evapotranspiration of Australiaprepared by the Cooperative Research Centre for Catchment Hydrology. In simple terms, thePPE is the rate of evapotranspiration from a small wet area in an existing environment, whilethe APE is the rate of evapotranspiration if a large area is well watered. The storageevaporation rate is expected to be somewhere between the PPE and the APE, and closer toAPE during the Wet season due to the lower advective energy at this time. On the basis of anassessment against this criterion, Chiew and Wang (1999) concluded that all coefficientsexcept the April and October figures were appropriate and recommended that the Vardavas(1987) values should be used for all months.
Figure 3.3.1 shows the evaporation rates calculated using the Vardavas (1987) pancoefficients and these are compared to the APE and PPE values. All of the Vardavascalculations are in agreement with the seasonal pattern of the APE and the PPE. For Februaryand March, the estimated storage evaporation rates are lower than the APE and Chiew andWang (1999) concluded that this could be due to errors in the recorded pan evaporation(because of the difficulty in accurately estimating pan evaporation when rainfall is high) orerrors in the APE estimates. The overall conclusion was, however, that the best estimates ofpond evaporation for Jabiluka would be obtained by using the results of Vardavas (1987).
The difference in annual pond evaporation arising from the use of the full set of Vardavascoefficients compared to that obtained using the coefficients adopted by ERA in the PER forJabiluka is about 2%. This difference is clearly very small compared to other uncertainties inthe modelling of water management and it can be concluded that there is no significant errorin evaporation estimates for the Jabiluka water management system arising from the pancoefficients used by ERA in the PER for Jabiluka.
3.3.2 Inverse relationship between evaporation and rainfallWasson et al (1998) state that the principal source of error in the evaporation calculations ofERA arises from neglect of the inverse relationship between evaporation and rainfall whicharises because solar radiation is lower on cloudy days than on sunny days. They suggest thatthe adoption of long-term mean values for the pan factors will result in a significant over-estimate of evaporation in very wet months and that this effect could exceed 10% during verywet years.
Chiew and Wang (1999) investigated the significance of the inverse relationship betweenevaporation and rainfall using data from a number of meteorological stations in the north ofthe Northern Territory including Jabiru, Maningrida, Middle Point and Darwin. They foundthat a linear inverse relationship was statistically significant for both the annual data and thequarterly data at each station and that it was most significant at Jabiru. They concluded thatthis effect should be taken into account in their modelling of the water management system atJabiluka and they evaluated the significance of the effect on the required pond volume. Theconclusion reached was that the retention pond volume would need to be increased by about3% as a result of both the inverse relationship and interannual variability in evaporation.
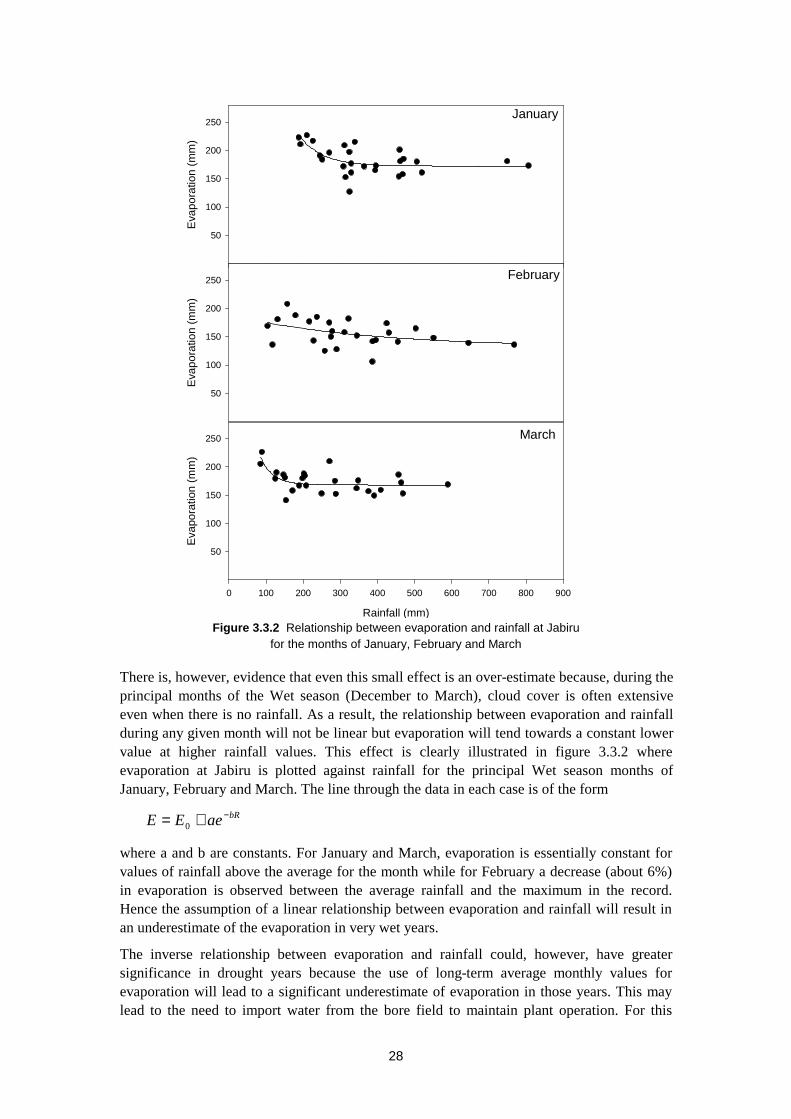
28
Figure 3.3.2 Relationship between evaporation and rainfall at Jabirufor the months of January, February and March
There is, however, evidence that even this small effect is an over-estimate because, during theprincipal months of the Wet season (December to March), cloud cover is often extensiveeven when there is no rainfall. As a result, the relationship between evaporation and rainfallduring any given month will not be linear but evaporation will tend towards a constant lowervalue at higher rainfall values. This effect is clearly illustrated in figure 3.3.2 whereevaporation at Jabiru is plotted against rainfall for the principal Wet season months ofJanuary, February and March. The line through the data in each case is of the form
bRaeEE −+= 0
where a and b are constants. For January and March, evaporation is essentially constant forvalues of rainfall above the average for the month while for February a decrease (about 6%)in evaporation is observed between the average rainfall and the maximum in the record.Hence the assumption of a linear relationship between evaporation and rainfall will result inan underestimate of the evaporation in very wet years.
The inverse relationship between evaporation and rainfall could, however, have greatersignificance in drought years because the use of long-term average monthly values forevaporation will lead to a significant underestimate of evaporation in those years. This maylead to the need to import water from the bore field to maintain plant operation. For this
January
Eva
pora
tion
(mm
)
50
100
150
200
250
February
Eva
pora
tion
(mm
)
50
100
150
200
250
March
Rainfall (mm)
0 100 200 300 400 500 600 700 800 900
Eva
pora
tion
(mm
)
50
100
150
200
250

29
reason, it is recommended that a linear relationship between evaporation and rainfall isincorporated in future water management modelling because this will yield conservativeresults under high rainfall conditions and more realistic results under drought conditions thanwould be obtained using the long-term monthly average evaporation.
The Supervising Scientist’s conclusions on the claims of Wasson et al (1998) on thedeficiencies of ERA’s estimates of evaporation from open water at the Jabiluka site are:
• All of the suggestions made by Wasson et al (1998) to check the validity of theevaporation pan factors used by ERA had already been taken into account in theevaporation calculations presented by ERA in its hydrological modelling of the watermanagement system for the Jabiluka project.
• Based upon two recent independent reviews, it is recommended that, in all futurehydrological modelling of the Jabiluka water management system, the pan factorsproposed by the Supervising Scientist in 1987 be used.
• The difference in annual pond evaporation arising from the use of the pan factorsrecommended by the Supervising Scientist compared to that obtained using the factorsadopted by ERA in the PER for Jabiluka is small (about 2%). This difference is wellwithin current expectations of the accuracy of water management modelling.
• The volume of the retention pond at Jabiluka would need to be increased by about 3% totake into account the inter-annual variation in evaporation and the inverse relationshiprelationship between evaporation and rainfall.
• This estimate is, however, considered to be an overestimate because the relationshipbetween evaporation and rainfall is not linear. Rather, evaporation during the mainmonths of the Wet season tends towards a constant value at high rainfall values.
• It is recommended that a linear relationship between evaporation and rainfall isincorporated in future water management modelling because this will yield conservativeresults under high rainfall conditions and more realistic results under drought conditionsthan would be obtained using the long-term monthly average evaporation.
3.4 Evaporation in the mine
In both the Environmental Impact Statement and the Public Environment Report, ERAproposed the use of enhanced evaporation in the exit stream of the ventilation system toremove water from the Total Containment Zone at the Jabiluka mine. Air passing through theunderground workings and stopes will evaporate free water which will subsequently bedischarged via the ventilation exhaust system. The company plans to maximise this form ofenhanced evaporation in years in which there is surplus water in the system by transferringexcess water from the TCZ water storage pond for subsequent evaporation in the ventilationsystem. Disposal of this excess water would be by the use of sprays or misting devices nearthe exhaust ventilation vents with monitors to maintain humidity of the exhaust air below85% (or any other designated safe level) to avoid the emission of droplets from the vents.
The calculations presented by ERA in the EIS and the PER show that disposal of 40,000 m3
per annum should be possible in the ventilation shafts, with this value increasing to a total of90,000 m3 when evaporation from all underground sources is taken into account. For theJabiluka Mill Alternative (original proposal) in extremely wet years, this figure representsabout 20% of the total losses in the water balance model (table B.1.8 in Appendix B of thePER). This percentage will not be greater in a system that meets the requirements of the

30
Commonwealth Government (in which all tailings will be returned underground) becauseevaporation from the tailings ponds was not included in the water balance modellingpresented in the PER.
The submission of Wasson et al (1998) states (page 13) that a major error exists in thecalculations presented in the EIS and the PER for the quantity of water that can beevaporated in the ventilation shafts. They point out that the latent energy of evaporation hasto be taken from the air stream resulting in a drop in the air temperature; this, in turn, willreduce the capacity of the air to hold moisture.
The basic physics underlying these statements is not disputed by the Supervising Scientist butthe conclusion that a major error is present in the calculations is not supported.
As stated in Appendix J of the draft EIS, the absolute humidity or water vapour density, p,may be calculated from the ideal gas law which, when the vapour pressure, Pv, is given inkPa, reduces to
TPvp /167.2= (1)
where p is in kg/m3 and T is in oK. Figure 3.4.1 (upper graph) shows the dependence ofvapour pressure on temperature at an atmospheric pressure of 100 kPa; the data were takenfrom Kaye and Laby (1978, p 173). From these data the absolute humidity values have beencalculated using equation (1); they are presented in figure 3.4.1 (lower graph).
For T=30 oC, the values of p for 85% and 60% relative humidity are 0.0259 kg/m3 and0.0182 kg/m3 respectively. If no external energy is provided, the latent heat of vaporisationfor the difference, 0.0077 kg/m3 would need to be provided by the air stream. This wouldresult in a drop in temperature, ∆T, given by
pCpLT ρ/∆=∆ (2)
where ∆p is the change in humidity, L is the latent heat of vaporisation, ρ is the density of airand Cp is the specific heat of air. Using L = 2.43 106 J/kg (Kaye & Laby 1978, p 235),ρ = 1.149 kg/m3 (Kaye & Laby 1978, p 18) and Cp = 1010 J/kg/oC (CRC 1995, p 6-1), thedecrease in temperature resulting from the vaporisation of the water would be 16ºC. As canbe seen from figure 3.4.1, the absolute humidity (ie fully saturated) at 14ºC is about0.012 kg/m3, a figure considerably less than the initial vapour density. Hence, the targetevaporation figure cannot be achieved.
The optimum performance of the proposed system can be derived as follows. As water isadded to the air stream and evaporated, the water vapour density will increase linearly withdecreasing temperature until a temperature is reached at which the air stream is saturated.The gradient of this linear relationship is given by
CmkgLCdTdp op /)/(1078.4// 34−−=−= ρ (3)
Hence,
))(/( 00 TTLCpp p −−= ρ (4)
For 60% relative humidity, p0 = 0.0182(kg/m3) at T0 = 30ºC. This line is shown infigure 3.4.1. It intercepts the graph of absolute humidity at about 23.6ºC which, as proposedby Wasson et al (1998), is the wet bulb temperature (estimated as 23.8ºC from the data inCRC (1995) p15−22). At this temperature the absolute humidity is 0.0213 (kg/m3). Thus themaximum quantity of water that can be evaporated is

31
)./(0031.00182.00213.0 3mkgp =−=
This value is about 40% of the design value presented in Appendix J of the draft EIS.
Figure 3.4.1 Variation of saturated vapour pressure (upper graph) and absolutehumidity (lower graph) with temperature at atmospheric pressure P=100kPa
These observations, however, do not imply that a major error exists in the proposal putforward for water management at the Jabiluka mine. If the latent heat of evaporation were tobe supplied (for example, by standard humidifiers) there would be no need to take the abovedrop in temperature into account and the volume of water that could be evaporated wouldremain that estimated in the EIS and the PER. The Supervising Scientist consulted theengineer who advised ERA on this issue (Mr Douglas Rudd, Kinhill Pty Ltd) who advisedthat the calculations were provided to indicate the capacity of the ventilation system todispose of additional water through evaporation. It was recognised that energy input viaheaters, hot air blowers or staged misting/humidifiers would be required to achieve the fullindicated disposal volume. These issues were, however, matters to be dealt with at thedetailed design stage of the project when the potential of this method of water disposal couldbe evaluated (ie a cost benefit analysis) in a comparison with other methods such asincreasing the area of the retention pond.
Absolute Humidity
Temperature (oC)
5 10 15 20 25 30 35 40 45
Abs
olut
e H
umid
ity (
kg/m
3 )
0.01
0.02
0.03
0.04
0.05
dp/dT = -ρCp/L
Saturated Vapour PressureS
atur
ated
Vap
our
Pre
ssur
e (k
Pa)
1
2
3
4
5
6
7

32
However, the power consumption of such a system could be considerable. The powerconsumption of a humidifier designed to provide the latent heat of evaporation will bedetermined by the operating conditions in the Dry season when the maximum evaporativecapacity exists. To estimate the power required, the data presented in table J.2 of Appendix Jof the draft EIS have been used.
For the period August to November, the total evaporation rate is R = 35 m3/h. Hence thepower required (assuming 100% efficiency) is
MWmkgkgJLsmRW 24)/()/()/( 33 == ρ
The capital cost and the operating costs for the humidifier will, therefore, be considerable. Inaddition the relative environmental advantages and disadvantages associated with theestablishment of the required generator capacity at Jabiluka would need to be assessed. Thelatter would need to be compared to the alternative option of increasing the area of theretention pond.
The area of the retention pond would need to rise from 9 ha to approximately 13 ha toprovide the required evaporative capacity if no evaporation occurs in the ventilation shafts.This area is small compared to the total area of retention and tailings ponds proposed in theoriginal JMA proposal and is only 2% of the disturbed area at the nearby Ranger mine. Theenvironmental impact arising from such an increase, should it need to be part of the project,is, therefore, not considered to be significant.
In summary,
• The observation by Wasson et al (1998) that the latent heat of evaporation needs to besupplied is correct. The conclusion that this results in a major error is, however, invalidbecause the energy required can be supplied externally, and it was the intention of thedesign engineer that the optimum way of doing this would be assessed at the detaileddesign stage once approval for the project to proceed had been given.
• The capital and operating costs of a humidifier system designed to meet the evaporationenergy needs would be high and a cost benefit analysis of various water managementoptions will be required before a final decision on the installation of a humidifier systemis made.
• If it is decided that the cost of installing and running a humidifier system is too high orthat the environmental impact is unacceptable, the retention pond at Jabiluka would needto be increased in area from 9 ha to about 13 ha. Given the experience of the RangerMine, which has a disturbed area of about 500 ha, this 4 ha increase is not expected togive rise to any detectable environmental impact.
3.5 Summary of findings on hydrological modelling issues
The conclusions and recommendations of the Supervising Scientist on the hydrologicalmodelling issues raised by Wasson et al (1998) are as follows.
Estimate of the 1:10,000 AEP annual rainfall
• It is recommended that the Oenpelli rainfall record for the years 1917 to 1998 should beused for estimating the 1:10,000 AEP annual rainfall and for other hydrologicalmodelling for the Jabiluka project because it is much more extensive than that at Jabiruand is consistent with the Jabiru record in the period of overlap.

33
• The recommended value for the 1:10,000 AEP annual rainfall is 2460 mm with 95%confidence limits of ±190 mm. This estimate is in very good agreement with the valueadopted by ERA, 2450 mm.
• It is acknowledged that there may be some residual model dependence in therecommended value for the 1:10,000 AEP annual rainfall. However, this is not importantfor modelling of the Jabiluka water management system in this review because a MonteCarlo simulation method is used based upon stochastically generated rainfall data.
Evaporation from open water
• All of the suggestions made by Wasson et al (1998) to check the validity of theevaporation pan factors used by ERA had already been taken into account in theevaporation calculations presented by ERA in its hydrological modelling of the watermanagement system for the Jabiluka project.
• Based upon two recent independent reviews, it is recommended that, in all futurehydrological modelling of the Jabiluka water management system, the pan factorsproposed by the Supervising Scientist in 1987 be used.
• The difference in annual pond evaporation arising from the use of the pan factorsrecommended by the Supervising Scientist compared to that obtained using the factorsadopted by ERA in the PER for Jabiluka is small (about 2%). This difference is wellwithin current expectations of the accuracy of water management modelling.
• The volume of the retention pond at Jabiluka would need to be increased by about 3% totake into account the inter-annual variation in evaporation and the inverse relationshiprelationship between evaporation and rainfall.
• This estimate is, however, considered to be an overestimate because the relationshipbetween evaporation and rainfall is not linear. Rather, evaporation during the mainmonths of the Wet season tends towards a constant value at high rainfall values.
• It is recommended that a linear relationship between evaporation and rainfall isincorporated in future water management modelling because this will yield conservativeresults under high rainfall conditions and more realistic results under drought conditionsthan would be obtained using the long-term monthly average evaporation.
Evaporation in the mine ventilation shafts
• The observation by Wasson et al (1998) that the latent heat of evaporation needs to besupplied is correct. The conclusion that this results in a major error is, however, invalidbecause the energy required can be supplied externally, and it was the intention of thedesign engineer that the optimum way of doing this would be assessed at the detaileddesign stage once approval for the project to proceed had been given.
• The capital and operating costs of a humidifier system designed to meet the evaporationenergy needs would be high and a cost benefit analysis of various water managementoptions will be required before a final decision on the installation of a humidifier systemis made.
• If it is decided that the cost of installing and running a humidifier system is too high orthat the environmental impact is unacceptable, the retention pond at Jabiluka would needto be increased in area from 9 ha to about 13 ha. Given the experience of the RangerMine, which has a disturbed area of about 500 ha, this 4 ha increase is not expected togive rise to any detectable environmental impact.

34
4 Prediction and impact of severe weather events
4.1 Introduction
The previous chapter of this report addressed hydrological modelling issues under currentclimatic conditions. It included, however, an assessment of ‘severe weather events’ in thesense of severe annual rainfall events that would only be expected to occur once in10,000 years. The submission of Wasson et al to the Mission of the World HeritageCommittee (Wasson et al 1998) addressed a number of other types of ‘severe weather events’such as:
• evidence in the historical record of very severe weather events,
• the appropriateness of estimates of Probable Maximum Precipitation events (PMP), and
• the effect of climate change on the design of water management systems.
These issues are addressed in this chapter.
4.2 Evidence on past severe weather events in the region
In their submission to the Mission of the World Heritage Committee, Wasson et al (1998)presented evidence that, in the past, climatic conditions in the region have been very differentto current conditions. They refer to the work of Wasson et al (1992) in which it was shownthat a transition from a much drier climate took place somewhere between 1900 and1400 years before present. They also refer to the work of Nott (1996) which demonstratedthat river discharges in Waterfall Creek in the south of Kakadu National Park were about fivetimes larger than current discharges between 8000 and 4000 years before present. On thebasis of this evidence, Wasson et al (1998) conclude that ‘the design of bunds, and all otherstructures to contain tailings, water and other wastes, at both Jabiluka and Ranger, is basedon principles that are grossly inadequate. We simply do not know if the design structures canwithstand the major rainfall events of the future, so the integrity of Kakadu NP cannot beguaranteed with any probability’.
The Supervising Scientist does not dispute the evidence cited by Wasson et al (1998) fromthe work of Nott (1996) and Wasson et al (1992) that the climate of the region has beensignificantly different from the present climate during the past 10,000 years nor theconclusion that similar differences in climate may occur during the next 10,000 years. Whatis disputed, however, is the application of this scientific evidence to the management of waterand tailings at Jabiluka. The criticisms of Wasson et al (1998) are all premised on theassumed need to design and build tailings and water retention dams that will be structurallystable for 10,000 years and will totally contain all water that might accumulate over thisperiod. This assumption is totally incorrect and reflects a lack of understanding of theaccepted proposal for milling at Jabiluka by the authors of the submission.
The storage of tailings or contaminated water on the land surface over a period of10,000 years is not an issue. The project approved by the Minister for the Environmentrequired all tailings to be returned underground to the mine void and to additional stopes orsilos specially excavated to contain the tailings. There will, therefore, be no need to containtailings in surface repositories for any period longer than the mine life, approximately30 years.
Wasson et al (1998) also propose that if the water retention ponds become seriouslycontaminated, then they too will need to be stable for 10,000 years. This is not the case.

35
Following completion of mining, all water in the water retention ponds will evaporate over aperiod of a few years. This will be possible because, on an annual average basis, true pondevaporation exceeds rainfall by about 500 mm per annum. Once the ponds have beenevaporated to dryness, all contaminated sediment in the ponds will be collected and placedunderground with the tailings. The pond structures will then be rehabilitated. There will beno water retention ponds following rehabilitation.
For these reasons, the strongly worded criticism in Wasson et al (1998) that the proponenthas assumed stationarity of climate over a period of 10,000 years is quite without foundation.
4.3 Probable maximum precipitation events
The submission of Wasson et al (1998) notes that the criteria for design of bunds to preventwater from catchments adjacent to the TCZ entering the containment zone are conservative.These included the adoption of runoff coefficients of one and adoption of the 6-minute PMPas the design storm intensity. Similar positive comments were made about the design criteriato prevent water within the TCZ overtopping the containment bunds. They note, however,that PMPs over a 10,000 year period would probably be much greater. This issue has beenaddressed in the previous section where it was concluded that a 10,000 year period is notrelevant to the design of surface structures.
ERA gives a value for the 6-minute PMP in the Draft EIS but does not explain its origin. Forthis reason, the Supervising Scientist requested that a review of PMPs for the region beconducted by the Bureau of Meteorology. The results of this review are given in Bureau ofMeteorology (1999).
Point value PMPs for durations from 15 minutes (the minimum value normally calculated) tosix hours were calculated for Jabiluka using the Generalised Short Duration Method (GSDM,Bureau of Meteorology 1994). Then, each PMP (depth in mm) was converted to intensity(mm/hr) and plotted against duration using linear scales. The best-fit to this intensity vsduration curve was a power law (R2 = 0.99). The curve was extrapolated back to obtain anestimate of the 6-minute intensity of 1380 mm/hr.
A second approach adopted was based on the Intensity-Frequency-Duration (IFD) ratio. IFDinformation was produced for the nearest grid point to Jabiluka. For 100 year IFD, the ratioof the 6-minute to the 15-minute intensities was calculated. The 15-minute PMP intensity wasthen multiplied by this ratio to obtain an estimate of the 6-minute PMP of 1320 mm/hr.
These two estimates of the 6-minute PMP differ by less than 4%, leading to some confidencein the estimate. In the interests of conservatism, the larger value of 1380 mm/hr isrecommended. The 6-minute PMP intensity estimate adopted by ERA (Draft EIS,Appendix J, page J3) for the Jabiluka project is 1150 mm/hr, approximately 20% lower thanthe value recommended by the Bureau of Meteorology. It is recommended that the Bureauvalue be used in the detailed design of the Jabiluka project.
A full set of PMP values appropriate for Jabiluka is provided by the Bureau of Meteorology(1999). The effect of climate change over the next 30 years is discussed in the next section.
4.4 Effect of climate change on hydrological modelling
It was concluded in section 4.2 that the effects of climate change over the next 10,000 yearsneed not be considered in the design of the surface water storage facilities at Jabiluka.However, what is required is that possible or likely variations in climate over the next30 years are properly taken into account in the design of the water management system.

36
This requirement was pointed out by the Supervising Scientist in his comments on the DraftEIS. ERA responded (Supplement to the Draft EIS, p5–27) that ‘Current indications ofclimate change are that the margins of change are less than the order of accuracy ofcalculations. The adoption of extreme events used for water balance calculation will morethan accommodate any fluctuations that may be associated with any greenhouse influencesover the 28 years of mine operation’.
The assessment that greenhouse associated effects are likely to be small over the next30 years was considered valid (see further discussion below) but the Supervising Scientistwas also conscious of the need to take into account non-greenhouse effects such as periodicchanges in the mean annual rainfall that occur in the past meteorological record. These hadbeen identified previously by the Supervising Scientist (Carter 1990).
The decision of the Minister for the Environment on the Jabiluka Mill Alternative requiredthe proponent, ERA, to prepare an amended proposal to the satisfaction of the SupervisingScientist under which all tailings would be stored underground. The issue of climate changeover the next 30 years is an issue that would have been addressed when assessing the detaileddesign proposed by ERA. Given the concerns expressed by the World Heritage Committee,the assessment of climate change effects has been brought forward and has been carried outby the Supervising Scientist as part of this review rather than being commissioned by ERA aspart of its detailed design study.
4.4.1 Review of existing information on climate changeThe CSIRO Division of Atmospheric Research carried out a three year study (1994–1997) on‘Climate change under enhanced greenhouse conditions in northern Australia’ under aconsultancy with the governments of the Northern Territory, Western Australia andQueensland. The final report on the project (CSIRO 1998) was published in January 1998.
The results obtained in this project were inconclusive on the issue of expected changes overthe next 30 years in mean rainfall in the region. All models used in the project broadly agreedthat there would be a decrease in Dry season rainfall. However, global climate models(GCM) with simplified oceans (Slab models) indicated a likely increase in Wet seasonrainfall (in the range 2–12 per cent) by 2030, whereas coupled ocean models show a decrease(0–8 per cent) by 2030 for Wet season rainfall. Since most of the rainfall occurs in the Wetseason, this disparity is important.
In Slab models, a simplified ocean component is used, usually consisting of a well-mixed50 m layer and climate changes are simulated for a changed equilibrium state. That is, theclimate is assumed to have settled down following stabilisation of greenhouse gas emissions,a situation that will not occur for the foreseeable future. Slab models are, therefore, notexpected to be reliable for transition conditions over the next 30 years.
Coupled ocean models, on the other hand, have a full ocean model that is coupled to theatmosphere. They are dynamic models that can directly simulate transient climate conditionsand are expected to be more reliable in their predictions for the next 30 years.
An important issue in making climate change predictions for specific regions is that theGCMs, both Slab and coupled ocean models, have coarse resolution (grid point spacingtypically 300–500 km). To obtain more detailed and realistic predictions for expectedchanges in rainfall at the regional level, it is necessary to nest regional climate models (suchas the CSIRO model DARLAM) into the global climate models. At the time of publication ofthe report on climate change in northern Australia (CSIRO 1998), DARLAM had only been

37
incorporated in Slab models, not in the more realistic coupled ocean models. The reportidentified this as the next step required for climate change modelling in northern Australia.
Thus, the response by ERA that greenhouse induced changes were not expected to besignificant for hydrological modelling over the next 30 years has some justification becauseall of the coupled ocean models, which are considered to be more realistic, predicted areduction in Wet season rainfall. However, until regional climate models are incorporatedinto the global climate models, this conclusion should be considered preliminary.
Figure 4.4.1 Cusum plot for the annual rainfall records at Oenpelli showing low averagerainfall from 1932–1952 and high average rainfall from 1970–1984
The above discussion refers only to greenhouse induced change in climate and does notinclude decadal-scale change due to natural climatic variability. Indeed, the methods used inanalysing past data to test for greenhouse induced change involve the specific removal ofdecadal-scale trends from the record. In this case, decadal-scale change must be separatelyexamined (Jones at al 1999).
It was noted in section 3.2.1 above that the Supervising Scientist (Carter 1990) used a cusumtechnique to examine long-term cycles or trends in the mean annual rainfall at a number ofmeteorological stations in the Northern Territory using rainfall records up to 1988. Thisanalysis revealed that the period between the mid-1960s until the mid-1980s was one ofsignificantly higher average rainfall than the long term mean. This conclusion was valid forthe stations at Darwin, Oenpelli, Pine Creek and Katherine.
The cusum analysis for the Oenpelli data set, including rainfall records from 1991–1998, isshown in figure 4.4.1. It can be shown (eg Mittag & Rinne 1993) that the gradient of thecusum graph at time t is the difference between the mean at that time and the long-term mean.The data in figure 4.4.1, therefore, show that, at Oenpelli, there have been two extendedperiods in the past 87 years during which the mean annual rainfall for the period has beensignificantly different from the long-term mean annual rainfall. From 1932–1952, the meanrainfall was about 1220 mm, lower than the long-term mean by about 13%. From 1970–1984the mean rainfall was about 1600 mm, higher than the long-term mean by about 15%. It isclear that such decadal-scale variation in mean rainfall could have a significant impact on
Cusum Plot for Oenpelli
Year
1900 1920 1940 1960 1980 2000 2020
Cus
um (
mm
)
-4000
-3000
-2000
-1000
0
1000
2000
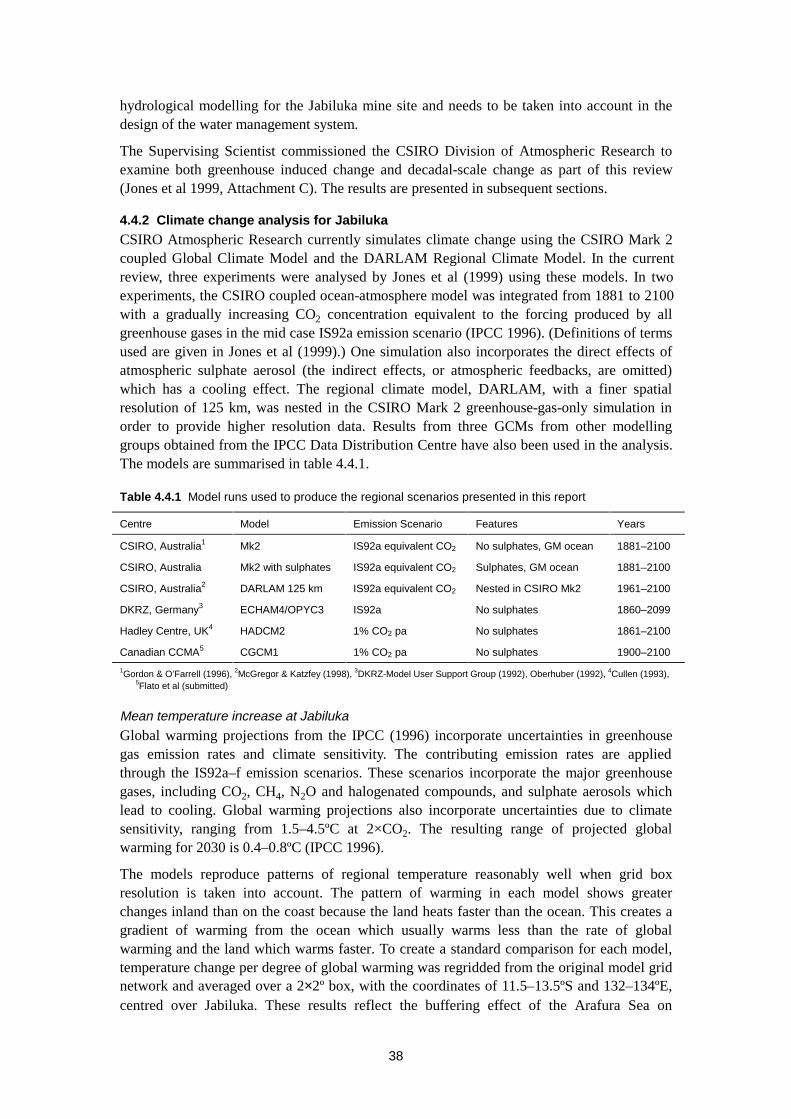
38
hydrological modelling for the Jabiluka mine site and needs to be taken into account in thedesign of the water management system.
The Supervising Scientist commissioned the CSIRO Division of Atmospheric Research toexamine both greenhouse induced change and decadal-scale change as part of this review(Jones et al 1999, Attachment C). The results are presented in subsequent sections.
4.4.2 Climate change analysis for JabilukaCSIRO Atmospheric Research currently simulates climate change using the CSIRO Mark 2coupled Global Climate Model and the DARLAM Regional Climate Model. In the currentreview, three experiments were analysed by Jones et al (1999) using these models. In twoexperiments, the CSIRO coupled ocean-atmosphere model was integrated from 1881 to 2100with a gradually increasing CO2 concentration equivalent to the forcing produced by allgreenhouse gases in the mid case IS92a emission scenario (IPCC 1996). (Definitions of termsused are given in Jones et al (1999).) One simulation also incorporates the direct effects ofatmospheric sulphate aerosol (the indirect effects, or atmospheric feedbacks, are omitted)which has a cooling effect. The regional climate model, DARLAM, with a finer spatialresolution of 125 km, was nested in the CSIRO Mark 2 greenhouse-gas-only simulation inorder to provide higher resolution data. Results from three GCMs from other modellinggroups obtained from the IPCC Data Distribution Centre have also been used in the analysis.The models are summarised in table 4.4.1.
Table 4.4.1 Model runs used to produce the regional scenarios presented in this report
Centre Model Emission Scenario Features Years
CSIRO, Australia1 Mk2 IS92a equivalent CO2 No sulphates, GM ocean 1881–2100
CSIRO, Australia Mk2 with sulphates IS92a equivalent CO2 Sulphates, GM ocean 1881–2100
CSIRO, Australia2 DARLAM 125 km IS92a equivalent CO2 Nested in CSIRO Mk2 1961–2100
DKRZ, Germany3 ECHAM4/OPYC3 IS92a No sulphates 1860–2099
Hadley Centre, UK4 HADCM2 1% CO2 pa No sulphates 1861–2100
Canadian CCMA5 CGCM1 1% CO2 pa No sulphates 1900–2100
1Gordon & O’Farrell (1996), 2McGregor & Katzfey (1998), 3DKRZ-Model User Support Group (1992), Oberhuber (1992), 4Cullen (1993),5Flato et al (submitted)
Mean temperature increase at Jabiluka
Global warming projections from the IPCC (1996) incorporate uncertainties in greenhousegas emission rates and climate sensitivity. The contributing emission rates are appliedthrough the IS92a–f emission scenarios. These scenarios incorporate the major greenhousegases, including CO2, CH4, N2O and halogenated compounds, and sulphate aerosols whichlead to cooling. Global warming projections also incorporate uncertainties due to climatesensitivity, ranging from 1.5–4.5ºC at 2×CO2. The resulting range of projected globalwarming for 2030 is 0.4–0.8ºC (IPCC 1996).
The models reproduce patterns of regional temperature reasonably well when grid boxresolution is taken into account. The pattern of warming in each model shows greaterchanges inland than on the coast because the land heats faster than the ocean. This creates agradient of warming from the ocean which usually warms less than the rate of globalwarming and the land which warms faster. To create a standard comparison for each model,temperature change per degree of global warming was regridded from the original model gridnetwork and averaged over a 2×2º box, with the coordinates of 11.5–13.5ºS and 132–134ºE,centred over Jabiluka. These results reflect the buffering effect of the Arafura Sea on

39
projected temperature in the Jabiluka Region, limiting local warming at, or just below, thelevel of global warming. They are presented in table 4.4.2
Table 4.4.2 Temperature change per degree global of warming from six climate models averaged overthe Jabiluka region (11.5–13.5°S and 132–134°E) on an annual basis
Change perdegree ofglobalwarming
DARLAM 125 CSIRO Mark2(GHG only)
CSIRO Mark2(sulphates)
DKRZ Hadley Centre CanadianCCMA
Annual average 0.86 0.89 0.92 1.01 0.93 1.00
Using the projected global warming of 0.4–0.8°C by 2030, the projected temperature increasein the region of Jabiluka is in the range 0.35–0.8 (rounded to the nearest 0.05°C) from theresults in table 4.4.2.
Greenhouse induced change in mean annual rainfall
The output of each Global Climate Model listed in table 4.4.1 has been analysed by Jones etal (1999) to create regional projections of mean annual rainfall in the region over the next30 years. The results for the Wet and Dry seasons are presented in table 4.4.3. Detailedprojections on a monthly basis are given in Jones at al (1999).
As shown in table 4.4.3, the largest increase in the monsoon season, November to April, is1% per degree of global warming, with decreases of up to 8%. The Dry season producedmuch more variable results ranging from an increase of 8% to a decrease of over 60%. Thesechanges are less important for annual rainfall than those for the Wet season, due to therelatively low average rainfall that occurs during the Dry season.
Using the projected global temperature change in 2030, 0.4–0.8°C, these data indicate arange of change for the Wet season rainfall of +1% to -6% by 2030. Thus, the latestmodelling, which includes the nesting of a regional climate model into the ocean coupledglobal climate model, confirms the expectation that any increase in Wet season averagerainfall due to greenhouse warming is likely to be small (1%).
The confidence invested in this range consists of the confidence in the range of global warmingand the ability of the GCMs to simulate the Australian monsoon. The confidence in the range ofglobal warming is high while for rainfall in the Australian monsoon it is low. Although there areregions where the direction of possible rainfall change can be assessed as fairly robust (thecentral eastern Pacific Ocean), the results for northern Australia show no such consistency.
Table 4.4.3 Percentage change per degree global warming from six climate models averaged over 11–15°S and 130.5–135.5°E for each month and the half-yearly periods, May to October and November toApril
Period DARLAM 125 CSIRO Mark2(GHG only)
CSIRO Mark2(sulphates)
DKRZ Hadley Centre CanadianCCMA
May to Oct 8 5 4 -63 -15 -4
Nov to Apr 1 1 1 -3 -8 0
Long-term trends on mean annual rainfall
Jones et al (1999) analysed the Oenpelli rainfall record to determine historical rainfall trendsand rainfall variability. The results are presented in figure 4.4.2. Significant decadal-scale
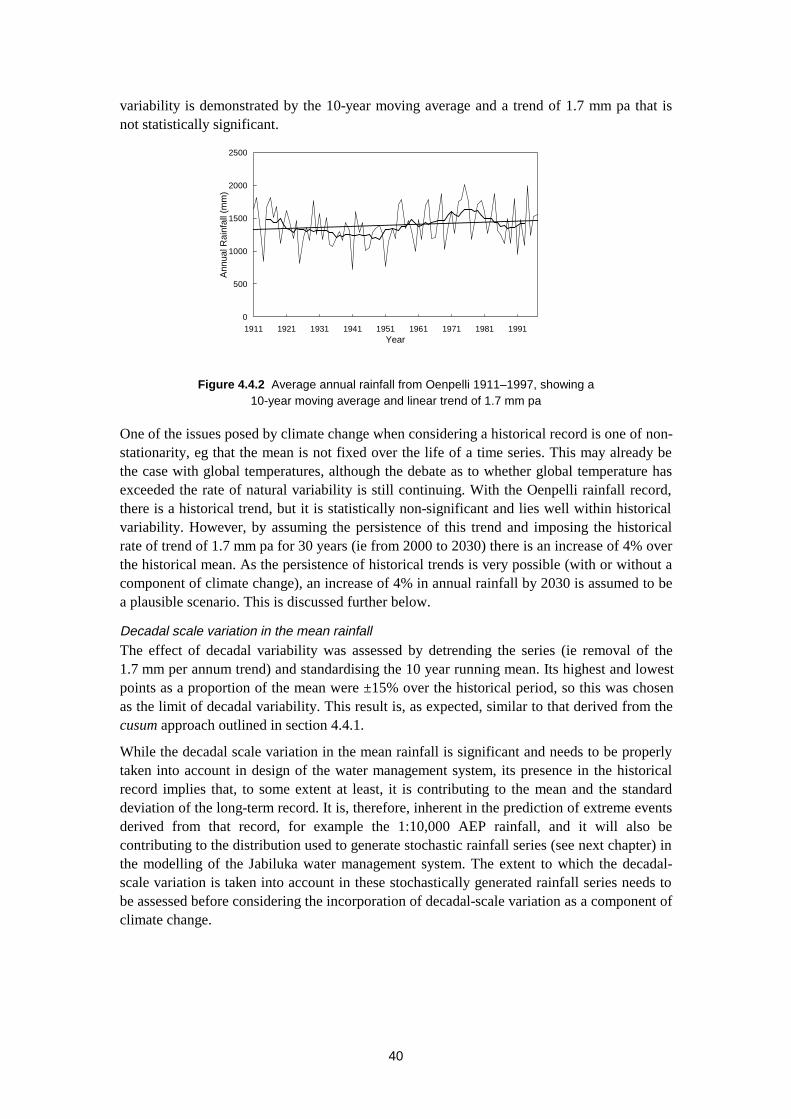
40
variability is demonstrated by the 10-year moving average and a trend of 1.7 mm pa that isnot statistically significant.
Figure 4.4.2 Average annual rainfall from Oenpelli 1911–1997, showing a10-year moving average and linear trend of 1.7 mm pa
One of the issues posed by climate change when considering a historical record is one of non-stationarity, eg that the mean is not fixed over the life of a time series. This may already bethe case with global temperatures, although the debate as to whether global temperature hasexceeded the rate of natural variability is still continuing. With the Oenpelli rainfall record,there is a historical trend, but it is statistically non-significant and lies well within historicalvariability. However, by assuming the persistence of this trend and imposing the historicalrate of trend of 1.7 mm pa for 30 years (ie from 2000 to 2030) there is an increase of 4% overthe historical mean. As the persistence of historical trends is very possible (with or without acomponent of climate change), an increase of 4% in annual rainfall by 2030 is assumed to bea plausible scenario. This is discussed further below.
Decadal scale variation in the mean rainfall
The effect of decadal variability was assessed by detrending the series (ie removal of the1.7 mm per annum trend) and standardising the 10 year running mean. Its highest and lowestpoints as a proportion of the mean were ±15% over the historical period, so this was chosenas the limit of decadal variability. This result is, as expected, similar to that derived from thecusum approach outlined in section 4.4.1.
While the decadal scale variation in the mean rainfall is significant and needs to be properlytaken into account in design of the water management system, its presence in the historicalrecord implies that, to some extent at least, it is contributing to the mean and the standarddeviation of the long-term record. It is, therefore, inherent in the prediction of extreme eventsderived from that record, for example the 1:10,000 AEP rainfall, and it will also becontributing to the distribution used to generate stochastic rainfall series (see next chapter) inthe modelling of the Jabiluka water management system. The extent to which the decadal-scale variation is taken into account in these stochastically generated rainfall series needs tobe assessed before considering the incorporation of decadal-scale variation as a component ofclimate change.
0
500
1000
1500
2000
2500
1911 1921 1931 1941 1951 1961 1971 1981 1991Year
Ann
ual R
ainf
all (
mm
)
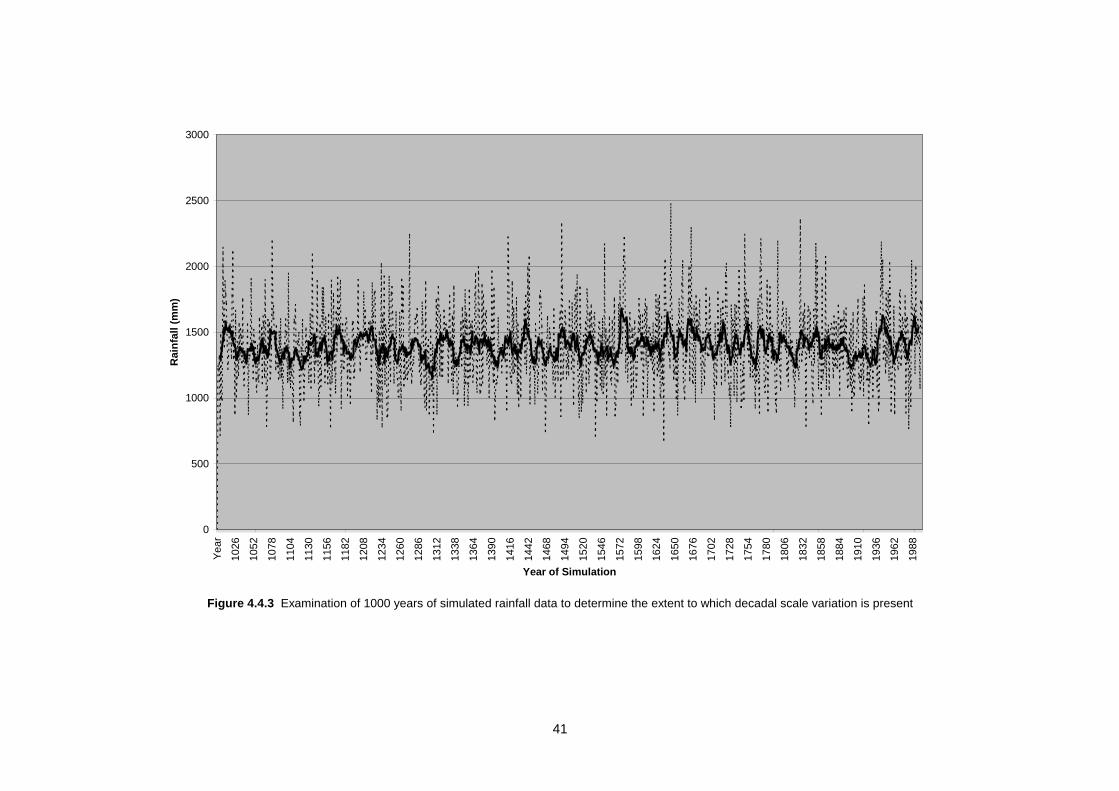
41
Figure 4.4.3 Examination of 1000 years of simulated rainfall data to determine the extent to which decadal scale variation is present
0
500
1000
1500
2000
2500
3000
Yea
r
1026
1052
1078
1104
1130
1156
1182
1208
1234
1260
1286
1312
1338
1364
1390
1416
1442
1468
1494
1520
1546
1572
1598
1624
1650
1676
1702
1728
1754
1780
1806
1832
1858
1884
1910
1936
1962
1988
Year of Simulation
Rai
nfa
ll (m
m)

42
Jones et al (1999) analysed a 1000 year sequence of annual rainfall data stochasticallygenerated by Chiew and Wang (1999) using the procedures described in section 5.2.2 andcompared the statistics of decadal scale variation observed in the generated data with thoseobserved in the rainfall record for Oenpelli. The 1000 year period of generated data is shownin figure 4.4.3; also plotted is the ten year running mean. It is clear that the simulated data docontain extensive periods of both higher-than-average and lower-than-average rainfall.
A shorter sample of that artificial record with the same length as the historical series wasanalysed. It shows decadal-scale variability of a similar magnitude to that of the historicalseries but without the same regularity. The coefficient of variability of the 10-year movingaverage for the shorter record from the 1000-year sample is 6.0±4.2% while for the historicalseries it is 6.5±4.1%. It can be concluded, therefore, that decadal scale variability has beenfully accounted for in the hydrological modelling of the Jabiluka water management systempresented in section 5.2.3 and there is no justification for adding such a component into aclimate change scenario.
The long-term average of the sample also exhibited a trend upwards of 1 mm pa, similar tothe historical series at 1.7 mm pa, but the record contains three simulated rainfall totals thatexceed the historical maximum of 2012 mm in the 1975–1976 Wet season. This may be dueto the positively skewed distribution of annual rainfall in the sample of the artificial seriesgenerated and analysed by Chiew and Wang (1999). Therefore, a 3% increase in averagerainfall over the next 30 years is likely to be contained within the trends already sampled andapplied in the hydrological modelling of Chiew and Wang (1999). Jones et al (1999)concluded that further hydrological modelling incorporating an additional 3% increase in themean annual rainfall would only be justified if evidence from new climate simulationsshowed that greater rainfall increases were likely.
Effect of climate change on storm intensity
The effect of climate change on extreme daily rainfall intensity and on PMPs was alsoinvestigated by Jones et al (1999). As in previous studies, it was found that the intensity ofextreme events is likely to increase despite the fact that there is an overall decrease in theannual rainfall. In the Wet season, average rainfall was found to decrease by 4.5% but theintensity and frequency of extreme rainfall increases. For example, the intensity of the 1-in-10 year event increases by 4%, or the present 10-year event becomes a 9-year event by 2030.The decrease in average rainfall requires a reduction in the frequency or intensity ofmoderate events. There is a hint of this in the tendency for smaller increases in the strength ofevents with smaller return periods (and probable decreases in the strength of events withreturn periods of less than 1 year). Hence the largest summer storms become larger, andmoderate downpours become weaker.
An assessment of the significance of these findings on the intensity of storms for the designof water containment ponds at Jabiluka is required. This will be considered in Chapter 5.
The modelling of Jones et al 1999 also suggests that there could be a significant increase inthe magnitude of PMP events, with increases of up to 30% being suggested. Possibleincreases of this magnitude should be taken into account in the final design of the Jabilukawater management system by increasing the height of exclusion bunds.

43
4.5 Summary of findings on severe weather events
Evidence on past severe weather events in the region
• The assumption of Wasson et al (1998) on need to design and build tailings and waterretention dams that will be structurally stable for 10,000 years and will totally contain allwater that might accumulate over this period is incorrect.
• The project approved by the Minister for the Environment required all tailings to bereturned underground to the mine void and to additional stopes or silos speciallyexcavated to contain the tailings. There will, therefore, be no need to contain tailings insurface repositories for any period longer than the mine life, approximately 30 years.Similarly, water retention structures will be evaporated to dryness and rehabilitated at thecessation of mining.
• The strongly worded criticism in Wasson et al (1998) that the proponent has assumedstationarity of climate over a period of 10,000 years is, therefore, without foundation.Citing this and information on significantly different climate regimes in the region in thepast few thousand years as evidence that ‘the integrity of Kakadu cannot be guaranteedwith any probability’ is unjustified.
Probable maximum precipitation events
• The 6-minute PMP intensity estimate adopted by ERA for the Jabiluka project isapproximately 20% lower than the value recommended by the Bureau of Meteorology. Itis recommended that the Bureau value be used in the detailed design of the Jabilukaproject.
• A full set of PMP values appropriate for Jabiluka is provided in this report. It isrecommended that these values be used, where appropriate, in the detailed design of theJabiluka project.
Effect of climate change on hydrological modelling
• As recommended previously by the Supervising Scientist, it is important that possible orlikely variations in climate over the next 30 years are properly taken into account in thedetailed design of the water management system at Jabiluka. This should include non-greenhouse effects such as periodic changes in the mean annual rainfall that occur in thepast meteorological record.
• There is substantial agreement in the predictions of the various climate change models onthe projected temperature increase in the region of Jabiluka by the year 2030. Theincrease is expected to be in the range 0.35–0.8ºC.
• There is substantial agreement in the predictions of the various climate change models,including models that incorporate regional climate modelling, on the likely change in theWet season rainfall in the region of Jabiluka. The predictions range from +1% to -6% by2030. These models confirm previous expectations that any increase in Wet seasonaverage rainfall due to global warming is likely to be small (1%).
• Decadal scale variation is the most significant climate change effect for hydrologicalmodelling of the Jabiluka project. The present review confirms the earlier analysis of theSupervising Scientist that this effect could be as large as 15% over the next 30 years.However, this review has established that stochastic rainfall series modelling, based uponthe Oenpelli rainfall record, fully accounts for decadal scale variability and that there isno need to include this effect explicitly in a climate change scenario.

44
• Analysis of the historical rainfall record at Oenpelli reveals an upward trend of 1.7 mmper annum in the mean annual rainfall that may be attributed to global warming andwhich should be added to the model predictions. The observed trend is not statisticallysignificant but the adoption of a precautionary approach implies that the significance ofthis possible trend should be assessed in hydrological modelling of the Jabiluka project.However, stochastic rainfall series modelling, based upon the Oenpelli rainfall record,also exhibits a similar trend and it is concluded that there is no need to include this effectexplicitly in a climate change scenario.
• As in previous studies, this review has found that the intensity of extreme storm events islikely to increase despite the fact that there is an overall decrease in the annual rainfall.
• Climate change modelling also suggests that there could be a significant increase in themagnitude of PMP events, with increases of up to 30% being suggested. Possible increasesof this magnitude should be taken into account in the final design of the Jabiluka watermanagement system by increasing the height of exclusion bunds. This is an action that canbe incorporated at the detailed design stage.

45
5 Storage of uranium on the surface
5.1 Introduction
The issues to be addressed in this chapter relate to the risks associated with the storage ofuranium in a stockpile within the Total Containment Zone at Jabiluka. The risks are,essentially, twofold;
(a) the risk to the environment arising from a sufficiently intense weather event that thecapacity of the water retention pond for the catchment of the uranium ore stockpile isexceeded, and
(b) the risk to the environment associated with the failure of the pond structure itself.
Assessment of the first issue will bring together the hydrological information in the previoustwo chapters to enable a detailed assessment of the probability of exceeding the availablestorage capacity for a given design of retention pond. The risk to the environment will thenbe assessed using site specific information on water chemistry, ecotoxicology and radiationexposure.
Assessment of the second issue will rely upon estimated risks of dam failure for the type ofdesign proposed by ERA for the retention pond followed by a risk assessment that again usesthe above site specific information.
It must be recognised that the hydrological modelling described in this chapter does not applyto the actual design of the facility that may be constructed at Jabiluka. This is because theMinister for the Environment did not approve the project as proposed by ERA in the PublicEnvironment Report for the Jabiluka Mill Alternative. As stated earlier, the Minister requiredthe disposal of all tailings in the mine void and additional stopes/silos and required ERA toprepare an amended proposal for the approval of the authorities. ERA is currently preparingthe amended proposal.
The Supervising Scientist has chosen to assess the Jabiluka Mill Alternative–OriginalConcept as described in the PER but with the exclusion of the tailings ponds in that proposal.The reason for this choice is that the modified Original Concept is likely to be very similar tothe amended proposal from ERA and because the results of modelling in this review can becompared quantitatively with the results obtained by ERA in the PER. Thus, this chapter doesnot provide a detailed design of the water management system at Jabiluka. However, theresults obtained should be taken into account in such a detailed design by ERA.
5.2 Probability of exceedence of retention pond capacity
5.2.1 Design criterionThe design criterion proposed by ERA in the EIS (p 4–67) for the water management systemat Jabiluka was that, to maintain a policy of no release of water from the Total ContainmentZone, the retention pond system should be designed to contain runoff from a theoreticalextreme Wet season with a 1 in 10,000 annual exceedance probability. This would give aprobability for exceeding the retention pond capacity of 0.01% in any single year ofoperation and an exceedence probability over the 30 year life of the mine of approximately0.3%.
However, the EIS goes on to state that the system should also include a residual volume ofwater from the previous year and the water balance modelling considered a sequence of Wetseasons including the 1:10,000 AEP rainfall year. Thus, the pond volume exceedence
46
probability over the life of the mine was not quantified but it would be expected to be lessthan 0.3% and probably about 0.1%.
In both the Supplement to the EIS and the PER, ERA used Monte Carlo calculations tosimulate 10,000 years of rainfall and then chose specific extreme sequences of wet years todetermine the maximum storage required. The probability of the occurrence of the particularsequences used was not quantified but would be expected to be considerably less than 0.1%over the life of the mine and may have been expected to approach 0.01%.
The approach that has been adopted in this review has been to determine the storage volumerequired to achieve a range of exceedence probabilities and then to perform a risk assessmentfor the protection of people and downstream ecosystems. The range of exceedenceprobabilities calculated is from about 10% to 0.002% over the life of the mine. The lowestvalue was chosen to ensure adequate precision for the storage volume required to achieve anexceedence probability of 0.01%. This procedure is one that not only enables the adoption ofa risk assessment approach but it also enables a quantitative comparison with the outcomes ofthe results obtained by ERA.
5.2.2 Water balance modellingWater balance modelling has been carried out by the University of Melbourne (Chiew &Wang 1999, Attachment D) to assess the Jabiluka Mill Alternative–Original Concept asdescribed in the PER but with the exclusion of the tailings ponds in that proposal. The reasonfor this choice is, as stated above, that the modified Original Concept is likely to be verysimilar to the amended proposal from ERA and because the results of modelling in thisreview can be compared quantitatively with the results obtained by ERA in the PER.
The catchment areas within the Total Containment Zone, including the pond area of 9 ha,water input from mine dewatering and the water losses through mill consumption, ore andplant washdown, evaporation in the mine ventilation system and dust suppression wereassumed to be those estimated by ERA in Appendix B1 of the PER.
Ventilation system evaporative losses
The feasibility of achieving the predicted losses by evaporation in the mine ventilationsystem has been assessed in section 3.4 where it was concluded that, unless a very expensivehumidifier system is installed, the actual losses will be less than assumed by ERA.Nevertheless, ERA’s estimates have been used in the modelling, partly because the modellingwas being carried out simultaneously with the assessment of mine ventilation losses, but alsobecause it was considered important to use ERA’s assumptions so that a meaningfulcomparison with ERA’s conclusions could be achieved.
In the ERA water balance simulations, a constant ventilation loss was assumed throughoutthe year. However, the evaporation potential through the ventilation system is greater in theDry season than in the Wet season because of the greater moisture deficit in the Dry season.This was taken into account by attributing 16% of the total water disposal from theventilation system to the four wettest months (December to March) and the remaining 84% tothe other months, as suggested in the Jabiluka PER Appendices (page B1–9).
Runoff
The runoff calculations used by ERA in its hydrological modelling were assessed by Chiewand Wang (1999) and it was concluded that they were very conservative. The same runoffcoefficients were, therefore, used in the current review. However, Chiew and Wang (1999)used a water balance model to simulate the rainfall-runoff process in which the soil waterstorage capacity is the only parameter, and this parameter is optimised such that the total

47
runoff is the same as that estimated using the above runoff coefficients. Although the totalestimated runoff is the same, the model allows for higher runoff coefficients during wetperiods because the soil is closer to saturation.
Pond evaporation
Based upon the analysis presented in section 3.3, monthly evaporation data were obtainedfrom the Jabiru Airport record for pan evaporation from 1971 to 1998 and the application ofthe pan factors of Vardavas (1987). A very simple algorithm, which included the resultspresented in section 3.3 on the cross-correlation between monthly rainfall and monthlyevaporation, was used to generate monthly pan evaporation data. The monthly panevaporation data generation algorithm is described in Appendix B of Chiew and Wang(1999). The monthly pan coefficients of Vardavas (1987) were then applied. Daily variationin evaporation within a given month was not considered in the water balance simulation.
To evaluate the algorithm, statistics from 1000 years of generated monthly pan evaporationwere compared with the statistics from the observed data. Table 5.2.1 summarises themonthly statistics; a summary of annual statistics is presented in Chiew and Wang (1999).The generated data closely reproduce the observed mean and coefficients of variation for allmonthly and annual values. The skewness is not well reproduced because of the largeuncertainties in the skewness estimated from only 27 years of observed data. This is reflectedin the irregular fluctuation of skewness from month to month. In any case, the skewness inthe data is not important because of the relatively small coefficients of variation.
The cross-correlation between the generated annual pan evaporation and rainfall is – 0.41 inclose agreement with the observed cross correlation of – 0.43.
Table 5.2.1 Comparison of key monthly pan evaporation statistics in the generated and observed data
Mean (mm) CV Skewness
Observed Simulated Observed Simulated Observed Simulated
All data 218 219 0.20 0.19 0.29 0.27
Jan 184 186 0.13 0.12 -0.11 0.01
Feb 156 151 0.15 0.13 0.10 -0.13
Mar 175 175 0.11 0.12 0.61 -0.06
Apr 203 204 0.11 0.11 0.11 -0.20
May 216 216 0.07 0.07 -0.22 -0.41
Jun 204 205 0.07 0.07 0.65 -0.06
Jul 216 216 0.08 0.08 0.72 -0.09
Aug 247 247 0.07 0.07 0.19 -0.03
Sep 268 268 0.08 0.08 1.02 -0.12
Oct 288 287 0.10 0.10 0.59 -0.44
Nov 244 246 0.11 0.11 -0.05 -0.07
Dec 212 214 0.12 0.12 -0.18 -0.11
Rainfall
On the basis of the assessment presented in section 3.2, the Oenpelli rainfall record from1911 until 1998 was adopted in the hydrological modelling of the Jabiluka watermanagement system.

48
The DMM (daily-monthly-mixed) algorithm (Wang & Nathan 1999) described inAppendix A of Chiew and Wang (1999) was used to generate daily rainfall data. Theadvantages of this algorithm are that it has a small number of parameters (six for each month)and is capable of reproducing key characteristic statistics simultaneously at the daily,monthly and annual time periods.
To evaluate the DMM algorithm, statistics from 1000 years of generated daily rainfall datawere compared with the statistics for the observed data. Table 5.2.2 summarises some of thedaily statistics. The table shows that the generated data closely reproduce the observedstatistics, including the skewness which is not used in the model fitting.
Table 5.2.2 Comparison of key daily rainfall statistics in the generated and observed data
Mean (mm) CV Skewness
Observed Simulated Observed Simulated Observed Simulated
All data 3.82 3.81 3.02 3.05 5.52 5.52
Jan 10.90 10.95 1.66 1.69 3.28 3.28
Feb 11.33 11.26 1.58 1.60 3.15 3.14
Mar 9.00 9.01 1.90 1.92 3.58 3.58
Apr 2.60 2.63 3.79 3.89 8.02 8.00
May 0.46 0.44 8.08 7.13 12.16 12.15
Jun 0.05 0.04 16.99 16.94 31.60 31.64
Jul 0.08 0.06 20.55 16.15 25.76 25.79
Aug 0.03 0.01 20.79 23.01 40.85 40.10
Sep 0.16 0.11 11.12 12.00 21.52 21.48
Oct 0.86 0.84 5.92 5.37 12.18 12.13
Nov 3.60 3.59 2.68 2.70 4.96 4.96
Dec 7.19 7.21 2.02 2.02 3.65 3.66
The monthly and annual statistics are presented and assessed in Chiew and Wang (1999).Overall the model reproduces the monthly statistics very well with minor unimportantvariations in the Dry season. The annual mean and the coefficient of variation are almostexactly reproduced but a small positive skewness is produced in the generated data while theobserved skewness is almost zero. This could tend to produce higher rainfalls in very wetyears and is therefore conservative.
5.2.3 Estimation of required storage capacity under current climatic conditionsDaily simulation of the storage water balance is given by
LossesInflowsSS tt −+=+1
where St is the present storage and St+1 is storage on the following day. The inflows into(runoff and mine dewatering) and losses from the storage (evaporation, mill requirement, orewetdown and ventilation loss) were as described above. All the losses were subtracted fromthe storage as long as there was water in the retention pond.
Fifty thousand runs were carried out, with each run simulating the daily storage waterbalance over a 30-year mine life, starting with an empty pond. The largest accumulatedstorage in each run gave an estimate of the storage capacity required such that the retention

49
pond capacity would not be exceeded in that run. The largest of these 50,000 values is,therefore, the estimate of the storage capacity with a 0.00002 (1:50,000) probability of beingexceeded during the 30-year mine life. The tenth largest of these values is the estimate of thestorage capacity with a 0.0002 (or 0.02%) probability being exceeded in the 30-year minelife, and so on.
Figure 5.2.1 Estimates of storage capacity required as a function of exceedenceprobability over the 30-year mine life under current climatic conditions
Figure 5.2.1 shows the estimates of storage capacity required as a function of exceedenceprobability over the life of the mine. The volume of pond proposed by ERA in the PER was810,000 m3. (This is based upon a 9 ha pond of depth 9.5 m (PER p 4–52) of which 0.5 m isfreeboard required to take into account wave action and is therefore not available for storageexcept under emergency conditions.) The data in figure 5.2.1 indicate that the probability ofthis storage capacity being exceeded in the life of the mine would be about 1:1,000. Based onthese simulations, the estimate of storage capacity required to achieve an exceedenceprobability of 0.01% (1 in 10,000) over the 30-year mine life is 940,000 m3 (an equivalentdepth of 10.4 m in the 90,000 m2 storage area).
Comparison of model with that used by ERA
There are several differences between the approach adopted in this review by Chiew andWang (1999) and the approach used by ERA to estimate the required storage capacity(described in Appendix B1 in the Jabiluka PER Appendices).
In the ERA approach, 10,000 years of annual rainfall data were generated using a log-normaldistribution. A 15-year water balance simulation was carried out using a typical 15-yearsequence to provide a base data set. Ten simulations were carried out — with the first year ofthe base data replaced with the wettest of the 10,000 years of the generated rainfall, with thefirst two years of the base data replaced with the wettest two-year sequence, with the first
200000
400000
600000
800000
1000000
0.00001 0.00010 0.00100 0.01000 0.10000
Est
imat
ed s
tora
ge c
apac
ity
(m3 )
Probability of overtopping in the 30-year mine life
1000000
800000
600000
400000
200000
0

50
three years replaced with the wettest three-year sequence, up to the first ten years replacedwith the wettest ten-year sequence.
The simulations were carried out on a monthly time step, with the annual rainfall datadistributed over the 12 months using the same monthly factors for all years of simulations(see table B1.1 in the Jabiluka PER Appendices). Mean monthly storage evaporation rateswere used for the simulations (calculated using Hatton’s (1997) pan coefficients times themean monthly pan evaporation — see discussion in section 3.3). The other water useconsiderations were similar to those used here except for evaporative losses in the ventilationsystem (see section 5.2.2).
The use of a 15-year water balance simulation by ERA instead of a 30-year simulation is, to alarge extent, reasonable because the full evaporative capacity of the ventilation system is notavailable until the tenth year of operation and, therefore, the storage capacity is most likely tobe exceeded in the first few years. (This issue will be further addressed in section 5.2.5.) Thisis probably also the reason why ERA replaced the first years of the base data with the wettestsequence to mimic the extreme wet conditions.
The significance of the other differences between the approach adopted by ERA and thatused in this review is assessed below using a sensitivity analysis.
5.2.4 Sensitivity analysisIt is difficult to carry out a direct comparison between the ERA approach to hydrologicalmodelling and that used for this review. However, Chiew and Wang (1999) investigated thesensitivity of the required storage capacity to each of the variables for which differentassumptions were made by ERA and Chiew and Wang (1999).
For the purpose of the sensitivity analysis, the full simulation procedure described insection 5.2.3 was not adopted since it would have been extremely demanding on computertime. Rather, the model was run a number of times using the actual rainfall and evaporationdata recorded during the period September 1972 and August 1998. Six water balancecalculations were carried out using a monthly time step and three calculations were carriedout using a daily time step. Within these subsets, the procedure adopted to determine rainfall,pond evaporation, evaporation losses in the ventilation system and runoff were varied asindicated in table 5.2.3. Values of the largest storage capacity required in each of the ninemodel runs are tabulated in table 5.2.3; the results are discussed below in terms of thesignificance of the assumptions made. While this procedure is not as thorough as running thefull simulation in each case, the results should be adequate to assess the relative significanceof each assumption.
Interannual variability in evaporation and the correlation between evaporation and rainfall
Runs 1 and 2 are the same except for the use of pan evaporation data. Run 1 uses the actualmonthly pan evaporation data while in Run 2 the mean monthly pan evaporation rates,averaged over the 26 years, are used. Run 1 therefore takes into account the interannualvariability in evaporation and the correlation between evaporation and rainfall while Run 2does not. The results in table 5.2.3 indicate that ignoring the interannual variability inevaporation and the correlation between evaporation and rainfall results in a 3%underestimate of the required storage capacity.
Actual rainfall versus monthly distribution of annual rainfall
Runs 1 and 3 differ only in the use of rainfall data. Run 1 uses the actual monthly rainfalldata, while in Run 3 the annual rainfall is distributed over the 12 months using the monthlyfactors in table B1.1 in the Jabiluka PER Appendices. The use of the actual monthly rainfall
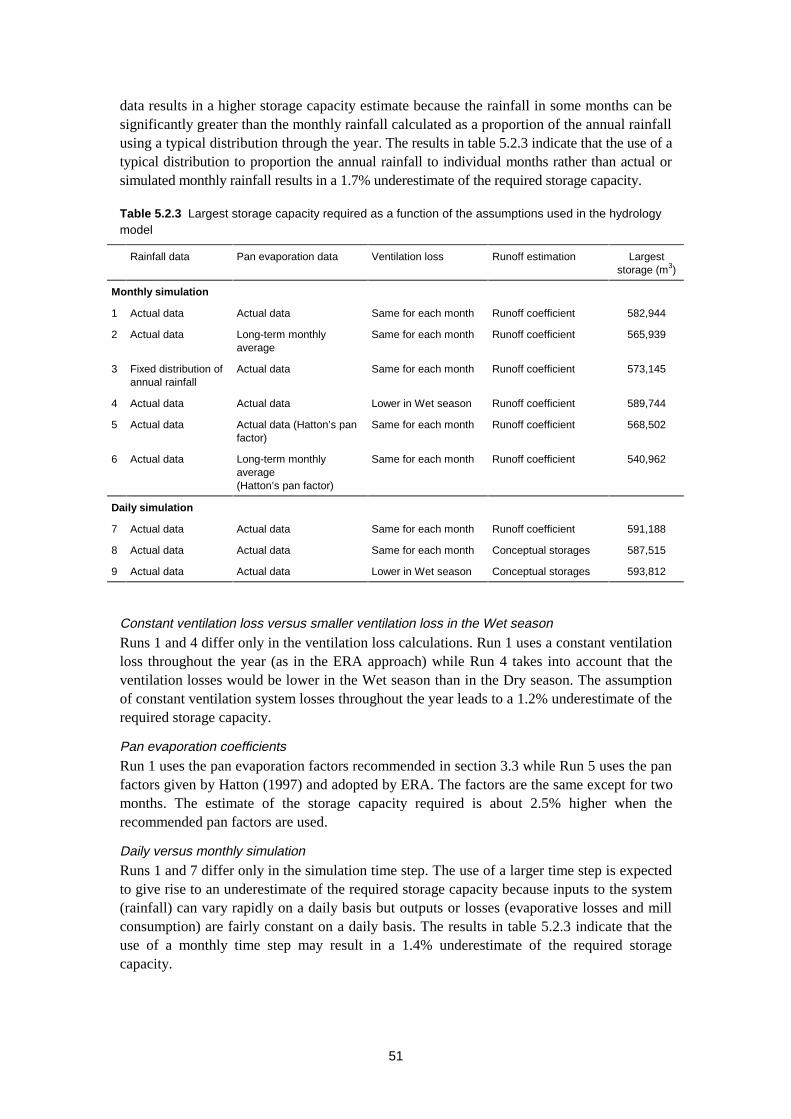
51
data results in a higher storage capacity estimate because the rainfall in some months can besignificantly greater than the monthly rainfall calculated as a proportion of the annual rainfallusing a typical distribution through the year. The results in table 5.2.3 indicate that the use of atypical distribution to proportion the annual rainfall to individual months rather than actual orsimulated monthly rainfall results in a 1.7% underestimate of the required storage capacity.
Table 5.2.3 Largest storage capacity required as a function of the assumptions used in the hydrologymodel
Rainfall data Pan evaporation data Ventilation loss Runoff estimation Largeststorage (m3)
Monthly simulation
1 Actual data Actual data Same for each month Runoff coefficient 582,944
2 Actual data Long-term monthlyaverage
Same for each month Runoff coefficient 565,939
3 Fixed distribution ofannual rainfall
Actual data Same for each month Runoff coefficient 573,145
4 Actual data Actual data Lower in Wet season Runoff coefficient 589,744
5 Actual data Actual data (Hatton’s panfactor)
Same for each month Runoff coefficient 568,502
6 Actual data Long-term monthlyaverage(Hatton’s pan factor)
Same for each month Runoff coefficient 540,962
Daily simulation
7 Actual data Actual data Same for each month Runoff coefficient 591,188
8 Actual data Actual data Same for each month Conceptual storages 587,515
9 Actual data Actual data Lower in Wet season Conceptual storages 593,812
Constant ventilation loss versus smaller ventilation loss in the Wet season
Runs 1 and 4 differ only in the ventilation loss calculations. Run 1 uses a constant ventilationloss throughout the year (as in the ERA approach) while Run 4 takes into account that theventilation losses would be lower in the Wet season than in the Dry season. The assumptionof constant ventilation system losses throughout the year leads to a 1.2% underestimate of therequired storage capacity.
Pan evaporation coefficients
Run 1 uses the pan evaporation factors recommended in section 3.3 while Run 5 uses the panfactors given by Hatton (1997) and adopted by ERA. The factors are the same except for twomonths. The estimate of the storage capacity required is about 2.5% higher when therecommended pan factors are used.
Daily versus monthly simulation
Runs 1 and 7 differ only in the simulation time step. The use of a larger time step is expectedto give rise to an underestimate of the required storage capacity because inputs to the system(rainfall) can vary rapidly on a daily basis but outputs or losses (evaporative losses and millconsumption) are fairly constant on a daily basis. The results in table 5.2.3 indicate that theuse of a monthly time step may result in a 1.4% underestimate of the required storagecapacity.

52
Runoff coefficient versus conceptual rainfall-runoff modelling
Runs 7 and 8 are the same except for the method used to estimate surface runoff. In Run 7,surface runoff is estimated using a runoff coefficient multiplied by rainfall while in Run 8surface runoff is simulated using a conceptual rainfall-runoff model, with the soil capacityparameter optimised to produce the same total runoff as in Run 7. The results in table 5.2.3indicate that the use of constant runoff coefficients results in a small overestimate (about0.4%) of the storage capacity required.
Overall effect of the various assumptions used by ERA
Although the effect of each of the individual assumptions discussed above is quite small, inmost cases the result is an underestimate of the required storage capacity and the cumulativeeffect of these assumptions could be significant. This is illustrated in the comparison of theresults obtained in Runs 6 and 9. In Run 6, the ERA assumptions have been used within theframework of the water balance model described in this review whereas Run 9 uses theassumptions described in this report. The results in table 5.2.3 indicate that the combinedeffect of the use of ERA’s assumptions may lead to a 10% underestimate of the storagecapacity required for a given design criterion. If the pond volume proposed by ERA,810,000 m3, is increased by 10%, the exceedence probability obtained from figure 5.2.1 isabout 0.0002, ie 1 in 5000, over the life of the mine.
There were, as noted in section 5.2.3, other differences in the modelling approach adopted byERA in that, instead of performing a full Monte Carlo calculation of the response of thecatchment to rainfall, ERA performed a Monte Carlo calculation of annual rainfall and thenselected particular sequences of Wet seasons to simulate the response of the catchment. Thepond capacity derived by ERA on this basis was only 706,000 m3. ERA then added additionalcapacity to ensure that adequate storage would be available in subsequent years but there wasno clear indication of what exceedence probability was expected to be achieved using thefinal total capacity of 810,000 m3.
5.2.5 Use of pond evaporation rather than evaporation in the ventilation systemChiew and Wang (1999) investigated the demands on storage capacity as a function of timeduring the life of the Jabiluka project. As was the case for the sensitivity analysis describedabove, the full simulation procedure described in section 5.2.3 was not adopted since it wouldhave been very demanding on computer time. Instead, the model was run using the actualrainfall and evaporation data recorded during the period September 1972 and August 1998.
The results of these calculations are presented in figure 5.2.2. The plots show the annualrainfall in the Oenpelli record for the period and the accumulated water volume calculated bythe model at the end of each month during the period.
The data presented in figure 5.2.2 show that the largest volume of accumulated watercalculated by the model for the period is 594,000 m3. A storage capacity of about 600,000 m3
would, therefore, have been required to avoid exceedence at any time during the 26-yearperiod using the actual recorded rainfall. Note that this volume is much lower than would berequired for, say, a 1:10,000 exceedence probability if one used the rainfall records for thisperiod as the basis for a Monte Carlo simulation of the type described in section 5.2.3.
The largest accumulated volume of water occurred in the fifth year of this simulationfollowing a steady build-up during the previous four years. After this peak volume is reached,the maximum volume required decreases in subsequent years until, following the simulatedtenth year of operation, the maximum capacity required in all years is less than half themaximum value. Indeed, on a number of occasions, the volume of stored water reduces to

53
zero, implying that water would need to be imported from the bore field to enablecontinuation of the milling process.
Examination of the annual rainfall record presented in figure 5.2.2 shows that thischaracteristic, which is typical of all simulations, is not attributable to an unusually highsequence of wet years in the early part of the rainfall record. Rather, the observed pattern isdue to the gradual increase in assumed losses due to evaporation in the ventilation system(and, to a much less significant extent, losses due to ore wet-down and plant wash-down)which only reach their maximum value in year 10 of operation. The water losses assumed inthe calculations, taken from the PER Appendix B1 are given in table 5.2.4.
Figure 5.2.2 Annual rainfall (September – August) and accumulated water volumes for a modelsimulation using actual rainfall and evaporation from September 1972 to August 1998
Evaporation in the ventilation system was examined in section 3.4. It was shown there that,unless an expensive humidifier system is installed, the maximum loss by evaporation in theventilation system would be about 40% of the value proposed in the EIS and the PER. It wassuggested that this deficiency could be overcome by increasing the area of the retention pond
0
100000
200000
300000
400000
500000
600000
0
400
800
1200
1600
2000
1 2 3 4 5 6 7 8 9 10 11 12 13 14 15 16 17 18 19 20 21 22 23 24 25 26
Year of simulation
Ann
ual r
ainf
all (
mm
)S
imul
ated
sto
rage
at t
he e
nd o
f th
e m
onth
(m
3 )

54
by about 4 ha, thus increasing its evaporative capacity. If this suggestion were to beimplemented, then the full additional evaporative capacity of 90,000 m3 would be availableas soon as water covers the base of the retention pond. By year 5 of operation, the differencein accumulated water losses from the water management system between this scenario andthat outlined in table 5.2.4 is about 300,000 m3. Hence, the maximum storage capacityrequired in the simulation illustrated in figure 5.2.2 would be reduced by about 50%.Similarly, it is likely that if the full simulation of the water management system wererepeated using pond evaporation rather than evaporation in the ventilation system, thecapacity required to achieve an exceedence probability of 0.01% over the life of the mine(see section 5.2.3) would be reduced by about 30%.
This 30 % reduction in the required water storage capacity of the Jabiluka retention pond faroutweighs the increase of about 10% that arises from consideration of refinements in thehydrological modelling that were addressed in the previous section. It is recommended thatERA, in its detailed design of the Jabiluka water management system, uses increased pondevaporation rather then enhanced evaporation in the ventilation system to minimise thevolume of the water retention pond. In making this recommendation, it is recognised thatsome enhanced evaporation in the ventilation system as a result of dust suppressionprocedures is inevitable. This will need to be modelled carefully by ERA to achieve theoptimum water management system.
One advantage of the original ERA proposal to use enhanced evaporation in the ventilationsystem was that its use would be under control and, for example, in drier years or sequencesof years, pond water levels could be controlled by switching off the enhanced evaporationsystem and minimising the need to import water from the bore field. If only pond evaporationis used, this level of control is lost. One way of retrieving control would be to partition thewater retention pond into three or four compartments with connecting spill ways and a waterpumping system. In this way evaporative losses in dry spells could be minimised by pumpingall remaining water into one of the compartments and could be maximised in wetter periodsby using the full evaporative capacity of all of the compartments. It is recommended thatERA consider this approach in the detailed design of the water management system atJabiluka.
Table 5.2.4 Water losses assumed in the hydrological model of the Jabiluka water managementsystem (annual volumes in m3). Data from JMA Public Environment Report, Appendix B1.
Year1
Year2
Year3
Year4
Year5
Year6
Year7
Year8
Year9
Year10
Year11−30
Evaporation Variable (see section 3.3) but approximately 170,000
Mill requirement 0 180000
Ore wet-down and plantwash-down
800 1200 3500 7000 10000
Mine ventilation anddust suppression
0 15000 30000 45000 60000 75000 90000
5.2.6 Effect of climate change on the required water storage capacityIn section 4.4.2, the principal conclusions on the effect of possible climate change over thenext 30 years were that:
• The projected temperature increase in the region of Jabiluka is expected to be in therange 0.35–0.8ºC.

55
• The predictions for change in the Wet season rainfall in the region range from +1% to - 6%.
• The intensity of extreme storm events is likely to increase despite the fact that there islikely to be an overall decrease in the annual rainfall.
It was also found that decadal scale variability was significant and that there exists in thehistorical record a small long-term upwards trend in the mean annual rainfall but it wasconcluded that both of these effects are included in the stochastic rainfall model used toassess the required water storage capacity at Jabiluka and need not be considered further.
The minimum predicted temperature increase is the extreme scenario for water balancemodelling since this would minimise evaporation and hence maximise the required storagevolume. The minimum predicted increase of 0.35ºC over the next 30 years is insufficient tohave any significant impact on evaporation. There is no need, therefore, to adjust thehydrological model to take the effect of temperature change into account.
The maximum predicted change in annual rainfall from global warming over the next30 years is 1%. There is, therefore no need to repeat the simulation of the water managementsystem presented in section 5.2.3 to take this effect into account. The effect of climate changewill be negligible.
The climate change model DARLAM predicts (Jones et al 1999) that storm intensity willincrease over the next 30 years. DARLAM simulates little change in annual rainfall overJabiluka by the year 2030, but extreme rainfall becomes about 10% stronger and the present1-in-10 year event becomes a 1-in-7 year event. Even in the main months of the Wet season(December until February) when average rainfall is predicted to decrease by about 3%,extreme rainfall is predicted to increase by about 5%. The largest changes are predicted tooccur at the junction of the Wet and the Dry seasons (March until May) when it becomesabout 30% wetter on average, extreme rainfall intensities rise by up to 24% and extremeevents double in frequency. It should be noted, however, that of the six models used to assessclimate change (see table 4.3.3), DARLAM is the model that predicts the highest positivechanges in mean rainfall in both the Wet and Dry seasons.
The effect of the predicted change in storm intensity can be assessed by examining the resultsobtained in section 5.2.4 in which the results of a sensitivity analysis were presented. Thedifference in required storage volume between the use of a daily time step in the model andthat obtained from the use of a monthly time step was 1.4%. This result was obtained for thesame total rainfall in each month. The predicted increases in storm intensity arising fromglobal warming would have the effect of increasing the rainfall on a daily basis butdecreasing the overall monthly figure. The results of the sensitivity analysis, therefore,indicate that the increase in storm intensity predicted by the global warming model would nothave any significant impact on the required storage capacity of the water management systemat Jabiluka.
5.3 Risk assessment for the ERA proposal
In principle, the information derived in the previous section on the probability of exceedingthe capacity of any specified water retention pond at Jabiluka could be combined withresearch results on the environmental impact of the constituents of mine waters to determinethe pond capacity required to meet specified environmental protection objectives. Theseobjectives would include ensuring that the radiation exposure of people who consume foodscollected from downstream waterbodies would be below the recommended internationallimits on radiation dose. They would also include specifications on the upper limits for
56
concentrations of a range of important constituents of the effluent to ensure a very high levelof ecosystem protection.
Implicit in this approach, however, is the assumption that significant quantities of watercould regularly be discharged from the mine site provided that the appropriate standards aremet. While this might be sound on a scientific level, the Aboriginal people of the region havebeen consistent in their opposition to the discharge of mine waters and, because of thesedeeply felt concerns, ERA has adopted a policy of not releasing any water from those parts ofthe mine site containing the mill, ore stockpiles and any material with a concentration ofuranium of greater than 0.02%. Only inert waste rock would be outside this TotalContainment Zone. Thus the size of the pond has been determined on social grounds ratherthan scientific grounds.
The issue that will be addressed in this section is the quantification of the risk to people anddownstream ecosystems arising from any particular choice of storage capacity. In particular,we will assess the risks associated with the particular storage pond proposed by ERA in thePublic Environment Report. This will be followed by an assessment of the risk associatedwith dam failure.
5.3.1 Water quality of runoff from the ore stockpilePrior to estimating the risks associated with discharges of water from the ore stockpile to theenvironment beyond the mine site, it is necessary to estimate the concentrations of theprincipal constituents in runoff water.
In Appendix B1 of the PER, ERA reviewed the information available on runoff water quality.It identified the principal constituents as uranium and its radioactive progeny, and magnesiumsulphate. The information obtained from kinetic testing of a number of samples of theJabiluka ore showed that, while a number of metals and metalloids were present in the ore atconcentrations greater than average in the earth’s crust, none other than uranium was at aconcentration that, under the general chemical environment of the ore stockpile, will presenta threat to ecosystems or people beyond the mine site. The Supervising Scientist agrees withthis assessment.
ERA, based upon a review of water quality in the ore stockpile sump at Ranger, estimatedthat concentrations of uranium in runoff water are likely to be in the range 5000 –10,000 µg/L. Based upon the concentrations of uranium in the sump in recent years, thisestimate appears to be valid. However, in earlier years of the Ranger operation,concentrations as high as 50,000 µg/L were observed. In addition, it is necessary to take intoaccount the higher concentration of uranium in the ore at Jabiluka (0.46%) compared to thatat Ranger (0.3%). On this basis, a value of 80,000 µg/L has been adopted as a worst casescenario for this risk assessment. This converts to 1000 Bq/L in radioactivity units.
ERA estimated the concentration of 226Ra at 100 mBq/L based upon relatively infrequentmeasurements of radium concentrations in the stockpile sump at Ranger. While this may wellbe a reasonable estimate, a more conservative approach has been adopted in this review. Theconcentrations of all of the other long-lived radionuclides of the uranium series in runofffrom the Jabiluka ore stockpile have been estimated using the observed ratios of theconcentrations of these radionuclides (Martin et al 1998) to concentrations of uranium inRetention Pond No 2, which collects water from the ore stockpiles and water transferred fromthe mine pit at Ranger.

57
Table 5.3.1 Estimates of the maximum concentrations of the prinipal constituents in runoff from the orestockpile at Jabiluka
Chemicals Concentrationmg/L
Radionuclides ConcentrationBq/L
Uranium 80 238U 1000
Magnesium 500 234U 1070
Sulphate 2,000 230Th 3
226Ra 340
210Pb 20
210Po 3
ERA estimated that the electrical conductivity, dominated by magnesium and sulphate ions,would be in the range 3000–5000 µS/cm. The upper limit of this range corresponds toconcentrations of magnesium and sulphate of 500 mg/L and 2000mg/L respectively. TheSupervising Scientist has recently carried out solute modelling for the waste rock dumps atRanger (leGras & Klessa 1997). This work showed that MgSO4 mobilisation occurs at a ratesimilar to the rate of erosive degradation of the schist. That is, there is an initiation periodafter rock placement of about 3 years during which little solute is released. According to theproposed Jabiluka mine plan, ore and waste rock will be stored for an insufficient period forsignificant solute evolution. The Supervising Scientist, therefore, believes that theconcentrations of Mg and SO4 that will occur in runoff from the ore stockpile at Jabiluka willbe significantly lower than the estimates provide by ERA. Neverthless, to ensure that aconservative estimate is obtained in the risk assessment, the concentrations of MgSO4 havebeen taken to be the highest values estimated by ERA.
A summary of the concentrations of the principal constituents in runoff from the Jabiluka orestockpile used in the risk assessment are provided in table 5.3.1. It is stressed that all of theseconcentrations are considered to be maximum expected values and some are likely to besignificant over-estimates.
5.3.2 Radiation exposure of members of the publicThe probability of exposing members of the public to a particular radiation dose can bederived from the probability with which a specified volume of water will, under extremeclimatic conditions, need to be discharged to Swift Creek downstream from the mine and thecalculation of the radiation dose that will result from that discharge.
As stated in section 5.2.3, the storage capacity of the retention pond proposed by ERA in thePER was 810,000 m3. From the results of the Monte Carlo simulation methods shown infigure 5.2.1, the probability of the occurrence of water volumes in excess of the pondcapacity can be derived. These results are shown in figure 5.3.1.
Estimates of radiation exposure of members of the public resulting from discharges ofradionuclides in water from the Ranger mine have been made by the Supervising Scientist(Johnston 1990) based upon a model of dispersion of radionuclides in the Magela Creeksystem, the diet of the critical group, and results of research on the uptake of uranium seriesradionuclides in food items from the waters and sediments of the Magela system (Johnston etal 1997). The model has recently been updated by Martin et al (1998) to take into account allrecent research results and the most recent recommendations of the International Commissionon Radiological Protection on dose conversion factors (ICRP 1996).

58
Figure 5.3.1 Probability of occurrence of excess water volumes in the Jabiluka Total ContainmentZone over the life of the mine for the storage capacity specified by ERA
A model for assessing the radiation dose resulting from discharges of radionuclides fromJabiluka will be different from the Ranger model, principally in the radionuclide dispersionpart of the model. However, the difference will be relatively small and the Ranger model hasbeen applied here.
The dose estimates arising from the excess volumes predicted by the Monte Carlo analysis ofthe Jabiluka water management proposed by ERA lie in the range 0 to 27 µSv. Theseestimates take into account that runoff from the ore stockpile only contributes 1% of the totalwater flowing from the TCZ to the retention pond. The probability of occurrence of thesedoses over the 30 year life of the mine are presented in figure 5.3.2.
Figure 5.3.2 Probability versus radiation exposure of members of the public resultingfrom the discharge of excess water from the Jabiluka mine site for the water
management system proposed by ERA
Excess Volume (m3)
0 50x103 100x103 150x103 200x103
Pro
babi
lity
10-5
10-4
10-3
10-2
Radiation Dose (µSv)
0 5 10 15 20 25 30
Pro
babi
lity
10-5
10-4
10-3

59
Thus the probability that any member of the public would receive a radiation dose of 20 µSvon one occasion during the 30 year life of the mine would be less than 1 in 10,000. Theannual dose limit recommended by the ICRP for members of the public is 1000 µSv perannum. The conclusion of this analysis is, therefore, that the water management systemproposed by ERA for Jabiluka is one that poses an insignificant radiological risk to peopleliving in the vicinity of the mine and consuming traditional foods obtained from thewaterbodies downstream from the mine.
5.3.3 Impact on aquatic ecosystemsThe discharge of excess waters from the Jabiluka mine site could, in principle, give rise toimpact on aquatic ecosystems through both radiological and chemical exposure.
Radiological exposure
The Supervising Scientist conducted an assessment (Johnston 1989) of the probableradiological impact on aquatic animals of the Magela Creek and Magela floodplain resultingfrom the discharge of water from Retention Pond No 2 at Ranger into the Magela Creek. Foracute exposure, it was found that the expected dose for fish and macroinvertebrates would beabout three per cent of the lowest dose at which any effect had been reported in the literatureusing sensitive endpoints such as reproductive capability, embryo survival, growth rate etc.For all other animals, acute doses would have been lower by another order of magnitude.
For chronic exposure, the results for fish showed that the maximum expected dose rate wasless than one per cent of the lowest observed effect dose rate but for invertebrates it wasabout twenty per cent. However, the lowest observed effect rate for invertebrates had beendeduced from an experiment where other contaminants were present in the water and itshould therefore be treated with caution. The next lowest value for invertebrates in theliterature was higher by a factor of about 40.
The total discharged loads of each of the radionuclides of the uranium series considered byJohnston (1989) were higher by a factor of about 10 than the loads that would be dischargedfrom the Jabiluka site at the 1 in 50,000 probability level shown in figure 5.2.1. Theconclusion of this analysis is, therefore, that the water management system proposed by ERAfor Jabiluka is one that poses an insignificant radiological risk to aquatic animals which livein waterbodies downstream from the Jabiluka mine.
Chemical exposure
A risk analysis for chemical exposure of aquatic animals is more complex than for radiationexposure of people because the principal risk is that concentrations (rather than annual loads)of chemicals reach a threshold value at which aquatic organisms are harmed. The increase inthe concentration of a chemical in Swift Creek downstream from the mine will depend uponthe dilution available for waters leaving the mine site arising from existing flow in the Creek.
In general, since the catchment of Swift Creek is quite small, about 40 km2, a significantrainfall event that affects the mine site will also affect most of the catchment. In this case, thedilution available for waters flowing from the mine site will be determined by the ratio of themine site area to that of the whole catchment of Swift Creek, taking into account therespective runoff coefficients. Thus the dilution in Swift Creek will be given by:
sscc rArAD /=
where Ac and rc are the area and the runoff coefficient for the whole Swift Creek catchmentand As and rs are the corresponding figures for the ore stockpile. To be conservative, the

60
runoff coefficients for the stockpile and the whole catchment have been assumed to be 1.0and 0.4 respectively although towards the end of a Wet season with an exceedenceprobability of greater than 1:1,000 the runoff coefficient for the whole catchment would alsoprobably be approaching 1.0. The areas of the catchments have been taken as 40 km2 forSwift Creek and 2500 m2 for the ore stockpile as specified in the PER. These figures yield adilution factor of about 6400.
As indicated in section 5.3.1, the principal constituents of runoff that need to be consideredare magnesium, sulphate and uranium.
A number of studies of the toxicity of uranium to local native species of Kakadu NationalPark have been carried out by the Supervising Scientist and by ERA. These measurementswere conducted following an extensive program of research by the Supervising Scientist inwhich 19 different local native species of aquatic animals and plants were investigated(Holdway et al 1988a) to establish their suitability for incorporation in an ecotoxicologicaltesting program. The species eventually adopted in the program were chosen on the basis oftheir suitability with respect to rearing and captive husbandry and also with respect to thesensitivity of their response to exposure to waters in the retention ponds at the Ranger mine.
Results for the toxicity of uranium to aquatic animals of the region are given in Holdway et al(1988b), Bywater et al (1991) and Holdway (1992). The lowest concentration of uranium atwhich any adverse effect was observed (the LOEC) was 190 µg/L and the highestconcentration at which no effect was observed (the NOEC) was 160 µg/L. These results wereobtained for the Cnidarian Hydra viridissima using population growth over six days as thetest endpoint. Other work by the Supervising Scientist (Lewis 1992) indicated that thesensitivity of freshwater snails to waters in the retention ponds at Ranger, in which uraniumis the most significant constituent, is comparable with that of Hydra.
The regular application of ecotoxicological data is in determining the dilution required torender ‘safe’ the discharge of an effluent into a stream. In such cases, the approach usuallyadopted is to apply a ‘safety factor’ to the geometric mean of the lowest NOEC and thecorresponding LOEC to take into account within-species variability, between-speciesvariability and statistical effects (ie Type I vs Type II errors). This approach has been adoptedby, and continues to be recommended by, the Supervising Scientist in the application of BestPracticable Technology to the management of water at the Ranger mine (Johnston 1991). Thereason for the approach is that, in recommending a safe dilution for an actual release ofeffluent, the species used in the laboratory are being considered as surrogates for the wholeecosystem and caution needs to be applied to ensure that other aquatic animals will beprotected.
The same approach is recommended for risk assessments (van Leeuwen & Hermens 1995,USEPA 1998) to determine the concentration below which no effects on aquatic ecosystemswill be expected. Using the data given above for hydra, the safe concentration for uranium is18 µg/L. In the current assessment, this concentration will be used to indicate theconcentration below which no effects are expected. In addition, the lowest observed LOEC intests carried out on local native species, 190 µg/L, will be used to indicate the concentrationabove which adverse effects would be expected to occur. For concentrations intermediatebetween the ‘safe concentration’ and the ‘effects concentration’, it is considered that adverseeffects may occur in some species, particularly invertebrates.
In this context, it should also be noted that the estimate used for the concentration of uraniumin runoff from the ore stockpile (see section 5.3.1) is considered to be a worst case scenarioand is about a factor of 10 higher than the estimate made by ERA in the PER based upon

61
experience at Ranger over the past number of years. We have taken the approach of adoptinga conservative value for the concentration of uranium (which is applied to the risk assessmentfor both radiation exposure of members of the public and for ecosystems) and then being asrealistic as possible in assessing the probable effects on people and aquatic animals. Thus,both ‘safe’ and ‘effects’ concentrations are considered in the assessment.
Sulphate is a common anion of natural surface waters and is not regarded as a toxiccompound. To increase the concentration of sulphate it is necessary to increase theconcentration of some cation and it is the toxicity of the cation that needs to be assessedrather than that of sulphate. For these reasons, the Supervising Scientist recommended to theNorthern Territory that the receiving water standard for sulphate be set on human healthgrounds; 200 mg/L was the recommended limit. This is considered to be the ‘safe’concentration. No ‘effects’ concentration has been considered for sulphate since uranium isthe dominant toxicant.
Magnesium is not normally considered to be a toxic substance and few studies of its toxicityhave been carried out. No recommendation was given for a water quality guideline in theAustralian Water Quality Guidelines for Fresh and Marine Waters (ANZECC 1992). In hisrecommendations to the Northern Territory, the Supervising Scientist noted the limited dataon the toxicity of magnesium and recommended a limit of 20 mg/L, a figure that was morethan 100 times lower than the reported LC50 value for Daphnia hyalina (Baudouin & Scoppa1974). Of more significance to aquatic animals would be a change in the ratio of magnesiumto calcium in the water but this would only be of relevance if the change were prolongedrather than the transient scenario being considered here. The ‘safe concentration’ is taken as20 mg/L and, as for sulphate, no ‘effects concentration’ is considered.
Table 5.3.2 Estimates of concentrations of U, Mg and SO4 in runoff from the ore stockpile at Jabilukaand the resulting concentrations in Swift Creek under ‘normal’ and ‘extreme’ dilution conditions. Alsogiven for comparison are the ‘safe’ and ‘effects’ concentrations.
StockpileRunoffmg/L
Swift Creek(Normal)
mg/L
Swift Creek(Extreme)
mg/L
‘Safe’Concentration
mg/L
‘Effects’Concentration
mg/L
Uranium 80 0.012 0.11 .018 0.19
Magnesium 500 0.08 0.70 20 na1
Sulphate 2,000 0.30 2.8 200 na1
1 Not applicable
A summary of the above data is presented in table 5.3.2 where the estimated concentrationsof uranium, magnesium and sulphate in Swift Creek resulting from discharge of excess waterfrom the ore stockpile are compared to the concentration limits at which it is estimatedadverse effects will be observed. It can be seen that, under the dilution scenario envisaged(Swift Creek Normal in the table), no effect on the aquatic animals living in Swift Creekwould be expected to occur even when the volume of excess water discharged is that with anexceedence probability of 1 in 50,000 over the life of the mine.
The above dilution scenario would not apply if the rainfall event is very intense and of shortduration. In these circumstances, because of the finite size of the catchment there will be adelay between the rainfall event over the whole catchment and the peak of the streamhydrograph at the catchment outlet point. This implies that the full dilution expected undernormal circumstances would not be available because the water from the mine site, which isrelatively close to the creek, would not be delayed significantly.

62
A second dilution scenario has, therefore, been examined in which it is assumed that anextreme rainfall event (with a return period in excess of 1 in 100) occurs at the end of whatwould already be an extreme rainfall year (1 in 1000). It is also assumed that the event iscentred on the TCZ and that the intensity of the storm reduces in magnitude as a function ofdistance from the TCZ.
The data on such a storm have been derived from the exceptionally severe storm thatoccurred at Jabiru on 4 February 1980. The storm had a duration of 16 hours with a totalrainfall registration of 303 mm at Jabiru East but within the storm there was a remarkablyhigh rainfall burst with a duration of 5 hours and a recorded rainfall of 240 mm. At the timeof this event, there were 10 continuously recording streamflow stations operating in theMagela Creek catchment and 21 continuously recording rainfall stations. The amount of dataavailable from this recording network enabled an unusually detailed analysis of the storm tobe undertaken by the Water Division of the Northern Territory Department of Transport andWorks (Water Division 1982). This analysis used a flood-routing model to extend andreconcile the rainfall pattern with the resultant flood down the Magela Creek and itstributaries.
Figure 5.3.3 The hydrograph for Gulungul Creek and the recorded rainfall at Jabiru Eastnear Ranger for the severe storm of 4 February 1980
One of the tributaries of the Magela Creek that was used in the analysis was Gulungul Creekwhich drains part of the Ranger mine site. The catchment of Gulungul Creek is 46 km2 whichis very close to the catchment size of Swift Creek. The flood hydrograph for Gulungul Creekin response to the storm should, therefore, be a very good analogue for the response of SwiftCreek to an unusually intense short storm. The rainfall data and the Gulungul Creekhydrograph are shown in figure 5.3.3. The flow observed in the creek during the 5 hourperiod when the storm was most intense was only 14% of the total flow over the completehydrograph. This analysis indicates, therefore, that if water draining the TCZ at Jabilukareaches Swift Creek without significant delay, the dilution would be reduced to about 900:1.
Cre
ek F
low
(m
3 /s)
100
200
300
400
Time (hours)
0 5 10 15 20 25 30 35 40
Rai
nfal
l (m
m)
20
40
60

63
The Institution of Engineers Australia makes recommendations (Pilgrim 1987) for the valuesof depth-area ratios to be applied in estimating the effect of the worst case assumption thatthe storm is centred on the TCZ and that the intensity of the storm reduces in magnitude as afunction of distance from the TCZ. For a 40 km2 catchment the ratio for a five hour event isabout 0.97. However, the Water Division of the NT Department of Transport and Works(Water Division 1982) also derived depth-area curves for the storm of 4 February 1980. Thedepth-area data and the best fit to these data for the 5 hour period of greatest rainfall intensityare shown in figure 5.3.4. From these data, the rainfall over the whole catchment of SwiftCreek could be less than that on the TCZ by up to 20%. Using this more conservative figure,the dilution available in Swift Creek could be as low as 720.
Figure 5.3.4 Rainfall depth versus catchment area from the centre of the storm for the mostintense 5 hour period of the storm at Jabiru on 4 February 1980
The constituent concentrations that would occur in Swift Creek under this extreme dilutionmodel are also presented in table 5.3.2. The Mg and SO4 concentrations are still well belowthe concentration at which any biological impact could be expected to occur and thecalculated increases are comparable with the naturally occurring concentrations of thesechemicals in Swift Creek, about 0.4 and 0.3 mg/L for Mg and SO4 respectively. The uraniumconcentration is intermediate between the safe and the effects concentrations for uranium.Hence, under this scenario adverse effects may occur in some species, particularlyinvertebrates, but effects on fish would not be expected. It is worth noting that theconcentration in Swift Creek would only remain at the indicated value for a matter of hours.This period should be compared with the 6 day period of the toxicological test. In addition,the uranium concentration adopted for runoff from the ore stockpile is considered to be aworst case estimate and is higher than that estimated by ERA by a factor of about 10.
The conclusion of this analysis is that, under normal circumstances, no effect on aquaticanimals living in Swift Creek downstream from the Jabiluka mine would be expected tooccur even when the volume of excess water discharged is that with an exceedenceprobability of 1 in 50,000 over the life of the mine. If the discharge results from an extremerainfall event with an exceedence probability much greater than 1 in 100 at the end of a wetseason in which the rainfall has an exceedence probability of greater than 1 in 1000, someadverse effects may occur in invertebrates, but adverse effects on fish would not be expected.Any adverse effects on invertebrates would be very short-lived.
Catchment Area (km2)
10 100 1000
Rai
nfal
l dep
th (
mm
)
100
150
200
250
300
350
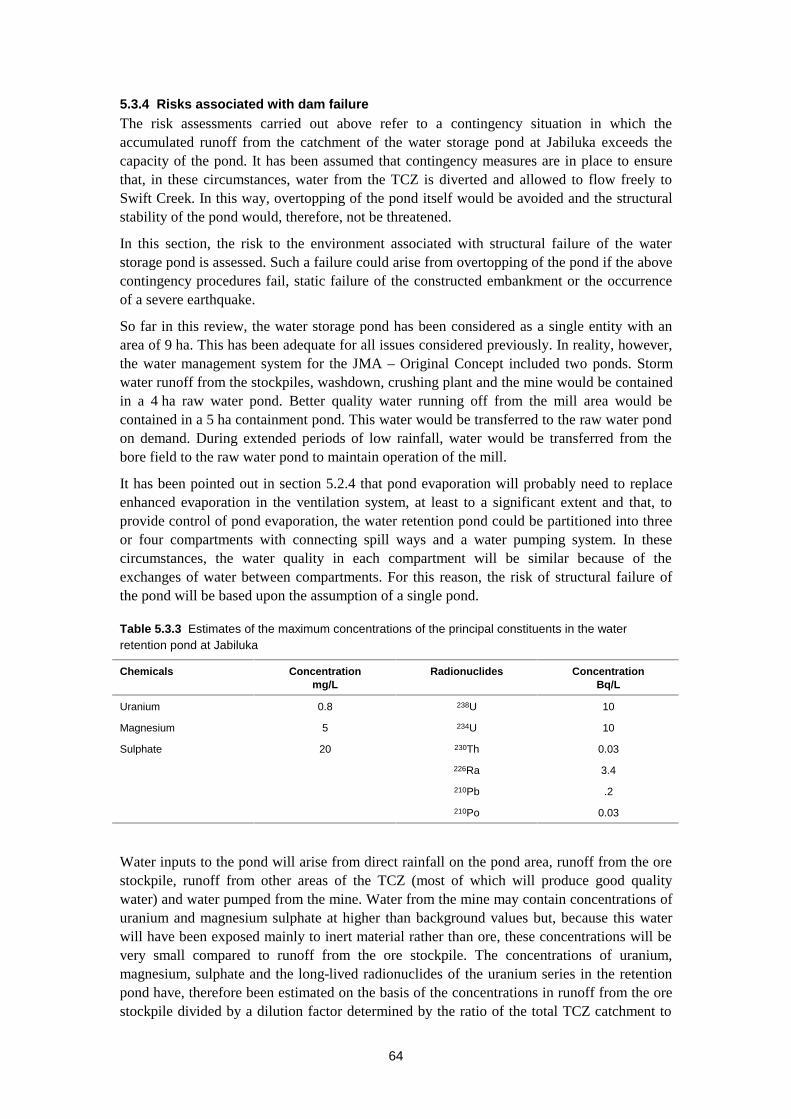
64
5.3.4 Risks associated with dam failureThe risk assessments carried out above refer to a contingency situation in which theaccumulated runoff from the catchment of the water storage pond at Jabiluka exceeds thecapacity of the pond. It has been assumed that contingency measures are in place to ensurethat, in these circumstances, water from the TCZ is diverted and allowed to flow freely toSwift Creek. In this way, overtopping of the pond itself would be avoided and the structuralstability of the pond would, therefore, not be threatened.
In this section, the risk to the environment associated with structural failure of the waterstorage pond is assessed. Such a failure could arise from overtopping of the pond if the abovecontingency procedures fail, static failure of the constructed embankment or the occurrenceof a severe earthquake.
So far in this review, the water storage pond has been considered as a single entity with anarea of 9 ha. This has been adequate for all issues considered previously. In reality, however,the water management system for the JMA – Original Concept included two ponds. Stormwater runoff from the stockpiles, washdown, crushing plant and the mine would be containedin a 4 ha raw water pond. Better quality water running off from the mill area would becontained in a 5 ha containment pond. This water would be transferred to the raw water pondon demand. During extended periods of low rainfall, water would be transferred from thebore field to the raw water pond to maintain operation of the mill.
It has been pointed out in section 5.2.4 that pond evaporation will probably need to replaceenhanced evaporation in the ventilation system, at least to a significant extent and that, toprovide control of pond evaporation, the water retention pond could be partitioned into threeor four compartments with connecting spill ways and a water pumping system. In thesecircumstances, the water quality in each compartment will be similar because of theexchanges of water between compartments. For this reason, the risk of structural failure ofthe pond will be based upon the assumption of a single pond.
Table 5.3.3 Estimates of the maximum concentrations of the principal constituents in the waterretention pond at Jabiluka
Chemicals Concentrationmg/L
Radionuclides ConcentrationBq/L
Uranium 0.8 238U 10
Magnesium 5 234U 10
Sulphate 20 230Th 0.03
226Ra 3.4
210Pb .2
210Po 0.03
Water inputs to the pond will arise from direct rainfall on the pond area, runoff from the orestockpile, runoff from other areas of the TCZ (most of which will produce good qualitywater) and water pumped from the mine. Water from the mine may contain concentrations ofuranium and magnesium sulphate at higher than background values but, because this waterwill have been exposed mainly to inert material rather than ore, these concentrations will bevery small compared to runoff from the ore stockpile. The concentrations of uranium,magnesium, sulphate and the long-lived radionuclides of the uranium series in the retentionpond have, therefore been estimated on the basis of the concentrations in runoff from the orestockpile divided by a dilution factor determined by the ratio of the total TCZ catchment to

65
that of the stockpile. This is considered conservative because it ignores the substantial inputof relatively good quality water from the mine. The resulting estimates of the concentrationsof the various constituents in the water retention pond are given in table 5.3.3.
Overtopping of the pond
The probability of the pond overtopping in the absence of contingency measures can bederived from figure 5.2.1 using a volume equal to the total volume of the pond including thefreeboard volume. For a total depth of 9.5 m (PER p 4–52) the pond volume would be855,000 m3. From figure 5.2.1, the exceedence probability for this volume over the life of themine is about 0.0005 or 5 in 10,000.
The radiological impact on people living downstream from the mine, and consumingtraditional foods collected from downstream waterbodies, has been estimated following theprocedures outlined in section 5.3.2. It was assumed that overtopping of the dam would, inthe absence of an engineered spillway, lead to structural failure of the pond embankment andall of the water in the pond, 855,000 m3, would be discharged to Swift Creek. Theconcentrations of radionuclides given in table 5.3.3 were multiplied by this water volume toobtain the loads of each nuclide and the dose conversion factors for the Ranger radiologicalassessment model from Martin et al (1998) were used to estimate the radiation dose for eachradionuclide. These doses were added to obtain the overall dose estimate of 150 µSv. Thus,even for this catastrophic event, the expected dose received by members of the public wouldnot be greater than 15% of the annual limit recommended by the International Commissionon Radiological Protection.
The ecological impact in Swift Creek resulting from overtopping of the pond will dependconsiderably on the flow conditions in the creek at the time of dam failure and the time takento drain the dam. Since such an event could only occur towards the end of a very exceptionalWet season, it would be expected that creek flow would be relatively high. However,assuming that the flow in the creek would be equal to the average Wet season flow (about3.5 m3/s, and that the time taken to drain the dam is 12 hours, the total volume of creek waterin which the dam water would be diluted would be about 150,000 m3 which is smallcompared to the volume of water in the pond. Hence, the concentrations of uranium,magnesium and sulphate in the creek during this time would be those given in table 5.3.3.
Both the Mg and SO4 concentrations would, therefore, be lower than the concentration limitsgiven in table 5.3.2 and, while greater than natural concentrations, would not be expected tocause significant impact on ecosystems. The uranium concentration in table 5.3.3 is higherthan the Lowest Observed Effect Concentration for hydra viridissima given in table 5.3.2 andeffects on some aquatic animals could, therefore be expected in Swift Creek. However, fromthe results of Bywater at al (1991) and Holdway (1992) effects on fish would not beexpected.
In terms of broader ecological impact on the wetlands of Kakadu National Park, the waterfrom the pond would be diluted in floodplain waters until concentrations of uranium becomelower than 190 µg/L. During the Wet season, the depth of water on the floodplain is about2 metres. Hence the maximum affected area of the floodplain for a discharge of 855,000 m3
would be 1.8 km2. Thus, in the case of overtopping the retention pond, there is a risk of about5 in 10,000 that an area that is about 1% of the Magela floodplain would experience someadverse effects on aquatic animals. Fish and many other species would not be affected.Between about 2 km2 and 20 km2, adverse effects may persist but beyond 20 km2 no effectsshould be observed. In addition, any effects will be transitory and the system would fullyrecover following flushing by the natural waters of the Magela Creek.

66
It should be noted that if a properly engineered spillway were installed in the wall of theretention pond, the dam would be protected from destruction under overtopping. This wouldresult in the loss of much lower volumes of water over a longer period and would fullyprotect both Swift Creek and the Magela floodplain under the conditions considered here. Itis recommended that such a spill-way be incorporated in the design of the retention pond.
Static failure of the retention pond structure
Static failure of the water retention pond could, in principle, occur as a result of piping (theerosive action of water passing through or under the dam wall) or slope failure (thedownward and outward movement of a mass of soil beneath the dam wall) as a result ofexcessive pressures being applied.
Failure as a result of piping is not considered to be an issue with the specific design adoptedby ERA because there is a double impermeable liner on the floor of the dam and on the innerwalls. In addition, a seepage detection system has been included in the design so that, werethe liner to be damaged, seepage would be detected at an early stage and repair actionimplemented.
The retention pond structure has been designed with a factor of safety (FS) of 1.7 againstslope failure. This FS was calculated under circumstances in which the pond is at its fullcapacity with the liner intact. Hence, the probability of slope failure should be less than theprobability of overtopping which was estimated above to be about 0.0005 or 5 in 10,000.Since slope failure would only arise under circumstances similar to those considered forovertopping, the estimates of environmental impact derived above for overtopping would alsoapply to slope failure.
Table 5.3.4 Variation return period with peak ground acceleration arising from an earthquake for a sitenear Darwin
Return Period(Years)
Peak Ground Accelerationmm/s2
1 98
10 218
100 484
500 842
1000 1068
2000 1349
3000 1544
5000 1834
Failure due the occurrence of a severe earthquake
The factor of safety of 1.7 for the designed retention pond structure was derived byconsidering not only conditions that would lead to static failure but also ground level motionswith an acceleration of 0.08 g arising from an earthquake, where g is the acceleration due togravity. (The acceleration 0.08 g is that specified in the relevant Australian standard fornormal structures.) The engineering consultant responsible for the design of the retentionpond, Golder Associates, has advised the Supervising Scientist (private communication) thatthe acceleration corresponding to a safety factor of 1.0, at which dam failure couldcommence, is 0.39 g (3830 mm/s2).

67
The Australian Geological Survey Organisation has recently completed a hazard analysis fornormal structures (Kevin McCue, private communication) for a site near near Darwin and theresults are listed in table 5.3.4. This site is tectonically similar to that at Jabiluka and thestudy can be used to provide an indicative ground hazard analysis for the Jabiluka site.
In the above study, only local and regional earthquakes were considered in the hazardanalysis since the frequent but distant large earthquakes in the Banda Sea, Indonesia, are toofar away to cause damaging ground motions for normal structures. They should be consideredfor a water retention pond since they give rise to many cycles of ground motion. It isrecommended that ERA commissions such a study at the detailed design stage of the Jabilukaproject.
The ground level acceleration which could lead to failure of the retention pond structure(3830 mm/s2) is beyond the range of accelerations given in table 5.3.4 and the return periodfor this acceleration is considerably in excess of 5000 years. Extrapolation of the data in thetable will be subject to uncertainties associated with the limitations of the underlying data setand model dependence arising from the attenuation relation used in the study. Nevertheless,accepting that such uncertainties are present, we have extraploated the above data (which arelinear on a log-log plot) to obtain an estimated return period of 50,000 years for anearthquake that could cause failure of the retention pond structure. Thus, over the period ofthe mine life, the probability of structural failure would be approximately 0.0006 (0.06%).Rounding up, a probability of failure of 0.001 will be assumed in subsequent analysis.
Figure 5.3.5 Probability versus radiation exposure of members of the public resulting from thedischarge of water from the Jabiluka mine site as a result of an earthquake
An earthquake could clearly occur at any time of the year and during any year of the 30-yearmine life. Thus one needs to know the probability that the volume of water contained withinthe pond will be exceeded on the specific day of the earthquake rather than the probabilitythat this volume will be exceeded on any day during the 30 year life of the mine. Chiew andWang (1999) derived the daily exceedence probability by running the Monte Carlosimulation of the water management system for more than 350,000 days. The variation ofexceedence probability with volume was converted to exceedence probability as a function ofradiation exposure using the procedures outlined in section 5.3.2 and the concentration data
Dose (µSv)
0 20 40 60 80 100
Exc
eede
nce
Pro
babi
lity
10-9
10-8
10-7
10-6
10-5
10-4
10-3

68
in table 5.3.3 and by multiplying the exceedence probability values by the risk of occurrenceof an earthquake. The results are presented in figure 5.3.5.
From these data it can be seen that the risk of radiation exposure of members of the publicwould be extremely low. At the 1 in 10,000 level of probability, the estimated radiationexposure is about 30 µSv. The highest calculated exposure, which is less than one tenth ofthe internationally accepted limit, has an extremely small exceedence probability.
For an earthquake that occurs in the Wet season, the probable maximum area of the Magelafloodplain within which any ecological impact would be expected to occur can be calculatedas outlined above for the case of overtopping of the dam. The exceedence probability versusaffected area is shown in figure 5.3.6. Also shown is the area beyond which one can beconfident no effects will occur.
Figure 5.3.6 Probability versus the affected area of the Magela floodplain for a severe earthquake.Beyond the safe area, no adverse effects are expected. Adverse effects on invertebrates areexpected inside the effects area. Between the two areas, some residual effects may occur.
Hence the maximum area that should be affected is about 1.5 km2 but the probability of thisoccurring is extremely small. The area affected at the 1 in 10,000 level of probability is lessthan 0.5 km2 which is less than 0.3% of the floodplain area. At the same level of probability,residual effects may occur for some species of invertebrates out to an area of about 5 km2.Even within these areas the impact would be very small (for example, fish should not beaffected) and the system would fully recover following flushing by the natural waters of theMagela system.
If an earthquake occurred in the Dry season, the depth of water in the Magela floodplainwould be less than that assumed above and the area of impact would be greater. Nevertheless,the probability of an impact remains small and the system would recover during the followingWet season.
5.3.5 Contingency measuresERA has described in the EIS, the Supplement to the EIS and in the PER contingencyprocedures that would be adopted in the case of extreme events occurring that affect the
Affected Area of Floodplain (km2)
0 5 10 15
Exc
eede
nce
Pro
babi
lity
10-9
10-8
10-7
10-6
10-5
10-4
10-3Effects AreaSafe area
69
water management system at Jabiluka including, in a worst case scenario where no otheracceptable alternative exists, the pumping of water to the mine void. The analysis presentedin this chapter suggests that contingency planning should include the measures discussedbelow.
Rainfall runoff from the ore stockpile represents about 1.5% of the runoff from the remainderof the Total Containment Zone for the Jabiluka Mill Alternative. The water quality of runofffrom the stockpile will, however, be much poorer than that from the remainder of thecatchment. Hence, in the extreme scenario envisaged in sections 5.3.2 and 5.3.3 where thereis a 1 in 50,000 probability that about 200,000 m3 would be discharged from the TCZ toSwift Creek, the volume of poor quality water from the ore stockpile would only be 3000 m3.This volume could easily be accommodated in the freeboard volume of the water retentionpond without downgrading the freeboard capacity significantly. It is, therefore, recommendedthat runoff from the ore stockpile should be isolated from runoff from the remainder of theTCZ so that it is always directed to the pond while, under extreme conditions, runoff fromthe rest of the TCZ is diverted away from the storage pond. This measure would reduce stillfurther the risk associated with exceeding the capacity of the storage pond.
The assessment of the risks associated with overtopping of the water retention pond wasbased upon the assumption that overtopping would lead to structural failure of the pondembankment and that all of the water in the pond, 855,000 m3, would be discharged to SwiftCreek. If the pond were constructed with a properly designed spillway, this would ensurethat, even if diversion contingency measures fail, the pond structure would not fail when theovertopping height is reached. This would reduce substantially the impact arising in the eventof overtopping because only a small volume of water would be released to the environmentrather than the full volume of the pond. It would also, as a by-product, mean that theoperation of the mine could continue even following such an extreme event without the needto rebuild the dam.
5.6 Summary of findings on the storage of uranium on the surface
Modelling of the water management system at Jabiluka under current climatic conditions
• This review has included hydrological modelling of the water management system atJabiluka using a stochastic daily water balance model which incorporates therecommendations of this review on the appropriate rainfall record and evaporation, arealistic distribution of evaporative losses in the ventilation system throughout the year,and a simple soil water capacity model for runoff. The system modelled was the JabilukaMill Alternative – Original Concept but with tailings returned to the mine void ratherthan in tailings ponds at the surface.
• The model has enabled estimates to be made of the storage capacity required as afunction of exceedence probability over the 30-year mine life under current climaticconditions.
• The probability that the pond volume proposed by ERA in the PER (810,000 m3) wouldbe exceeded over the life of the mine is about 1 in 1000. The pond volume required toachieve an exceedence probability of 1 in 10,000 over the life of the mine would be about940,000 m3.

70
Review of the hydrological model adopted by ERA
• The Supervising Scientist has reviewed the hydrological model adopted by ERA in thedesign of the water management system at Jabiluka. This review has resulted in a numberof recommendations for improvement of the model.
• The effect on the volume of the water storage pond arising from the adoption of theserecommendations is as follows:
• The inclusion of interannual variability in evaporation and the inverse relationshipbetween rainfall and evaporation leads to an increase in the required pond volume ofabout 3%.
• The use of a simulated distribution of monthly rainfall rather than distributing annualrainfall to each month in fixed proportions determined from a typical distributionleads to an increase in the required capacity by about 1.7%.
• The use of a more realistic distribution of ventilation system losses between the Wetand Dry seasons rather than a constant value for each month leads to an increase inthe required capacity by about 1.2%.
• The use of pan factors recommended in this review rather than those used by ERA inthe PER results in an increase in the required volume of about 2.5%.
• The use of a daily water balance model rather than a monthly model leads to anincrease in required pond volume of about 1.4%.
• The use of conceptual rainfall-runoff model rather than fixed runoff coefficients leadsto a decrease in the required pond volume of about 0.4%.
• The combined effect of adopting the recommendations of this review on each of theabove topics rather than the model used by ERA is that the pond volume required toachieve a given exceedence probability will increase by about 10%.
Use of pond evaporation rather than enhanced evaporation in the ventilation system
• The use of pond evaporation rather than enhanced evaporation in the ventilation systemwould lead to a reduction in the required storage capacity of about 30% because the fullevaporative capacity would be available from the commencement of operations ratherthan achieving its maximum effect only after 10 years of operation.
• It is recommended that ERA, in its detailed design of the Jabiluka water managementsystem, uses increased pond evaporation rather than enhanced evaporation in theventilation system. In making this recommendation, it is recognised that some enhancedevaporation in the ventilation system as a result of dust suppression procedures isinevitable. This will need to be modelled carefully by ERA to achieve the optimum watermanagement system.
• Partitioning the water retention pond into three or four compartments with connectingspill ways and a water pumping system is one way in which control of evaporative lossescould be achieved. Evaporative losses in dry spells could be minimised by pumping allremaining water into one of the compartments and could be maximised in wetter periodsby using the full evaporative capacity of all of the compartments. It is recommended thatERA consider this approach in the detailed design of the water management system atJabiluka.

71
Effect of climate change on the required storage capacity
• The minimum predicted temperature increase is the extreme scenario for water balancemodelling since this would minimise evaporation and hence maximise the requiredstorage volume. The minimum predicted increase of 0.35ºC over the next 30 years isinsufficient to have any significant impact on evaporation. There is no need, therefore, toadjust the hydrological model to take the effect of temperature change into account.
• The maximum predicted change in annual rainfall from global warming over the next30 years is 1%. There is, therefore no need to repeat the simulation of the watermanagement system to take this effect into account. The effect of climate change will benegligible.
• The effect of the predicted increase in storm intensity due to global warming has beenassessed using the results of a sensitivity analysis. The results indicate that this increasein storm intensity would not have any significant impact on the required storage capacityof the water management system at Jabiluka.
Risk assessment of the ERA proposal
• A risk assessment has been carried out for the water management system proposed byERA for the Jabiluka mine. In this context, it is important to note that tailings will not bestored at the surface. The principle hazard that needs to be assessed is the possible impacton people and on downstream ecosystems arising from the unplanned discharge of waterthat has been in contact with uranium ore.
• In conducting the risk assessment, estimates have been made of the concentraions ofsolutes in runoff from the ore stockpile. All of these concentrations are considered to bemaximum expected values and some are likely to be significant over-estimates.
• The risk assessment included a contingency situation in which the accumulated runofffrom the catchment of the water storage pond at Jabiluka exceeds the capacity of thepond and the excess water from the Total Containment Zone is diverted and allowed toflow freely to Swift Creek. Also assessed is the risk to the environment associated withstructural failure of the water storage pond arising from overtopping of the pond, staticfailure of the constructed embankment, or the occurrence of a severe earthquake.
Risks associated with exceeding the available water storage capacity
• Estimates have been made of radiation exposure of members of the public resulting froman exceptional Wet season in which the storage capacity of the water retention pond isexceeded and the excess water is discharged to Swift Creek. The probability that anymember of the public would receive a radiation dose of 20 µSv on one occasion duringthe 30 year life of the mine would be less than 1 in 10,000. The annual dose limitrecommended by the International Commission on Radiological Protection for membersof the public is 1000 µSv per annum. The conclusion is, therefore, that the watermanagement system proposed by ERA for Jabiluka is one that poses an insignificantradiological risk to people living in the vicinity of the mine and consuming traditionalfoods obtained from the waterbodies downstream from the mine.
• Estimates have also been made of probable effects on aquatic animals resulting from anexceptional Wet season in which the storage capacity of the water retention pond isexceeded and the excess water is discharged to Swift Creek. The assessment includedboth radiological and chemical exposure. The conclusion reached is that, under normalcircumstances, no effect on aquatic animals living in Swift Creek downstream from theJabiluka mine would be expected to occur even when the volume of excess water
72
discharged is that with an exceedence probability of 1 in 50,000 over the life of the mine.If the discharge results from an extreme rainfall event with an exceedence probabilitymuch greater than 1 in 100 at the end of a Wet season in which the rainfall has anexceedence probability of greater than 1 in 1000, some adverse effects may occur ininvertebrates, but adverse effects on fish would not be expected. Any adverse effects oninvertebrates would be very short-lived.
Risks associated with overtopping the water storage pond
• The probability of the pond overtopping in the absence of contingency measures has beenestimated to be 5 in 10,000. It was assumed that overtopping would lead to completestructural failure of the pond embankment. The estimated radiation exposure of membersof the public arising from such an event is about 150 µSv. Thus, even for thiscatastrophic event, the expected dose received by members of the public would not begreater than 15% of the annual limit recommended by the International Commission onRadiological Protection.
• The uranium concentration in Swift Creek following overtopping of the retention pondand subsequent total failure of the dam walls would be expected to give rise to adverseeffects on some aquatic invertebrates in the Creek but adverse effects on fish would notbe expected.
• There is a risk of about 5 in 10,000 that, following overtopping of the water retentionpond, an area that is about 1% of the Magela floodplain would experience some adverseeffects on aquatic animals. Fish and many other species would not be affected. Betweenabout 2 km2 and 20 km2, adverse effects may persist but beyond 20km2 no effects shouldbe observed. In addition, any effects will be transitory and the system would fully recoverfollowing flushing by the natural waters of the Magela Creek.
• If a properly engineered spillway were installed in the wall of the retention pond, the damwould be protected from destruction under overtopping. This would result in the loss ofmuch lower volumes of water over a longer period and would fully protect both SwiftCreek and the Magela floodplain under the conditions considered here. It isrecommended that such a spill-way be incorporated in the design of the retention pond.
Risks associated with slope failure of the embankment of the water storage pond
• The probability of slope failure is estimated to be less than the probability of overtoppingwhich was estimated above to be about 5 in 10,000. Since slope failure would only ariseunder circumstances similar to those considered for overtopping, the estimates ofenvironmental impact derived above for overtopping would also apply to slope failure.
Risks associated with a severe earthquake
• Over the period of the mine life, the probability of structural failure of the water retentionpond arising from a severe earthquake has been estimated to be approximately 5 in10,000. In deriving this estimate, only local and regional earthquakes were considered.The frequent but distant large earthquakes in the Banda Sea, Indonesia, should beconsidered in the design of a water retention pond since they give rise to many cycles ofground motion. It is recommended that ERA commissions such a study at the detaileddesign stage of the Jabiluka project.
• The risk of radiation exposure of members of the public resulting from such anearthquake would be extremely low. At the 1 in 10,000 level of probability, the estimatedradiation exposure is about 30 µSv. The highest calculated exposure, which is less than

73
one tenth of the internationally accepted limit, has an extremely small exceedenceprobability.
• For an earthquake that occurs in the Wet season, the maximum area of the Magelafloodplain in which adverse effects on some aquatic invertebrates might be expected isabout 1.5 km2 but the probability of this occurring is extremely small. The area affectedat the 1 in 10,000 level of probability is less than 0.5 km2 which is less than 0.3% of thefloodplain area.. At the same level of probability, residual effects may occur for somespecies of invertebrates out to an area of about 5 km2. Even within these areas, the impactwould be very small (for example, fish should not be affected) and the system wouldfully recover following flushing by the natural waters of the Magela system.
• If an earthquake occurs in the Dry season, the area of impact would be greater.Nevertheless, the probability of such effects occurring remains very low and the systemwould recover during the following Wet season.
Contingency measures
• It is recommended that runoff from the ore stockpile should be isolated from runoff fromthe remainder of the Total Containment Zone so that it is always directed to the waterretention pond while, under extreme conditions, runoff from the rest of the TCZ isdiverted away from the storage pond. This measure would reduce still further the riskassociated with exceeding the capacity of the storage pond.
• It is recommended that the water retention pond be constructed with a properlyengineered spillway to ensure that, even if diversion contingency measures fail, the pondstructure would not fail when the overtopping height is reached. This would reducesubstantially the impact arising in the event of overtopping because only a small volumeof water would be released to the environment rather than the full volume of the pond.

74
6 Long-term storage of mine tailings
6.1 Introduction
In this chapter, issues related to the storage of tailings at the Jabiluka mine will be addressed.Since there have been a number of proposals for the storage of tailings, it is appropriate toclarify at the outset what the current proposal is.
When ERA submitted the EIS on Jabiluka, the main thrust of the proposal was the RangerMill Alternative under which, as stated earlier in this report, all tailings produced from themilling of the Jabiluka ore would be deposited in the mined-out pits at Ranger. In the EIS,ERA also identified its original concept for the Jabiluka Mill Alternative. The intention atthat stage was that, if milling at Jabiluka was the only option available to the company, about75% of the tailings would be returned as a cemented paste to the undergound mine void andthe remaining 25% of the tailings would be stored in a large tailings dam (total area about55 ha) constructed on the land surface at Jabiluka. The intention was to rehabilitate thetailings dam in situ at the end of mining.
The original JMA concept did not receive Government approval during the EIS process. Bythe time ERA submitted the Public Environment Report on the Jabiluka Mill Alternative, ithad developed a different approach to tailings management. Under the revised plan, specialpits would be excavated in the Kombolgie sandstone near the mill at Jabiluka and thesewould enable all tailings to be placed below ground from the outset and the site rehabilitationplan would include capping of the tailings pits with waste rock and final revegetation of thelandform.
This revised proposal was not accepted by the Commonwealth Government when it grantedapproval for the Jabiluka Mill Alternative to proceed. Rather, the Government required ERAto place all tailings in the mine void and in specially excavated stopes or silos in the vicinityof the orebody. ERA was required to prepare an amended proposal to the satisfaction of theSupervising Scientist and the Supervising Authorities prior to the granting of a licence for theexport of uranium from the Jabiluka site.
This amended proposal has not yet been received from ERA but detailed planning isunderway. ERA has cooperated with the Supervising Scientist in the preparation of thisreview by providing information on its current plans, thus enabling the Supervising Scientistto assess the environmental impact that might arise.
The proposal that is assessed in this chapter refers to the placement of 100% of the tailingsfrom the processing of Jabiluka ore in the mine void and specially excavated silos in thevicinity of the mine void. The environmental issues that require assessment are twofold:
(i) containment of the solid tailings so that they do not represent a long-term threat tothe wetlands of Kakadu, and
(ii) leaching of contaminants from the tailings, dispersion of the solutes in groundwaterand the consequent potential impact on the wetlands of Kakadu.
These issues are considered in the next two sub-sections.
6.2 Erosion of tailings in the long-term
The location of the mine void and the approximate location of the tailings silos as currentlyplanned by ERA are shown in figure 6.3.3 The highest part of the mine void is about 80 m

75
below mean sea level and about 100 m below the land suface in Mine Valley. The highestpoint of the tailings silos (as currently planned by ERA) is about 40 m below sea level andabout 110 m below the land surface of the crest between Mine Valley and the location of themine portal and surface facilities at Jabiluka.
Thus, once the mine is backfilled and sealed following completion of mining at Jabiluka, theonly mechanism for physical dispersal of the tailings solids will be erosion of the overlyingbedrock. Clearly, the whole land mass would need to be eroded away and by that time thewetlands of Kakadu would no longer exist. Physical dispersal of the tailings does not,therefore, pose a threat to the wetlands of Kakadu.
Geologic denudation rates in the Alligator Rivers Region have been summarised by theSupervising Scientist (Cull et al 1992). The mean and standard deviation of 45 measurementswere 0.04±0.03 mm per annum. These data included a number of measurements made in thevicinity of the Jabiluka No 1 orebody so that they are directly applicable to the currentassessment. These data are consistent with other measurements in the region. For example,Williams (1973 and 1976) recorded denudation rates between 0.011 and 0.054 mm perannum.
Following extraction of uranium in the mill, the tailings will contain uranium atconcentrations about 5% of the original concentration in the ore, but all of the radioactiveprogeny will be present at approximately their original ore concentrations. Assuming thaterosion rates will be similar in the future and using the mean denudation rate of 0.04 mm perannum, the time required to erode the bedrock overlying the tailings in the mine void and thesilos would be about 2 million years. This time scale is about 25 times the radioactive half-life of 230Th, the longest lived radioactive product of uranium. Hence the excessconcentrations of all the radioactive progeny will have decayed away by the time the tailingsare exposed and they will be in equilibrium with the residual uranium. This residual uraniumconcentration is about 30 times greater than the average concentration of uranium in therocks of the Alligator Rivers Region but clearly any tailings dispersed from the site in thevery long term would be mixed with, and diluted by, very large quantities of inert materialfrom the surrounding bedrock. Thus, dispersal of tailings in the very long term will notconstitute a hazard for future generations.
6.3 Leaching of contaminants from tailings
6.3.1 Hydrogeological description of the areaA detailed study of the hydrogeology of the Jabiluka area and modelling of groundwatercontaminant dispersion has been carried out by Kalf and Dudgeon (1999) (Attachment E) aspart of this review.
Groundwater flow in the vicinity of the mine is topographically controlled. A relatively highmean annual rainfall of about 1500 mm, which occurs mainly in the annual Wet seasons, andrelatively low permeability of the sandstone hills surrounding the mine site maintain highwater table levels in the hills. Both surface water and groundwater drainage is from the hillstowards the major valleys which run approximately east and west from the surface waterdivide which is located near the mine site. Groundwater flow in both of these directionseventually reaches the Magela floodplain in Kakadu National Park (see fig 6.3.1). Thewestward flow towards the floodplain follows the general line of Mine Valley. The eastwardflow must turn north to follow the course of Swift Creek and flow further before it can reachthe floodplain.

76
Figure 6.3.1 Hydrology and site features around Jabiluka
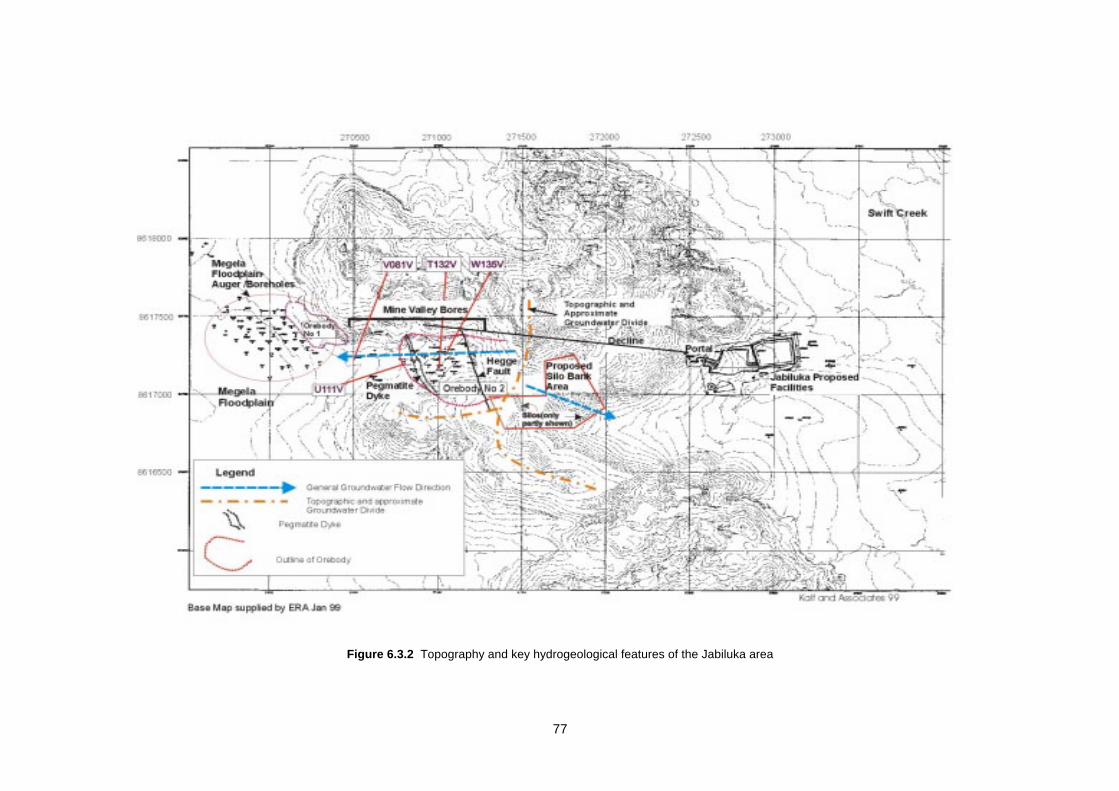
77
Figure 6.3.2 Topography and key hydrogeological features of the Jabiluka area

78
The Jabiluka orebody No 2 to be mined is contained within the Cahill Formation which ismostly schist although it includes some carbonate. To the west, the Cahill Formationunderlies the Magela floodplain and forms the bedrock which dips east and south beneath theoverlying Kombolgie sandstone (see fig 6.3.3).
The Kombolgie Formation is comprised mainly of quartz sandstone with a little siltstone andforms the broad north-south topographic ridge across the site and terrain further east. Most ofthe sandstone is better described as quartzite because of the deposition of secondary silica,although some relatively friable layers do occur. The intergranular porosity is very low andthe groundwater flow at the mine site is restricted mainly to the joint and fracture system.Inspection of the decline being constructed to gain access to the orebody showed appreciablegroundwater inflow only at one fracture zone. Most of the other joints were dry.
Along the Magela floodplain mainly grey and organic clays, silts and sandy alluvialsediments overlie the Cahill Formation. The bedrock in contact with the sediments isweathered.
Immediately east and west of the topographic divide the weathered bedrock in the lowerdrainage valley slopes is overlain by sands and silts. Drilling has revealed that weatheredbedrock can occur up to 50 m below ground surface.
Strongly developed lineaments comprising joints/fracture systems in the sandstone areevident from aerial photographs of the Jabiluka outlier and the elevated sandstone outcropnorth of orebody No 2. These structures strike at 60 to 80 degrees with another less dominantset at 350 degrees. The structural lineaments are less well defined in Mine Valley; however,it is possible that Mine Valley may have formed along zones of rock weakness createdinitially in the past by one or a number of these structures that have now been filled in withweathered material.
Other structural features include the Hegge fault that dissects the orebody and a pegmatitedyke that crosses the western part of the ore-body (fig 6.3.2). The pegmatite dyke has notbeen assigned any special properties for the modelling work undertaken, which is aconservative assumption because there is some indication that it may retard flow.
A hydrogeological section based on that given by Milnes et al (1998) is shown infigure 6.3.3. The orientation and extent of this section is shown in figure 6.3.1 as A-B-C.The section extends from the Magela floodplain in the west across the site through theorebody, the topographic ridge, Swift Creek, and then north until it reaches a branch of theMagela floodplain. Tailings derived contaminants were modelled by Kalf and Dudgeon(1999) along this section.
There are four main sub-surface water-bearing zones with essentially different hydrauliccharacteristics within this section at Jabiluka. They include:
• A shallow sandy aquifer overlying weathered bedrock in Mine Valley and east of thetopographic divide.
• A weathered bedrock aquifer.
• A deeper fractured rock aquifer.
• Floodplain non-indurated sediments.

79
Figure 6.3.3 Model section A-B-C, hydrological units, surface and sub-surface features near Jabiluka
The shallow aquifer is contained within topographic valley catchments carved into thesurrounding Kombolgie Sandstone to the west (ie Mine Valley) and to the east (Swift Creekand its tributaries). This aquifer is comprised of sands and silts up to about 13 m in thickness(ERAES 1998).
Beneath this aquifer lies the weathered bedrock which extends down tens of metres below theupper aquifer within the drainage valleys.
The deeper aquifer comprises essentially fractured quartz sandstone over most of the area andschists and carbonates of the Cahill Formation further west.
The Magela floodplain sediments consist largely of grey and organic clays and silts, withprior stream channel deposits of sand and silt.
The permeability of the sandstone/schist has been estimated by Foley in ERAES (1998) to bein the range 0.017 to 0.1 m/day in Mine Valley, whereas further west the permeability of theshallow carbonate/schist has been reported at 0.08 to 0.2 m/day. East of the groundwaterdivide AGC-Woodward Clyde (1993) reported only very low flows above the sandstoneschist contact and ERAES (1998) reported permeabilities in the range 0.001 to 1.2 m/daybetween the divide and Swift Creek, and 3x10⁻² to 3x10⁻⁴ m/day in the Kombolgie Sandstonein this area. Kalf and Dudgeon (1999) conclude that the tailings silos should be excavated inthe lower permeability Kombolgie sandstone east of the orebody, as is currently planned byERA. This choice of location will minimise potential environmental impacts.
Analysis of waters within the groundwater system indicates that soluble salt concentrations inshallow groundwater near the orebody are in the range 620–680 µS/cm, with pH between 7.1and 7.6. Chloride concentrations were between 6 and 20 mg/L, sulphate less than 14 mg/L,bicarbonate 50–223 mg/L and silica 5–12 mg/L (Deutscher et al 1980). Groundwater salinityto the east of the divide is low over a range of measured depths with reported values between
80
17 and 350 µS/cm (ERAES 1998). This range of values is supported by other measurements(as listed in ERAES 1998).
The groundwaters in the vicinity of the orebody, both to the west in Mine Valley and to theeast towards Swift Creek, are in stark contrast to the groundwater underlying the Magelafloodplain, which is of high salinity, is acidic, and has high sulphate concentrations. Pyriticlayers in the estuarine sediments underlying the plain are extensively oxidised to form acidsulphate soils (East et al 1992) as a result of seasonal wetting and drying cycles. The soils onthe floodplain are dominated by grey clays (East et al 1992). The chemistry of thegroundwaters is consistent with these conditions. Deutscher et al (1980) reported sulphateconcentrations of between 1500 and 6854 mg/L, accompanied by low pH (3 to 4) and highconcentrations of Fe2+ (200–700 mg/L) where sulphate concentrations were high. Thelocation of tested bores is given in figure 6.3.2. An interesting feature of the groundwaterunderlying the Magela floodplain is the low concentrations of radionuclides present withuranium exceeding 1 µg/L (125 mBq/L) in only two of forty seven samples collected byDeutscher et al (1980).
6.3.2 Description of the solute transport modellingA hybrid modelling approach has been used in this review (Kalf & Dudgeon 1999) to modelthe fractured rock aquifer in the project area. The modelling incorporated the three mainprocesses that control the movement of solutes in groundwater, viz advection, dispersion andretardation. Retardation is the term given to describe the collective processes of adsorption,precipitation/dissolution and other complex ion exchange reactions. A full description of themodelling and a list of the assumptions used in the approach are given by Kalf and Dudgeon(1999). The models used were:
• A two dimensional section finite element model (SEEP/W) of section A-B-C (seefig 6.3.1) to determine flow directions, head distributions and the range of Darcyvelocities along the section.
• A three dimensional numerical solute transport model (MODFLOW-SURFACT) appliedto determine the concentrations of solutes leached from the tailings paste material for useas the source concentrations in the analytical model.
• An analytical contaminant transport model to determine concentrations due to advection,dispersion in three co-ordinate directions and retardation. This model used as input therange of velocities and source concentrations determined from the first two models. Thismodel was combined with Monte Carlo calculations to determine concentration profilesfor a large number of different parameter values within selected ranges.
The three models above were used to predict downstream effects of the solutes stored in theJabiluka tailings as follows. Firstly, the assumed steady state water heads were computed bythe finite element model SEEP. The water surface from the model was fitted to approximatethe measured water surface at Jabiluka. These heads were used to drive the contaminanttransport through the three dimensional model MODFLOW-SURFACT to produce the‘source’ groundwater solute concentrations at a nominal 2 m downstream from the silos. Thethree dimensional model is necessary because of the complexity of the tailings storagegeometry. These ‘source’ concentrations, along with groundwater velocities from SEEP,were then used as input to the analytical model to compute solute concentrations furtherdownstream. Use of the analytical model enables a large range of solutions to be derived fordifferent model parameters, and in this way the sensitivity of the model predictions to a rangeof inputs can be assessed through Monte Carlo simulations. The hybrid model was run for the

81
equivalent of 1000 years for predictions of the movement of radium and uranium, and200 years for other contaminants.
The hybrid approach utilised by Kalf and Dudgeon (1999) enables detailed calculations to beundertaken where necessary, without hindering the development of the large number ofsolutions required to undertake a proper risk assessment. The prediction of soluteconcentrations downstream of the tailings repositories at Jabiluka is not trivial becausegroundwater flow and contaminant transport are complex three-dimensional processes. It isnot uncommon in studies involving groundwater modelling for the precision of the outcomesto be limited by availability of data, because of the high cost of obtaining appropriate datathrough drilling. At Jabiluka, ERA has had additional difficulties to overcome because ofrestrictions on access to areas from which data are required. The Monte-Carlo simulationshelp overcome these limitations by assessing model outputs for a wide range of parameters.The Monte-Carlo simulation requires a probability distribution of the range for eachparameter, and, in the current work, each value of a particular parameter was assigned anequal probability; this approach is conservative and ensures worst case scenarios areproduced.
Downstream concentrations of contaminants emanating from the tailings have been presentedby Kalf and Dudgeon (1999) in dimensionless or normalised form so that they can be usedfor predicting the impact for a range of source concentrations. Relative or normalizedconcentrations are expressed in terms of fractions or percentages of the source concentrationswhatever they may happen to be. The results in the modelling report can, therefore, be usedto determine absolute concentrations once the source concentrations are known moreprecisely. For example, differing assumptions on the permeability of the tailings give rise todifferent effective ‘source’ concentrations two metres out from the mine void or silos. Theeffect of permeability on concentrations of solutes far from the source can then be assessedquite rapidly using the relative concentration data from the analytical model.
6.3.3 Properties and constituents of tailingsRecent developments in dewatering technologies (eg cyclones, centrifuges, belt filters etc)have enabled production of tailings ‘pastes’ which have a lower water content than the parenttailings material, and superior environmental performance. Addition of binders such asPortland cement, as is proposed at Jabiluka, can then be conveniently undertaken to ensurethe tailings remain environmentally benign. Cincilla et al (1997) have suggested that thetailings stream should contain at least 15% by weight of particles of less than 20 µmdiameter, and that under these circumstances segregation can be avoided in a tailings paste.Golder and Associates (1997) undertook measurements on the particle size distribution andrheological characteristics of tailings from Jabiluka; they found that greater that 30% of thetailings had a particle size less than 20 µm, and that the tailings were well suited to theapplication of paste technology.
Although only limited work has been completed on the properties of Jabiluka tailingsbecause the mine is not operational, physical properties of tailings at Ranger have beenstudied by Richards et al (1990). Ore at Jabiluka and Ranger originates from CahillFormation schists and will be subject to the same milling process. Hence the tailings from thetwo mines are expected to have similar physical and chemical properties. The tailingspermeability is illustrated in figure 6.3.4 as a function of effective stress, because whentailings are in place they are subjected to overburden pressure that reduces their permeability.Richards et al (1990) fitted Equation 6.1 to the tailings permeability data, and their equationhas been shown to be consistent with tailings permeability data at other minesites (B

82
Richards, pers comm). Although Richards et al (1990) suggest that the data illustrated infigure 6.3.4 are the most representative of their measurements on Ranger tailings, they alsomeasured higher values of permeability, particularly in areas where significant segregationhad occurred. This indicates that care will be needed in the management and placement oftailings into the repositories at Jabiluka.
Richards et al (1990) derived the following equation to represent the relationship betweentailings permeability, k (m/s), and effective stress, h (KPa):
1114.27 102.1)72.10/()100.3( −− += xhxk (6.1)
This equation has been plotted in figure 6.3.4. In the modelling work undertaken by Kalf andDudgeon (1999) a tailings permeability of less than 10-4 m/day (approximately 10-9 m/sec) isrecommended. The effective stress that would be required to achieve a permeability of 10-9 m/scan be calculated from Eq. 6.1, as 14 kPa. If approximate values are assumed for the tailingsdensity of 2, and the density of water assumed to be 1, then 14 kPa of overburden stress canbe achieved through a tailings overburden depth of approximately 1.4 m. For a 135 m deepsilo at Jabiluka, 99% of uncemented tailings placed in a silo would have a permeability lessthan 10-9 m/s, and the mean tailings permeability in the 135 m high silo would be much lessthan 10-9 m/s (fig 6.3.4). The addition of 4% cement to the tailings can lower its permeabilityby a further three orders of magnitude. In addition to the effect of adding cement, thereduction in water content that will be achieved through dewatering the tailings (dewateringwill be undertaken before cement additions) will improve the cohesiveness of the tailings andreduce the possibility of segregation, which can increase the permeability.
Figure 6.3.4 Permeability (m/s) as a function of effective stress (kPa) for tailingsfrom the Ranger Mine located 22 km from Jabiluka
The considerations above indicate that a cemented tailings permeability of well below 10-9 m/sshould be readily achieved at Jabiluka. The final percentage of cement to be added to the
1.E-11
1.E-10
1.E-09
1.E-08
10 100 1000
Effective stress (kPa)
Per
mea
bili
ty -
k (
m/s
)
Sample 2 Sample 2 fitted line
Sample 5 Sample 5 fitted line
Sample 4 Sample 4 fitted line
Equation 6.1

83
tailings, and other procedures constituting the tailings treatment, are the subject of a currentresearch program being undertaken by the mining company. The final fully developedtailings management procedure will be approved only after the Supervising Scientist issatisfied as to its efficacy.
The primary solutes of environmental concern in the tailings at Jabiluka are magnesium,sulphate, manganese, uranium, and radium. Some of the properties of these elements, whichare needed to predict downstream concentrations are listed below in table 6.3.1. It is wellknown that the availability of metals in solution is a function of pH, with metal solubilitygenerally decreasing with increases in pH. The addition of cement to the tailings paste willincrease the pH, and a pH of up to 10 could be expected in Jabiluka cemented tailings. Also,it could be expected that the addition of cement to the tailings will bind some of the solutes tothe cured tailings matrix. Cincilla et al (1997) suggest that the geochemistry of tailings pastecan be readily modified to improve its environmental behavior. Further discussion of theseaspects is given in the Jabiluka PER and in a report by Waite et al (1998). In addition, furtherinvestigations will be carried out as part of the ERA research program alluded to above. Thevalues of tailings solute concentrations in table 6.3.1 have been used in examples given insection 6.3.4 because they are conservative.
Table 6.3.1 Model parameters for important solutes in the Jabiluka tailings
Solute Concentration inTailings*
Retardation Factor,Rf
Distribution Co-efficient, Kd
Uranium 15Bq/L 20 1
Radium 15Bq/L 100 5
Magnesium 5,000mg/L 1 0
Sulphate 20,000mg/L 1 0
Manganese 500mg/L 30 1.5
* Concentrations have been estimated using data for the geologically similar Ranger tailings
In table 6.3.1, Kd is the distribution co-efficient (see Eq (1) in Kalf & Dudgeon 1999) whichdescribes the amount of the solute which will be retarded through absorption,precipitation/dissolution and complex ion-exchange reactions in the aquifer. The value of Kd
is linearly related to the retardation factor, Rf, of the solute used in the model.
6.3.4 Predicted downstream concentrations of tailings derived solutesThe groundwater modelling indicated that the upward component of groundwater flow isweak in both the groundwater movement to the east towards Swift Creek and to the westtowards the Magela floodplain. The flow was found to be predominantly horizontal, implyingthat only a small fraction of the groundwater in the deeper aquifer would be accessible tosurface waters. All of the calculated groundwater concentrations discussed below refer toconcentrations in the deep aquifer. Surface aquifer concentrations arising from the tailingsrepositories will be much lower. Regular annual flushing of the surface aquifer in the Wetseason will ensure that there is a high degree of additional dilution and no build-up ofcontaminants in this zone.
Sources of the modelled solutes were the tailings silos for groundwater flows to the east, andthe tailings deposited in the mined out stopes for flow to the west (see fig 6.3.3). As a test,Monte Carlo calculations were run initially by Kalf and Dudgeon (1999) for 255, 500 and1000 random selections of the values of the variables. When little difference was found

84
between the runs, 255 random selections were used subsequently for simplicity. Theparameters varied for the Monte Carlo calculations were the dispersivity, aquifer porosity,Darcy velocity and retardation. The range used for each parameter is listed in table 6.3.2.
Table 6.3.2 Parameter ranges used in the Monte Carlo analysis
Parameter Range
Longitudinal Dispersivity αL 1 m to 10 m
Transverse Dispersivity αT 0.1 m to 1m
Vertical Dispersivity αV 0.01 to 0.1 m
Darcy Velocity vD 5 x 10⁻⁵ m/day to 5 x 10⁻⁶ m/day (East)5 x 10⁻⁴ m/day to 5 x 10⁻⁵ m/day (West)
Effective Porosity Pa 0.005 to 0.10
In the lower permeability aquifer to the east of Jabiluka, the concentrations of non-reactivesolutes reduce to negligible levels 200 m from the mine. For example, the median sulphateconcentration profile relative to the ‘source’ concentration immediately downstream from thesilos is given in figure 6.3.5. This solute profile was obtained for a 200 year run with atailings permeability of 10-9m/s and an aquifer conductivity of 0.01 m/d. If the tailingsconcentration of sulphate, which is the most mobile of the solutes considered, is 20,000 mg/L(table 6.3.1), the three-dimensional solute transport model shows that the concentrationreduces to 2000 mg/L immediately downstream of the silo (Kalf & Dudgeon 1999). The datain figure 6.3.5 show that the median sulphate concentration reduces to 20 mg/L at a distance100 m downstream. Given the large additional dilutions through the surficial aquifer beforethe contaminant can reach Swift Creek, then additional dilution in the creek itself, Kalf andDudgeon (1999) conclude that there is negligible potential for contamination of surfacestreams to the east.
Figure 6.3.5 Variation of the median concentrations of SO4, U and Ra with distance east of the tailingssilos at Jabiluka. Concentrations are expressed as ratios to the ‘source’ concentration immediately
downstream of the silos. The SO4 concentrations were calculated 200 years after placement.The U and Ra concentrations were calculated 1000 years after placement.
Distance from Tailings Repository (m)
0 50 100 150
Con
cent
ratio
n R
elat
ive
to S
ourc
e
0.0
0.2
0.4
0.6
0.8
1.0
SO4 200 years
U 1000 yearsRa 1000 years

85
The Monte Carlo simulations conducted for uranium using a paste permeability of 10-9 m/sindicated a contaminant front would move 50m downstream to the east after 1000 yrs. Themaximum computed distance (which the Monte Carlo simulations indicated was of very lowprobability) was 300 m. For this paste permeability, which is at the upper end of rangeconsidered in the risk assessment process, the uranium concentration just outside the silos ispredicted to be about 2.7 Bq/L and at 45 m from the silos it is predicted to fall to less than1 mBq/L. The latter value is much less than naturally occurring concentrations ingroundwater in the region which are about 30 mBq/L. For the median result, the distance forradium transport to the east was less than 15 m at which point the concentration would beless than 1 mBq/L, again much less than naturally occurring concentrations.
The transport of solutes to the west is calculated to be somewhat more rapid because of thegreater permeability of the aquifer there. The velocities east of the divide in the sandstone arebetween 5x10⁻⁵ and 5x10⁻⁶ m/day, whilst in schists to the the west the range is 5x10⁻⁴ to5x10-5 m/day. The results obtained for the migration of sulphate, uranium and radium to thewest are shown in figure 6.3.6. These data indicate a probable migration distance of 500 mafter 200 years for sulphate, although greater distances are possible (Kalf & Dudgeon 1999).Again, the three dimensional solute transport model shows that for a tailings permeability of10-9 m/s, the sulphate ‘source’ concentration immediately downstream from the mine voidtailings would be about 2000 mg/L. The data in figure 6.3.6 show that the medianconcentration of sulphate would drop to less than 20 mg/L about 500 m downstream. Thiswater would be entering an area of already very poor quality water (see section 6.3.1) wherenatural sulphate concentrations are in the range 1500–7000 mg/L so that the impact of themigration of water from the tailings repository would be negligible. In addition, thefloodplain is underlain by low permeability clays (East et al 1992) which act to limit anypotential upflow of the groundwater into surface waters.
Figure 6.3.6 Variation of the median concentrations of SO4, U and Ra with distance west of the tailingsin the mine void at Jabiluka. Concentrations are expressed as ratios to the ‘source’ concentration
immediately downstream of the void. The SO4 concentrations were calculated 200 years afterplacement. The U and Ra concentrations were calculated 1000 years after placement.
The data in figure 6.3.6 indicate that uranium is likely to travel up to 200 m in a westerlydirection at which point the concentration would be reduced to less than 1 mBq/L, aconcentration that is significantly less than natural concentrations in the region. The Monte
Distance from Tailings Repository (m)
0 200 400 600 800
Con
cent
ratio
n R
elat
ive
to S
ourc
e
0.0
0.2
0.4
0.6
0.8
1.0
SO4 200 years
U 1000 yearsRa 1000 years

86
Carlo calculations show that migration up to 1200 m is possible but with a very lowprobability. Kalf and Dudgeon (1999) conclude that radium and uranium will remain atbackground levels in the floodplain.
Kalf and Dudgeon (1999) also concluded that there is negligible likelihood of a majorfracture system in the rock aquifer that could cause significant pollution in downstreamwaterways.
6.4 Risk assessment on the long-term storage of tailings
A risk assessment of the probable impact on people and the wetlands of Kakadu NationalPark arising from the long-term storage of tailings in the mine void and the silos has not beencarried out to the extent that was developed in chapter 5 for storage of uranium on thesurface.
To carry out such an assessment would require the extension of the analysis of groundwaterdispersion to the quantitative prediction, using Monte Carlo analysis methods, of theconcentrations of solutes in the waters of the Magela floodplain and the probability withwhich these concentrations will occur. The range and quality of existing hydrogeological datado not enable such a detailed analysis to be carried out. However, the Monte Carlo analysesof solute concentrations in the deep aquifer and the information on the vertical component ofgroundwater flow presented in section 6.3 demonstrate that the concentrations of the tailingsderived solutes in surface waters of the Magela floodplain will remain at their natural valuesand will not be affected by dispersion of solutes from the tailings repositories.
6.5 Summary of findings on long-term storage of tailings
Erosion of tailings in the long-term
• Once the Jabiluka mine is backfilled and sealed following completion of mining, the onlymechanism for physical dispersal of the tailings solids will be erosion of the overlyingbedrock. Since the mine void and the tailings silos will be about 100 m below the surfaceand the upper surface of these is below sea level, the whole land mass would need to beeroded away and by that time the wetlands of Kakadu would no longer exist. Thus,physical dispersal of the tailings does not pose a threat to the wetlands of Kakadu.
• Using the mean measured denudation rate for the region of 0.04 mm per annum, the timerequired to erode the bedrock overlying the tailings in the mine void and the silos wouldbe about 2 million years. Hence the excess concentrations all of the radioactive progenywill have decayed away by the time the tailings are exposed and they will be inapproximate equilibrium with the residual uranium.
• Dispersal of tailings in the very long term will not constitute a hazard for futuregenerations.
Hydrogeological features of the area
• The permeability of the Cahill Formation schists west of the orebody is significantlygreater than that of the Kombolgie sandstone to the east. For this reason, it isrecommended that the additional tailings silos should be excavated in the Kombolgiesandstone east of the orebody, as is currently planned by ERA. This choice of locationwill minimise potential environmental impacts.
• The excavation of the silos will result in additional material being placed on the surface.The location of the silos in the sandstone rather than in the schists to the west is also

87
preferable from the perspective of minimising environmental hazards on the surfacebecause the sandstone is relatively low in the concentrations of hazardous chemicals.This material will require additional attention during the rehabilitation phase, but controlof potential impacts on surface waters will be straightforward.
• The quality of groundwaters in the vicinity of the Jabiluka orebody, both to the west inMine Valley and to the east towards Swift Creek, is high. Soluble salt concentrations arerelatively low and radionuclide concentrations are very low. It is concluded that there isvery little movement of radionuclides into the groundwater aquifer from the orebody. Incontrast, the groundwater underlying the acid sulphate soils of the Magela floodplain isof high salinity, is acidic, and has high sulphate concentrations. The observed sulphateconcentrations are up to one third of the concentration of sulphate expected in theJabiluka tailings.
Modelling of the dispersion of solutes in groundwater
• A two dimensional section finite element model was used to determine flow directions,head distributions and the range of velocities.
• A three dimensional numerical solute transport model was applied to determine theconcentrations of solutes leached from the tailings paste material for use as the sourceconcentrations in the analytical model.
• An analytical contaminant transport model was used to determine concentrations due toadvection, dispersion in three co-ordinate directions and retardation. This model used asinput the range of velocities and source concentrations determined from the first twomodels. This model was combined with Monte Carlo calculations to determineconcentration profiles for a large number of different parameter values within selectedranges.
Properties and constituents of tailings
• Although limited information is available on Jabiluka tailings because the mine is notoperational, physical properties of tailings at Ranger have been studied extensively. Oreat Jabiluka and the Ranger Mine originate from the same geological formation and willbe subject to the same milling process. Hence the tailings from the two mines areexpected to have similar physical and chemical properties.
• Work undertaken as part of this review shows that achieving a tailings permeability ofless than 10-9 m/sec is desirable. Based upon the research carried out on Ranger tailings,it is concluded that 99% of tailings in the silos at Jabiluka would have a permeability ofless than 10-9 m/sec. Similar results are expected for tailings in the mine void but carewill need to be exercised in placement of tailings in the mine void to avoid segregationand extensive residual voids.
• Research elsewhere on the effect of cementing the tailings paste indicates that thepermeability of tailings will be reduced still further and may even reach a value which islower than normal tailings by a factor of 1000.
• The addition of cement to the tailings will result in highly alkaline conditions which willreduce the availability of metals and radionuclides for dispersion from the tailings massin groundwater.
• The conclusion of this review is that there is a very high probability of achieving apermeability in the cemented tailings that is less than 10-9 m/sec.

88
Predicted concentrations of solutes in the environment
• Modelling of the concentrations of solutes in the deep aquifer east of the tailingsrepositories in the direction of Swift Creek predicts that, after 200 years, sulphateconcentrations should not exceed 20 mg/L even at distances as short as 100 m from therepositories. Uranium is not expected to move more than 50 m in 1000 years and forradium this distance is 15 m. The maximum distance moved by uranium under the mostextreme (and very low probability) scenario considered in the Monte Carlo analysis is300 m. Concentrations of uranium and radium at these distances will be negligiblecompared to naturally occurring concentrations.
• The transport of solutes to the west of the repositories is expected to be more rapidbecause of the higher permeability of the schists compared to that of the sandstone.Monte Carlo calculations indicate a probable migration distance of 500 m after 200 yearsfor non-reactive solutes including sulphate, although greater distances are possible. Thetailings derived solutes would be entering an area of already very poor quality waterwhere natural sulphate concentrations are in the range 1500–7000 mg/L so that theimpact of the migration of water from the tailings repository would be negligible. Inaddition, the floodplain is underlain by low permeability clays which act to limit anypotential upflow of the groundwater into surface waters.
• The Monte Carlo calculations indicate that uranium is likely to travel up to 200 m in awesterly direction in about 1000 years at which point the concentration would be reducedto less than 1 mBq/L, a concentration that is significantly less than natural concentrationsin the region. The calculations show that migration of uranium by up to 1200 m ispossible but with a very low probability. It is concluded that radium and uranium willremain at background levels in the Magela floodplain.
• The groundwater modelling indicates that the upward component of groundwater flow isweak in both the groundwater movement to the east towards Swift Creek and to the westtowards the Magela floodplain. The flow was found to be predominantly horizontal,implying that most of the solutes from the tailings repository will remain in the deepaquifer and move under the floodplain towards the sea. Only a small fraction of thegroundwater in the deeper aquifer would be accessible to surface waters. All of thecalculated groundwater concentrations discussed above refer to concentrations in thedeep aquifer. Surface aquifer concentrations arising from the tailings repositories will benegligible. Any contaminants reaching the surface aquifer will be diluted and flushedaway during the annual Wet seasons.
• The overall conclusion is that the wetlands of Kakadu will not be harmed as a result ofthe dispersal of tailings constituents in groundwater.
Risk assessment on the long-term storage of tailings
• A risk assessment of the probable impact on people and the wetlands of Kakadu NationalPark arising from the long-term storage of tailings in the mine void and the silos has notbeen carried out to the extent conducted for storage of uranium on the surface.
• To carry out such an assessment would require the extension of the analysis ofgroundwater dispersion to the quantitative prediction, using Monte Carlo analysismethods, of the concentrations of solutes in the waters of the Magela floodplain and theprobability with which these concentrations will occur. The range and quality of existinghydrogeological data do not enable such a detailed analysis to be carried out.

89
• However, the Monte Carlo analyses of solute concentrations in the deep aquifer and theinformation on the vertical component of groundwater flow demonstrate that theconcentrations of the tailings derived solutes in surface waters of the Magela floodplainwill remain at their natural values and will not be affected by dispersion of solutes fromthe tailings repositories.
90
7 General environmental protection issues
7.1 Protection of the environment in the Alligator Rivers Region
Full details on the management arrangements for Kakadu National Park, the regulatoryarrangements governing the mining of uranium in the Region, the supervisory responsibilitiesof the Commonwealth Government exercised through the Supervising Scientist, and therecord of protection of Kakadu from environmental impact are presented in Johnston andNeedham (1999) (Attachment A, ‘Protection of the environment near the Ranger uraniummine’).
The standard of environment protection that has been demanded by the Supervising Scientisthas, from the commencement of mining in the Region, been among the highest in the world.Key in environmental protection are the Ramsar listed wetlands within the Kadadu NationalPark World Heritage Area. These seasonal wetlands present the greatest potential for damagefrom anthropic activity and have always received the highest attention from the SupervisingScientist. For the protection of these aquatic ecosystems, a control regime was implementedthat was based on both chemical and biological assessment. In both cases, the approachadopted was consistent with the principles of Sustainable Development (Brundtland 1988)but was many years in advance of the international adoption of these principles.
Given the very high value attributed to Kakadu National Park by the Australian Governmentand the Australian community, the policy adopted in the development of chemical receivingwater standards was that concentrations of chemical constituents should not be allowed todepart significantly from their ‘natural’ values unless there existed strong scientific evidencethat any proposed change would not give rise to biological or chemical impact. Based on thispolicy, a strategy for development of appropriate standards was derived. In brief, a criterionthat was considered conservative by biological scientists was adopted to determine whatchange from natural values could be assessed as not being biologically significant. A sitespecific assessment was then made to determine which chemicals would not meet thiscriterion, were waters to be discharged from the Ranger mine. These chemicals wereconsidered ‘critical constituents’. The available scientific data for this small number ofcritical constituents were examined to determine their adequacy for the setting of appropriatestandards. For those for which the data were inadequate, toxicological tests were carried outon local native species to derive suitable standards.
This approach, developed by the Supervising Scientist, was accepted by the Australian andNorthern Territory Governments. Water quality standards were then able to be deduced andapplied more widely in the region. In retrospect, the policy can be seen as what would now bedescribed as a precautionary aproach.
Similarly, the policy adopted in developing biological methods for the control and monitoringof water discharges from the Ranger mine was that the procedures used in the watermanagement system at the mine should result in no detectable change in the species andcommunity diversity of a set of aquatic animals in waterbodies downstream from the minesite. The strategy for achieving this objective was to implement a regime of stringentecotoxicological tests prior to the discharge of any water from the mine site and to implementan extensive program of biological monitoring.
The ecotoxicological tests determine the lowest concentration of the effluent in creek waterat which a change is detected for some sensitive measure of the animal’s health (the LOEC)and the highest concentration at which no effect is observed (the NOEC). These values are

91
then used to specify the minimum dilution for effluent when discharged into surface waters.In specifying this minimum dilution, a factor of safety is applied to give protection againstwithin-species variability, between-species variability and statistical uncertainties. Thechoice of species tested was made following an extensive period of research by theSupervising Scientist during which about 20 different species of local aquatic animals andplants were examined to determine the most sensitive species to waters at Ranger and speciesthat could be successfully bred and maintained in the laboratory. The large number of speciesexamined, the use of local native species and the use of a safety factor in specifying thedilution are factors that make the testing program for release of water to the Magela systemthe most rigorous anywhere in Australia and possibly the world.
The biological monitoring program includes: (a) tests that enable a short-term assessment ofthe impact of release, so that immediate management action can be implemented shouldeffects be observed, and (b) tests that assess the long-term impact of the mining operation onaquatic ecosystems. The short-term tests are essentially toxicological tests on certain speciescarried out in the field downstream from the mine and use sensitive endpoints (for example,survival of larval fish and the egg production rate of freshwater snails) in local native species.The long-term tests search for changes in species and community diversity by examining thecommunity structure of fish and macroinvertebrates identified to the species level.
A full analysis of the results of these monitoring programs, as well as radiological monitoringprograms, is presented in Johnston and Needham (1999). This report shows that theconcentrations of all chemical constituents have, throughout the entire period of mining,remained below the standards recommended by the Supervising Scientist, that operation ofthe mine has had no detectable impact on a range of sensitive indicators of ecological healthincluding the survival of larval fish, the reproduction of freshwater snails, the migrationpatterns of fish, and the community structure of fish and macroinvertebrates, and that theradiation exposure of people living in the vicinity of the mine, either through consumption offoods collected from downstream waters or through radon dispersed from the mine site, hasalways been significantly lower than the internationally recommended limit on radiationexposure of members of the public.
In summary, the environmental protection regime that the Australian Governmentimplemented for the mining of uranium at Ranger has been completely consistent with theprinciples of Sustainable Development and it has been demonstrated, through an extensivechemical, biological and radiological monitoring program, that no impact of significanceunder those principles has occurred, on either people or ecosystems of Kakadu National Park,throughout the operation of the Ranger mine.
The same regulatory regime, but strengthened in some particular cases, would apply to themining of uranium at Jabiluka.
7.2 The Ranger and the Jabiluka milling alternatives
The report of the Mission of the World Heritage Committee to Kakadu noted (section 7.3)that two options for the milling of ore from the Jabiluka mine have been proposed by ERAand assessed by the Government. These options are known as the Ranger Mill Alternative(RMA) and the Jabiluka Mill Alternative (JMA).
Under the RMA option, ore would be transported from Jabiluka to the Ranger mine sitewhere it would be processed in the existing mill. Transportation would be along a speciallyconstructed road 22.5 km in length. No part of this road would be in Kakadu National Park.All tailings produced from the milling of the Jabiluka ore would be deposited in the mined-

92
out pits at Ranger along with the tailings produced from the milling of Ranger ore. Followingcompletion of mining, the pits would be covered with inert waste rock and revegetated. Allwaste rock produced at Jabiluka would be used as cemented backfill in the mine void. Inaddition, some of the waste rock and low grade ore at Ranger would be transported to theJabiluka site and used as cemented backfill in the mine void. The only surface facilities atJabiluka would be an ore stockpile, a waste rock stockpile and a water retention pond tocollect and store all rainfall runoff from the stockpiles and water pumped from the mine. Nowater would be discharged from the mine. Following completion of mining, the pond wouldevaporate to dryness over several years and the site would be rehabilitated.
Under the JMA option, which is the subject of this review, a mill would be constructed atJabiluka to process the ore. All tailings would be dewatered to form a paste to which wouldbe added concrete and the concrete paste would be returned underground to the mine voidand to silos excavated underground, probably in the sandstone to the east of the orebody. Theexcavated sandstone would be placed in stockpiles on the surface at Jabiluka. All waterpumped from the mine and rainfall runoff from the mill and ore stockpile would be collectedand stored in a water retention pond. Rainfall runoff from the sandstone stockpiles wouldfreely discharge to Swift Creek but ERA would, as specified by the Minister for theEnvironment, be required to take whatever steps are necessary to ensure that suspendedsolids concentrations in Swift Creek do not rise significantly above natural values.
Because the JMA option requires the construction of a mill at Jabiluka and requiresadditional waste rock stockpiles, the RMA option is preferred both by ERA and theGovernment. However, the RMA option requires the specific approval of the traditionalowners and this approval has not been given. It is for this reason that ERA proposed the JMAoption. The Mission report was critical of ERA for proposing to proceed with the JMAoption ‘despite not being the preferred environmental option’. This review, however, and theoriginal assessment of the JMA proposal by Environment Australia have shown that, whilethe RMA option is preferred, the risk to the environment arising from the JMA option isminimal and, in particular, that the wetlands of Kakadu National Park will not be threatenedif the project proceeds.
7.3 Location and extent of the Jabiluka ore body
The extent of the No 2 orebody at Jabiluka has not been fully delineated at depth in thatsection of the orebody to the east of the Hegge fault (see for example fig 6.4 of the EIS). It isthe intention of ERA to carry out further drilling once the decline reaches the orebody in anattempt to establish whether or not further reserves of uranium exist.
The possibility of finding further uranium ore at depth was assessed in the EnvironmentAssessment report on ERA’s proposal at the EIS stage. The primary issue considered was thecapacity of the two pits at Ranger for the disposal of tailings from both the Ranger depositsand tailings from Jabiluka. The Government decided that, when placed in the pits at Ranger,tailings from the combined operations at Ranger and Jabiluka should not exceed specifieddepths below the ground surface. The effect of this decision is to restrict mining at Jabilukato the currently delineated orebody. Any proposal to mine more uranium than would satisfythis requirement will require further assessment under the Environment Protection (Impact ofProposals) Act 1974. Hence, if the Ranger Mill Alternative were to proceed, the mining atJabiluka would be restricted to the currently delineated orebody and the period of miningwould be about 30 years.
93
If the Jabiluka Mill Alternative proceeds, however, the issue of adequate capacity fordisposal of the tailings from Jabiluka does not arise because all tailings will be returnedunderground. The mining and milling of any additional reserves of uranium would result inreturn of the additional tailings produced to the additional mine void and to additional silosexcavated for the purpose. There would be no need for further assessment under theEnvironment Protection (Impact of Proposals) Act 1974.
7.4 Landscape-wide analyses
Wasson et al (1998) suggest that the landscape context of the mine proposal has beeninadequately addressed. The EIS did contain some detail on the vegetation associations usingthe work of Wilson et al (1990a and b), the authoritative work on vegetation in the NorthernTerritory. The Jabiluka mine will be a point impact, with some specific potential effects,which are addressed in the main body of this report. It is simply not true to suggest that theEIS and PER are inadequate because they have not considered a ‘Kakadu National HeritagePark’ (sic) scale.
The potential impact on wetlands is, however, considered to be a key element of theenvironmental protection associated with Jabiluka, as it is with Ranger. The potential effectsof any environmental impacts will arise from groundwater intrusion, and from accidentalimpacts on surface features. Such impacts have been included in the work contained in theEIS/PER, and have been subjected to further critical review in this report.
While it is true the sort of digital terrain modelling contained in Wasson et al (1998) is notincluded in the EIS/PER, it is not considered necessary or appropriate to determine the safetyof the mine proposal. Further, the suggestion that Jabiluka is ‘the only escarpment unitadjacent to the swamp ecosytem’ is untrue. The term swamp ecosystem suggests a uniformitythat a casual examination shows to be false — the floodplains are a very complex spatial andtemporal mix of vegetation and faunal communities. Jabiluka, as an outlier of the escarpment,is similar to Mt Brockman, Nourlangie Rock, Mt Basedow and others. The Jabiluka site doeshave a very rich landscape texture, derived from a complex mix of topography and surfacegeology. The Jabiluka project, however, will not have any long-term effects on this landscapetexture.
The assertion that the context modelling for the minesite need be broader than is currently thecase is therefore rejected.
7.5 Acid sulphate soils
The submission of Wasson et al (1998) notes the existence of acid sulphate soils on theMagela floodplain downstream from the Jabiluka mine site and proposes that these soilscould give rise to the following concerns:
(i) Heavy metals accidentally released from the mine site could be mobilised intodownstream ecosystems by acid from the soils, and
(ii) Developments associated with the mine, such as the pumping of water from abillabong to service the Ja-Ja camp, could lead to increased acidity in surface waters.
With respect to the second of these concerns, the proposal to re-establish the old Ja-Ja camp,which was outlined in the Supplement to the EIS (section 5.4.2), was withdrawn in the PERon the Jabiluka Mill Alternative (section 4.3.7). As a result, there is now no intention topump 10,000 L of water per day from the billabong. Water requirements will be limited to

94
the daily supply for one security officer. This requirement will, therefore, not cause anyincrease in acidity in surface waters.
The first concern recognises that, even in a well designed system with inbuilt first and secondorder levels of protection, occasional accidents can occur resulting in the unplanned releaseof contaminants. However, experience at the Ranger mine has shown that in every case whereincidents have occurred, the total load of any metals released is extremely small compared tothe natural load of metals in the soils of the floodplain. Hence, the impact of these accidentalreleases has been, and can with confidence be expected to be, insignificant compared to thatarising from the naturally occurring metals in the soils of the floodplain.
7.6 Rehabilitation of the Jabiluka lease area
The Commonwealth Government, in its environmental requirements for the Jabiluka mine,requires ERA to rehabilitate the mine site in a manner which will establish an environment inthe lease area that reflects to the maximum extent that can reasonably be achieved, theenvironment existing in the adjacent areas of Kakadu National Park. The intention of therehabilitation is that the rehabilitated area could be incorporated into the Kakadu NationalPark without detracting from park values. These requirements are the same as apply to theRanger Project Area.
The major objectives of rehabilitation are:
(a) to revegetate the disturbed sites of the lease area with local native plant species similarin density and abundance to that existing in adjacent areas of Kakadu National Park, inorder to form an ecosystem the long term viability of which would not require amaintenance regime significantly different from that appropriate to adjacent areas ofthe park;
(b) to establish stable radiological conditions on disturbed sites of the lease area so that,with a minimum of restrictions on use of the area, the public dose limit will not beexceeded and the health risk to members of the public, including traditional owners,will be as low as reasonably achievable;
(c) to limit erosion in rehabilitated areas, as far as can reasonably be achieved, to thatcharacteristic of similar landforms in surrounding undisturbed areas.
The Government has established secure mechanisms to ensure that these rehabilitationobjectives will be achieved even if the company becomes insolvent and ceases operationsprior to the completion of adequate rehabilitation of the sites.
In accordance with the Ranger Uranium Project Government Agreement between theCommonwealth and ERA, a rehabilitation plan is submitted each year by ERA to theDepartment of Industry, Science and Resources (DISR). Its purpose is to provide the basis forestimating the appropriate size of the Ranger Rehabilitation Trust Fund, an ongoingcontingency for the cost of rehabilitation of the Ranger Project Area if mining operationswere to cease at the date of the preparation of the plan. The Supervising Scientist providescomment to the DISR on each rehabilitation plan.
The Jabiluka Rehabilitation fund comprises a Bank Guarantee deposited with the NTDepartment of Mines and Energy to provide a basis for rehabilitating the site if operationswere to cease. The amount of this Bank Guarantee is the estimated cost of rehabilitation plusa contingency factor. As with the Ranger Rehabilitation Plan, the Jabiluka RehabilitationPlan was submitted to the Supervising Scientist for comment before acceptance.

95
7.7 Transport of uranium from the Jabiluka mine
The transport of uranium product is subject to the requirements of the Northern TerritoryRadioactive Ores and Concentrates (Packaging and Transport) Act. Under this act, anytransport of uranium product outside the boundaries of the Jabiluka mine lease or the RangerProject Area is forbidden except in accordance with a current Licence to TransportRadioactive Material issued under that Act. Further, the storage of uranium product outsidethe boundaries of the Jabiluka mine lease or the Ranger Project Area is also forbidden exceptin accordance with a current Licence to Store Radioactive Material.
Together, these two legal instruments specify the route that must be followed, the placeswhere the uranium product may be stored en route to the Port of Darwin, the securitymeasures which must be in place, the communication and emergency equipment which mustbe available, and the training requirements for the person in charge of the vehicles conveyingthe uranium product. They also require that the uranium product be packaged and transportedin accordance with the Code of Practice for the Safe Transport of Radioactive Substances1990, which includes the total text of the International Atomic Energy (IAEA) Regulationsfor the Safe Transport of Radioactive Material.
Uranium product is insoluble powder with a low specific activity (radiation concentration). Itis predominantly an alpha and beta particle emitter, however, it also emits low levels ofgamma radiation. The hazard associated with uranium product is the inhalation of particles inthe respirable size range.
The requirements for the packaging and transport of uranium product are designed tominimise the risk from that hazard. Uranium product is contained within sealed and lined205 litre drums. The drums are arranged within purpose built racks to prevent movement andare secured within standard freight containers that are locked using tamper evident devices.The transport containers are then conveyed on trucks to the Port of Darwin, from which theyare loaded on to a cargo vessel for export.
Each 205 litre drum is individually labelled in accordance with the IAEA TransportRegulations, as is each freight container. Each truck carrying uranium product carriesemergency equipment including a first aid kit, dust masks, and other items which wouldenable the driver to safely establish a cordon around any spilled material.
In addition, two emergency trailers and trained emergency response crews are on call foreach consignment of uranium product. The trailers contain equipment that would allow thecrew to safely collect any spilt uranium product.
If a transport accident occurred resulting in a spillage of uranium product, the dominatinghazard would be due to the inhalation of the product. The emergency procedures andequipment are designed to minimise the inhalation of product to trivial levels, however, it ispossible that non-trivial exposure could occur to a person who was incapacitated in thetransport accident. Assuming that a person without respiratory protection was exposed to airwith a moderately high dust loading of one milligram per cubic metre of uranium product, itwould take several hours for that person to inhale enough product to result in a committedeffective dose equal to the annual dose limit for members of the public. This is a veryunlikely scenario considering the response time of the emergency response crews. It shouldalso be noted that there has never been a transport accident involving the release of uraniumproduct during the life of the Ranger mine.
The hazard to the environment posed by uranium product is very low as it is an insolublepowder of low specific activity. Decontamination of an area that has been contaminated with

96
uranium product is a simple task. Depending on the volume of product spilt and the area overwhich the spill is spread, industrial vacuum cleaners, or standard earthmoving equipmentcould be used. Any remaining product could be readily identified using standard radiationdetection equipment allowing an effectively complete decontamination of the area whichwould preclude any possibility of environmental impact.
7.8 Summary of findings on general environmental protection issues
The conclusions of the Supervising Scientist on the above general environmental protectionissues are:
Protection of the environment in the Alligator Rivers Region
• The environmental protection regime that the Australian Government implemented forthe mining of uranium at Ranger has been completely consistent with the principles ofSustainable Development and it has been demonstrated, through an extensive chemical,biological and radiological monitoring program, that no impact of significance underthose principles has occurred, on either people or ecosystems of Kakadu National Park,throughout the operation of the Ranger mine.
• The same regulatory regime, but strengthened in some particular cases, would apply tothe mining of uranium at Jabiluka.
The Ranger and the Jabiluka milling alternatives
• The Mission report was critical of ERA for proposing to proceed with the Jabiluka MillAlternative (JMA) option ‘despite not being the preferred environmental option’. Thisreview, however, and the original assessment of the JMA proposal by EnvironmentAustralia have shown that, while the RMA option is preferred, the risk to theenvironment arising from the JMA option is minimal and, in particular, that the wetlandsof Kakadu National Park will not be threatened if the project proceeds.
Location and extent of the Jabiluka ore body
• The extent of the No 2 orebody at Jabiluka has not been fully delineated at depth in thatsection of the orebody to the east of the Hegge fault. If the Ranger Mill Alternative wereto proceed, the mining at Jabiluka would be restricted to the currently delineated orebodyand the period of mining would be about 30 years unless approval is given by theCommonwealth to mine any additional reserves following assessment under theEnvironment Protection (Impact of Proposals) Act 1974.
• If the Jabiluka Mill Alternative proceeds, there would be no need for further assessmentof a proposal to mine additional reserves under the Environment Protection (Impact ofProposals) Act 1974.
Landscape-wide analyses
• Wasson et al (1998) suggest that the landscape context of the mine proposal has beeninadequately addressed. The Jabiluka mine will be a point impact, with some specificpotential effects, which are addressed in the main body of this report and shown to benegligible. It is simply not true to suggest that the EIS and PER are inadequate becausethey have not considered potential impacts across the whole of Kakadu National Park.The assertion that the context modelling for the minesite need be broader than iscurrently the case is therefore rejected.

97
Acid sulphate soils
• The concerns of Wasson et al (1998) that heavy metals accidentally released from themine site could be mobilised into downstream ecosystems by the acid sulphate soils andthat the pumping of water from a billabong could lead to increased acidity in surfacewaters are not justified. Experience at the Ranger mine has shown that in every casewhere accidental releases have occurred, the total load of any metals released isextremely small compared to the natural load of metals in the soils of the floodplain. Theprevious proposal to re-establish the old Ja-Ja camp has been withdrawn and there are noplans to pump large quantities of water from the billabong.
Rehabilitation of the Jabiluka lease area
• ERA is required to rehabilitate the Jabiluka mine site in a manner which will establish anenvironment in the lease area that reflects, to the maximum extent that can reasonably beachieved, the environment existing in the adjacent areas of Kakadu National Park. Theintention is that the rehabilitated area could be incorporated into the Kakadu NationalPark without detracting from park values.
• The Government has established secure mechanisms to ensure that these rehabilitationobjectives will be achieved even if the company becomes insolvent and ceases operationsprior to the completion of adequate rehabilitation of the sites.
Transport of uranium from the Jabiluka mine
• The transport of uranium product from Jabiluka to the Port of Darwin through KakaduNational Park is governed by laws of the Northern Territory which include the total textof the International Atomic Energy Agency Regulations for the Safe Transport ofRadioactive Material.
• Two emergency trailers and trained emergency response crews are on call for eachconsignment of uranium product. The trailers contain equipment that would allow thecrew to safely collect any spilled uranium product. The hazards associated with spillageof uranium product have been carefully assessed and emergency procedures have beendeveloped to ensure that both people and ecosystems will be protected in the event of anaccident.
• There has never been a transport accident involving the release of uranium productduring the life of the Ranger mine.

98
8 Conclusions
This report has been prepared in response to the request of the World Heritage Committeethat the Supervising Scientist conduct a full review of scientific issues raised by theCommittee’s Mission to Kakadu National Park in October–November 1998. Perceivedscientific uncertainty with respect to these issues had led to the Mission’s conclusion that thenatural values of Kakadu are threatened by the Jabiluka project.
It must be emphasised that this report does not purport to be a complete environmentalimpact assessment of the Jabiluka project. There are many environmental protection issuesrelated to the development of Jabiluka that were not raised in the Mission’s report or in thedecision of the World Heritage Committee. These broader issues have already beenaddressed in the environmental impact assessment process to which the Jabiluka project wassubjected and are covered by the requirements that the Commonwealth Government imposedin granting its approval for the project to proceed.
This report includes a thorough review of all of the issues raised by the World HeritageCommittee and provides a detailed assessment of the risks to the wetlands of Kakadu arisingfrom the storage of uranium ore at the surface at Jabiluka, the management of water and thestorage of tailings.
Before summarising the reports conclusions, it is pertinent to a provide brief comment on theenvironmental impact assessment process in Australia. For a project of environmentalsignificance, any Commonwealth approvals may only be given following environmentalassessment under the Commonwealth’s Environment Protection (Impact of Proposals) Act1974, the EPIP Act. A similar process is also required under State or Territory legislationand, where both are required, these processes may be carried out jointly underCommonwealth and State or Territory law.
The intent of the EPIP Act, and its State/Territory counterparts, is to ensure that mattersaffecting the environment to a significant extent are fully examined and taken into account indecisions taken by the Commonwealth and State/Territory governments. The proponent mustdescribe the design of the project in sufficient detail that the likely environmental impactarising from the project can be adequately assessed. However, the detailed design of theproject may not have been completed prior to submission of the EIS. The detailed design ofthe project would normally be completed after approval has been given for the project toproceed under the EPIP Act process so that any environmental conditions can be includedwithin final design parameters. Recognition is given to the fact that each State and Territoryhas in place a regulatory regime under which detailed aspects of a project are assessed andspecific authorisations and approvals are granted.
In the case of uranium mining in the Alligator Rivers Region of the Northern Territory,specific authorisations and approvals are granted by the responsible Northern TerritoryMinister under the Uranium Mining (Environmental Control) Act 1979. Under the WorkingArrangements agreed between the Commonwealth and Northern Territory Governments, theSupervising Scientist reviews the environmental aspects of all detailed proposals that mightbe the subject of such authorisations and approvals and provides advice to the NorthernTerritory on the environmental consequences. It is through this process that the detaileddesign of the Jabiluka project would be assessed and approved.
Many of the issues that were raised by the report of the Mission of the World HeritageCommittee come into the category of detailed design. That is, many of the issues had beenidentified by the Supervising Scientist and others as being issues that would need to be

99
resolved by the proponent in consultation with officials of the Northern Territory and theSupervising Scientist at the detailed design stage but the conclusion had been reached thatthere were no insurmountable obstacles that would prevent a design being achieved thatwould ensure the highest level of environmental protection in Kakadu National Park.
This detailed review has demonstrated that there were a number of weaknesses in thehydrological modelling presented by ERA in the EIS and the PER. Accordingly, a number ofrecommendations have been made which should be implemented by ERA in completing thedetailed design of the Jabiluka project. On the other hand, the review has demonstrated quiteclearly that, if the design of the water management system proposed by ERA in the PER hadbeen implemented, the risk to the wetlands of Kakadu National Park, and the risk of radiationexposure to people of the region would have been extremely low. This conclusion is valideven in extreme circumstances leading to the complete failure of the structure of the waterretention pond at Jabiluka.
The lay reader will, no doubt, find this conclusion surprising. Its origin, however, lies in thefact that uranium is not a particularly toxic substance for aquatic animals. It has been wellestablished that the toxicity of uranium is much lower than that of many many more commonsubstances such as copper, cadmium and lead. It is the perception of the public that uraniumis a very dangerous substance, and the failure of the scientific community to persuade thepublic otherwise, that has led to adoption of extreme measures to ensure that no amount ofuranium should leave the site of a uranium mine.
Similarly, uranium in its natural state does not pose a particularly severe radiation threat.Exposure to uranium and its radioactive progeny needs to be controlled but the inherentradioactivity of uranium and its progeny is sufficiently low that ensuring that people do notreceive exposures that would be harmful is relatively straightforward. It is only whenuranium is used as fuel in a reactor that fission reactions result in a large number ofradioactive products which produce high levels of ionising radiation.
Thus, on scientific grounds, there is no reason why water collected at Jabiluka could not bedischarged into the surface waters of the Magela floodplain under a suitably designed controlregime that would protect both people and ecosystems. The proposal by ERA that thesewaters should be totally contained at the mine site was made in response to social concernsand perceptions, not scientific evidence.
The long-term threats to the wetlands of Kakadu arising from the storage of uranium milltailings at Jabiluka have also been assessed. Because the tailings will be stored at asignificant depth below the surface of the land, physical dispersion of the tailings will not bepossible for millions of years. The whole land mass would need to be eroded away and bythat time the wetlands of Kakadu would no longer exist. Even then, the threat to futuregenerations is insignificant because the residual uranium and its radioactive progeny wouldbe present at low concentrations and would be mixed, when dispersed, with the inert materialsurrounding the current orebody. Dispersion of radionuclides and other constituents of thetailings in groundwater has been shown to present no threat to the wetlands of Kakadu or thepeople who live there in either the short-term or the long-term.
The conclusion of this review, therefore, is that, contrary to the views expressed by theMission, the natural values of Kakadu National Park are not threatened by the developmentof the Jabiluka uranium mine and the degree of scientific certainty that applies to thisassessment is very high. There would appear, therefore, to be no justification for a decisionby the World Heritage Committee that the natural World Heritage values of Kakadu NationalPark are in danger as a result of the proposal to mine uranium at Jabiluka.

100
References
AGC-Woodward Clyde 1993. Letter Report to ERA prepared by J Hall. 15 Jan 1993.
Beard LR 1960. Probability estimates based on small normal-distribution samples. Journal ofGeophysical Research, Volume 65, No 7.
Brundtland, Gro Harlem 1990. Our common future. Oxford University Press, Melbourne.
Bywater JF, Banaczkowski R & Bailey M 1991. Sensitivity to uranium of six species oftropical freshwater fishes and four species of cladocerans from northern Australia.Environmental Toxicology and Chemistry, 10, 1449–1458.
Bureau of Meteorology 1994. The estimation of Probable Maximum Precipitation inAustralia: Generalised short-duration method, Bulletin 53, December 1994. AGPS.Canberra. (Amended December 1996).
Bureau of Meteorology 1999. Hydrometeorological analysis relevant to Jabiluka.Supervising Scientist Report 140, Supervising Scientist for the Alligator Rivers Region,AGPS Canberra, (in press).
Carter MW 1990. A rainfall- based mechanism to regulate the release of water from Rangeruranium mine. Technical memorandum 30, Supervising Scientist for the Alligator RiversRegion, AGPS, Canberra.
Chiew F & Wang QJ 1999. Hydrological anaylsis relevant to surface water storage atJabiluka, Supervising Scientist Report 142, Supervising Scientist for the Alligator RiversRegion, AGPS Canberra, (in press).
Cincilla WA, Landriault DA & Verburg RBM 1997. Application of paste technology tosurface disposal of mineral wastes. In Proceeedings of the Fourth InternationalConference on Tailings and Mine Waste, Fort Collins, Colorado, January 13–16, 1997.Balkema, Rotterdam, 343–356.
CRC 1995. Handbook of Chemistry and Physics, 76th Edition, CRC Press.
CSIRO 1998. Climate change under enhanced greenhouse conditions in northern Australia.Final Report 1994–1997. CSIRO Division of Atmospheric Research, UnpublishedReport.
Cull RF, Hancock G, Johnston A, Martin P, Martin R, Murray AS, Pfitzner J, Warner RF &Wasson RJ 1992. Past, present and future sedimentation on the Magela plain and in itscatchment. In Modern sedimentation and late Quaternary evolution of the Magela plain,ed RJ Wasson, Supervising Scientist for the Alligator Rivers Region Research Report 6,226–268.
Cullen MJP 1993. The unified forecast/climate model. Meteorological Magazine 122, 81–94.
Deutscher RL, Mann AW & Giblin A 1980. Groundwater geochemistry in the vicinity of theJabiluka Deposits. Proc of Int. Uranium Symposium on the Pine Creek Geosyncline.
DKRZ-Model User Support Group (eds) 1992. ECHAM3 — Atmospheric GeneralCirculation Model. Report No. 6, Deutsches Klimarechenzentrum, Hamburg.http://www.dkrz.de/forschung/reports/ReportNo.6.ps.
East TJ, Noller B & I Willett 1992. Soil materials and their formation on the Magela Plain. InModern sedimentation and late quaternary evolution of the Magela Creek Plain, ed
101
RJ Wasson. Research report 6, Supervising Scientist for the Alligator Rivers Region,AGPS, Canberra.
ERA 1996. The Jabiluka Project, Draft Environmental Impact Statement, Energy Resourcesof Australia Limited.
ERA 1998. The Jabiluka Mill Alternative Public Environment Report, Energy Resources ofAustralia Limited.
Energy Resources Australia Environmental Services - ERAES 1998. Jabiluka Project – SixMonthly Progress Report – The Minister for Resources and Energy – AdditionalEnvironmental Studies.
Flato GM, Boer GJ, Lee WG, McFarlane NA, Ramsden D, Reader MC & Weaver AJ(submitted). The Canadian Centre for Climate Modelling and Analysis Global CoupledModel and its Climate, submitted to Climate Dynamics.
Golder Associates 1997. Laboratory evaluation of Jabiluka tailings for suitability as a pastefill. Report 961-9115 for North Ltd.
Gordon HB & O’Farrell SP 1997. Transient climate change in the CSIRO coupled modelwith dynamic sea ice. Monthly Weather Review 125, 875–907.
Hatton T 1997. Review of evaporation estimates – Ranger Mine, Consultancy Report toEnergy Resources of Australia Limited, Unpublished Report.
Holdway DA, Allison HE, Mannion MMD, Wiecek MM & Templeman MA 1988a.Development of toxicity tests. Alligator Rivers Region Research Institute AnnualResearch Summary 1987–88. AGPS, Canberra.
Holdway DA, Allison HE, Wiecek MM 1998b. Toxocity of uranium. Alligator Rivers RegionResearch Institute Annual Research Summary 1987–88. AGPS, Canberra
Holdway DA 1992. Uranium toxicity to two species of Australian tropical fish. The Scienceof the Total Environment 125, 137–158.
ICRP 1996. Age dependent doses to members of the public from intake of radionuclides: Part 5Compilation of ingestion and inhalation dose coefficients. ICRP Publication 72.Pergamon Press, Oxford.
Institution of Engineers, Australia 1987. ‘Australian rainfall and runoff – A Guide to floodestimation’. Volume 1. IEAust. Canberra.
IPCC 1996. Technical Summary. In Climate Change 1995: The Science of Climate Change,eds JT Houghton, LG Meira Filho, BA Callander, N Harris, A Kattenberg & K Maskell.Contribution of Working Group I to the Second Assessment Report of theIntergovernmental Panel on Climate Change, Cambridge University Press, Cambridgeand New York, 9–49.
Johnston A 1989. An assessment of the potential for radiation induced biological effects onaquatic animals in the Alligator Rivers Region. Internal report 15, Supervising Scientistfor the Alligator Rivers Region, Canberra. Unpublished paper.
Johnston A 1990. Examples of dose assessment: Australia. In The environmental behaviourof radium, Vol. 2. Technical Reports Series No. 310, IAEA, Vienna.

102
Johnston A 1991. Water management in the Alligator Rivers Region: A research view. InProceedings of the 29th Congress of the Australian Society of Limnology, Jabiru NT1990, Supervising Scientist for the Alligator Rivers Region. AGPS, Canberra, 10–34.
Johnston A & Needham S 1999. Protection of the environment near the Ranger uraniummine, Supervising Scientist Report 139, Supervising Scientist for the Alligator RiversRegion, AGPS Canberra, (in press).
Johnston A, Murray A & Martin P 1997. Radiological standards for the discharge of waterfrom uranium mines in the Alligator Rivers Region. Internal report 233, SupervisingScientist, Canberra. Unpublished paper.
Jones RN, Hennessy KJ & Abbs DJ 1999. Climate change analysis relevant to Jabiluka.Supervising Scientist Report 141, Supervising Scientist for the Alligator Rivers Region,AGPS Canberra, (in press).
Kalf F & Dudgeon C 1999. Analysis of long term groundwater dispersal of contaminantsfrom proposed Jabiluka mine tailings repositories. Supervising Scientist Report 143,Supervising Scientist for the Alligator Rivers Region, AGPS Canberra, (in press).
Kaye GWC & Laby TH 1978. Tables of physical and chemical constants, 14th Edition,Longman.
leGras C & Klessa D 1997. An estimate of temporal solute flux in the catchment of RangerRetention Pond 1. Internal report 267, Supervising Scientist, Canberra. Unpublishedpaper.
Lewis B 1992. The assessment of seven Northern Territory gastropod species for use asbiological monitors of Ranger Uranium Mine retention pond waters. Open file record100, Supervising Scientist for the Alligator Rivers Region, Canberra. Unpublished paper.
McGregor JL & Katzfey JJ 1998. Climate modelling for the Australian region usingDARLAM, Proc. Int. Workshop on General Monsoon System, Beijing, Oct. 20–22, 1997.
Martin P, Hancock GJ, Johnston A & Murray AS 1998. Natural-series radionuclides intraditional north Australian Aboriginal foods, J. Environmental Radioactivity Vol 40 No1, 37 – 58.
Milnes AR, Hall J, Jackson A & Shirvington PJ 1998. Jabiluka Mill Alternative. Synopsis ofKey Issues and Processes. Report prepared for Minister for Environment, inEnvironmental Assessment report and related documents – The Jabiluka Mill Alternativeat the Jabiluka No2 Uranium Mine, Environment Australia October 1998.
Mittag HJ & Rinne H 1993. Statistical methods of quality assurance. Chapman and Hall,London.
Nott J 1996. Future Climate Change. Can we expect larger floods? Search 27, 5:154–157
Pilgrim DH (Ed) 1987. Australian Rainfall and Runoff – A guide to flood estimation. Vol 1.The Institution of Engineers, Australia.
Richards BG, Peter P & Fordham AW 1990. Field characterisation of Ranger No. 1 tailingsin the tailings dam based on specially designed piezometer installations. CSIROMinesite Rehabilitation Research Group, Division of Soils and Division of WaterResources: 1–3.
U.S. Environmental Protection Agency 1998. Guidelines for ecological risk assessment.EPA/630/R-95/002F. Risk Assessment Forum, Washington, DC.
103
van Leeuwen CJ & Hermens JLM 1995. Risk Assessment of Chemicals: An Introduction,Kluwer Academic Publishers, Dordrecht, Netherlands, 1-17.
Vardavas IM 1987. Modelling the seasonal variation of net all-wave radiation flux in atropical wet-dry region. Ecological Modelling 39, 247−268.
Vardavas IM 1992. Annual rainfall statistics for stations in the Top End of Australia: Normaland log-normal distribution analysis. Technical memorandum 27, Supervising Scientistfor the Alligator Rivers Region, AGPS, Canberra.
Waite JD, Dudgeon C & Fell R 1998. Review of Jabiluka Mine Alternative TailingsManagement Proposal. Unisearch Report. No 35051. August 1998, in EnvironmentalAssessment report and related documents – The Jabiluka Mill Alternative at the JabilukaNo2 Uranium Mine, Environment Australia, October 1998.
Wang QJ & Nathan RJ 1999. A daily and monthly mixed (DMM) algorithm for stochasticsimulation of rainfall data. Paper to be submitted to Water Resources Research.
Wasson RJ, White I, Mackey B & Fleming M 1998. Environmental issues that threatenKakadu National Park, Submission to UNESCO World Heritage Committee Delegationto Australia, Unpublished Report.
Water Division 1982. Uranium Province Hydrology, Volume 12. Department of Transportand Works, Northern Territory of Australia. Unpublished report.
Williams MAJ 1973. The efficacy of creep and slopewash in tropical and temperateAustralia. Australian Geographical Studies 11, 62–78.
Williams MAJ 1976. Erosion in the Alligator Rivers area. CSIRO (Australia) Land ResearchSeries 38, 112–125.
Wilson BA, Brocklehurst PS, Clark M & Dickenson KM 1990a. Vegetation survey of theNorthern Territory, Australia Technical Report No. 4. Explanatory notes to accompany1:1000000 Map sheets. Conservation Commission of the Northern Territory. NTGovernment Printing Office.
Wilson BA, Brocklehurst PS, Clark M & Dickenson KM 1990a. Vegetation survey of theNorthern Territory. Conservation Commission of the Northern Territory. TechnicalReport No. 49. NT Government Printing Office.

104
Attachments to this report
Attachment A
Johnston A & Needham S 1999. Protection of the environment near the Ranger uraniummine, Supervising Scientist Report 139, Supervising Scientist for the Alligator RiversRegion, AGPS Canberra, (in press).
Attachment B
Bureau of Meteorology 1999. Hydrometeorological analysis relevant to Jabiluka.Supervising Scientist Report 140, Supervising Scientist for the Alligator Rivers Region,AGPS Canberra, (in press).
Attachment C
Jones RN, Hennessy KJ & Abbs DJ 1999. Climate change analysis relevant to Jabiluka.Supervising Scientist Report 141, Supervising Scientist for the Alligator Rivers Region,AGPS Canberra, (in press).
Attachment D
Chiew F & Wang QJ 1999. Hydrological analysis relevant to surface water storage atJabiluka, Supervising Scientist Report 142, Supervising Scientist for the Alligator RiversRegion, AGPS Canberra, (in press).
Attachment E
Kalf F & Dudgeon C 1999. Analysis of long term groundwater dispersal of contaminantsfrom proposed Jabiluka mine tailings repositories. Supervising Scientist Report 143,Supervising Scientist for the Alligator Rivers Region, AGPS Canberra, (in press).

105
Appendix 1
World Heritage CommitteeTwenty-second session
Kyoto, Japan30 November – 5 December 1998
Decision on Kakadu National Park
The Committee recognised the report of the mission to Kakadu National Park as being boththorough and credible. The Committee:
(i) Expressed grave concern at the ascertained and potential dangers to the WorldHeritage cultural and natural values of Kakadu National Park which, as noted in theMission report, are posed primarily by the proposal for uranium mining and millingat Jabiluka;
(ii) Noted with concern that in spite of the dangers to the World Heritage values,construction of the mine at Jabiluka began in June 1998 and is currently progressing;
(iii) Has been informed by the Australian authorities that construction of the mine declineand site will proceed; however, in the next six months no mining of uranium will takeplace, the construction of the mill will not commence and an export permit for theJabiluka uranium will not be issued. The Committee has also been informed that theAustralian authorities will act to complete the cultural heritage management planwith independent public review and they will accelerate the implementation of theKakadu Region Social Impact Study;
(iv) Noted that there is significant difference of opinion concerning the degree ofcertainty of the science used to assess the impact of the mine of the World Heritagevalues of Kakadu (notably hydrological modelling, prediction and impact of severeweather events, storage of uranium ore on the surface and the long-term storage ofthe mine tailings);
(v) Noted that the associative cultural values, and the archaeological and rock art sites,on the basis of which Kakadu National Park was inscribed on the World HeritageList, and the ability of affected Aboriginal communities to continue their traditionalrelationships to the land, are threatened by the Jabiluka mine proposal; and
(vi) Emphasized the fundamental importance of ensuring thorough and continuingparticipation, negotiation and communication with Aboriginal traditional owners,custodians and managers in the conservation of the outstanding heritage values ofKakadu for future generations.
In view of the ascertained and potential dangers posed by the Jabiluka uranium mine that arenoted in the report of the World Heritage mission to Kakadu, and have again been noted withconcern by the Committee, IUCN, ICCROM and ICOMOS, the Committee decided thefollowing:
1 In light of the concerns expressed by the Delegate of Australia, the Australianauthorities be requested to provide, by 15 April 1999, a detailed report on theirefforts to prevent further damage and to mitigate all the threats identified in the

106
World Heritage mission, report to the World Heritage cultural and natural values ofKakadu National Park, Australia. The report should address these threats posed bythe construction of the Jabiluka mine, by the mining of uranium ore at Jabiluka, andthe alternatives for milling the ore at Jabiluka and Ranger. The report should beprepared in accordance with the intent of (v) above. The report submitted by theAustralian authorities should include a detailed update on the implementation of thecultural heritage management plan referred to in (iii) above and in the mission report.
2 Immediately up its receipt by the Secretariat, the report referred to in paragraph 1above, be provided to ICOMOS, ICCROM and IUCN, who will ensure that thetwenty-third session of the Bureau of the World Heritage Committee, be providedwith written independent expert review concerning the mitigation of threats posingascertained and potential dangers to Kakadu National Park by the Jabiluka mine. Theexpert opinion of ICOMOS, ICCROM and IUCN will be provided to the Secretariatby 15 May 1999 for immediate distribution to members of the Bureau and theAustralian authorities.
3 The Australian authorities be requested to direct the Australian Supervising ScientistGroup to conduct a full review of the scientific issues referred to in Paragraph (iv)above, to be provided to the Secretariat by 15 April 1999. The review will besubmitted to peer review by an independent scientific panel composed of scientistsselected by UNESCO in consultation with the International Council of ScientificUnions and the Chairperson of the World Heritage Committee. The report of the peerreview will be provided to the Secretariat by 15 May 1999 for immediate distributionto the members of the Bureau, IUCN and the Australian authorities.
4 The reports referred to in Recommendations 1, 2 and 3 will be examined by thetwenty-third session of the Bureau.
5 The twenty-second session of the Committee has decided that an extraordinarysession of the Committee, to immediately follow the twenty-third session of theBureau in July 1999, will be convened at UNESCO Headquarters to decide whetherto immediately inscribe Kakadu National Park on the List of World Heritage inDanger.


